
Abstract
A pronounced temporal mismatch was observed between the responses of relative cerebral blood volume (rCBV) measured by magnetic resonance imaging and relative cerebral blood flow measured by laser—Doppler flowmetry in rat somatosensory cortex after electrical forepaw stimulation, The increase of relative cerebral blood flow after stimulus onset and decrease after stimulus cessation were accurately described with a single exponential time constant of 2.4 ± 0.8 seconds. In contrast, rCBV exhibited two distinct and nearly sequential processes after both onset and cessation of stimulation. A rapid change of rCBV (1.5 ± 0.8 seconds) occurring immediately after onset and cessation was not statistically different from the time constant for relative cerebral blood flow. However, a slow phase of increase (onset) and decrease (cessation) with an exponential time constant of 14 ± 13 seconds began approximately 8 seconds after the rapid phase of CBV change. A modified windkessel model was developed to describe the temporal evolution of rCBV as a rapid elastic response of capillaries and veins followed by slow venous relaxation of stress. Venous delayed compliance was suggested as the mechanism for the poststimulus undershoot in blood oxygen-sensitive magnetic resonance imaging signal that has been observed in this animal model and in human data.
The temporal relationship between functional changes in CBF and cerebral blood volume (CBV), an elemental aspect of cerebrovascular physiology, is poorly understood. Within the context of functional magnetic resonance imaging (fMRI), it is important to clarify this vascular physiology for several reasons. Cerebral blood volume-weighted MRI significantly improves sensitivity relative to endogenous contrast (Mandeville et al., 1998), but the magnitude and temporal relationship between change in CBV and local brain function is unclear. Moreover, changes in blood oxygenation level-dependent (BOLD) signal (Ogawa et al., 1990, 1992; Kwong et al., 1992), the image contrast most commonly used in human fMRI studies, result from relative changes in CBF, CBV, and CMRO2 (Ogawa et al., 1993). An increase in CBF within an image voxel will decrease the voxel concentration of deoxygenated hemoglobin, an endogenous MRI contrast agent, and thus increase BOLD signal. Conversely, increases in CBV or CMRO2 have a negative effect on BOLD signal. The multiphasic nature of BOLD response, including an “initial dip” (Frostig et al., 1990; Ernst and Hennig, 1994; Menon et al., 1995; Malonek and Grinvald, 1996) followed by a robust increase and a poststimulus undershoot (Kwong et al., 1992; Frahm et al., 1993), is presumed to arise from temporal mismatches between underlying hemodynamic and metabolic processes.
A new class of MRI contrast agents that exhibit very long blood half-lives has enabled measurements of the temporal evolution of CBV during focal brain activation in animal models. During electrical stimulation of rat forepaw, we found that focal CBV response in somatosensory cortex was significantly delayed with respect to the positive BOLD response after both onset and cessation of stimulation, and the delay of CBV after stimulus cessation was temporally consistent with the BOLD poststimulus undershoot (Mandeville et al., 1998). In a 30-second stimulation paradigm, the rise of CBV after stimulus onset and decay of CBV after stimulus cessation was described by an exponential time constant of 17 seconds, which is much longer than time constants reported for CBF in sensory stimulation paradigms (Lindauer et al., 1993; Irikura et al., 1994; Ma et al., 1996).
A “balloon model” has recently been proposed (Buxton et al., 1998) to describe the temporal dynamics of changes in CBV and BOLD signal. This model applies conservation of mass to relate changes in volume (V) in a compliant compartment to the difference between flows into (FIN) and out of (FOUT) this compartment, FIN – FOUT = dV/dt. Although this formulation certainly demonstrates that a temporal mismatch between flow and volume can occur in principle, the physiology of the flow-volume relationship is unspecified by this model and poorly constrained by available data.
In this study, we compared high temporal resolution measurements of relative cerebral blood flow (rCBF), measured with laser—Doppler flowmetry (LDF), and relative cerebral blood volume (rCBV), measured with fMRI after injection of an iron oxide contrast agent with a long blood half-life. We formulated a conventional resistive model of brain vasculature by adapting windkessel theory (Frank, 1899) to describe capillary and venous compliance. This windkessel model extends the physics description of the balloon model to describe the underlying physiology that reproduces our data, including a temporal mismatch between the responses of CBF and CBV during sensory stimulation of sufficient duration.
METHODS
Electrical stimulation of rat forepaw
Male Harlan Sprague-Dawley rats (weight, 275 ± 39 g) were anesthetized with 1.5% halothane in oxygen for surgery; a tracheostomy was performed, cannulas were inserted in the femoral artery and vein, and two thin copper wires were inserted just underneath the skin on opposite sides of each forepaw. After surgery, rats were mechanically ventilated with 0.7% halothane in a mixture of air and oxygen using a 3-mL tidal volume, a rate of 40 breaths per minute, and an inspiration to expiration ratio of 1:1. Rats were then paralyzed with a 2-mg/kg bolus of pancuronium followed by continuous intravenous infusion at 2 mg·kg−1·h−1, halothane was discontinued, and anesthesia was maintained with 50 mg/kg intravenous bolus of α-chloralose followed by continuous intravenous infusion at 40 mg·kg−1·h−1. Ventilation parameters were adjusted to maintain Paco2 between 35 and 45 mm Hg, Pao2 between 140 and 180 mm Hg, and pH between 7.35 and 7.45. Two heating blankets (Gaymar, Orchid Park, NY, U.S.A.) circulated warm water around the rat torso to maintain core temperature at 37° to 38°C.
Stimulation experiments were delayed by at least 1 hour to allow the anesthetic transition. Two stimulation paradigms were used. The first paradigm consisted of 6 seconds of forepaw stimulation followed by 54 seconds of rest, and this epoch was typically repeated 25 times for each forepaw of each rat. The second paradigm used 30 seconds of stimulation followed by 150 seconds of rest and was repeated 10 times for each forepaw. During stimulation, electrical pulses of 5 V were applied for 0.3 ms at 3 Hz with a constant voltage stimulator (model SD9, Grass, Quincy, MA, U.S.A.). Blood pressure changes during electrostimulation were typically 5 mm Hg.
All MRI studies were performed at a field strength of 2 T (SISCO spectrometer, Varian Spectroscopic Instruments, Palo Alto, CA, U.S.A.) and used single-slice gradient echo planar imaging with a repetition time of 350 ms, an echo time of typically 25 ms, and a spatial resolution of 0.6 mm3. To obtain an MRI signal that was highly weighted by CBV, a monocrystalline iron oxide nanocolloid (MION) was injected at an iron dose of 13 mg/kg. The MION was synthesized using previously described techniques (Shen et al., 1993; Mandeville et al., 1997), and its biodistribution (Schaffer et al., 1993) and physicochemical properties (Shen et al., 1993; Jung et al., 1996) have been reported. The blood half-life of MION is about 4 hours in rats as determined by a radioactive label (Jung et al., 1996). When unlabeled MION is injected at a dose of 10 mg Fe/kg, brain transverse relaxation rate shows no detectable change for 3 hours after equilibration in the blood (Mandeville et al., 1997).
For measurement of rCBF using laser—Doppler flowmetry, two probes were placed on the dura in somatosensory cortices at positions 0.3 mm posterior of bregma and 4.0 mm lateral to the midline; these positions were determined from the MRI analysis as the centroids of functional activation for each forepaw. Portions of skull were removed, and probes were placed on dura in pools of mineral oil. Care was taken not to indent the cortical surface to minimize vascular compression. Otherwise, protocols for surgery, anesthesia, and stimulation were identical with those used in MRI studies. A sampling rate of 200 ms and a bandwidth of 12 kHz were used in these studies, and the LDF spectrometer (PeriMed Periflux PF2B, Sweden) included a linearization algorithm to reduce laser—Doppler measurement error caused by changes in blood volume, an important feature for our studies.
Data analysis
To select the MRI volume of brain activation for each experiment, the time series for every image pixel was first subjected to a Student's (–test to determine the statistical significance that signal change occurred between resting and stimulated states. A contiguous volume of 4.4 ± 0.8 mm3 was selected to include voxels that appeared to represent the core of activation as defined by a uniform and highly significant contrast to noise ratio. Within this volume, signal changes were averaged and converted to rCBV as previously described (Mandeville et al., 1998). Briefly, rCBV was determined using a linear relationship between local blood volume after MION injection and the change in relaxation rate (ΔR2*) of MRI signal (S), ΔR2* = –In(S(t)/SPRE)/TE, where SPRE is the signal intensity before injection of contrast agent, and TE is the echo time of the MRI signal. The fractional change in CBV as a function of time (t) is then

This technique has produced magnitude results during hypercapnia that compare well with similar measurements using positron emission tomography (PET) or x-ray computed tomography after bolus injection of iodine (Mandeville et al., 1998; Payen et al., 1998; Zaharchuk et al., 1998).
Relative CBF was determined from LDF signal in the standard way. A small offset in LDF signal corresponding to zero perfusion was determined at the end of each experiment after the animal was sacrificed. The fractional change in CBF relative to the unstimulated condition was then calculated for each forepaw stimulation time series from the laser—Doppler signal (S).

To quantify time constants for rise and decay of rCBF and rCBV after onset and cessation of stimulation, exponential functions were fit to average temporal responses. Relative CBF was found to closely follow a simple model of exponential rise and decay; time constants for rise and fall were determined for each animal to generate means and standard deviations. Model functions used to describe rCBV required additional complexity to match the data. A 30-second stimulus was found to elicit a rapid increase of rCBV followed by a slow and delayed second component of rise that required an additional time constant. This pattern was also observed on decay of rCBV after stimulus cessation. Therefore, four time constants and two delays were in principle required to model this data. However, a good fit to the data was obtained after reducing the number of degrees of freedom in the fit by using only two time constants: a short time constant fit the fast immediate response of rCBV after both onset and cessation of stimulation, and a second longer time constant fit the slow and delayed phase of rCBV during rise and fall. The 6-second stimulation was not long enough to elicit the slow phase of rCBV increase that was apparent in the longer stimulation. For these data, rCBV was fit to a model function that used one exponential time constant for the rapid response during rise and fall and a second longer time constant to fit a small delayed component of rCBV decay after stimulus cessation.
Windkessel model for rCBV
In addition to the descriptive analysis of time constants, a physiologic model was developed to provide a mechanism for the observed temporal mismatch between rCBF and rCBV. Although rCBF is largely determined by vasomotor control of arterioles, which produce about 70% of cerebral vascular resistance (Mellander and Johansson, 1968), 80% to 85% of CBV is contained in capillaries and veins (Tomita et al., 1983; Mchedlishvili, 1986). Only 3% to 5% of total CBV is thought to reside within arterioles (Mchedlishvili, 1986), the primary resistance vessels. In principle, therefore, the kinetics of rCBF and rCBV may differ. We modeled capillary and venous compliance using a windkessel to passively respond to pressure modulated by arteriole dilation and contraction.
The windkessel, which was a leather bag attached to the end of a fire hose to smooth pulsatile ejection of water, was first introduced as a mathematical model by Otto Frank in 1899 to describe arterial blood pressure variations during the cardiac cycle in terms of arterial compliance (Frank, 1899; an English language translation of much of Frank's paper was provided in a review article by Cope, 1965). Mass conservation determines the relationship between flow (F) and volume (V) in a compliant compartment

where τ is the transit time for a volume element and the second term is the rate of volume change. At steady state, where dV/dt = 0, this is defined as the central volume principle (Stewart, 1894). For flow in a cylindrical vessel with a noncompressible fluid, the two terms on the right side of Eq. 3 are the flow components, which are longitudinal (V/τ) and transverse (dV/dt) to the axis of the vessel. Alternatively, F and V/τ may represent flow into (FIN) and out of (FOUT) an arbitrary compartment (e.g., an MRI image voxel); Eq. 3 is then conservation of mass as described by the balloon model (Buxton et al., 1998), FIN – FOUT = dV/dt. This macroscopic viewpoint is illustrated in Fig. 1A. For a nearly incompressible medium such as the brain, extravascular volume is displaced at a flow rate (FEV) equal to dV/dt.
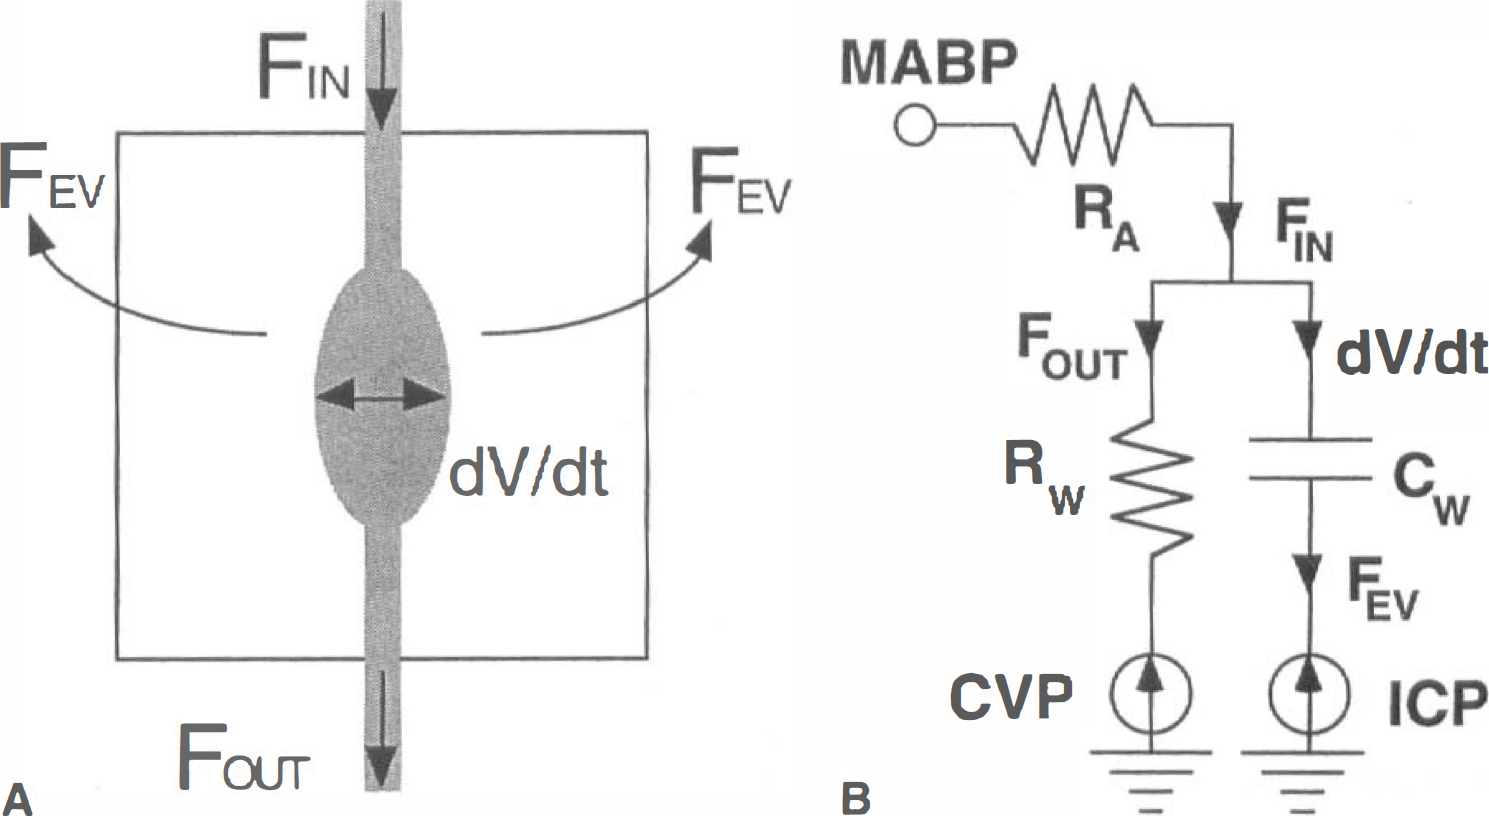
(A) A brain image voxel can be modeled as a blood-filled balloon in a box filled with incompressible fluid. As in the balloon model (Buxton et al., 1998), conservation of mass requires that blood volume changes, dV/dt, result from the difference of flows into and out of the voxel. Displacement of extravascular fluid occurs at the rate of FEV = dV/dt.
The physiology of the dynamic relationship between CBF and CBV is determined by the evolution of the transit time, τ. In a steady-state condition, the transit time through any compartment can be simply reformulated in terms of the resistance (R) and the pressure drop (P = FR) across that compartment, τ = V/F = V R/P. In terms of capacitance (C = V/P), τ = RC. Therefore, the problem of describing the temporal evolution of the mean transit time can be reformulated into descriptions of the temporal evolutions of resistance and capacitance. A windkessel is a mechanical equivalent of an electrical resistor and capacitor in parallel, as realized by Frank and others, because current conservation at the junction of this parallel pair produces Eq. 3 with a time constant τ = RC.
Figure 1B shows an electrical model of brain vasculature that ignores the small arteriole component of blood volume and describes resistance and compliance downstream of arterioles with a windkessel. No net charge (the analogy of blood volume) accumulates on a capacitor (i.e., equal but opposite charges accumulate on each plate), much as no net volume accumulates in an image voxel when blood displaces extravascular volume, as depicted in Fig. 1A. A fixed drop in pressure occurs from MABP upstream of arterioles to central venous pressure downstream of venules. Extravascular volume is displaced against intracranial pressure. Because intracranial pressure and central venous pressure in the large veins of the head are approximately equal, these pressure terms can be ignored, and the circuit can be solved for a drop in pressure (P) equal to MABP minus central venous pressure.
In this model, we applied an explicit time dependence to arteriole resistance (RA) to represent the unspecified mechanism that couples flow to local brain function, whereas windkessel resistance (Rw) and capacitance (Cw) varied passively in response to pressure variations induced by arteriole vasomotor control. Windkessel resistance was defined to be an inverse power of rCBV, which was defined to increase as a power law of pressure (Pw) across the windkessel.
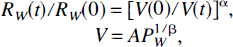
The pressure—volume relationship in Eq. 4 was selected as a convenient parameterization of the endpoints of the pressure—volume trajectory that also contains the origin. In these expressions, α = 2 represents laminar flow, A is a constant, and β is greater than unity to represent diminished volume reserve at high pressures. Capacitance is defined as the ratio of volume to pressure, Cw = V/Pw = A Pw1/β–1. Compliance can be defined separately from capacitance as the pressure derivative of volume, dCw/dPw = Cw/β; a rigid tube with large β can have a large capacitance with nearly zero compliance.
It is instructive to note the limiting behavior for steady-state changes in flow and volume using the definitions of Eq. 4. The ratio of flows between times 0 and infinity depends on the ratio of volumes between these time points, a formulation derived by setting the pressure drop across the windkessel resistor (P = FRw) equal to the pressure drop across the windkessel capacitor (P = V/Cw) at times 0 and infinity, and then dividing the two equations.
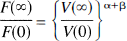
Laminar flow through a compliant, passively reacting compartment produces an exponent larger than 2 in this relationship.
Initial conditions for the circuit of Fig. 1 were defined according to literature values. Ignoring small resistances associated with large arteries and veins, total vascular resistance is roughly 65% in arterioles (Guyton, 1991). For simplicity, units were chosen such that the total pressure drop (P) and the sum of resistances at time t = 0 were unity (RA = 0.65, Rw = 0.35). By applying Kirchoff's Second Law around the circuit, F(0) = 1. According to the central volume principle, V(0) = F(0)τ(0), where the transit time through rat brain is roughly 1.4 seconds (Shockley and LaManna, 1988). Capacitance was fixed from Kirchoff's Second Law around each compartment, Cw(0) = V(0)/[F(0)Rw(0)], and A = V(0)/[F(0)Rw(0)]−1/β.
With these definitions and initial conditions, the general differential equations resulting from Kirchoff's laws were solved numerically after modulation of arterial resistance.
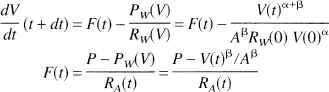
Because the relationship between pressure and volume (Eq. 4) did not include an explicit time dependence, Eq. 6 describes the temporal evolution of a downstream elastic response to arteriole vasomotor control. Because postarteriole pressure modulation closely follows flow, viscoelastic effects (as described below) were included in model calculations only when it was observed that blood volume changes were not temporally matched to changes in blood flow.
Stress relaxation in the windkessel model
Smooth muscle, which surrounds veins but not capillaries, is a viscoelastic material that exhibits stress relaxation. In large excised veins, a step increase in pressure produces a rapid elastic expansion followed by a slow further increase in volume over a period of minutes (Porciuncula et al., 1964). This physiology is presumably operative in vivo: capillaries and veins expand in response to the rapid postarteriole pressure rise after arteriole dilation, and then circumferential relaxation of venous stress increases venous compliance and therefore also increases venous blood volume. Circumferential stress relaxation in veins, often referred to as “delayed compliance,” can be modeled by including an explicit time dependence in the pressure-volume relationship of Eq. 4. The important point is that the well-established ex vivo physiology of stress relaxation provides a physiologic mechanism consistent with the observation of a second time constant for rCBV: slow and delayed changes in venous blood volume result from slow and delayed changes in venous compliance, which occur in response to stress introduced by increased venous pressure associated with arteriole vasodilation.
Ideally, a model describing this phenomena would explicitly separate veins, which have viscoelastic smooth muscle, from capillaries, where variations in total surface area affect oxygen extraction. An alternative circuit to Fig. 1 is presented in the appendix, which models capillaries and veins as serial windkessels. The initial conditions and equations to solve the circuit, which are also presented in the appendix, are simple generalizations of those previously presented for the single windkessel. Venous delayed compliance was incorporated in this model by applying an explicit time dependence to venous capacitance to match the data, as shown in the results.
RESULTS
Measurement of rCBF and rCBV
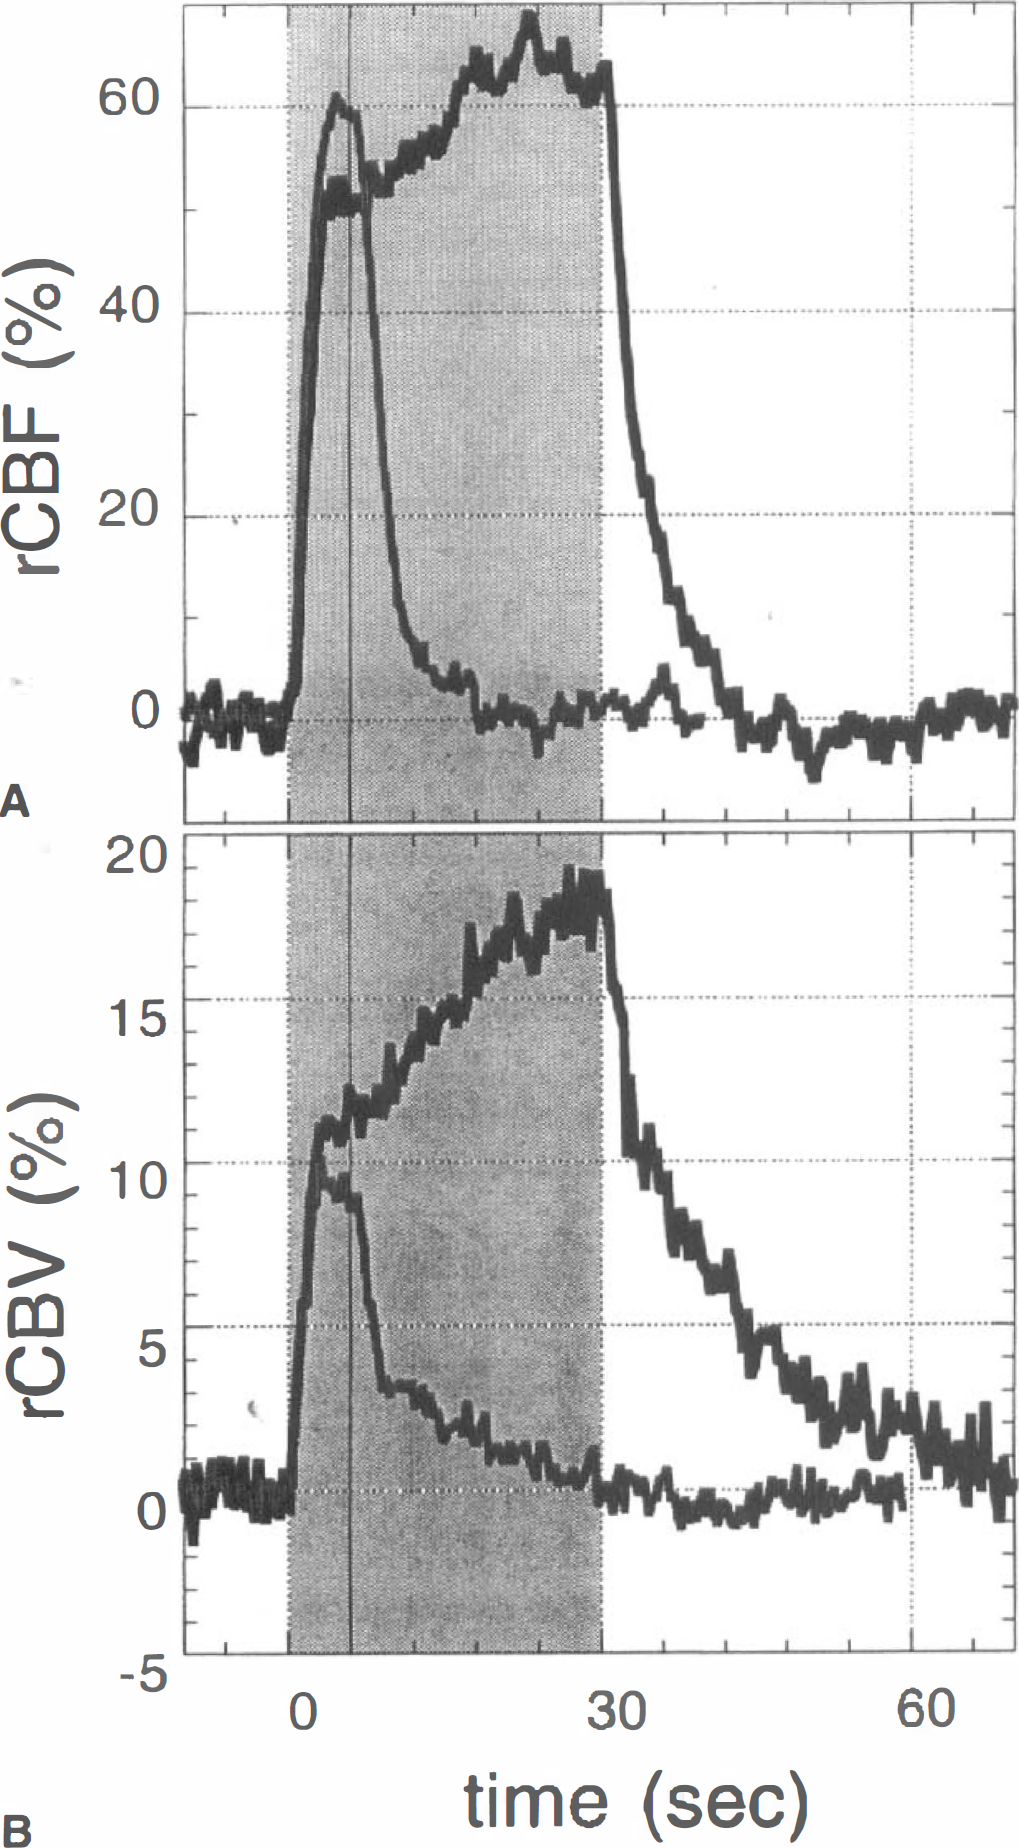
Figure 2 shows the average responses of rCBF and rCBV in somatosensory cortex to two paradigms in which electrical stimulation of the contralateral forepaw commenced at the time origin in the figure and persisted for either 6 or 30 seconds; the solid vertical line indicates the end of the 6-second stimulation, and the shaded area designates the 30-second stimulation period. The rCBF data were obtained using LDF, and data were averaged across four forepaws of 3 rats with a total of either 44 stimulations (6-second paradigm) or 26 stimulations (30-second paradigm). The rCBV data were acquired in a separate set of animals using MRI, and average results for the 6-second paradigm (eight paws, 4 rats, 193 stimulations) and the 30-second paradigm (six paws, 3 rats, 54 stimulations) were qualitatively different from the rCBF data. Consistent with previously published LDF studies in rats (Lindauer et al., 1993; Irikura et al., 1994; Ma et al., 1996), rCBF reacted rapidly and reached a plateau in about 4 seconds. In the 30-second paradigm, average rCBF showed a slow rise during the stimulation period, although this rise was not demonstrated in all animals. In contrast to this response, rCBV exhibited a rapid initial rise that was followed by a slow, delayed response which began 6 to 8 seconds after stimulation onset and accounted for approximately 40% of the observed change in CBV by the end of 30 seconds. The slow rise of this second phase was consistent with our previous results that did not distinguish the rapid phase from the slow and delayed response (Mandeville et al., 1998).
Average results for rCBF
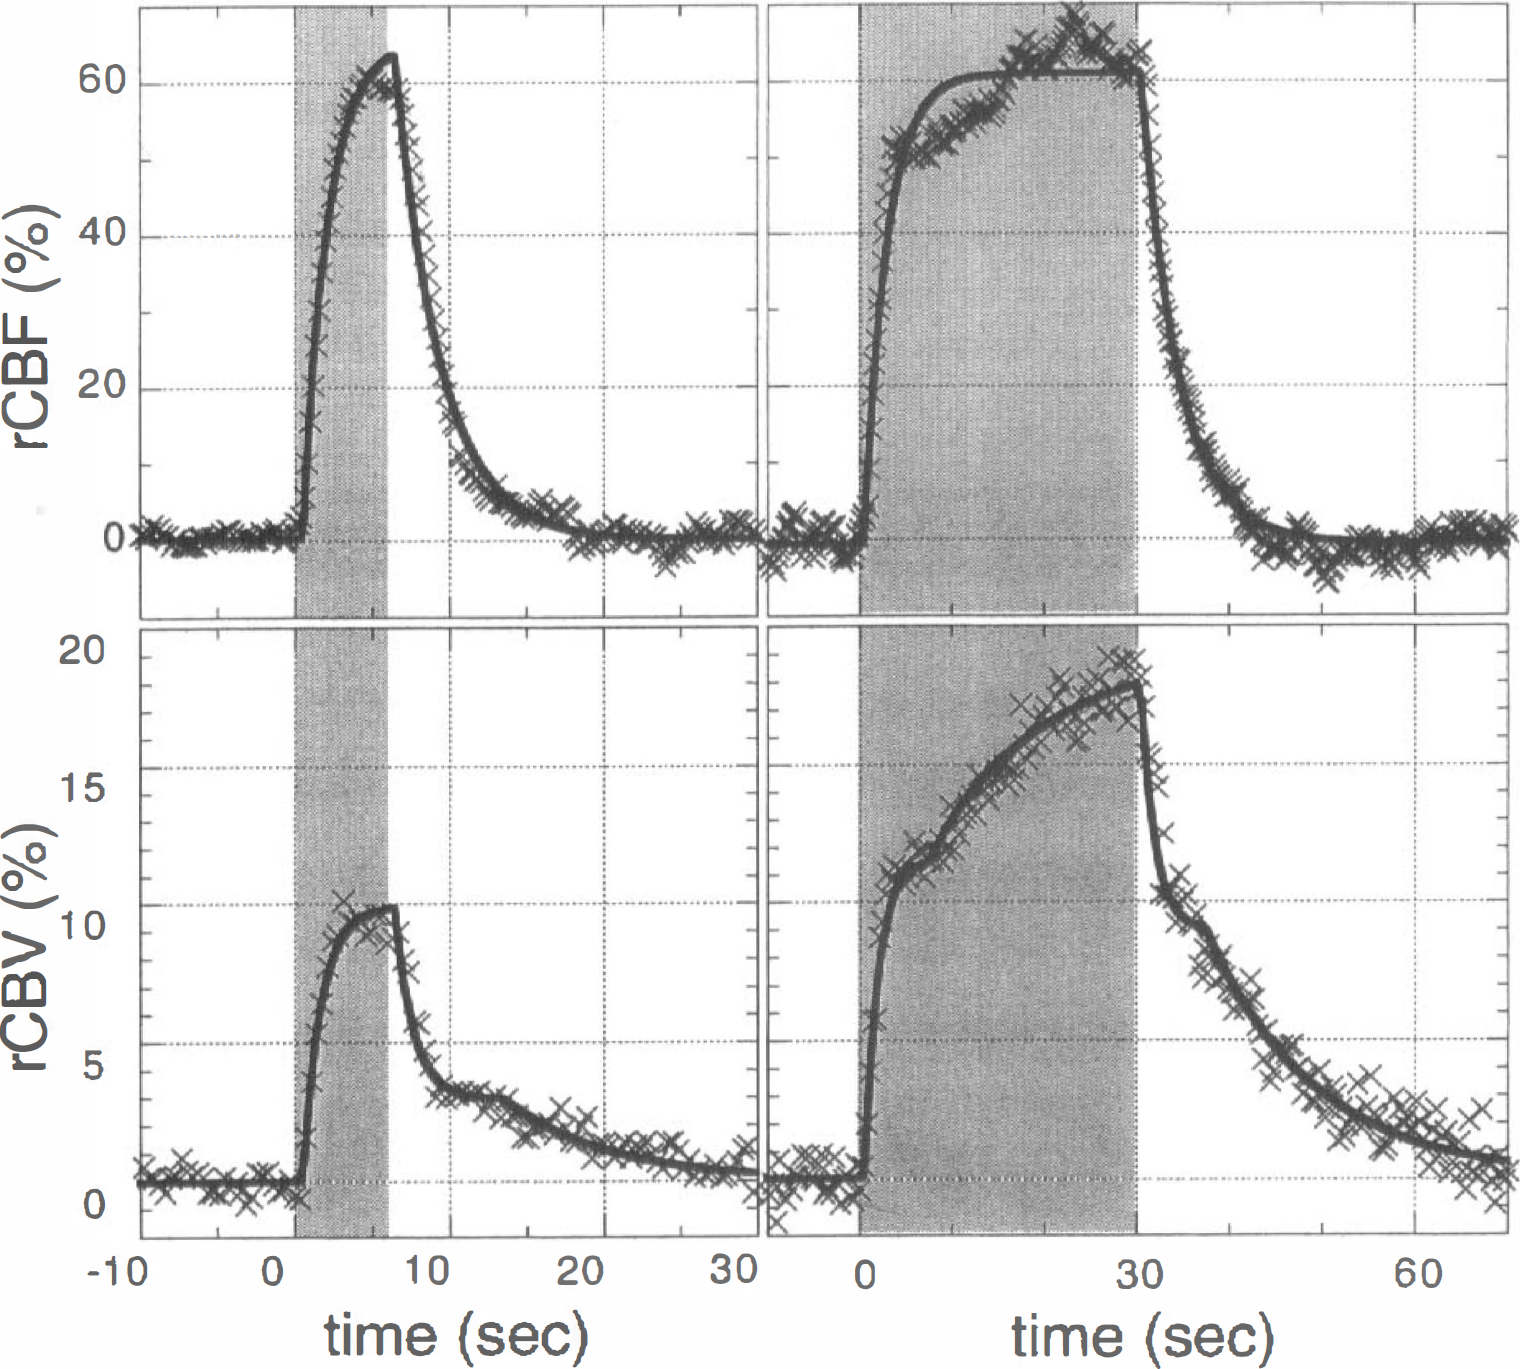
Fits to model functions were used to quantitatively determine the relevant time constants for rCBF and rCBV after stimulus onset and cessation, as described in the methods and illustrated in Fig. 3. For both rCBF and rCBV, best fits were obtained when the exponential rise for each function began 0.5 seconds after onset of stimulation and the exponential decay began 0.5 seconds after cessation of stimulation. The exponential time constants for rise (mean ± SD, 1.6 ± 0.8 seconds) and fall (2.7 ± 0.7 seconds) of rCBF were not significantly different in the 6-second paradigm (P > 0.05); a single time constant of 2.4 ± 0.8 seconds fit both rise and fall of rCBF. Relative CBV was fit using one time constant (1.5 ± 0.8 seconds) to describe both the rapid rise and the rapid phase of decay in the 6-second paradigm; this time constant was not significantly different from the time constant for rCBF (P > 0.05). In addition to the rapid phase of CBV decay in this paradigm, a slow process (7.5 ± 2.2 seconds) best fit the data when a delay of 8 seconds was applied between the rapid and slow processes. For the 30-second stimulation, rCBV was fit using one time constant (1.9 ± 0.7 seconds) to describe the rapid phases of rise and fall and a second time constant (14 ± 13 seconds) to describe the slow phases of rise and fall; a best fit was obtained when a delay of 8 seconds was applied between the rapid and slow processes for both rise and decay of rCBV.
Measured rCBF
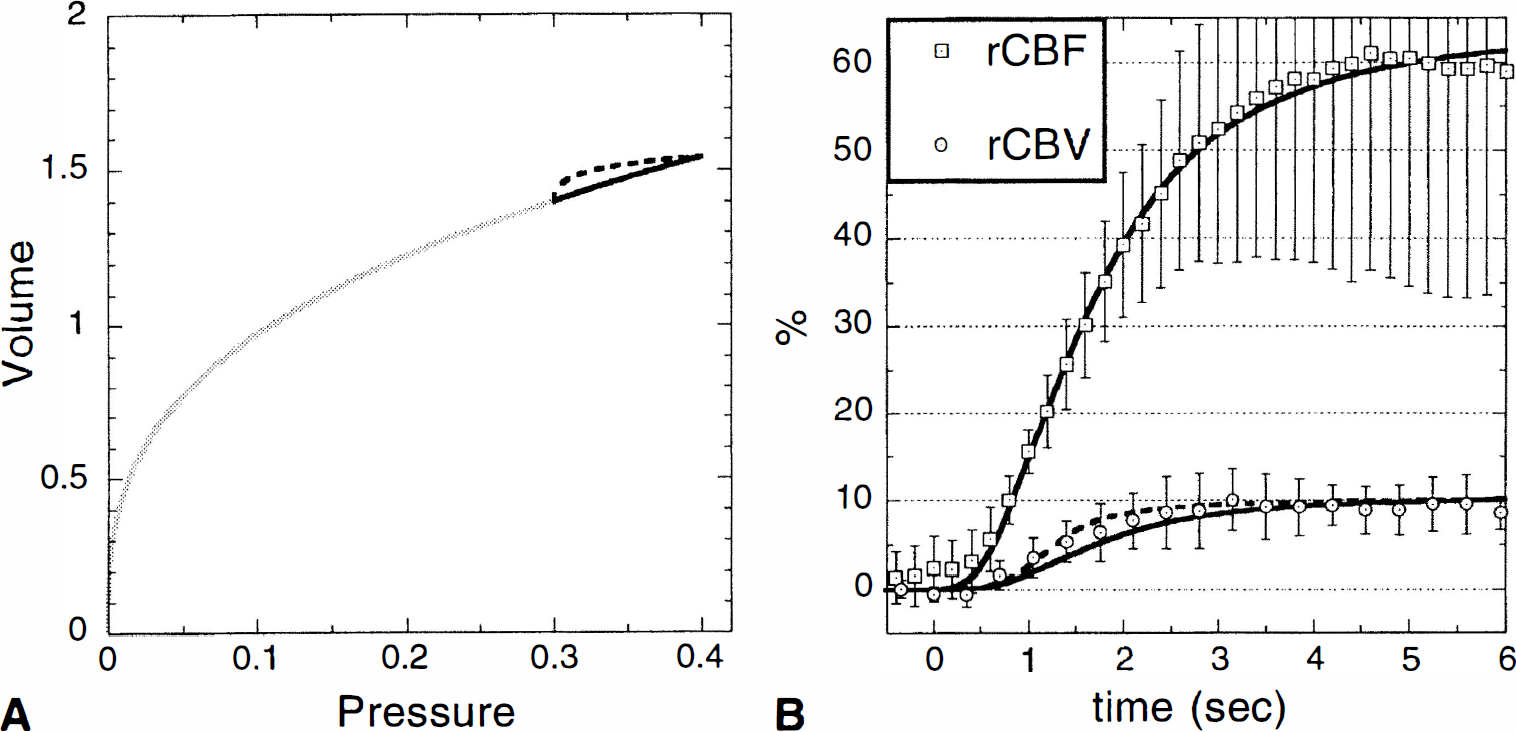
Because the dynamic relationship between magnitude changes in CBF and CBV has never been previously reported, this relationship was determined for both the 6-second paradigm and the 30-second paradigm to enable comparison with steady-state measurements of this relationship by PET during hypercapnia, F/F0 = (V/V0)2.6 (Grubb et al., 1974). During the 6-second paradigm, rCBF and rCBV both appeared to reach a plateau before the end of stimulation (Fig. 4B). Using propagation of errors, the relationship between mean rCBF (1.60 ± 0.25; SEM = 0.12) and mean rCBV (1.09 ± 0.03, SEM = 0.01) at the end of the 6 seconds of stimulation was F/F0 = (V/V0)5.5 ± 0.9. In the 30-second paradigm, rCBV clearly did not quite reach a steady-state value. By comparing the projected asymptotic values of rCBF (1.64 ± 0.30, SEM = 0.15) and rCBV (1.19 ± 0.07, SEM = 0.03) as determined by the fitting procedure, the relationship F/F0 = (V/V0)2.8 ± 0.7 was determined for the steady state.
Comparison of data with model calculations
The mean transit time through rat brain arises in the windkessel model as the natural time constant describing the temporal relationship between rCBF and rCBV after stimulation onset. A model calculation was compared with the data to test model assumptions and accuracy. Figure 4 compares average rCBF and rCBV to model calculations in the 6-second paradigm. The duration of this stimulation was not sufficient to induce the delayed increase in rCBV that is apparent in the response to the 30-second stimulation, as seen in Figs. 2 and 3. Because a single time constant accurately described the rise of rCBV, it was not necessary to model stress relaxation effects for this short stimulus.
A single windkessel (Fig. 1 and Eqs. 4 through 6) was used to model this data. Figure 4A shows the pressure-volume plane for the simulation. The solid line shows the pressure—volume relationship described in the methods, V = AP1/β, which is roughly linear for small transitions about the initial state (intersection of light and dark lines in the figure). Because rCBF was found to exhibit little sensitivity to assumptions about resistance and compliance in postarteriole compartments, the time course of arteriole resistance was adjusted to describe rCBF. Capillary and venous compartments were assumed to exhibit laminar flow (α = 2), and β was then set according to Eq. 5; because maximum rCBF (1.6) exceeded rCBV (1.1) by a power of about 5, β = 3.
Model calculations for rCBV lagged slightly behind data at early time points when a nearly linear pressure-volume trajectory was used (solid line in Fig. 4). However, another trajectory, which connected the same initial and final points but had a greater initial slope (dashed line in Fig. 4), shifted calculated rCBV to earlier time points. Such small time shifts are also within measurement error and model simplifications. For instance, arteriole CBV was neglected in the model and should respond more rapidly than downstream blood volume. Nevertheless, a simple model that describes dynamic rCBV in terms of a passive response of compliant vessels downstream from arterioles was broadly consistent with the data.
The long time constant of the second phase of CBV increase that is apparent during the 30-second stimulation (Figs. 2 and 3) and the delay of this change with respect to the stimulation window could not be reproduced in our model by assuming a purely elastic response, which we defined as any trajectory in the pressure—volume plane without an explicit time dependence. Because pressure changes in postarteriole compartments result from arteriole vasomotor control, any elastic response will occur with a time constant similar to that for blood flow. To reproduce the slow CBV response, we invoked venous delayed compliance, as described in the methods and the appendix.
The serial windkessels of Appendix Fig. 1 were used to separate capillaries and veins, and stress relaxation was simulated as a slow increase in venous compliance. Figure 5A shows the time evolution of the two temporal input functions to the model, the arteriole resistance and the variable A in Appendix Eq. 1 that produces a slow increase in venous compliance. The elastic phase for both the capillary and venous compartments was modeled using the nearly linear trajectory (V = CP1/3) shown in Fig. 4A.
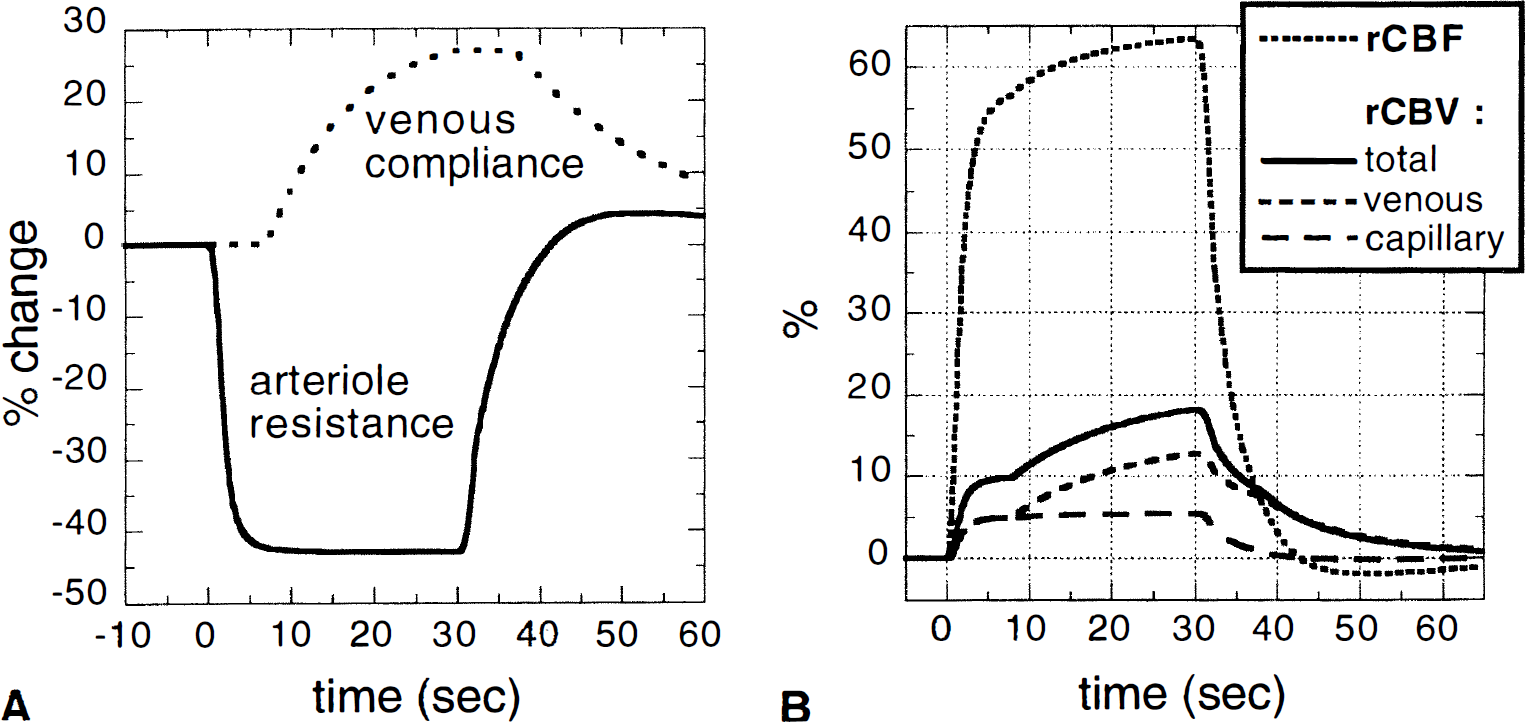
The resulting model calculations for rCBF and rCBV are shown in Fig. 5, in which capillary and venous blood volumes were plotted as a percentage of total CBV before stimulation. Only a small increase in capillary and venous blood volume (both 10% relative to baseline values) was attributed to elastic dilation. Venous delayed compliance produced only a small effect on rCBF but accounted for almost half of the increase in total rCBV. After the end of stimulation, rCBF fell below rCBV after approximately 6 seconds. An undershoot in rCBF data was reproduced by using an arteriole resistance function that included an overshoot after the end of stimulation (see Fig. 5A), although this feature of the data may be an artifact of LDF, as described in the discussion. These model calculations demonstrate that a temporal mismatch between rCBF and rCBV can arise when active vasomotor control occurs solely in arterioles and venous smooth muscle relaxes stress in response to altered pressure and volume.
DISCUSSION
The magnitude and temporal responses of rCBF and rCBV were measured in rat somatosensory cortex after electrical stimulation of forepaw. Relative CBF was measured using LDF, a commonly used method on exposed cortex in animal models. Relative CBV was measured by fMRI using a recently described technique (Hamberg et al., 1996; Mandeville et al., 1998; Payen et al., 1998). Relative CBF responded rapidly after onset and cessation of stimulation, whereas rCBV responded with two distinct phases. The two phases of rCBV, the response of rCBF, model calculations, and implications for fMRI brain mapping are discussed separately below.
rCBV response
Our data showed a delay of slightly more than 1 second between the half-maximum of rCBV and the leading edge of rCBF soon after electrical stimulation. Although rCBF and rCBV were measured with different modalities and stimulations were triggered manually, systematic timing error was certainly no larger than one third of the observed delay. In the model, this delay arose as the natural consequence of the cerebral transit time, which was fixed in the resting condition according to literature and then evolved during functional activation as the product of resistance and capacitance. Therefore, the measured response of rCBV was found to be broadly consistent with a model of passive downstream reactance.
The measured magnitude of rCBV relative to rCBF was much smaller at early time points than predictions of laminar flow, F/F0 = (V/V0)2, or PET measurements during hypercapnia (Grubb et al., 1974), F/F0 = (V/V0)2.6. During an intermediate plateau of rCBV from 3 to 8 seconds after stimulation, the relationship between rCBF and rCBV was F/F0 = (V/V0)5.5 ± 0.9. By the end of the 30-second stimulation, however, rCBV had slowly increased to more closely approximate the relationship with rCBF that has been measured with PET. Using asymptotic values for rCBF and rCBV as determined from a fitting procedure, the steady-state relationship between these variables in this focal activation paradigm, F/F0 = (V/V0)2.8 ± 0.7, was found to be consistent with the earlier PET results. These data clearly demonstrate that the magnitude of the relationship between rCBF and rCBV is not invariant on time scales less than approximately 1 minute.
rCBF response
Previous LDF measurements have reported small and variable poststimulus undershoots in rCBF that last for 30 to 60 seconds after stimulus cessation (Irikura et al., 1994; Ma et al., 1996). These undershoots are temporally similar to the delay in rCBV reported here and previously by us (Mandeville et al., 1998). This temporal concordance suggests the possibility that the poststimulus undershoot of rCBF is an artifact specific to LDF, which is known to underestimate rCBF when rCBV is elevated and no correction strategy is used. Elevation of blood volume increases multiple scattering of light at wavelengths sensitive to red blood cells and thereby increases the bandwidth of reflected light. The particular LDF system used in this study includes an algorithm to “linearize” rCBF to correct for this potential deficiency (Nilsson, 1984), and the largest available bandwidth of the system was used in these studies to achieve the best possible correction. Nevertheless, we observed small (5% to 10%) poststimulus undershoots in LDF signal in several animals. Although additional studies are required to better define the size of the potential error caused by an imperfect correction for elevated CBV, care should be taken in interpreting LDF signal in cases when a temporal mismatch between CBF and CBV may occur.
Model calculations
Although our model readily reproduced the early rapid CBV rise as an elastic response of capillaries and veins to increased pressure modulated by arteriole vasodilation, the slow component was explained only by the ad hoc introduction of a slow change of venous compliance, an interpretation supported by ex vivo experiments. “Delayed compliance,” or relaxation of circumferential stress resulting from elastic venous expansion or contraction, is observed in individual smooth muscle cells and excised vessels. In individual cells, relaxation of stress occurs in a biexponential manner with time constants of 0.5 and 15 seconds (VanDijk et al., 1984). In excised vessels, stress relaxation is more pronounced in the circumferential than longitudinal direction (Hasegawa, 1983) and is a larger effect in veins than in arteries. In large veins, large elastic increases in blood volume (175%) produce delayed compliance changes of about 30% that occur on a time scale of minutes (Porciuncula et al., 1964) and relax about 80% of the increased stress (Hasegawa, 1983). In vivo, arteriole dilation presumably creates an initial elastic expansion in venous vessels over a wide range of radii, and the literature of stress relaxation is sparse for small blood volume increases and small vessels.
Our vascular model entirely neglected blood volume in the arteriole compartment, which presumably produced at least a small portion of the rapid rCBV increase after stimulation. If arteriole blood comprises only 5% of total CBV (Mchedlishvili, 1986) and we assume laminar flow in this compartment, reduction in arteriole resistance by a factor of 2 would produce a 40% increase in arteriole CBV but only a 2% increase in total CBV. Although the temporal characteristics of rCBV cannot be expected to distinguish the arteriole compartment from an elastic response of downstream vessels, the arteriole contribution can be assessed in animal models by varying arterial blood pressure. The windkessel model of Fig. 1 predicts that capillary and venous compartments should “autoregulate” blood volume to a degree comparable to autoregulation of CBF (see Eq. 5), because the pressure drop across the postarteriole compartment will be constant irrespective of arterial blood pressure when CBF is maintained at a constant value. Literature reports of total rCBV versus arterial blood pressure are highly variable and generally use indirect indicators of blood volume. Our preliminary results using this MRI method for measuring rCBV have shown little sensitivity to the arteriole compartment during changes in arterial blood pressure (Marota et al., 1998).
Our model represents a conventional view of cerebrovascular dynamics in that the coupling between blood supply and local brain function results from active vasomotor control of arterioles. Within such a model, changes in volume that scale with flow (Eq. 5) must occur in all compliant vessels that are not subjected to active vasomotor control. Therefore, “passive” volume changes are expected in capillaries and veins. Model results for capillary rCBV (10% increase relative to initial capillary blood volume) were qualitatively consistent with results of invasive fixation measurements of capillary diameter changes during hypercapnia (Atkinson et al., 1990; Duelli and Kuschinsky, 1993). From the results of optical imaging, sensory stimulation causes an increase in both capillary plasma volume and red blood cell volume (Frostig et al., 1990).
The serial windkessel model of Appendix Fig. 1 predicts “flow-mediated dilation” of arteries distal to arterioles, an established phenomena in large and small arteries during global increases in blood flow (Fujii et al., 1991; Bevan and Henrion, 1994). Because the total pressure drop across the vascular bed is fixed, arteries must obey Eq. 5 as well; it does not matter whether the windkessel is distal or proximal to arterioles. Although other aspects of vascular physiology may modify this relationship, flow-mediated dilation is an inescapable feature for all compliant vessels in vivo.
Implications for BOLD MRI signal
A poststimulus delay in the return to baseline of rCBV provides an explanation for the poststimulus undershoot of BOLD signal that has been evident since the first demonstration of BOLD fMRI in humans (Kwong et al., 1992). Changes in BOLD signal predominantly reflect changes in the total (tissue plus blood) concentration of deoxygenated hemoglobin, a paramagnetic MRI contrast agent (Pauling and Coryell, 1936). As such, simple models describe BOLD signal (S) in terms of relative changes in CBF, CBV, and CMRO2 (M): ΔS/S ~ ΔF/F – ΔV/V – ΔM/M (Ogawa et al., 1993). A poststimulus undershoot in BOLD signal should result when rCBV exceeds rCBF, as shown by our data. The slow decay of rCBV that was observed after cessation of a 30-second stimulation has previously been shown to be temporally consistent with the BOLD undershoot in this forepaw stimulation paradigm (Mandeville et al., 1998), and BOLD undershoots in humans show similar dynamics. The established observation that the BOLD undershoot in human visual cortex diminishes with stimulus duration (Davis et al., 1994) is in agreement with this proposed mechanism, because the observed magnitude and delay of rCBV also decrease with stimulus duration.
A biophysical model of BOLD signal has recently been proposed (Buxton and Frank, 1997) that examines the implications of two common assumptions: (1) oxygen is rapidly metabolized after leaving capillaries, and (2) all cerebral capillaries are perfused at rest. These assumptions inevitably lead to the conclusions that the efficiency of oxygen extraction decreases as flow increases and that the rate of oxygen delivery from blood to brain cells is limited by diffusion. Within this model, relative CMRO2 is tightly coupled to rCBF with a nonlinear magnitude relationship as long as capillary rCBV does not change or is temporally coupled to rCBF. In the vascular model proposed here, the hypothesis of delayed compliance functionally separates veins from capillaries, which do not possess smooth muscle and therefore respond elastically to pressure changes modulated by arteriole vasomotor control, resulting in a close temporal concordance between capillary rCBV and rCBF. By combining a diffusion-limited model of oxygen delivery with a model of passive postarteriole reactance that includes delayed compliance in the venous compartment, the BOLD poststimulus undershoot is attributed solely to an elevation of venous blood volume that persists after CBF, CMRO2, and capillary blood volume have all returned to baseline values.
Footnotes
Appendix
It is possible to incorporate stress relaxation effects into the single windkessel model described by Eqs. 4 through 6 in a phenomenological way by simply introducing an explicit time dependence to the windkessel capacitance. However, a model ideally would separate veins from capillaries, where variations in total surface area affect oxygen extraction.
An alternative circuit to Fig. 1 is presented in Appendix Fig. 1, which models capillaries and veins as serial windkessels. The initial conditions and solution for the circuit of Fig. 2 are simple generalizations of the prescriptions described previously. Briefly, capillary and venous resistances and compliances were assumed to vary passively as described by Eq. 4 for each compartment. Initial resistances were proportioned in the ratio 0.65:0.25:0.10 between arterioles, capillaries, and venules plus small veins. Initial blood volume was proportioned in a 1:1 ratio between veins and capillaries. To incorporate venous stress relaxation, the variable A in Eq. 4 was given an explicit time dependence: delayed compliance was modeled as a slow exponential increase in this variable beginning several seconds after onset of stimulation; several seconds after stimulus cessation, compliance slowly returned to baseline with the same exponential time constant. The time constant and offset with respect to the stimulation window were adjusted to reproduce the data.
For the capillary compartment, the model relationship between steady-state changes in relative flow and volume is described by Eq. 5. In the venous compartment, this relationship is modified as
where the subscript V denotes the venous compartment. Using the subscript C to denote the capillary compartment, the time-dependent solution to the model of Appendix Fig. 1 results from solving equations similar to those presented in Eq. 6:
Although this model has the advantage of functionally separating capillaries and veins, it uses an approximation because extravascular flow from the capillary compartment, which results from volume displacement by capillary blood, is added to venous inflow. To test the level of error introduced by this approximation, we modeled the data from the 6-second stimulation using the serial windkessels and the same assumptions and initial conditions that were used for the single windkessel calculations of Fig. 4. Appendix Fig. 2 shows the model calculation for the flow into and out of the capillary compartment as a function of time. The difference between the true flow out of the capillary compartment (FOUT) and the venous inflow used in the model (FIN) never exceeded 2.5% at any time point. Appendix Fig. 2B compares results produced by the single windkessel (reproduced from Fig. 4B) and the serial windkessels; the difference between the two models never exceeds 0.5% for rCBV. We conclude that model error resulting from the use of serial windkessels was small.