
Abstract
Functional magnetic resonance imaging (fMRI) based on blood oxygen level-dependent (BOLD) contrast has become an invaluable tool in the assessment of in vivo neuronal activation. Quantification of the BOLD response is determined by the hemodynamic and metabolic changes that occur in response to brain stimulation. However, these changes may vary by changes in insulin, a hormone known to be vasoactive in some tissues. To determine if insulin has an effect on fMRI, we measured the BOLD response to a visual stimulus in five normal volunteers in which insulin was first suppressed and then brought to a high physiological concentration. In addition, we also examined the effect of insulin on activation of the visual cortex as measured by the visual-evoked potential (VEP). We found that the BOLD response measured in the presence of insulin (serum insulin = 236±29pmol/L) was significantly lower (P < 0.001) than that measured in its absence (serum insulin = 8±2pmol/L). Insulin was without effect on P100 amplitude or latency acquired in the presence or absence of insulin in 28 subjects using the same stimulus as that used for the fMRI experiments. Our observations suggest that insulin may have effects on cerebral blood flow and/or metabolism that affect the BOLD signal that are independent of its effects on neuronal activation identified by event related potentials (ERP). These findings highlight the complexity that must be considered when interpreting differences in fMRI responses between groups of subjects that differ in insulin concentration and/or insulin sensitivity.
Introduction
Functional magnetic resonance imaging (fMRI) has become an invaluable tool in the assessment of in vivo neuronal activation. With this methodology, subjects are typically presented with a stimulus (e.g., picture, sound) and the cerebral tissue activated by the stimulus is detected through use of blood oxygen level-dependent (BOLD) contrast in which the paramagnetic molecule deoxyhemoglobin is used as an endogenous contrast agent (Kim and Ugurbil, 1997). Because focal activation results in a disproportionate increase in blood flow relative to the amount of oxygen extracted in an activated region, such regions will have relatively more oxyhemoglobin and relatively less deoxyhemoglobin during the activation as compared with the control condition and the adjacent unactivated areas. This difference in deoxyhemoglobin content alters the MRI signal intensity and allows for the identification of regions activated by the neural stimulus.
In recent years, fMRI has been used to examine the brain's metabolic as well as functional neuroanatomic activity. In particular, this technique has been used to investigate obesity and the regulation of feeding behavior. Several groups have now reported that the oral administration of glucose reduces the fMRI signal detected from the hypothalamus of normal volunteers (Liu et al, 2000; Matsuda et al, 1999; Smeets et al, 2005) and Matsuda and colleagues found that this response was attenuated in obese subjects (Matsuda et al, 1999). Interestingly, an inverse relationship was noted between the hypothalamic fMRI response and plasma insulin concentration (Liu et al, 2000; Matsuda et al, 1999), raising the possibly that the increase in plasma insulin that follows glucose ingestion could be responsible for the reduction noted in the fMRI response. How insulin might alter the hypothalamic response detected by fMRI after glucose ingestion and whether the hormone alters neuronal activation in other regions is unknown. Insulin is known to be a vasoactive hormone in many tissue beds (Christopherson and Bredt, 1997), and it is possible that changes in insulin concentrations may alter the fMRI response detected after the administration of stimuli other than oral glucose. If so, it will be important to control for this variable in future investigations in which the fMRI response to stimuli are determined in patients with different plasma insulin concentrations or levels of systemic insulin resistance, such as subjects with obesity or type 2 diabetes.
To determine whether insulin alters the fMRI response to a stimulus other than glucose, we measured the BOLD response after a visual stimulus in normal volunteers in which the insulin concentration was first suppressed by the infusion of somatostatin and then brought to a high physiological concentration by insulin infusion. In this experiment, we sought to test the hypothesis that the fMRI response would be different in the presence of insulin than in its absence in human subjects. In addition, we also examined the effect of insulin on activation of the visual cortex as measured by the visual-evoked potential (VEP). An advantage to employing both methodologies is to provide converging information on how exactly insulin affects brain function—for example, does it affect metabolism separately from neuronal activation? If insulin has a non-specific effect on the fMRI response to a given stimulus, perhaps because of the vasoactive effects of the hormone. We hypothesized that the VEP measured in the presence of insulin would be the same as those measured in its absence because the neuronal signal detected by VEP is dependent on electrical activity as opposed to the changes in blood flow and metabolism that are measured by fMRI.
Research Design and Methods
Human Subjects
Healthy human adults (ages 18 to 45 years) were recruited for participation from the University of Minnesota community. Volunteers taking medications known to alter cerebral blood flow or modulate neuronal function, including but not limited to antihypertensive drugs and antidepressant medications, were excluded from participation, as were volunteers with a self-reported history of depression, anxiety, or other psychiatric disease. Approval was obtained by the University of Minnesota Committee on the Use of Human Subjects in Research and the General Clinical Research Center, and written informed consent was obtained from all subjects before study participation.
Functional Magnetic Resonance Imaging Protocol: Methods and Analysis
Subjects reported to the Center for Magnetic Resonance Research at the University of Minnesota in the morning after a minimum of an 8-h fast. Intravenous catheters were placed into both arms for later infusions of glucose, somatostatin, potassium phosphate and insulin. An additional catheter was placed retrograde in one foot or distal leg for later blood sampling. The blood in this limb was arterialized by use of warming blankets (Seaquist, 1997). At 30 mins after the insertion of catheters, somatostatin (final dose of 0.16 μg/kg/mins achieved over a 30 mins titration period, Bachem California Inc., Torrance, CA) was administered to suppress endogenous insulin secretion. Dextrose (20% in water) was administered as needed to maintain blood glucose at 5.6 mmol/L based on blood glucose values that were measured in samples obtained every five minutes. After subjects were at target glycemia for a minimum of 20 mins, they were placed into the magnet for the first fMRI period (step 1). At the completion of the 30-mins fMRI period, subjects were taken out of the magnet and infusions of potassium phosphate (4.8 mEq/h) and insulin (1.0 mU/kg/mins) were started to achieve a physiological level of hormone. Dextrose (20% in water) was continued as necessary to maintain glycemia. After 60 mins, subjects were placed back into the magnet for the second fMRI period (step 2) with the same head position. Blood samples were obtained at baseline and every 5 mins for the immediate determination of glucose concentrations and every 30 mins for the later determination of insulin concentrations. Figure 1 depicts the study protocol for the fMRI experiment.
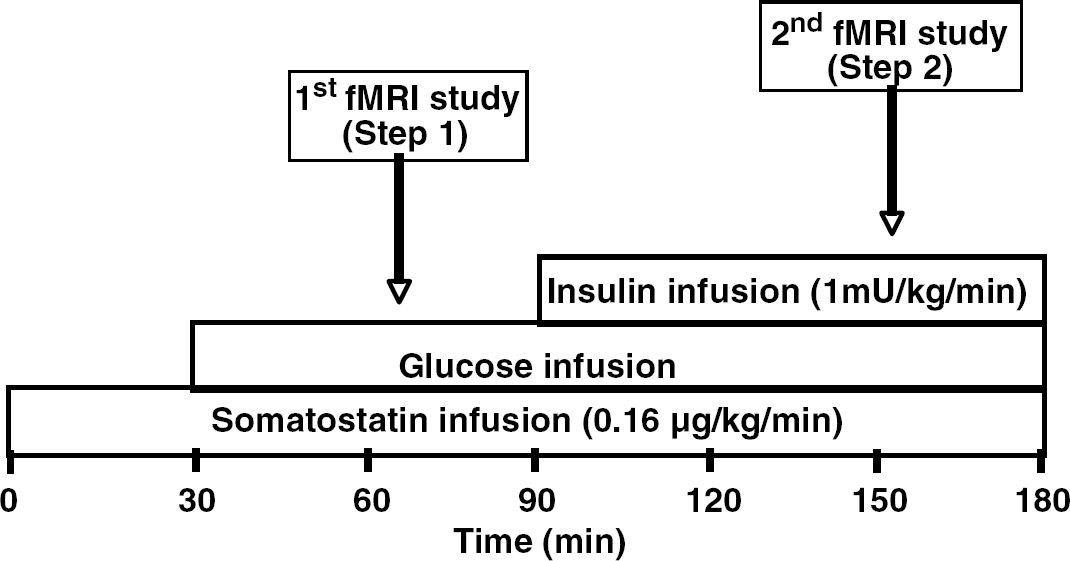
fMRI protocol. Somatostatin was started at time 0 to suppress endogenous insulin release. Glucose (20g/100 ml) was administered at rate to maintain euglycemia starting at minute 30. At minute 90 insulin was started to bring serum insulin concentration to a high physiological level. The first fMRI (step 1) was performed at euglycemia in the absence of insulin. The second fMRI (step 2) was performed at euglycemia in the presence of insulin.
The study was performed using a 4 Tesla whole body MRI system (Oxford Instruments, Witney, Oxon, UK, Varian NMR Systems, Palo Alto, CA, USA, Siemens Medical Solutions, Malvern, PA, USA) and 10 cm diameter 1H surface coil. Anatomic images were obtained by T1-weighted multi-slice TurboFLASH and fMRI was obtained by singleshot multiple-slice echo-planar image (FOV = 20 × 20 cm2; 64 × 64 image matrix size; TE = 16 ms; TR = 2 secs). Seven 5 mm thick coronal slices across the calcarine fissure were acquired for generating fMRI maps. Three control periods and two task periods were designed in an interleaved way; twenty image sets were acquired in each of the five consecutive periods. Visual stimulation was provided by a reversal red-black checkerboard pattern (8 Hz). The fMRI experiment was repeated three to five times for each subject in the absence and presence of insulin. The fMRI maps were generated by the period cross correlation method using STIMULATE software (Ugurbil K Personal communication. http://www.cmrr.umn.edu). Activated pixels were identified using statistical t-testing for those time periods where motion was considered insignificant based on center-of-mass time courses and verification of lack of negative signal changes inside the primary visual cortex. Pixels that displayed a significant (P < 0.01) difference in intensity between basal and stimulated conditions were included in the statistical analysis. The fMRI maps were used to determine the activated region of interest in the visual cortex. The BOLD percentage changes were calculated using the signal time courses from the all pixels within the region of interest. The intensity of the activation was determined by calculating the averaged percentage change in MR signal (the % BOLD effect) noted between basal and activated conditions in those pixels in region of interest identified by statistical t-testing. The averaged BOLD percentage changes from multiple measurements are reported.
Visual-Evoked Potential Protocol: Methods and Analysis
For this protocol, a second group of subjects presented to the General Clinical Research Center at the University of Minnesota after a 5 h fast. In random order, subjects underwent both a hyperinsulinemic-euglycemic clamp and hypoinsulinemic-euglycemic clamp separated by 1 to 4 weeks. Subjects were randomized in a single-blind manner into either group. To prepare for the study, subjects had intravenous catheters placed into each arm. One catheter was used for the infusion of glucose, somatostatin, and insulin or saline. Subjects were also administered potassium phosphate on the day they were administered insulin to prevent hypokalemia. The other catheter was used for blood sampling. The blood from the arm used for blood sampling was arterialized by wrapping in hot towels (Seaquist, 1997). At time zero, somatostatin (final dose of 0.16 μg/kg/mins achieved over a 30 mins titration period, Bachem California Inc., Torrance, CA, USA) was administered to suppress endogenous insulin secretion and insulin (1.0 or 2.0 mU/kg/mins) and potassium phosphate (4.8 mEq/h) were infused. Dextrose (20% in water) was administered as needed to maintain a blood glucose of 5.6 mmol/L.
At minute 90 subjects were presented with a visual task. The task was performed in a darkened room while the subjects faced a rear-projection screen. Side panels were placed to occlude their peripheral vision. A stimulus consisting of a reversing checkerboard pattern was projected onto a computer screen. The checkerboard was reversed at an 8-Hz frequency between white and black. Subjects were asked to maintain fixation on the screen for 40 secs while the VEP was obtained.
Visual-evoked potentials were derived from the ongoing electroencephalogram. Subjects' heads were covered with a lycra cap fitted with 32 electrodes fashioned along the lines of the International 10/20 system. Scalp electrodes were recorded referenced to Cz and then re-referenced to linked mastoids before data reduction and analysis. The electrooculogram was recorded from bipolar, miniature electrodes placed vertically above and below the right eye. A Grass® Model 12 Neurodata Acquisition System was used to collect the electroencephalogram. A gain of 50 was used for scalp electrodes and a gain of 5 was used for the electrooculogram electrodes. The amplifier bandpass was 0.1 to 30 Hz, and a 60 Hz notch filter was engaged. Electroencephalogram and electrooculogram were sampled every 5 ms before data analysis, trials with movement artifact (electroencephalogram greater than ±100 μV) were rejected. Data contaminated by eye-movement were corrected using a standard eye correction algorithm. Raw VEP data were first analyzed by subtracting electroencephalogram artifacts and subtracting or correcting electrooculogram artifacts (Gratton et al, 1983). All artifact-free trials were then averaged. Inspection of individual subject averages, and the group's grand average (average of averages) was then performed to identify the P100. Standard peak-picking procedures were employed for quantification, followed by computation of peak and average peak amplitudes and latency to peak amplitudes.
Laboratory Analysis
Serum glucose levels were assessed by the glucose oxidase method (Beckman Instruments, Fullerton, CA, USA) and insulin levels assessed by chemiluminescence (Diagnostic Products Corporation, Los Angeles, CA, USA).
Statistical Analysis
Data are reported as means ± s.e.m. unless otherwise stated. Data were analyzed using a paired Student's t-test.
Results
Functional Magnetic Resonance Imaging Protocol
Five subjects were recruited for participation (4 women, 1 man, 32± 5 years of age). Blood glucose concentrations were maintained at 6.4± 0.8 mmol/L during step 1 and at 6.1±0.8 mmol/L during step 2 of the experiment. Endogenous insulin secretion was successfully suppressed during step 1 (mean plasma insulin = 8±2 pmol/L). During step 2, insulin concentrations were elevated to 236±29 pmol/L. Figure 2 demonstrates the fMRI maps that were made during the study of two subjects. In these subjects, the intensity of the BOLD signal generated during step 1 appeared to be greater than that generated during step 2. Quantification of the BOLD responses of all subjects found this observation to be true for all subjects (Table 1). Blood oxygen level-dependent responses obtained in the absence of insulin were found to be significantly higher than the BOLD responses measured in the presence of insulin (P < 0.001).
BOLD responses (mean±s.d.) in the absence and presence of insulin
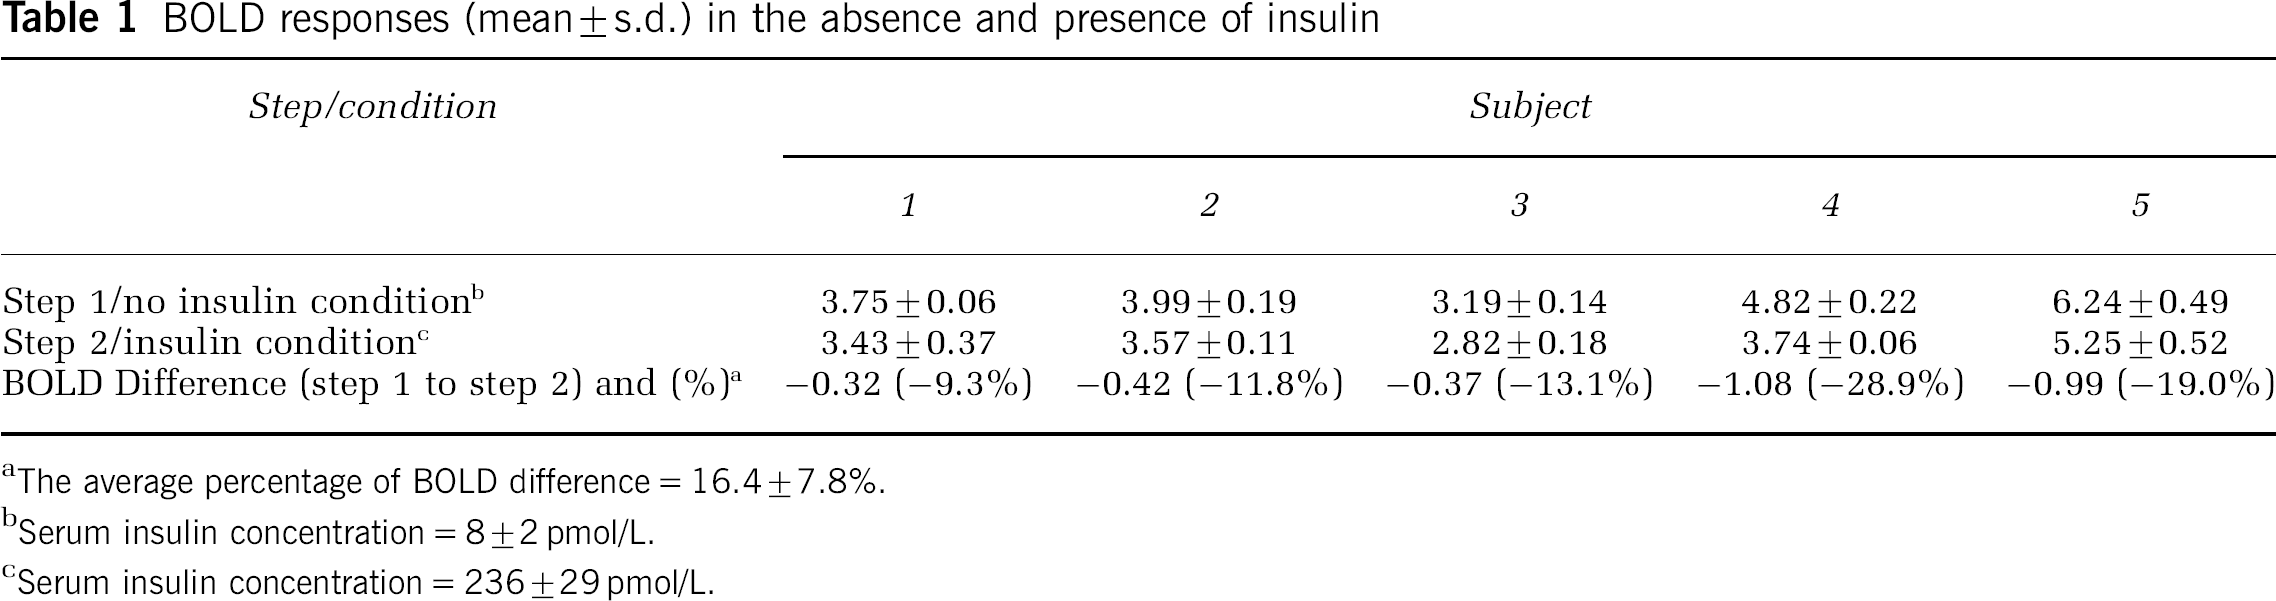
The average percentage of BOLD difference = 16.4±7.8%.
Serum insulin concentration = 8±2 pmol/L.
Serum insulin concentration = 236±29 pmol/L.
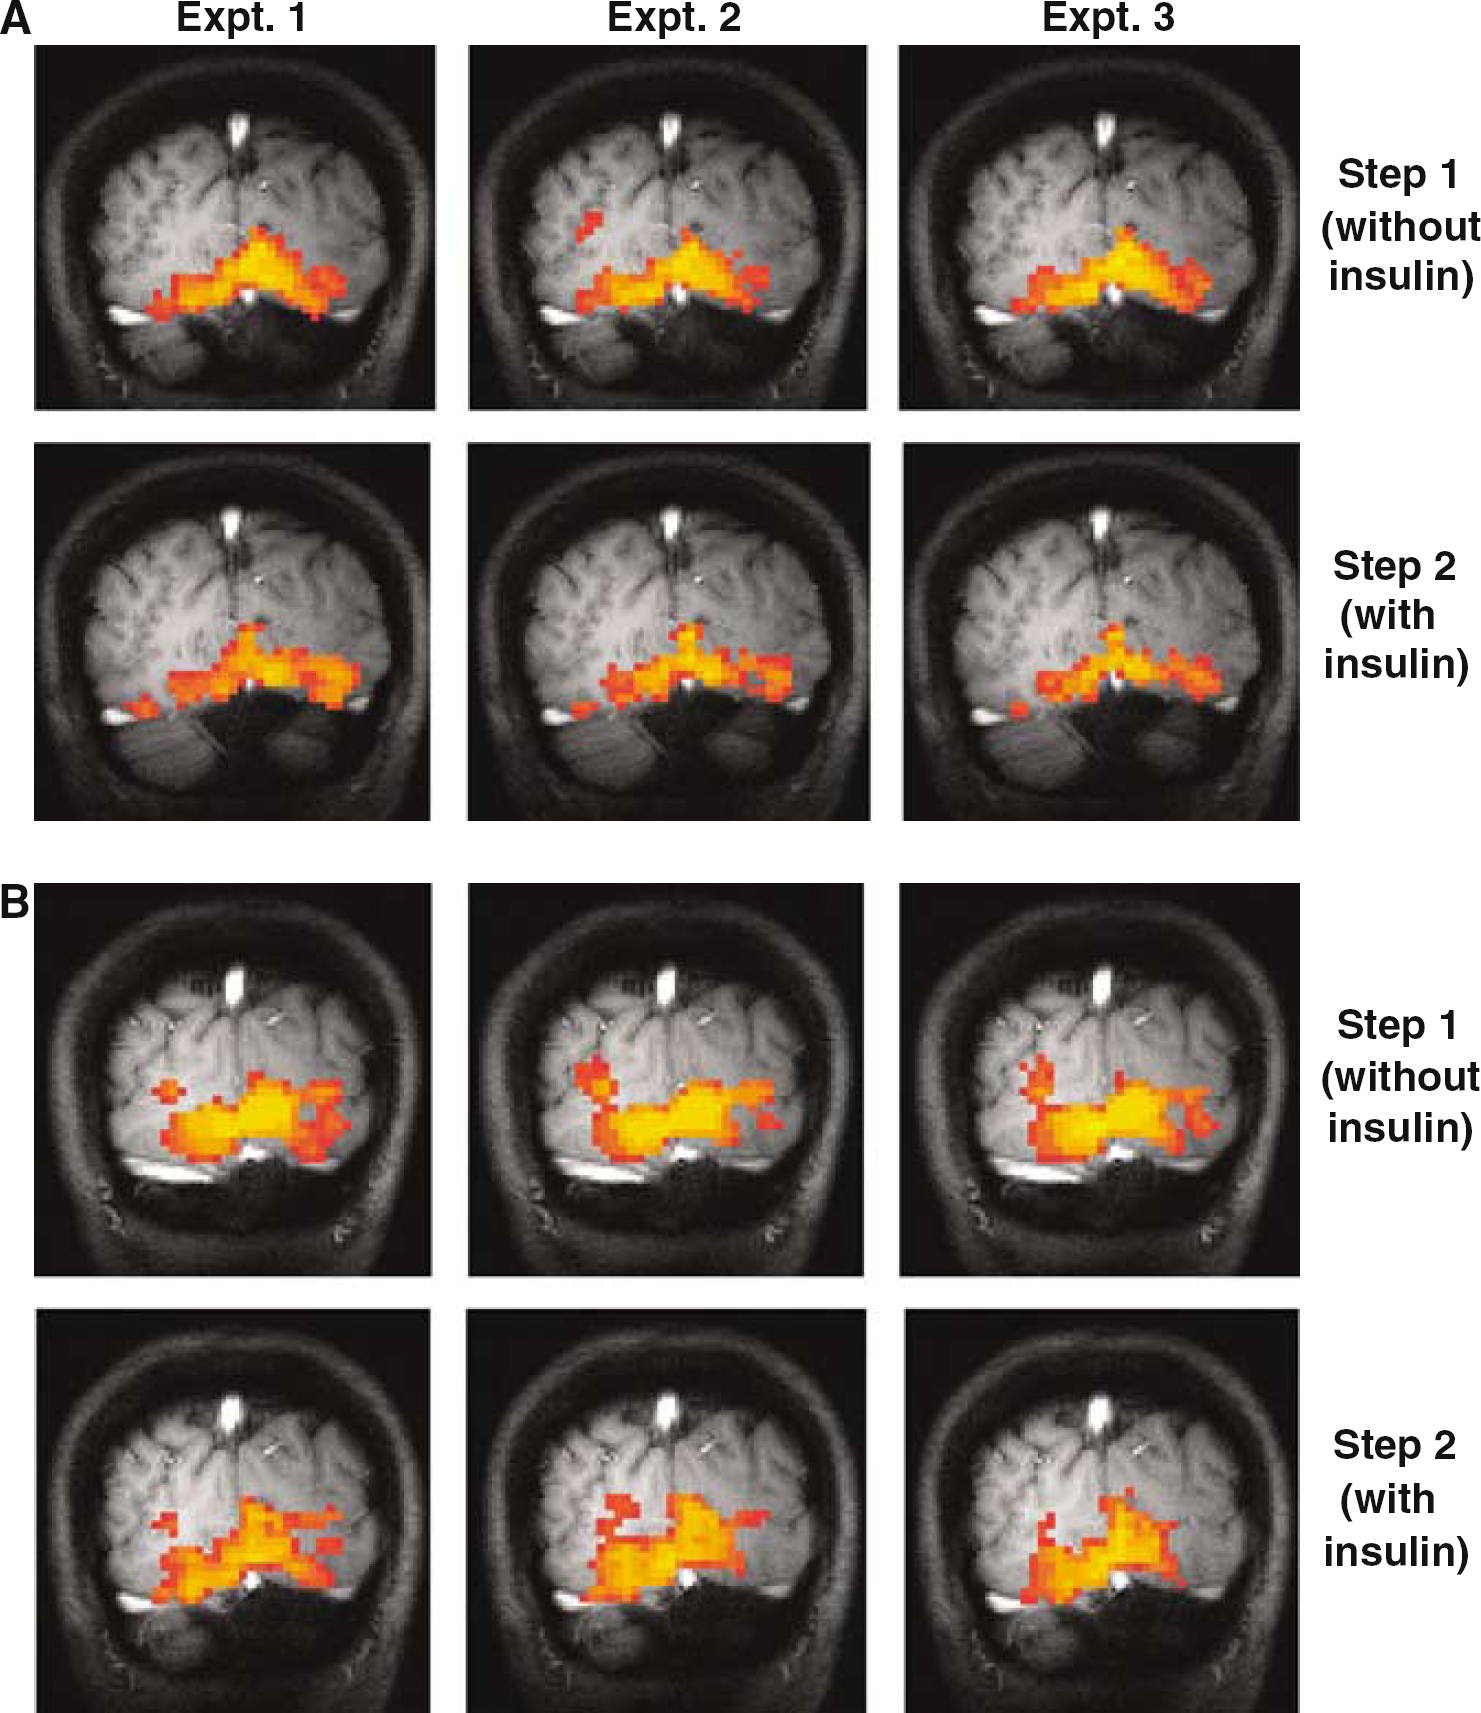
fMRI maps made from two representative subjects (A and B) in the absence and presence of insulin. Highlighted areas represent cerebral tissue activated during presentation of the visual stimulus. The activated BOLD magnitudes observed in step 2 during the insulin infusion is smaller than that obtained in step 1 where endogenous insulin was suppressed.
Visual-Evoked Potential Protocol
Eighteen subjects (8 women, 10 men, 28±2 years of age) completed studies in which the VEP was collected during the infusion of 1.0 mU/kg/mins of insulin or saline. Blood glucose was the same on both days of study (5.6± 0.1 versus 5.6± 0.1 mmol/L, P= 0.8). Serum insulin concentrations were significantly higher on the day insulin was infused at a rate of 1.0 mU/kg/mins than on the day saline was administered (326±30 versus 12±1 pmol/L; P < 0.001). Insulin was without effect on P100 latency or amplitude, but the right occipital region (leads O1, PO3) had a lower latency and shorter amplitude than the left occipital region (leads O2, PO4) (Table 2).
Amplitude and latency of VEP in subjects during infusions of insulin or saline
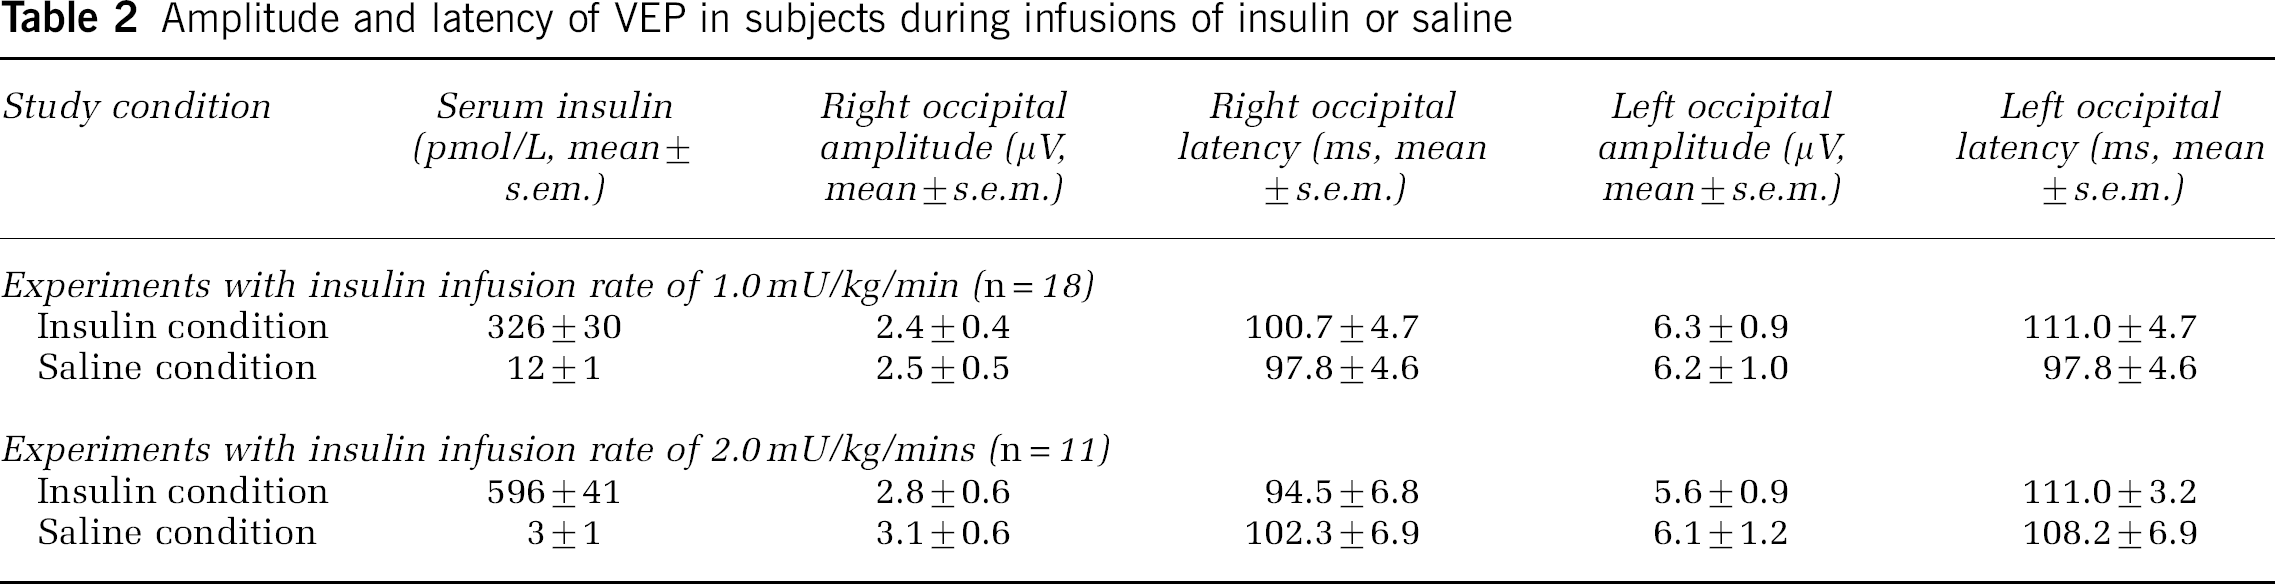
Eleven subjects (3 women, 8 men, 23±1 year of age) completed studies in which insulin was infused at the higher rate of 2.0 mU/kg/mins. In these subjects, blood glucose was again the same during the insulin and the saline infusions (5.7±0.2 versus 5.6±0.1; P =0.2). Serum insulin concentrations at the time the visual task was presented were 596±41 pmol/L on the day insulin was infused and 3±1 pmol/L on the day saline was administered (P < 0.001). Insulin was again noted to be without effect on P100 latency or amplitude (Table 2, Figure 3).
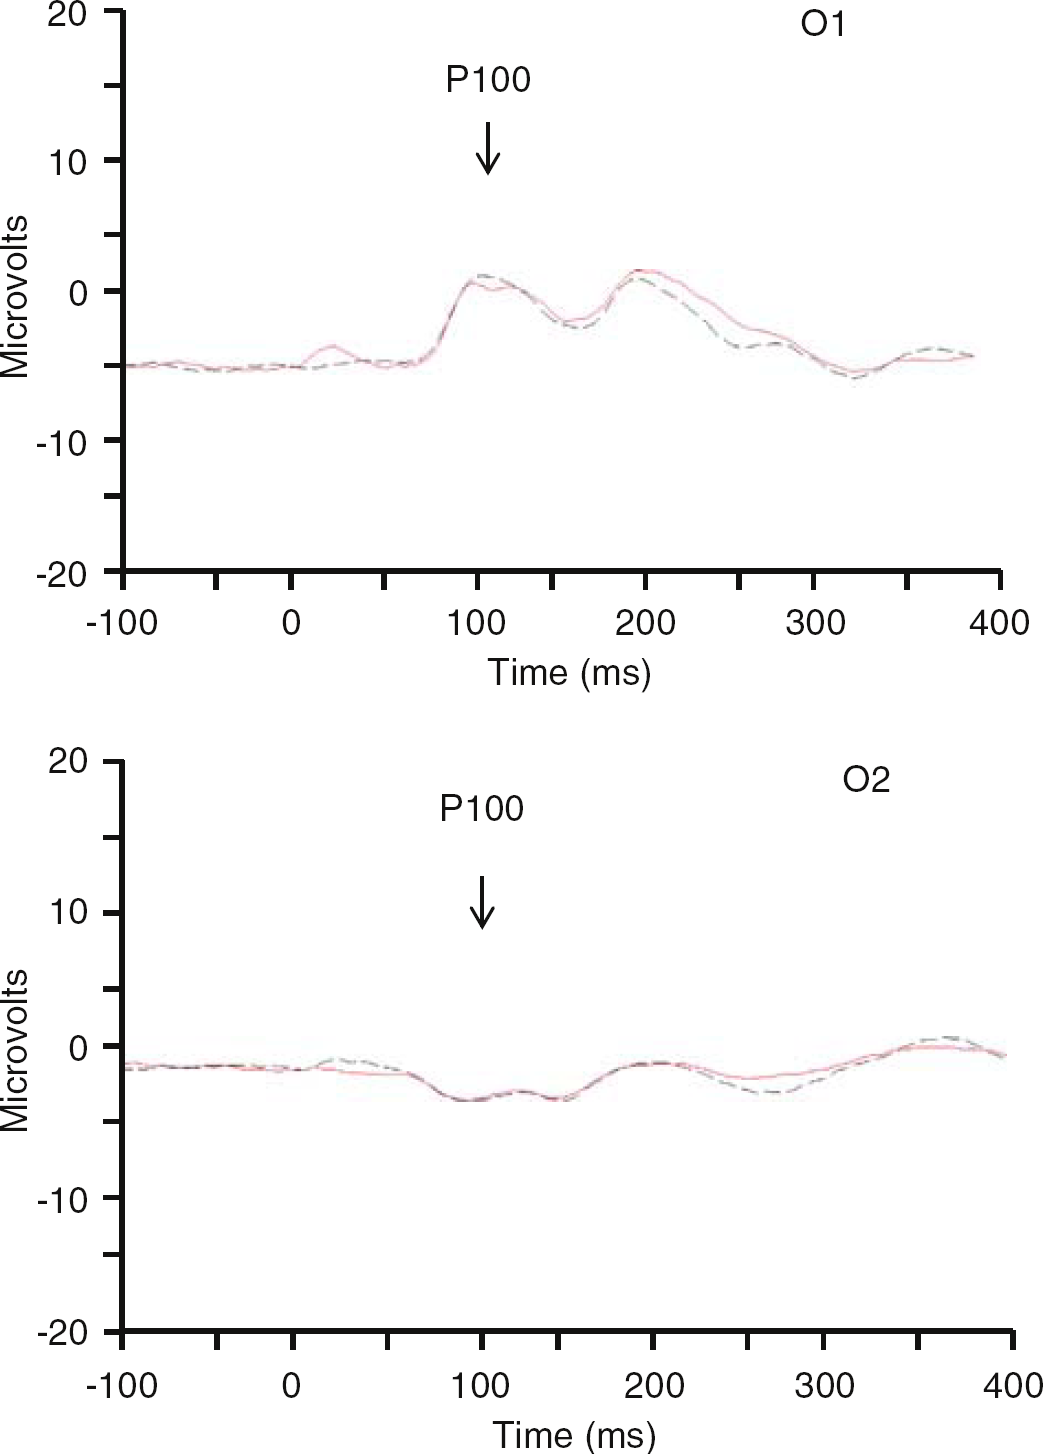
Visual evoked response potentials. 11 subjects performed the visual task when insulin was infused at 2.0 mU/kg/mins (red line) and when endogenous insulin was suppressed (black line). No differences are seen in the P100 collected in leads O1 or O2 during presentation of the task.
Discussion
We found that the BOLD response measured during the infusion of insulin was significantly lower (∼16%) than that measured when endogenous insulin was suppressed by somatostatin and that neuronal activation as measured by VEP during visual stimulation was the same in the presence and in the absence of insulin. Our observations suggest that insulin may have effects on cerebral blood flow and/or metabolism that affect the BOLD signal collected during regional activation that are independent of its effects on neuronal activation identified by VEP. These findings highlight the complexity encountered in interpreting the meaning of differences in fMRI responses between groups of subjects that differ in insulin concentration and/or insulin sensitivity.
Functional MRI has become a powerful tool in the study of in vivo cerebral function, anatomy, and physiology. The method relies on the detection of differences between the deoxyhemoglobin content of cerebral tissue that is or is not activated by a stimulus. The difference in deoxyhemoglobin content arises from the increase in blood flow and oxygen level that is known to occur in response to neuronal activation (Raichle, 2001). However, local changes in blood flow that are independent of neuronal activation may also generate a BOLD response and in our experiments it is possible that insulin had an effect on the vasculature that is independent of the cerebral tissue itself. In skeletal muscle, insulin enhances blood flow through a nitric oxide dependent mechanism (Baron et al, 1995). Nitric oxide is known to be important in cerebral function (Christopherson and Bredt, 1997), although whether insulin alters nitric oxide production in the cerebral vasculature is unknown. Insulin effects on BOLD signaling that are independent of effects on neuronal activation may be particularly important in humans, based on the recent report of (Kennan et al, 2005). In this experiment, human subjects performed a motor task during hypoglycemia and during euglycemia while maintained on the same of insulin infusion. Despite the fact that the BOLD signal measured during hypoglycemia in rats subjected to medial nerve stimulation was significantly lower than that measured during euglycemia (Kennan et al, 2000), no change was noted in the BOLD response measured during hypoglycemia and euglycemia in humans (Kennan et al, 2005). One interpretation of this observation is that the high insulin levels present under both conditions increased basal blood flow sufficiently in humans to make any reduction in BOLD during hypoglycemia undetectable.
Insulin receptors are found throughout the brain with high concentrations in the olfactory bulb, hippocampus, and hypothalamus (Marks et al, 1990; Unger et al, 1989) although low concentrations have been identified in cortical tissue (Werther et al, 1987). How insulin might modify cerebral metabolism remains unclear. Insulin enhances glucose uptake into muscle and fat through its actions on the glucose transporter GLUT 4 (Shepherd and Kahn, 1999), but this transporter is found in the brain in only small amounts (Brant et al, 1993) and most experiments performed in humans have demonstrated that glucose concentrations in the brain are not altered by insulin (Hasselbalch et al, 1999; Seaquist et al, 2001). In mechanisms independent of glucose metabolism, recent evidence suggests that insulin may regulate appetite, body weight, and hepatic glucose production through direct binding to insulin receptors in the hypothalamus (Obici et al, 2002; Porte et al, 2005). Whether insulin alters function in the visual cortex is not clear from our data because of the discrepancy between our fMRI and ERP findings. However, our results suggest that if insulin does alter cortical function, it is not through an effect on the electrical activity associated with neuronal activation.
In our experiments we found that the BOLD response measured during the step 2 of the clamp study was significantly lower than that measured during step 1, but there are variables other than insulin that could be responsible for our results. In the fMRI experiments, the study design mandated that the visual stimulation be first presented to the subjects when endogenous insulin levels were suppressed and then presented again after insulin levels were increased to physiological levels by exogenous insulin. This required that the second period of visual stimulation occur 150 mins after the start of the experiment. While subjects were taken out of the magnet between imaging periods and allowed to relax, it is possible that the subjects were not as attentive to the visual stimulus during the second period of testing as they were during the first. If so, the BOLD response would have been smaller during the second testing period, as we found. Even though all subjects reported good attention at the end of the experiment, it is possible that fatigue could have influenced our fMRI results. To avoid this variable in the ERP experiments, we elected to redesign the experiment so that the order in which subjects were presented the visual stimulus was random and would occur over two days. With this design we found that insulin administered at the same dose as in the fMRI experiments was without effect on the VEP. When insulin was administered at a higher dose and when all 29 subjects studied with both doses were combined, we still were unable to find an effect of insulin on the VEP. We interpret these findings to mean that either insulin has differential effects on responses detected by BOLD and VEP or that the observation of the reduced BOLD response during the second step in the study when insulin was administered was because of fatigue. The observation of others that the magnitude with which the fMRI response is reduced after oral glucose ingestion is significantly related to plasma insulin concentrations (Liu et al, 2000; Matsuda et al, 1999) suggests that our observations reflect the effect of insulin on BOLD rather than fatigue.
In summary, we observed that the BOLD response to a visual stimulus was significantly smaller during the infusion of insulin to achieve a physiological serum concentration as compared with the response measured when endogenous insulin secretion was suppressed. We also found that insulin was without effect on the VEP to the same visual stimulus. These observations suggest that insulin may act on factors related to cerebral blood flow and/or metabolism that are not reflected by measures of electrical activity.
Footnotes
Acknowledgements
The authors gratefully acknowledge the excellent technical assistance of Emily Schunk and Kristin Sullwold.
None of the authors have any conflicts, financial or otherwise, that might potentially bias the work.