
Abstract
Angiogenesis is induced in response to ischemia. Thrombospondin-1 (TSP-1) is a potent angiostatic factor. Silencing of TSP-1 expression may contribute to the postischemic angiogenesis. Upregulation of TSP-1, in contrast, may terminate the postischemic angiogenesis. A possible mechanism that silences TSP-1 expression is the DNA methylation of its promoter region. DNA methylation has been reported following cerebral ischemia. The present study aimed to explore whether methylation of the promoter region of TSP-1 regulates its expression after oxygen—glucose deprivation (OGD) in murine cerebral endothelial cells (CECs) in vitro. Sublethal OGD increased the extent of methylation of the promoter region of TSP-1 with a concurrent decrease in TSP-1 mRNA and protein expression in CECs. After reoxygenation, demethylation of the TSP-1 promoter region led to the restoration of TSP-1 mRNA and protein expression. The extent of methylation of the promoter region of TSP-1 was inversely correlated with the extent of TSP-1 gene expression at mRNA and protein levels after OGD. Oxygen—glucose deprivation-induced reduction in the TSP-1 mRNA level was not accompanied by a change in mRNA stability. These findings raise the possibility that OGD downregulation of TSP-1 expression is at least in part due to methylation of its promoter region.
Introduction
Angiogenesis occurs after cerebral ischemia and the extent of angiogenesis has been correlated with survival in stroke patients (Krupinski et al, 1994; Plate, 1999). However, postischemic angiogenesis is short-lived and may be terminated within weeks after ischemic insult (Lin et al, 2000, 2001; Hayashi et al, 2003). The molecular mechanism underlying postischemic angiogenesis remains to be delineated. Angiogenic activity reflects a balance between the angiogenic and angiostatic drives (Folkman, 1995; Risau, 1997; Carmeliet and Jain, 2000). Expression of angiostatic factors may contribute to the termination of postischemic angiogenesis. Thrombospondin-1 (TSP-1) is an endogenous angiostatic factor, which inhibits angiogenesis in vivo. Thrombospondin and vascular endothelial growth factor (VEGF), one of the most important angiogenic factors, were found to express usually in an inverse pattern. Exogenous VEGF induced a short-term suppression of TSP-1 expression at 4 h. This VEGF effect was reversed at 24 h (Greenaway et al, 2005; Zhang et al, 2003). On the other hand, TSP-1 completely inhibited VEGF-induced endothelial cell proliferation (Suzuma et al, 1999). Thrombospondin-1 belongs to a family of secreted, multidomain and multimeric extracellular glycoproteins that are involved in cell-to-cell and cell-to-matrix communication (Adams, 2001; Rastinejad et al, 1989). Thrombospondin-1 represents a group of trimeric proteins with each component containing an N-terminal heparin-binding domain, a linker domain enclosing two cysteine residues required for trimerization, a procollagen-homology domain, three properdin-like type I repeats, three epidermal growth factor (EGF)-like type II repeats, seven calcium-binding type III repeats and a globular C-terminal domain. It is the type I repeats in TSP-1 that confer the angiostatic action. Thrombospondin-1 inhibition of angiogenesis is linked to its ability to induce apoptotic endothelial cell death (Bornstein, 1992; Jimenez et al, 2000). Recently, biphasic expression of TSP-1 was noted after cerebral ischemia/reperfusion (Lin et al, 2003). Whether TSP-1 contributes to the termination of postischemic angiogenesis remains to be determined.
Cerebral ischemia is known to induce a multitude of altered gene expression in the ischemic brain (Kogure and Kato, 1993; Akins et al, 1996; Koistinaho and Hokfelt, 1997; Tang et al, 2003). The molecular mechanisms leading to the up- and downregulation of these genes are largely unknown. An increase in DNA methylation was noted in the ischemic brain after mild ischemia (Endres et al, 2000). DNA methylation is one of the mechanisms in the epigenetic regulation of gene expression. Methylation plays an important role in X-chromosome inactivation (Panning and Jaenisch, 1998), genomic imprinting and aging (Li et al, 1993; Richardson, 2003). Methylation of cytosine in CpG islands in the promoter region represses or silences downstream gene expression by interfering binding of transcription factors to their consensus elements. DNA methylation resulting in the repression of cancer suppressor or angiostatic genes is well documented in several types of cancer (Bird, 1992; Cooper and Krawczak, 1989; Razin, 1998). In contrast, the majority of the CpG islands were unmethylated in the promoter region of actively expressed genes (Brandeis et al, 1993).
The TSP-1 promoter region is rich in CpG islands. Hypermethylation in this region is associated with reduced expression of TSP-1 in several malignant tumor cell lines (Li et al, 1999; Ohta et al, 1999, 2003). Since cerebral ischemia has been shown to increase DNA methylation, we explored the extent of methylation of the TSP-1 promoter region in relation to TSP-1 expression. In this study, we used an in vitro paradigm of ischemia entailing oxygen-glucose deprivation (OGD) in murine cerebral endothelial cells (CECs) (Xu et al, 2000).
Materials and methods
Cerebral Endothelial Cell Culture
Cerebral endothelial cells were generated from Balb/c mouse brains. Cerebral endothelial cells were prepared and characterized as previously described (Xu et al, 1997, 2000, 2001; Yin et al, 2002). Cerebral endothelial cells were maintained in Dulbecco's modification of Eagle's medium supplemented with 10% fetal bovine serum at 37°C under 5% CO2 and were grown to 80% to 90% confluence before experiments. Cerebral endothelial cells of passages 4 to 15, which were uniformly positive for factor VIII and vimentin and exhibited the characteristic bradykinin receptors, were used in the present study.
Oxygen—Glucose Deprivation
Oxygen—glucose deprivation was conducted in a temperature-controlled (37°C ± 1°C) anaerobic chamber (Model 1025, Forma Scientific, Marietta, OH, USA) containing a gas mixture composed of 5% CO2, 10% H2, 85% N2, and 0.02% to 0.1% O2 (Goldberg and Choi, 1993; Xu et al, 2000; Yin et al, 2002). Cerebral endothelial cells were washed with deoxygenated glucose-free Hanks' balanced salt solution (HBSS, GIBCO-BRL, Carlsbad, CA, USA) and then transferred to the anaerobic chamber for 4 h. In previous studies, the extent of OGD-induced death of CECs death was dependent on the duration of OGD (Xu et al, 2000). Oxygen—glucose deprivation for 4 h is sublethal at a critical threshold for inducing pivotal signaling events. Oxygen—glucose deprivation for 4 h was therefore chosen as a model of ‘ischemia’ in vitro for assessing the extent of methylation. After OGD for 4 h, CECs were then subjected to reoxygenation by switching back to regular medium and returning to the normoxic 5% CO2/95% air incubator for 8 h. In some experiments, CECs were treated with 10 μg/ml actinomycin-D (Sigma, St Louis, MO, USA) at the onset of OGD to assess mRNA stability. Cerebral endothelial cells without OGD treatment served as the controls.
Genomic DNA Extraction and HpaII-Sensitive Polymerase Chain Reaction Assay
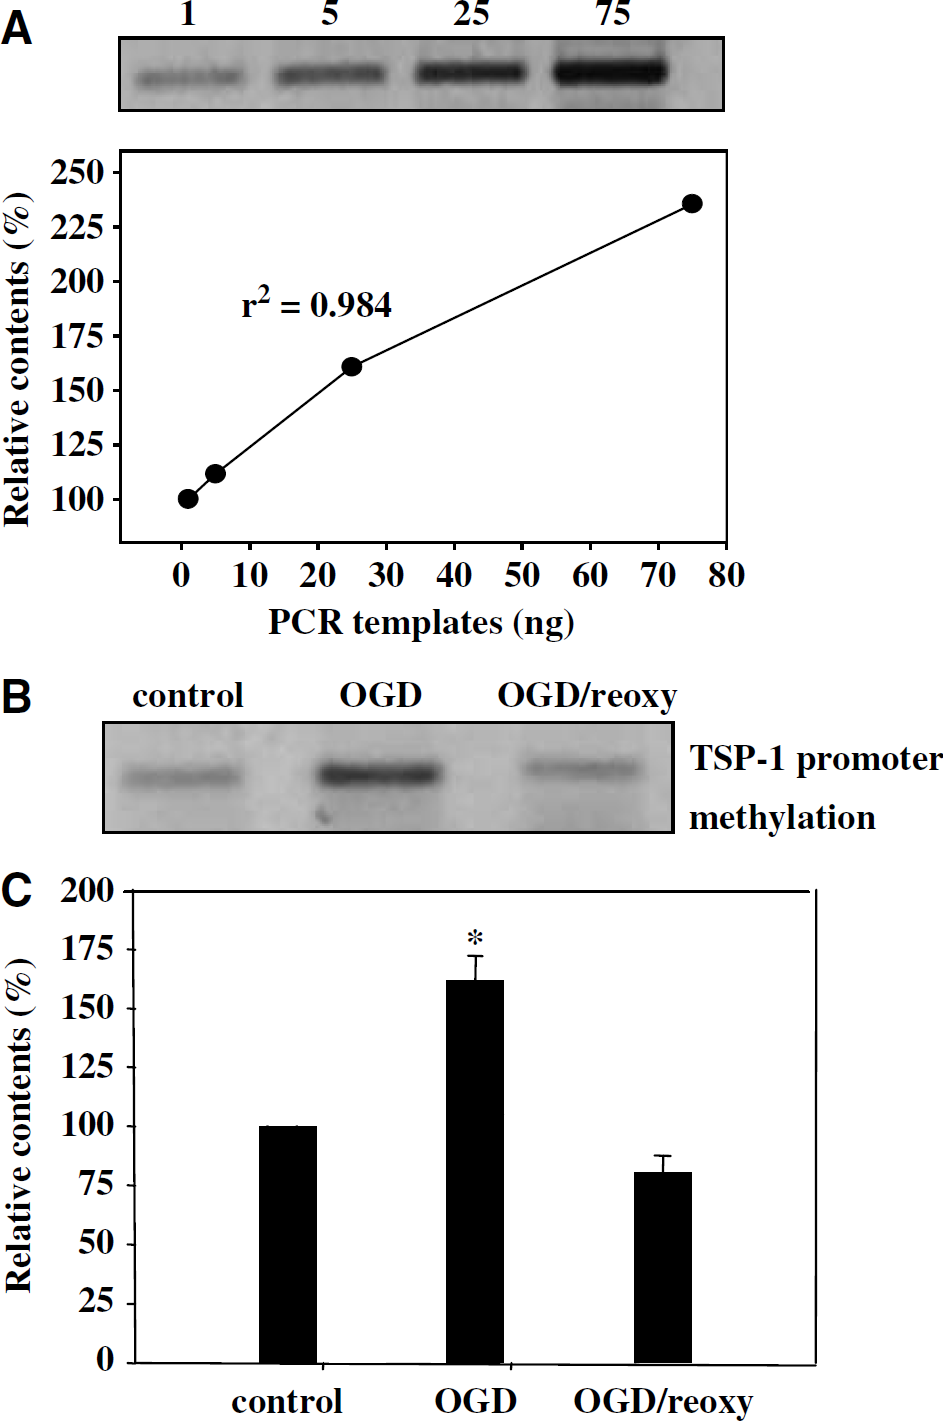
Genomic DNA was prepared from CECs by Genomic-tip 20/G kits (QIAGEN, Valencia, CA, USA). DNA concentrations were quantitatively determined by the PicoGreen (Molecular Probes, Eugene, OR, USA) method as previously described (Ahn et al, 1996; Singer et al, 1997; Chen et al, 2001). For measuring the extent of methylation on the TSP-1 promoter region, methylation-sensitive restriction enzyme, HpaII was used to cleave the non-methylated CpG sites. Therefore, the quantity of the subsequent polymerase chain reaction (PCR) product reflects the extent of methylation on the TSP-1 promoter region. DNA (2 μg) from each sample was digested with 10-fold excess of HpaII, at 37°C overnight (Pogribny et al, 1999). Digested DNA (20 ng) was subjected to PCR. The PCR protocol entailed a hot start phase at 95°C for 15 mins, followed by 26-cycle amplification: 94°C 20 secs, 52°C 30 secs, 72°C 20 secs; and 72°C 10 mins. The primer pair specific for TSP-1 promoter region was 5ʼ-CGT CTA TCC CCT GGA AAG AAC-3ʼ (forward) and 5ʼ-AGC CAC TGC CTG GAG TCA GC-3ʼ (reverse), with a predicted size of 408 bp. Pilot experiments were conducted to optimize the PCR conditions. A linear relationship was established between the quantity of HpaII-digested DNA template (1 to 25 ng) and the amount of the PCR product. HpaII-digested DNA (20 ng) that fell within the linear portion of the curve was selected as an optimal amount of the template for PCR amplification in the present study.
Methylation-Specific Polymerase Chain Reaction Assay
To confirm that methylation indeed occurred in the TSP-1 promoter region, we also performed methylation-specific PCR (Herman et al, 1996; Chen et al, 2003) to assess the extent of methylation of CpG islands in the promoter region. The positions of Exon 1, Exon 2, ATG (start codon), the CpG island density and amplified areas with the methylated (M1) and unmethylated (U1) primers within the TSP-1 promoter region are shown in Figure 1A. For methylation-specific PCR, genomic DNA was treated with NaHSO4 to convert unmethylated cytosine to uracil. This resulted in two different templates for PCR applying two different sets of primers, one specific for methylated and another for unmethylated DNA (Figure 1B). Briefly, 2 μg of genomic DNA was denatured by NaOH and then treated with 3 mol\L NaHSO4 for 16 h with a CpGenome™ DNA Modification Kit (Intergen, Purchase, NY, USA). Polymerase chain reaction was performed using aliquots of the above DNA preparations as templates. Primer sequences of the TSP-1 promoter region are: 5ʼ-TTG AGT ACG TTA AGG TTG CGT GGG C-3ʼ (forward) and 5ʼ-AAC GCT AAA ACT ACC GAT ACG CCG AA-3ʼ (reverse) for the methylated template with a predicted size of 212-bp; and 5ʼ-GGT TGA GTA TGT TAA GGT TGT GTG GGT-3ʼ forward) and 5ʼ-TAA AAA CAC TAA AAC TAC CAA TAC ACC AAA-3ʼ (reverse) for the unmethylated template with a predicted size of 230 bp. A pair of unmethylated primers for the β-actin promoter region: 5ʼ-GGG GAA GGT GAT AGT ATT GTT-3ʼ (forward) and 5ʼ-ACT ACC TCA ACA CCT CAA CC-3ʼ (reverse); with a predicted size of 193-bp were used as internal control. Each target sequence was amplified in a 25 μl reaction volume containing 0.2 μmol/L dNTP, 10 mmol/L Tris-HCl (pH 8.3), 50 mmol/L KCl, 2 mmol/L MgCl2, 0.3 μmol/L of each primer, and 0.75U of Ampli Taq Gold (Perkin-Elmer, Norwalk, CT, USA). Polymerase chain reaction amplification consisted of 35 cycles (94°C 1 min, 53°C 1 min, and 72°C 1 min) after the initial TaqGold activation step (95°C 10 mins). Polymerase chain reaction products (15 μl) were resolved on 1% agarose gel, stained with ethidium bromide and visualized under Scientific Image System (Digital Science 1D LE 3.0, Kodak, New Haven, CT, USA) with Adobe Photoshop 5.0 PCR products were quantified based on densitometry using ImageQuant 3.3 (Molecular Dynamic, Sunnydale, CA, USA).
Oxygen—glucose deprivation/reoxygenation altered the extent of HpaII-sensitive DNA methylation in the promoter region and the subsequent TSP-1 gene expression at the mRNA and protein level. (
RNA Isolation and Reverse Transcriptase-Polymerase Chain Reaction
Total RNA was isolated with an RNeasy Kit (QIAGEN). Reverse transcriptase-polymerase chain reaction was performed as previously described (Yin et al, 2002; Lin et al, 2003). Polymerase chain reaction primers for TSP-1 were 5ʼ-GGA ACG GAA AGA CAA TTC TGG-3ʼ (forward), 5ʼ-AAT GTC TTC TGG GGT GGT TCC-3ʼ (reverse); and for cyclophilin (control) were 5ʼ-ATG GTC AAC CCC ACC GTG T-3ʼ (forward), 5ʼ-CGT GTG AAG TCA CCA CCC T-3ʼ (reverse). Polymerase chain reaction reaction was conducted for 26 cycles with each cycle consisting of 94°C for 1 min, 55°C for 1 min, 72°C for 2 mins, and followed by 72°C for 10 mins. Each PCR reaction contained 50 ng RT template. Polymerase chain reaction products were resolved on 1% agarose gel for visualization and quantified as described above. Cyclophilin mRNA was also amplified in the same samples to serve as an internal control. The relative mRNA level of TSP-1 was normalized to that of cyclophilin mRNA in each sample.
Western Blotting
Western blotting was performed as previously described (Yin et al, 2002; Lin et al, 2003). Cerebral endothelial cells were sonicated in a lysis buffer and centrifuged at 3300g for 15 mins. Proteins from the supernatant (20 μg per sample) were resolved on an 8% SDS/polyacrylamide gel and transferred onto a nitrocellulose membrane. The membrane was blocked in TBST buffer containing 20 mmol/L Tris-HCl (pH 7.5), 5% nonfat milk, 150 mmol/L NaCl, and 0.05% Tween-20 for 1 h at room temperature. The membrane was incubated with a monoclonal mouse anti-TSP-1 antibody (1:100, BD Transduction Laboratories, Franklin Lakes, NJ, USA) for 2 h at room temperature. The membranes were washed with TBST and followed by a secondary antibody (donkey anti-mouse IgG conjugated with alkaline phosphatase; 1:5,000, Promega, Madison, WI, USA) at room temperature for 1 h, and then washed with TBST. The color reaction based on the Blot AP System was performed as described in the technical manual provided by the manufacturer (Promega). β-Actin was used as a control.
Statistical Analyses
Data are expressed as mean ± s.d. derived from triplicates of at least three separate experiments. Comparison between two experimental groups was based on the two-tailed Student's t-test. A value of P < 0.05 was considered significant.
Results
Oxygen—Glucose Deprivation Induced Methylation in the Thrombospondin-1 Promoter Region
To assess the extent of methylation in the TSP-1 promoter region, genomic DNA was isolated from CECs subjected to OGD/reoxygenation and then digested with a methylation-sensitive restriction enzyme, HpaII. HpaII digests only those CpG sites without methylation. The methylated TSP-1 promoter region that resisted HpaII digestion then served as the template for the PCR assay. Thus, an increase in the extent of methylation results in an increase in the quantity of the PCR product based on the DNA template that resists HpaII digestion. Pilot experiments were conducted to ensure a linear relationship between the quantity of HpaII-digested DNA template (1 to 25 ng) and the amount of the PCR product (Figure 2A). Cerebral endothelial cells subjected to 4 h OGD showed a drastic increase in the content of the PCR product derived from the methylated template, reflecting an increase in the extent of DNA methylation in the TSP-1 promoter region (Figure 2B). The PCR product derived from the methylated template declined to pre-OGD levels following reoxygenation (Figure 2B), suggesting methylation of the TSP-1 promoter region during OGD was reversible. Figure 2C shows compiled results from three separate experiments.
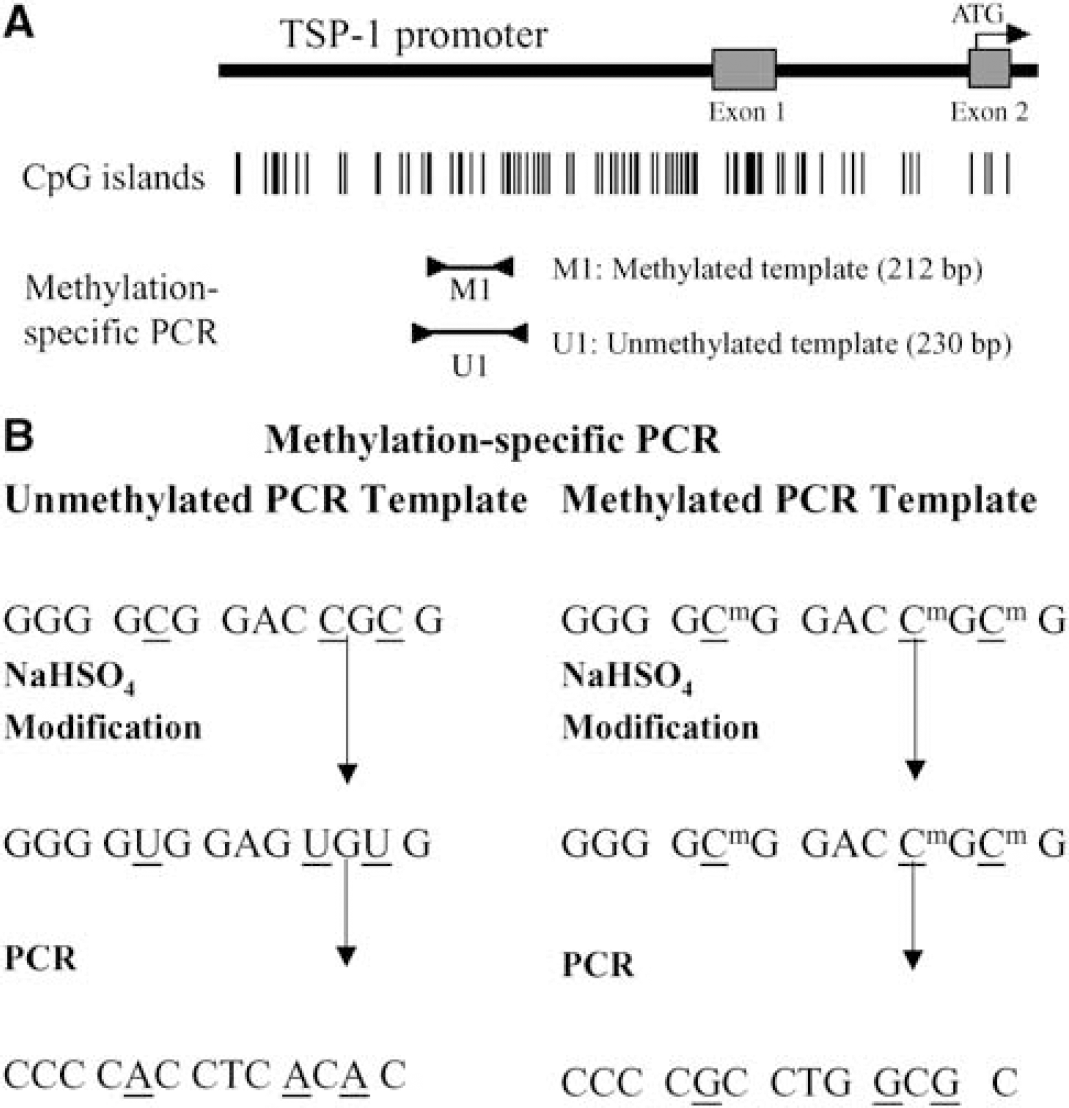
Schematic illustration of methylation specific PCR. (
Methylation-Specific Polymerase Chain Reaction Confirmed Oxygen—Glucose Deprivation-Induced CpG Island Methylation in the Thrombospondin-1 Promoter Region
Methylation occurs selectively in CpG islands of the promoter regions, resulting in epigenetic alteration of gene expression. We used methylation-specific PCR to confirm CpG islands methylation in the TSP-1 promoter region. Cerebral endothelial cells subjected to 4 h OGD displayed an increase in the extent of methylation in CpG islands in the TSP-1 promoter region, as reflected by an increase in the M1 PCR product derived from the methylated primers and a concurrent decrease in the PCR product (U1) derived from the unmethylated primers. The extent of CpG island methylation declined to the pre-OGD levels, while the extent of unmethylation of CpG islands increased to the pre-OGD level following 8h of reoxygenation (Figure 3A). Under OGD, an increase in the extent of methylation was accompanied by a reduction in the degree of unmethylation of the TSP-1 promoter region in the same samples. On reoxygenation, reduced methylation was associated with increased unmethylation in TSP-1 promoter region. Compiled data from three separate experiments are shown in Figure 3B.
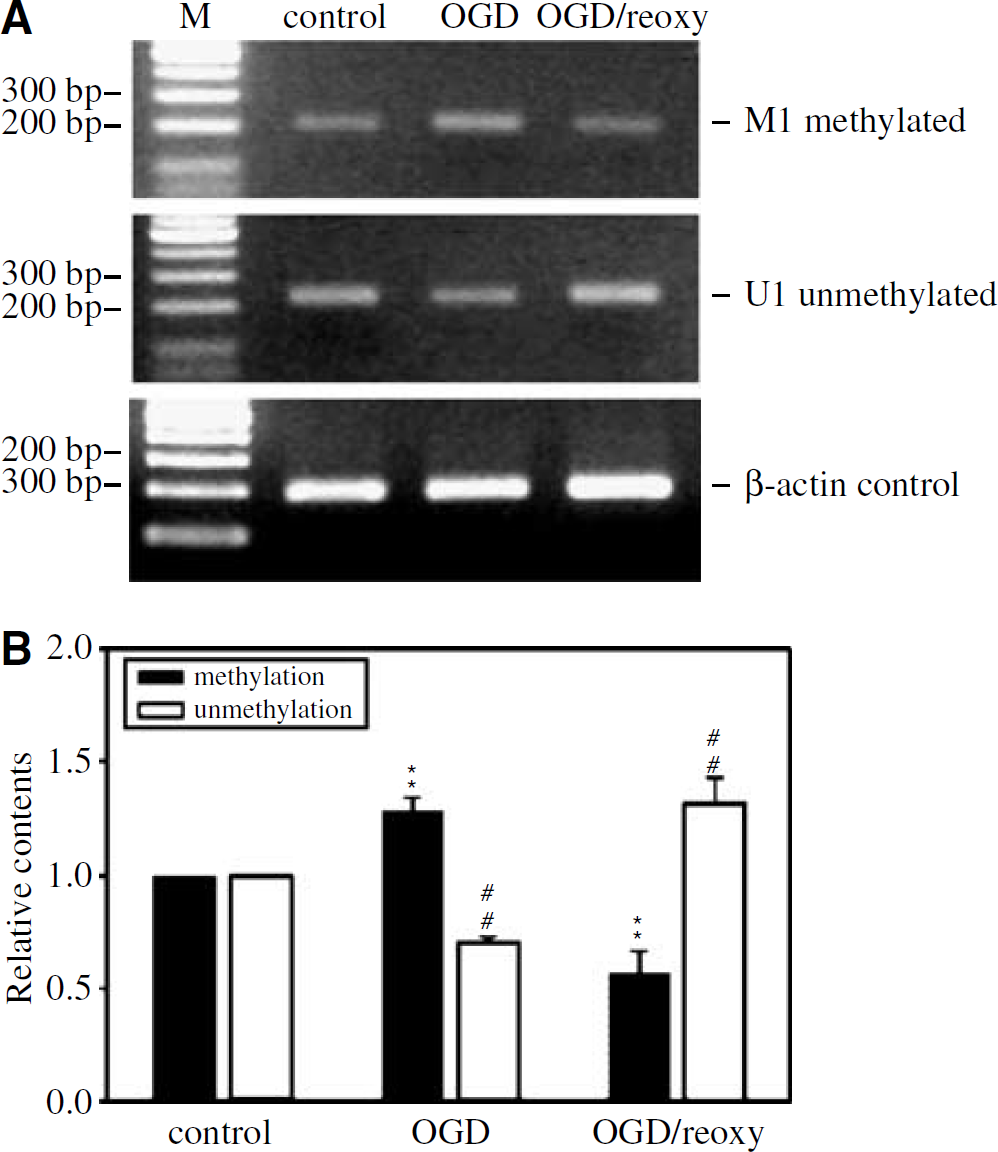
Changes in CpG island methylation in the TSP-1 promoter region after OGD/reoxygenation assessed by the methylation specific PCR. The amount of methylation-specific PCR product was increased with a concurrent decrease in the unmethylated product after 4 h of OGD. Following reoxygenation for 8 h, the relative quantities of methylated and unmethylated PCR products were reversed. An internal control using β-actin as a template showed no changes under OGD or on reoxygenation (
Oxygen-Glucose Deprivation Inhibited the Expression of Thrombospondin-1 mRNA and Protein
We assess the extent of TSP-1 expression at the mRNA and protein levels in relation to the extent of methylation of the TSP-1 promoter region. There was a significant reduction in TSP-1 mRNA (Figures 4A and 4B) and protein (Figures 4C and 4D) levels after 4 h of OGD when the TSP-1 promoter region was heavily methylated. Restoration of TSP-1 mRNA and protein levels were noted after subsequent reoxygenation for 8 h when methylation of the TSP-1 promoter region was reversed. An inverse correlation between the extent of methylation of the TSP-1 promoter region and TSP-1 mRNA level is shown in Figure 4E: under OGD, an increase in methylation of the TSP-1 promoter region was accompanied by a reduction in TSP-1 mRNA expression; on reoxygenation, reduced methylation was associated with an increase in TSP-1 mRNA expression. The mechanism in regulating TSP-1 expression remains to be fully explored. However, data presented in Figure 4 suggest the possibility that the extent of methylation of the TSP-1 promoter region may be inversely related to the extent of tsp-1 mRNA expression. These two variables under three sets of conditions (basal, OGD for 4 h and reoxygenation for 8 h) were plotted and showed an approximate linear relationship (data not shown).
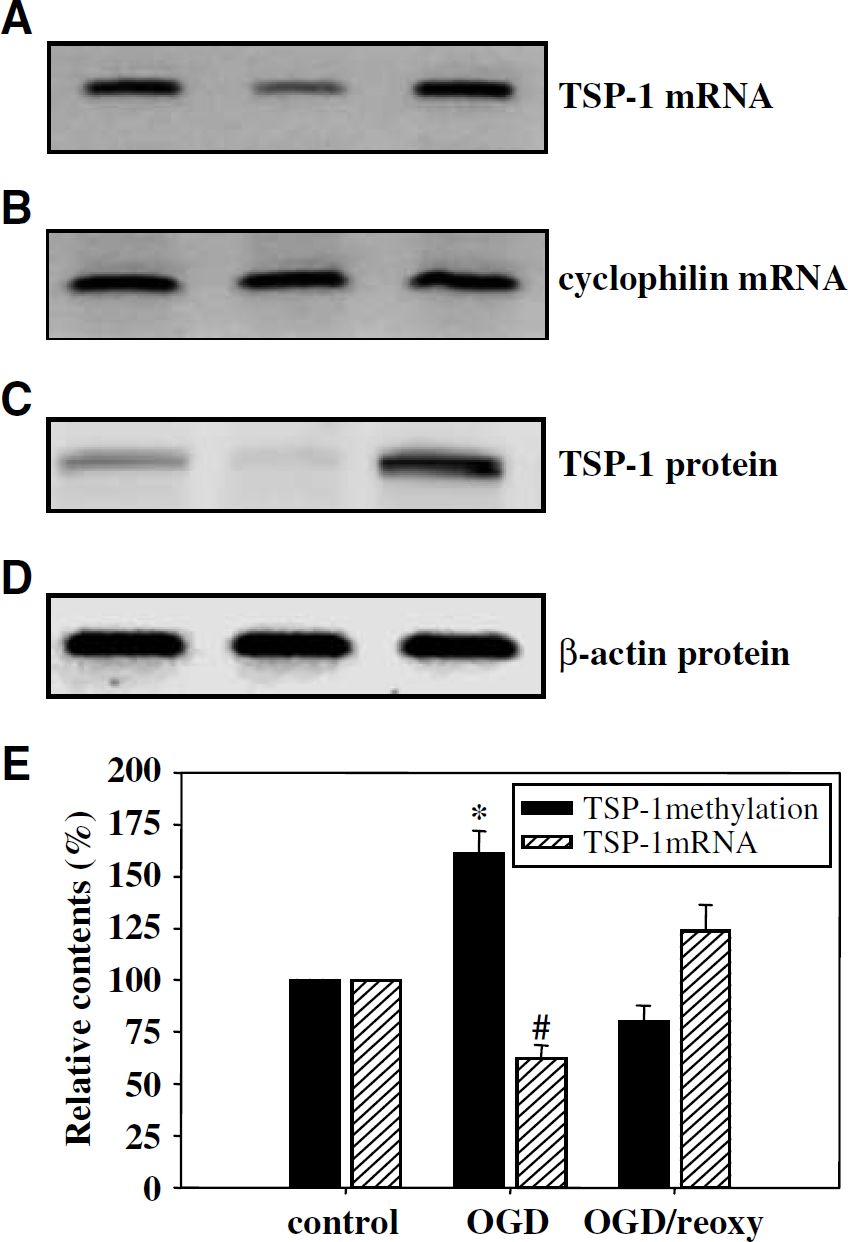
Thrombospondin-1 mRNA and protein levels were surveyed by RT-PCR and Western blotting, respectively. Note that (
Oxygen—Glucose Deprivation had no Effect on Thrombospondin-1 mRNA Stability
Results from these studies raise the possibility that OGD suppressed TSP-1 expression by increasing methylation of its promoter region. At a given time, the amount of mRNA is a net result of its synthesis and degradation. To determine whether OGD altered mRNA stability, leading to an apparent alteration of TSP-1 mRNA levels, CECs with and without OGD were treated with actinomycin D, a universal inhibitor of transcription, with TSP-1 mRNA levels monitored over time. Results indicate that OGD did not alter the stability of TSP-1 mRNA (Figure 5).
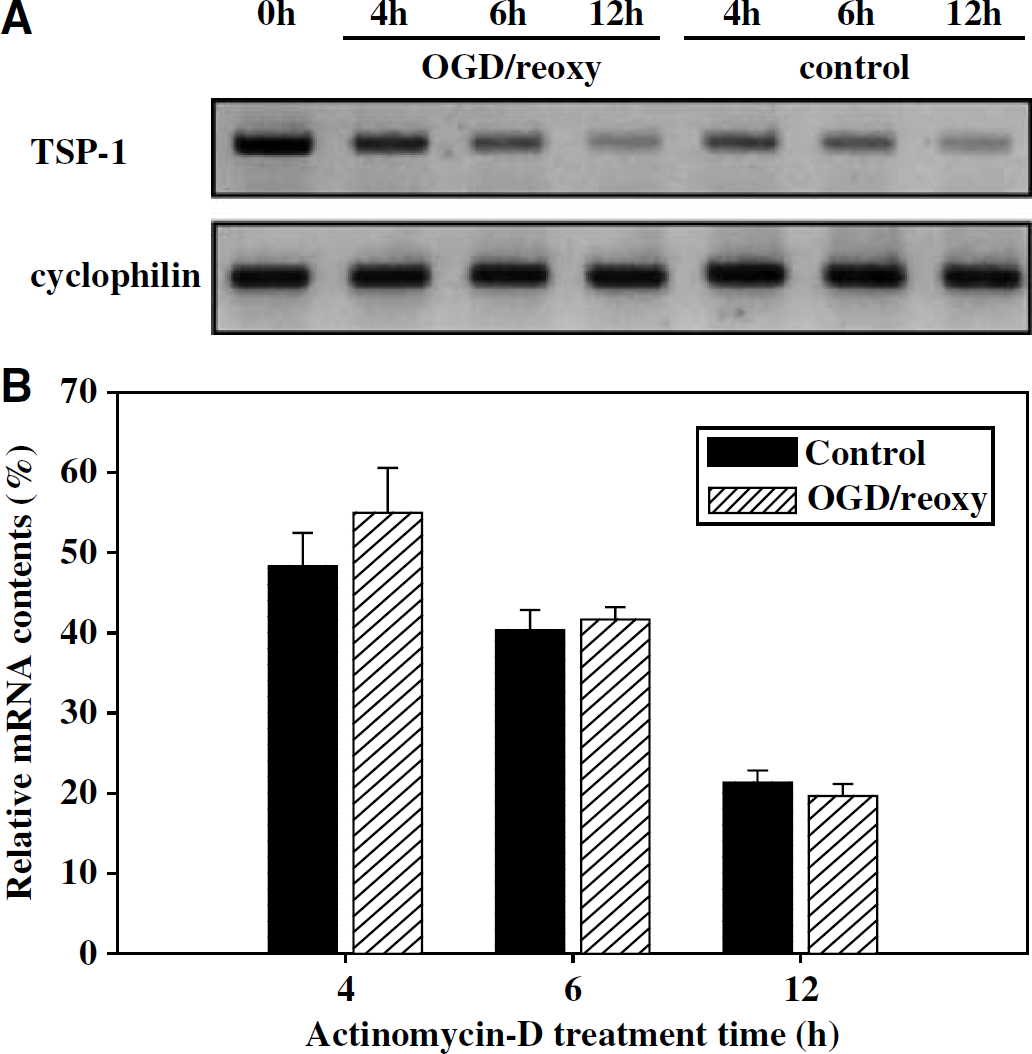
Effect of OGD/reoxygenation on TSP-1 mRNA stability assessed by RT-PCR. Cerebral endothelial cells were subjected to 4 h OGD (4h), 4 h ODG + 2 h reoxygenation (6 h), or 4 h OGD + 8 h reoxygenation (12 h) in the presence or absence of 10 μg/ml actinomycin-D. Fresh actinomycin-D was added into medium on OGD; the control groups were also replaced with medium containing fresh actinomycin-D. (
Discussion
Oxygen—glucose deprivation-induced increase in methylation in the TSP-1 promoter region has been demonstrated by two separate methods: methylation-sensitive restriction and methylation-specific PCR assays. Oxygen—glucose deprivation-induced methylation in the TSP-1 promoter region was accompanied by a decrease in TSP-1 expression at both the mRNA and protein levels. Reversal of methylation occurred after reoxygenation. This was associated with a restoration of the expression of TSP-1 at both mRNA and protein levels. Further studies are needed to elucidate the mechanism by which methylation regulates TSP-1 expression. The notion that the extent of methylation of the TSP-1 promoter region was inversely related to the extent of TSP-1 mRNA expression in an approximate linear relationship suggests that methylation is an important mechanism in regulating TSP-1 expression.
Oxygen—glucose deprivation-induced repression of the TSP-1 gene could be caused by either a decrease in the transcription rate or an increase in the mRNA degradation. For example, hypoglycemia-induced downregulation of proangiogenesis factors, such as VEGF, is due to an increase in mRNA degradation (Stein et al, 1995). To determine whether an alteration of mRNA stability could contribute to the apparent TSP-1 repression in CECs under OGD, we examined the levels of TSP-1 mRNA over time in the presence of a universal transcriptional inhibitor, actinomycin-D, in CECs with or without OGD. Results show that OGD did not change the degradation rate of TSP-1 mRNA. This finding suggests that OGD-induced TSP-1 repression is likely to be regulated at the transcriptional level.
DNA methylation in the promoter region has been shown to be an important epigenetic mechanism to regulate the expression of selected genes (Bird, 1992). Methylation-induced alteration in gene expression is mostly related to the transcriptional processes caused by direct interactions between methyl group tags and transcription factors or other regulatory proteins (e.g., methylcytosine binding proteins (MeCPs)), steric hindrance of protein-DNA interactions or alteration of the nucleosome and chromatin structure (Boyes, 1992 and Bird, 1992; Pennings et al, 2005).
Ischemia induced biphasic TSP-1 expression (Lin et al, 2003). The expression of TSP-1 appears inversely coupled to the progression of ischemia-induced angiogenesis. Thrombospondin-1 was upregulated during early reperfusion periods when low activity of angiogenesis was noted. Thrombospondin-1 level was then reduced to basal levels while angiogenesis reached its peak (Lin et al, 2000, 2001, 2002, 2003). Hayashi et al (2003) showed similar inverse relationship between TSP-1 expression and angiogenesis. Thrombospondin-1 is a matricellular glycoprotein that modulates cellular behaviors and the structure of extracellular matrix. It suppresses angiogenesis by inhibiting migration and inducing apoptosis of endothelial cells. Thrombospondin-1 also inhibits the activation of matrix metalloproteinases (MMPs), resulting in the stabilization of the extracellular matrix. This TSP-1 action on MMPs limits the liberation of VEGF from matrix for the well-known VEGF receptor actions on endothelial cells (Lawler, 2002). Anoxia also down-regulated TSP-1 expression in human glioblastoma cells in vitro (Tenan et al, 2000).
Oxidative stress, which results in formation of oxygen radicals, plays an important role in ischemic brain damage (Chan, 1996). Oxygen radicals may also be involved in DNA methylation (Cerda and Weitzman, 1997). Our findings in vitro did not provide enough experimental evidence to support oxidative stress induces DNA methylation but they did raise the possibility that methylation may contribute to the modulation of angiogenesis via an epigenetic regulatory mechanism on TSP-1. An increase in DNA methylation was noted in the ischemic brain after mild ischemia (Endres et al, 2000). Biphasic expression of TSP-1 (Lin et al, 2003) in relation temporally to an increase and resolution of angiogenesis following focal cerebral ischemia (Lin et al, 2000, 2001) raises the possibility that ischemia-induced methylation and the subsequent reversal of methylation following reperfusion may be an underlying mechanism for up- and down-regulating TSP-1 expression, leading to evolving changes in angiogenesis after focal cerebral ischemia. Further studies are needed in vivo to confirm this contention.
In conclusion, we have demonstrated that OGD and reoxygenation in CECs increased and decreased the extent of methylation of the TSP-1 promoter region with concurrent repression and restoration of TSP-1 gene expression, respectively. These findings suggest that methylation and demethylation of the TSP-1 promoter region may be a dynamic epigenetic mechanism to regulate angiogenic processes following cerebral ischemia.
The mechanism of DNA methylation induced by OGD/reoxygenation remains to be further explored in future studies.