
Abstract
A single-tissue compartment model with plasma input is the established method for analysing [11C]flumazenil ([11C]FMZ) studies. However, arterial cannulation and measurement of metabolites are time-consuming. Therefore, a reference tissue approach is appealing, but this approach has not been fully validated for [11C]FMZ. Dynamic [11C]FMZ positron emission tomography scans with arterial blood sampling were performed in nine drug-free depressive patients and eight healthy subjects. Regions of interest were defined on co-registered magnetic resonance imaging scans and projected onto dynamic [11C]FMZ images. Using a Hill-type metabolite function, single (1T) and reversible two-tissue (2T) compartmental models were compared. Simplified reference tissue model (SRTM) and full reference tissue model (FRTM) were investigated using both pons and (centrum semiovale) white matter as reference tissue. The 2T model provided the best fit in 59% of cases. Two-tissue VT values were on average 1.6% higher than 1T VT values. Owing to the higher rejection rate of 2T fits (7.3%), the 1T model was selected as plasma input method of choice. SRTM was superior to FRTM, irrespective whether pons or white matter was used as reference tissue. BPND values obtained with SRTM correlated strongly with 1T VT (r = 0.998 and 0.995 for pons and white matter, respectively). Use of white matter as reference tissue resulted in 5.5% rejected fits, primarily in areas with intermediate receptor density. No fits were rejected using pons as reference tissue. Pons produced 23% higher BPND values than white matter. In conclusion, for most clinical studies, SRTM with pons as reference tissue can be used for quantifying [11C]FMZ binding.
Keywords
Introduction
[11C]Flumazenil is one of the best-characterised positron emission tomography (PET) ligands. It is a selective, reversibly bound, high-affinity neutral antagonist of the benzodiazepine site of the γ-aminobutyric acid (GABAA)—receptor, showing rapid uptake and a high specific to nonspecific binding ratio in human brain (Samson et al, 1985). Neither of its two labelled hydrophilic metabolites in human plasma, [11C]Ro 15-3890 and [11C]Ro 15-7965, cross the blood—brain barrier and therefore the PET signal is solely due to [11C]flumazenil ([11C]FMZ; Debruyne et al, 1991).
Previous studies (Holthoff et al, 1991; Koeppe et al, 1991; Lassen et al, 1995) have shown that kinetics of [11C]FMZ binding can best be quantified using the total volume of distribution VT (throughout this paper the consensus nomenclature published by Innis et al (2007) will be used), obtained using a single-tissue compartment model with plasma input. Although VT contains a nonspecific component, it has been estimated that this is of the order of 10% (Delforge et al, 1995; Lassen et al, 1995), at least within the normal brain.
In evaluating [11C]FMZ binding, the majority of clinical brain studies (Richardson et al, 1997; Malizia et al, 1998; Lloyd et al, 2000; Koepp et al, 2000; Hammers et al, 2002) have used parametric approaches, mainly spectral analysis (Cunningham and Jones, 1993) or pixel-by-pixel weighted integration (Frey et al, 1991), depicting cerebral ligand transport and receptor binding.
Clearly, when evaluating the effects of therapy, [11C]FMZ studies should be analysed using the most accurate tracer kinetic model. Although both aforementioned methods simplify the computations, they do not obviate the need for arterial cannulation, nor exclude the workload associated with measuring plasma metabolites.
As a result, in practice, studies using a reference tissue approach have been reported (Abadie et al, 1992, 1999; Lucignani et al, 2004; Bouvard et al, 2005). Both pons and white matter have been proposed as reference tissues (Persson et al, 1989; Abadie et al, 1992), but both can be criticised. The pons is a small structure, which might have partial volume effects. In addition, it has been stated that the pons is not totally devoid of receptors (Lammertsma et al, 1993a; Delforge et al, 1995; Lassen et al, 1995; Millet et al, 2002). On the other hand centrum semiovale white matter could have spillover from cortical grey matter radioactivity. It can be questioned whether the level of nonspecific binding is the same in grey and white matter, a requirement for the use of reference tissue models (Lammertsma et al, 1996). Therefore, the main purpose of this study was to assess whether use of a reference tissue model would be an option for analysing clinical [11C]FMZ studies. This assessment requires a comparison with the optimal plasma input model.
Materials and methods
Subjects
Nine drug-free patients (4 men; mean age±s.d. 39±11, range 23 to 54 years) with a major depressive episode according to DSM-IV (1994) were recruited from an outpatient psychiatric clinic. Patients were age-matched with eight healthy control subjects without present or past history of psychiatric illness (5 men, mean age 32±8, range 22 to 42 years).
Informed consent was obtained from all participants. The study protocol was approved by the medical ethics committee of the VU University Medical Centre. Subjects were excluded if they experienced somatic disorders or used drugs that are known to interfere with the GABAergic system, including benzodiazepines, psychoactive drugs, and alcohol abuse. Patients had to be free of antidepressants and benzodiazepines for at least 3 months and 2 weeks, respectively, at the time of PET scanning. Six patients were drug naive and had their first major depression. All patients and controls had standard physical and laboratory examinations.
Scan Protocol
Before scanning, an arterial line was inserted into a radial artery under local anaesthesia (xylocaine 1%, 1 mL). Subjects were then transferred to the scanner room and studied at rest, in supine position, with ears unplugged using an ECAT EXACT HR+ scanner (Siemens/CTI, Knoxville, TN, USA). First, a 10-min two-dimensional transmission scan was acquired using rotating 68Ge/68Ga sources. This scan was used to correct the subsequent emission scan for tissue attenuation. Next, a dynamic three-dimensional scan (16 frames with progressively increasing frame length) with a total duration of 60 mins was acquired, after bolus injection of 370±45 MBq [11C]FMZ with a specific activity of 62±20 GBq/μmol.
During the scan, arterial whole blood was monitored continuously using an on-line detection system (Boellaard et al, 2001). In addition, discrete samples were taken at 2.5, 5, 10, 20, 30, 40, and 60 mins. These were used for calibrating the (on-line) blood sampler, for measuring plasma/whole-blood ratios, and for determining metabolite fractions, enabling the generation of a metabolite-corrected plasma input curve. Fractional concentrations of hydrophilic metabolites and unchanged (lipophilic) [11C]FMZ were determined by solid-phase extraction of plasma followed by high-performance liquid chromatography (Luthra et al, 1993). All subjects underwent a T1-weighted structural magnetic resonance imaging scan, using a 1.5T Sonata MR system (Siemens, Erlangen, Germany).
Image Processing
Images were reconstructed using FORE + two-dimensional filtered back projection (FBP), applying a Hanning filter with a cutoff at 0.5 of the Nyquist frequency. Images consisted of 63 planes of 256 × 256 voxels of 1.2 × 1.2 × 2.4 mm3 with a reconstructed image resolution of approximately 7 mm. Image analysis was performed with CAPP software provided by the manufacturer (CTI/Siemens) on SUN workstations (Sun Microsystems, Mountain View, CA, USA). First, magnetic resonance imaging scans were co-registered with summed [11C]FMZ images (10 to 60 mins p.i.) (Maes et al, 1997; West et al, 1997). Next, regions of interest (ROIs) were manually defined on these co-registered magnetic resonance imaging scans on consecutive planes, in cranial-caudal order, starting with the plane in which the diameter of the cerebrum no longer increased in width and ending in the plane where either the cerebellum or the temporal poles were no longer visible, using the anatomical atlas of Duvernoy et al (1999). The following structures were included: anterior, ventrolateral, dorsolateral and orbitomedial prefrontal cortex, anterior and posterior cingulate, medial and lateral temporal lobe and insular area, parietal and occipital area, cerebellum, hippocampus, putamen, and thalamus. Pons and centrum semiovale white matter were selected as reference tissue ROIs (Figure 1). In the remainder of this paper, centrum semiovale white matter will be denoted as white matter.
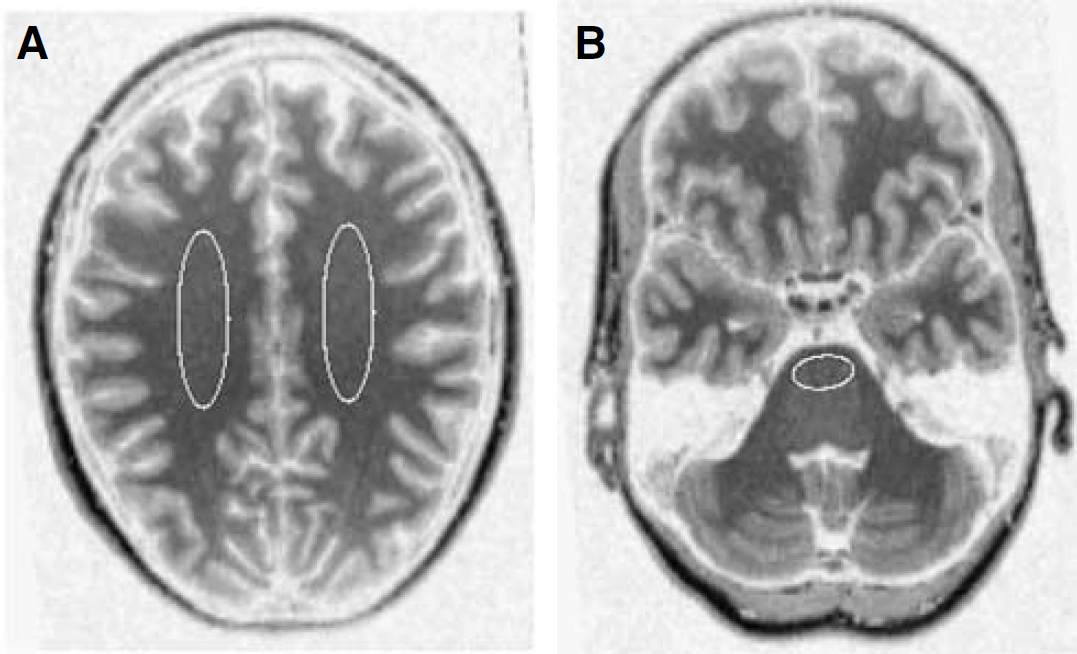
Examples of reference tissue ROIs for (
Finally, ROIs were projected onto the dynamic [11C]FMZ images, generating time—activity curves for each region.
Fitting Procedure
Nonlinear least-square fits were performed using the fmins function as included in the Matlab 5.3 optimization toolbox (The Mathworks, Natick, MA, USA), applying the Nelder—Mead simplex method, with a maximum number of function evaluations of 400 times the number of parameters and a termination tolerance of 10−4.
Data Analysis
Plasma input models: To derive a metabolite-corrected input function from the measured whole-blood curve, the metabolite data obtained from the discrete samples need to be interpolated by fitting an appropriate function to these data. In most studies, a multiexponential function has been used. The main problem associated with a multiexponential function is the rather poor description of early time points, where the multiexponential is ‘steeper’ than the actual ingrowth of labelled metabolites (Lammertsma et al, 1993b). A more physiologic description of the early time course of these metabolites is given by a Hill function, as first shown by Gunn et al (1998) for [carbonyl-11C]WAY-100635. The Hill function describes the metabolite fraction data m(t) by

where α, β, and γ are fit parameters, and t is the time after injection. Recently, simulations indicated improved accuracy and precision for VT of [11C]FMZ when using a Hill function rather than a multiexponential function (Lubberink et al, 2004).
A change in metabolite correction will affect the final-derived metabolite-corrected plasma input function and, consequently, also both single- (1T) and two-tissue (2T) fits, potentially affecting the relative preference of both models. Therefore, in this study, a formal comparison between 1T (two rate constants) and 2T (four rate constants) models (both with an additional parameter for blood volume) was repeated. Because of the large variability in binding potential (BPND), together with the presence of many nonphysiologic values, VT was also chosen as a parameter of outcome for the 2T model.
For the comparison of 1T and 2T model fits, only data that fulfilled strict quality control criteria were used. VT results for either model were not used when the (fitted) standard error of VT was larger than 25% or when the fit did not converge. The cutoff value of 25% was chosen arbitrarily. The number of rejected fits was, however, insensitive to the actual cutoff value used. Changing this value from 25 to 50% had no effect on the 1T model and decreased the number of rejected fits for the 2T model by only 0.7%. If VT values were available for both 1T and 2T models, they were compared using Akaike (1978) and Schwarz (1978) criteria. Final assessment was based on both acceptance rate and Akaike/Schwarz criteria.
Reference tissue models: Both full reference tissue model (FRTM, four parameters; Hume et al, 1992; Lammertsma et al, 1996) and simplified reference tissue model (SRTM, three parameters; Lammertsma and Hume, 1996) were investigated using both pons and (centrum semiovale) white matter as reference tissues.
The comparison between FRTM and SRTM was performed in an identical manner as for the 1T and 2T models, except that for the reference tissue models BPND (rather than VT) was used as the parameter of interest.
Finally, 1T and 2T models were compared with SRTM and FRTM using correlation analysis.
Results
Plasma Input Models
Figure 2 shows a typical example of plasma metabolite fits using multiexponential (Figure 2A) and Hill (Figure 2B) functions. It is clear that the Hill function provides a significantly better fit through the metabolite data, especially at early time points. According to the Akaike criterion, the Hill function yielded significantly better metabolite fits than the multiexponential function for all subjects (mean Akaike number −50 versus −28, respectively; P < 0.0001). Therefore, in the remainder of this study, only the Hill function was used to fit the metabolite data.
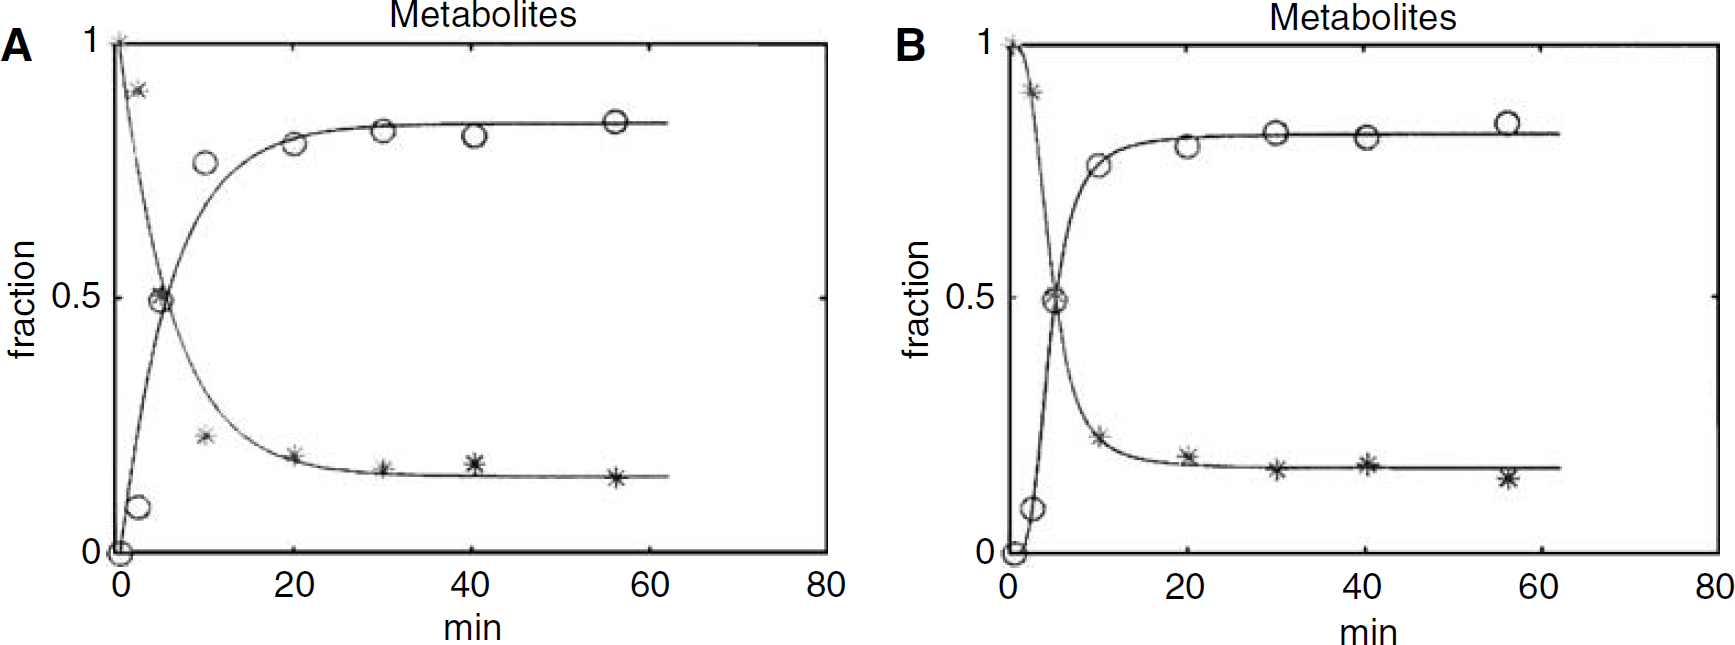
Typical [11C]FMZ metabolite fits using (
According to Akaike and Schwarz criteria alone, the 1T model was preferred in 38% of the fits across all structures (and subjects) investigated (Table 1). For structures with minor (white matter, pons) or intermediate (thalamus, putamen) levels of receptors, there was a stronger preference for the 1T model.
Comparison of 1T and 2T models
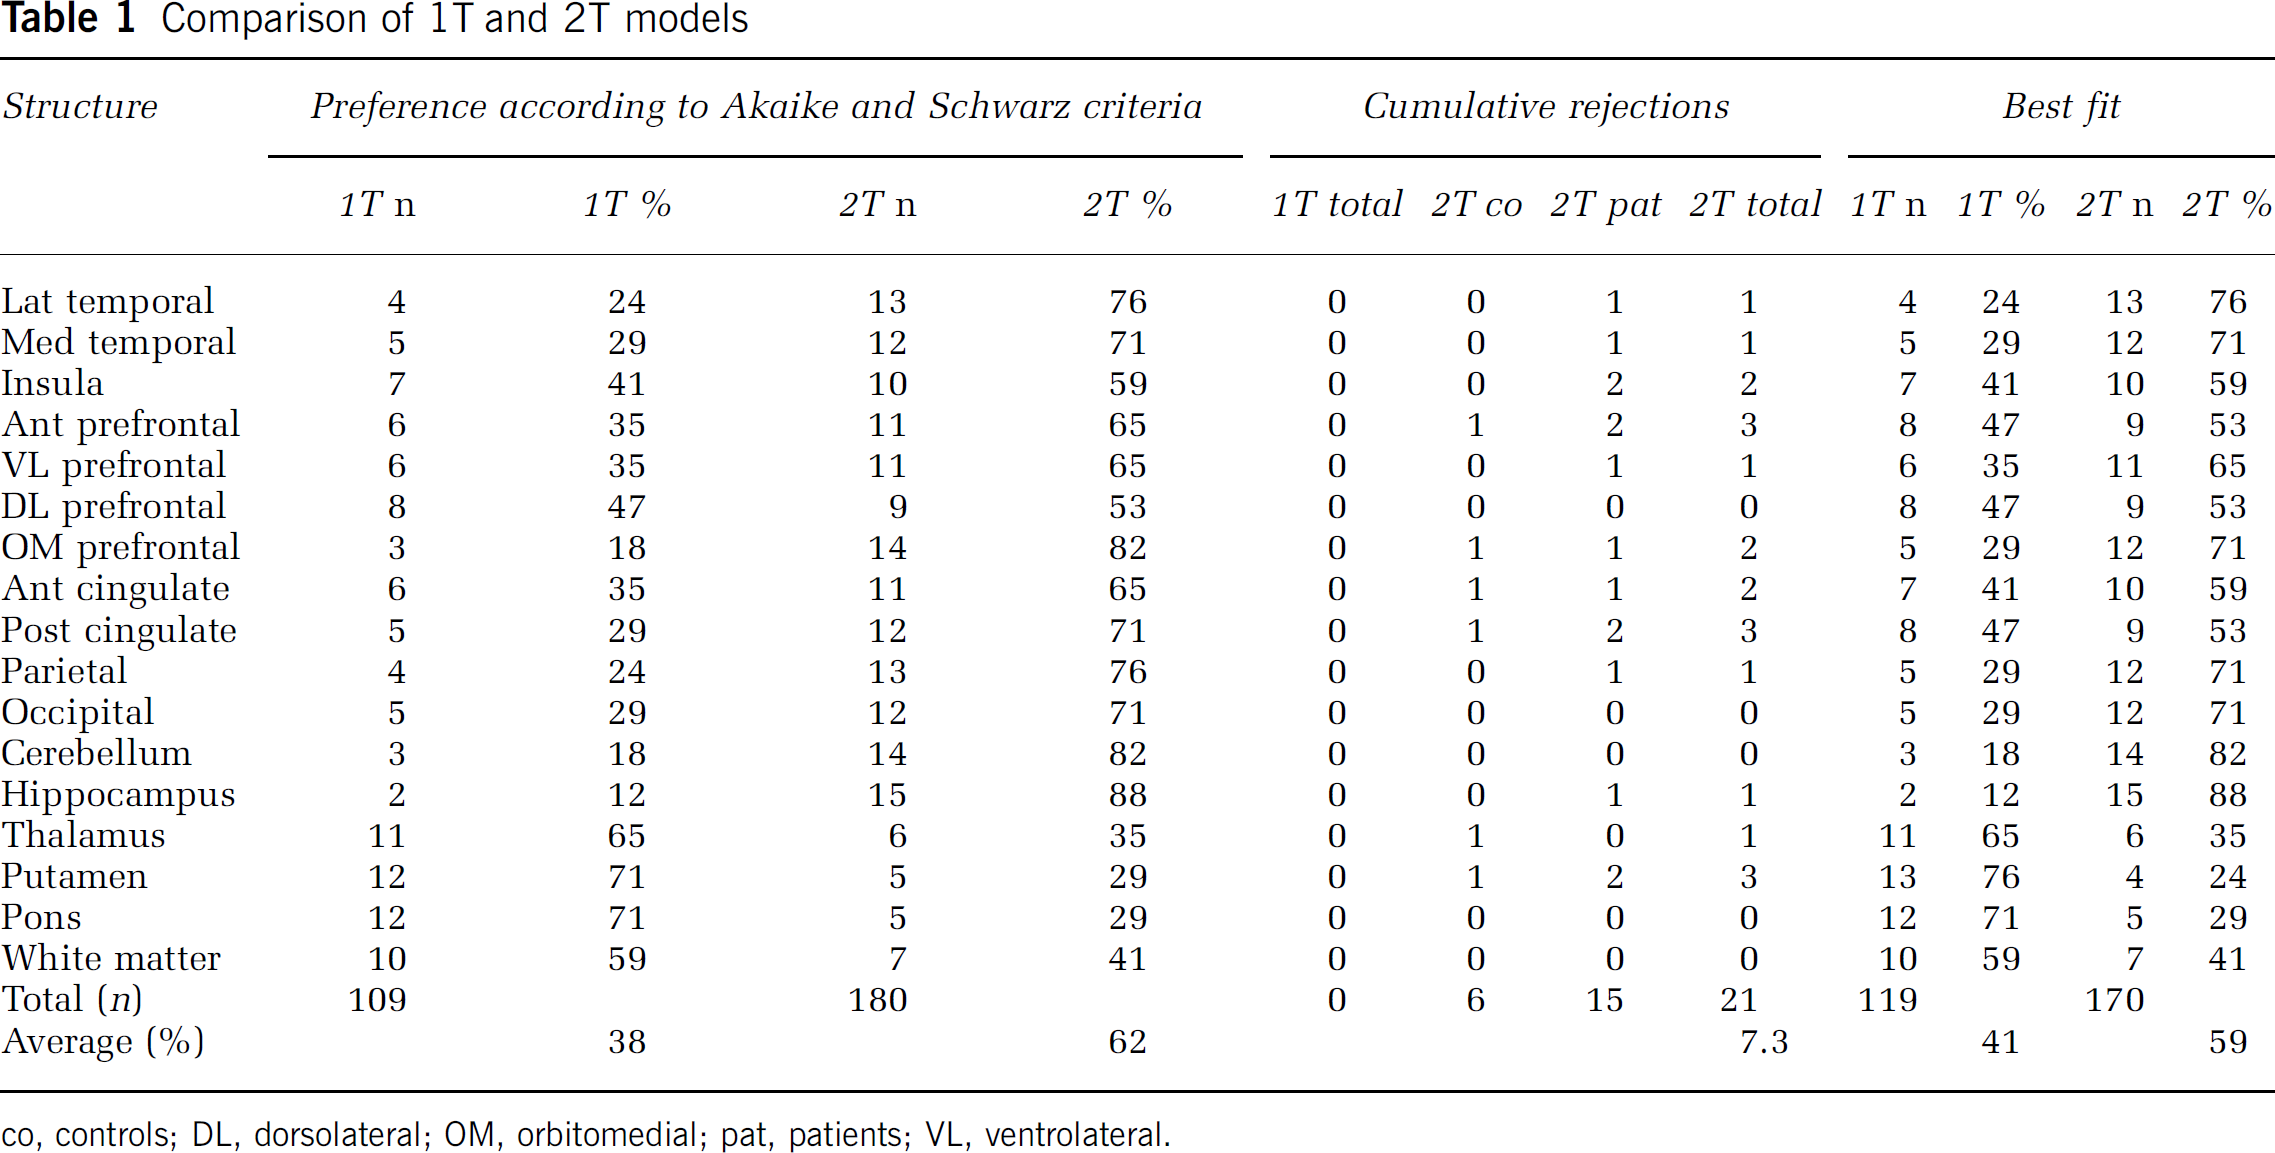
co, controls; DL, dorsolateral; OM, orbitomedial; pat, patients; VL, ventrolateral.
All 1T fits were of satisfactory quality and none had to be rejected. In contrast, 21 of the 272 2T fits (i.e., 7.3%; Table 1) fulfilled the rejection criteria, with a slightly higher number of rejections in the patient group (15) than in the normal controls (6). When left and right hemisphere data were analysed independently, similar rejection rates were observed (data not shown).
When Akaike and Schwarz results were corrected for rejected fits, the 1T model was preferred in 41% of the fits (across structures and subjects) and the 2T model in 59%.
Average (±s.d.) VT values for the various structures, obtained with both 1T and 2T model fits, are shown in Table 2. To compare methods, only those VT values were used where both 1T and 2T models provided reliable fits (ratio 2T/1T). VT values obtained with the 2T model were on average 1.6% higher than those obtained with the 1T model (Table 2) with a strong linear correlation between the two (Figure 3). Data from depressive subjects and healthy controls were pooled, as for none of the ROIs significant differences in VT and BPND between major depression and healthy controls were encountered.
Average VT±s.d. values for 1T and 2T plasma input models
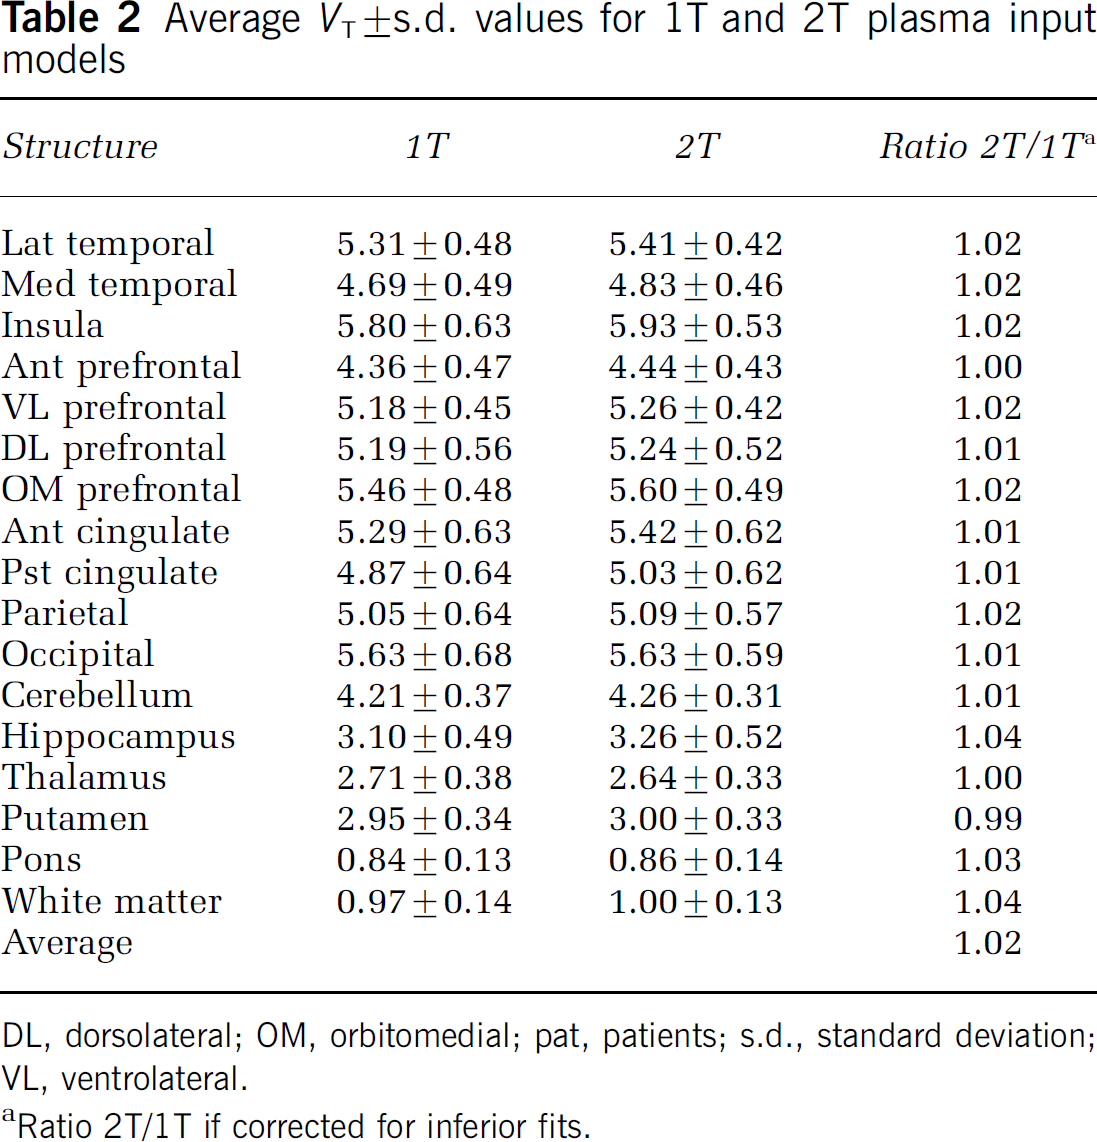
DL, dorsolateral; OM, orbitomedial; pat, patients; s.d., standard deviation; VL, ventrolateral.
Ratio 2T/1T if corrected for inferior fits.
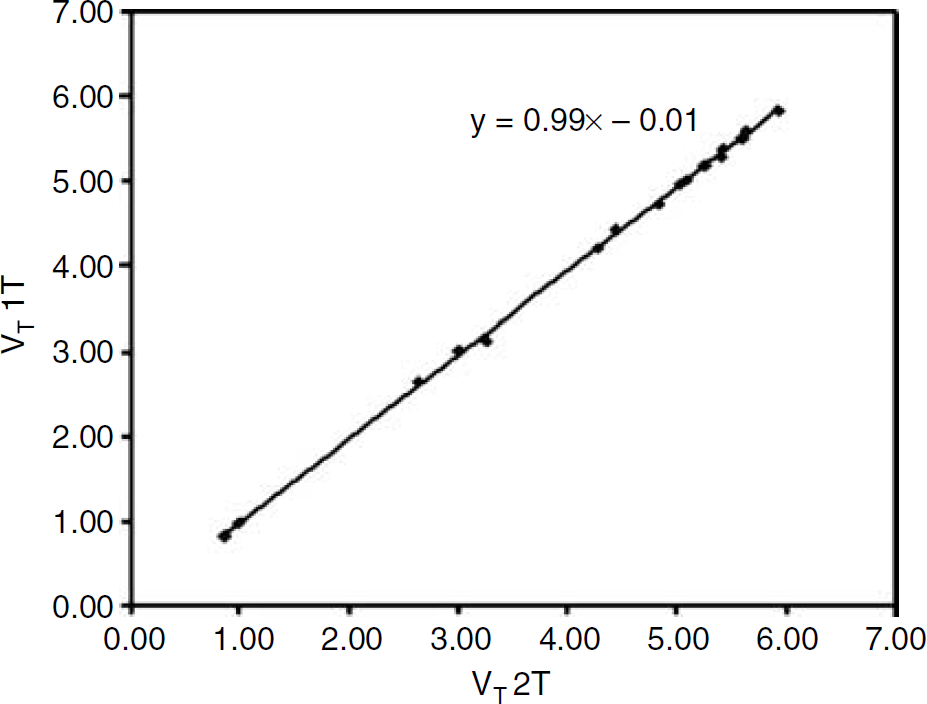
Comparison of VT values for each of the bilateral ROIs, averaged across all 17 subjects, obtained using 1T and 2T plasma input models. The line represents the linear regression between the two data sets (r = 0.999; P =0.01).
Reference Tissue Models
According to Akaike and Schwarz criteria alone, SRTM was preferred over FRTM in 89 and 79% of the fits across all structures, when using pons and white matter as reference tissue, respectively (Tables 3A and 3B).
A Selection criteria evaluating SRTM (versus FRTM), using pons as reference tissue
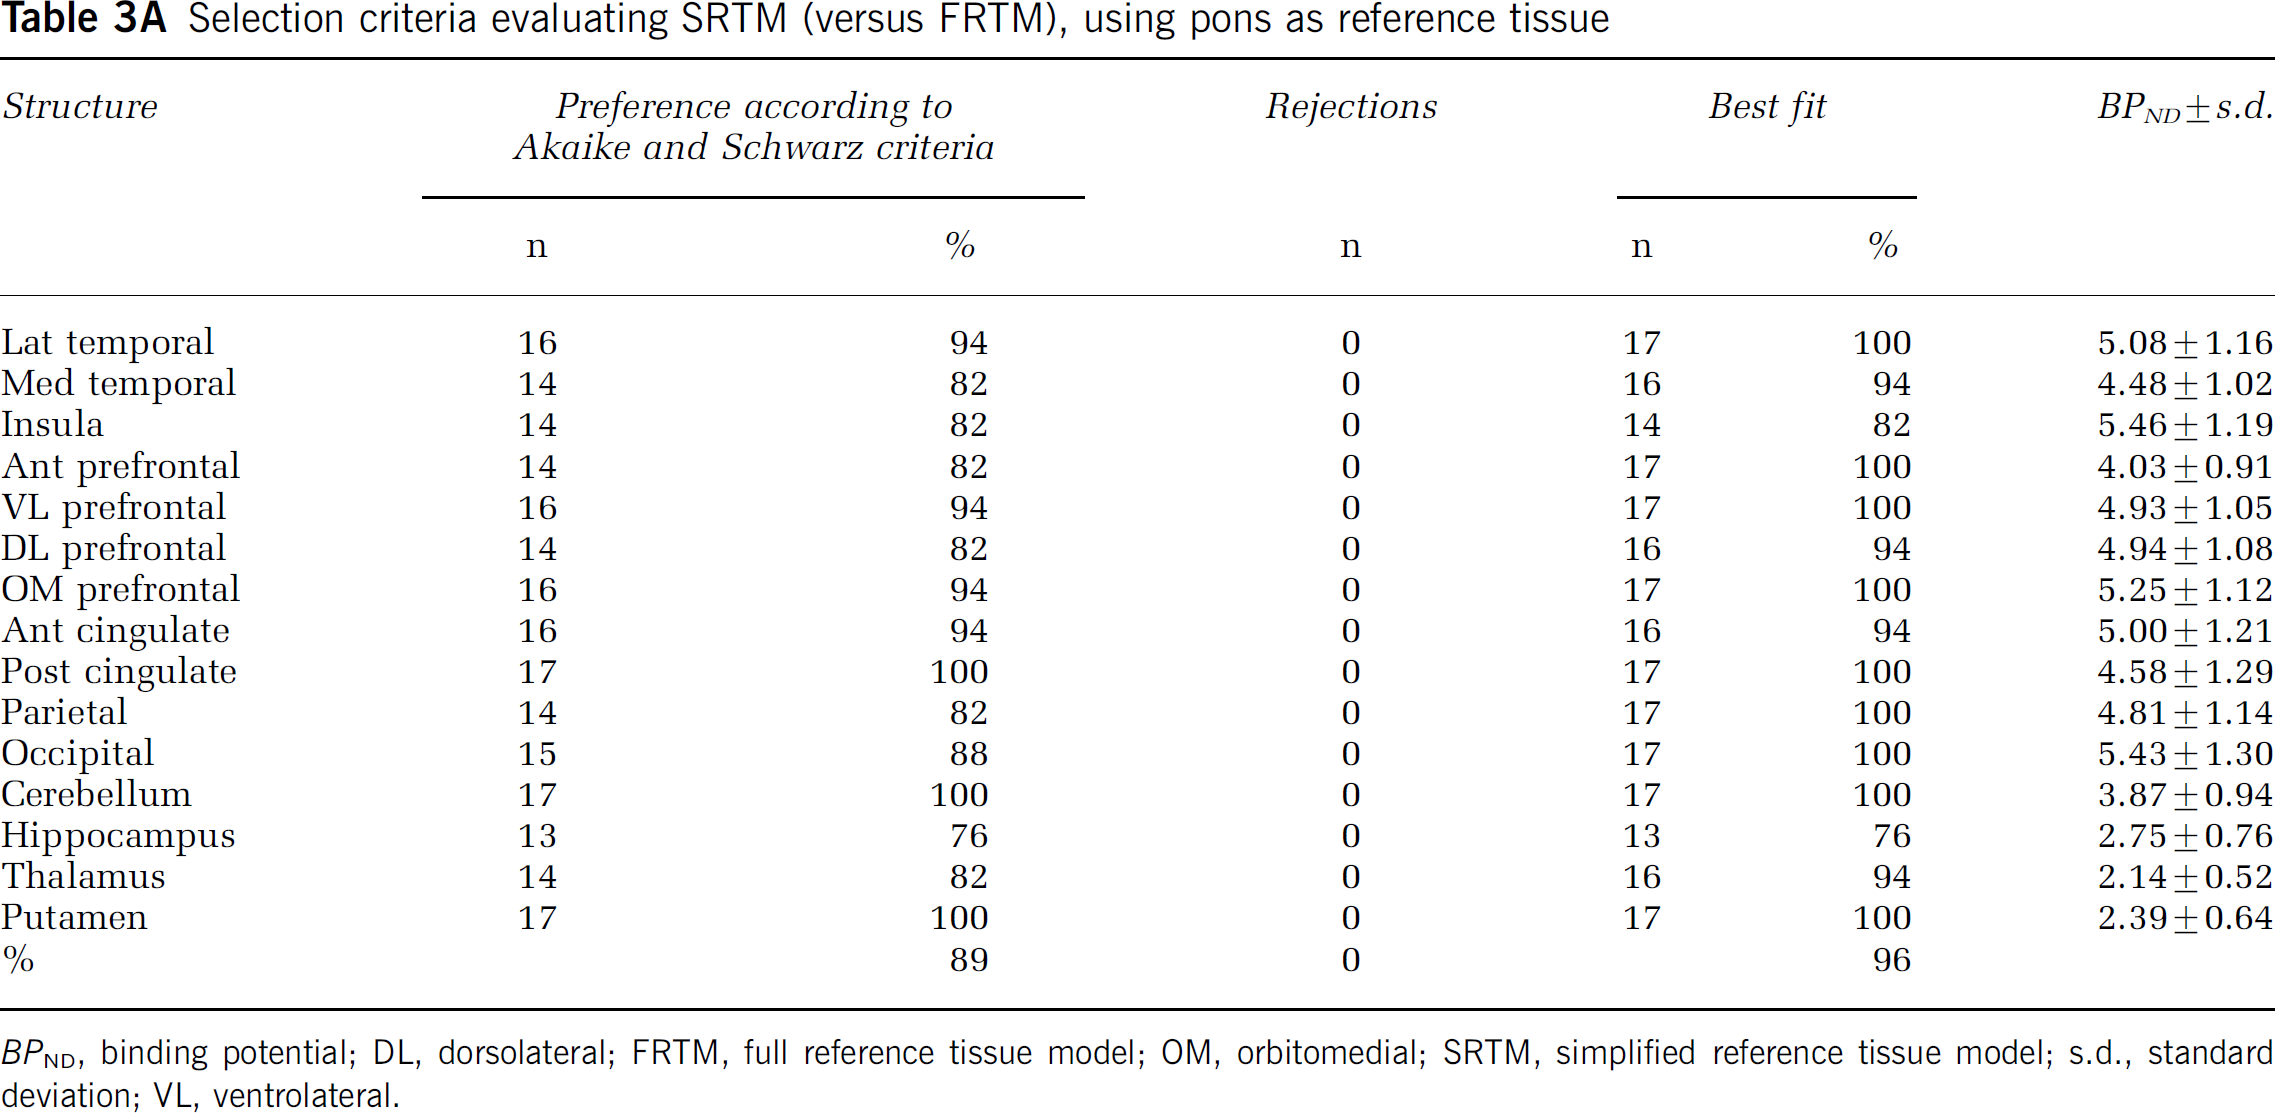
BPND, binding potential; DL, dorsolateral; FRTM, full reference tissue model; OM, orbitomedial; SRTM, simplified reference tissue model; s.d., standard deviation; VL, ventrolateral.
Selection criteria evaluating SRTM (versus FRTM), using centrum semiovale white matter as reference tissue
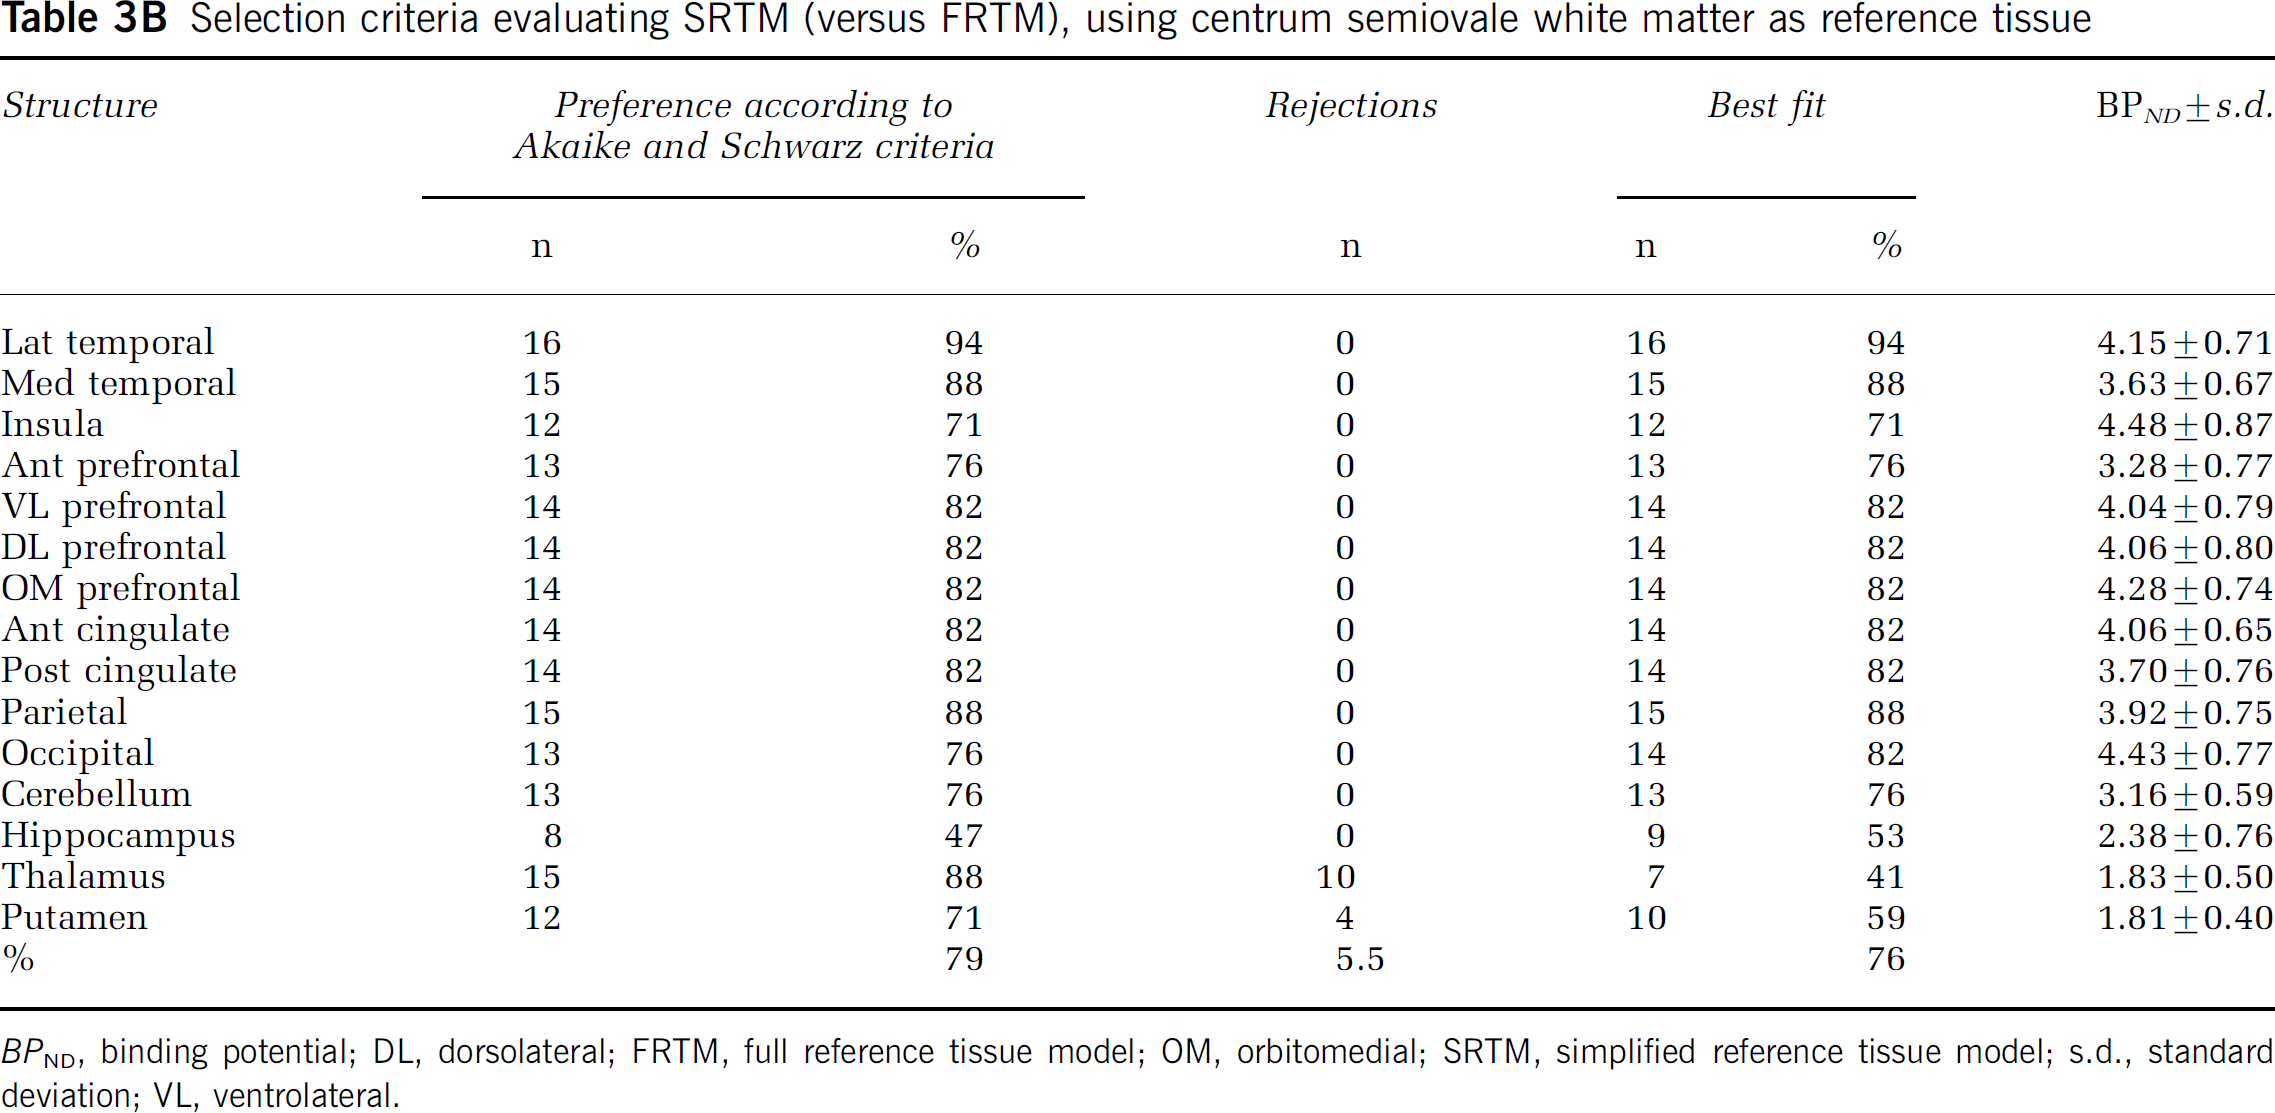
BPND, binding potential; DL, dorsolateral; FRTM, full reference tissue model; OM, orbitomedial; SRTM, simplified reference tissue model; s.d., standard deviation; VL, ventrolateral.
SRTM with pons as reference tissue resulted in no unreliable BPND values. In contrast, for FRTM with pons as reference tissue, the percentage of unreliable BPND values was 51.7% (n = 52 in patients, n = 80 in controls), spread over all structures (data not shown). Almost identical results were obtained when white matter was used as reference tissue, except that here also 5.5% of fits were rejected for SRTM. These rejected fits were related to deep grey matter structures, that is thalamus (10) and putamen (4) in both subject groups. In this case, the rejection rate for FRTM was 42.7%, virtually equally spread over patients and controls, and affecting all structures (data not shown).
When data from Akaike and Schwarz criteria were corrected for rejected fits, SRTM was preferred over FRTM in 96% of fits, when pons was used as reference tissue. For white matter as reference tissue, SRTM was preferred over FRTM in 76% of cases. In 5.5%, however, neither SRTM nor FRTM provided an adequate fit.
BPND results with both pons and white matter as reference tissue are listed in Tables 3A and 3B. On average, pons produced 23% higher BPND values than white matter (Figure 4).
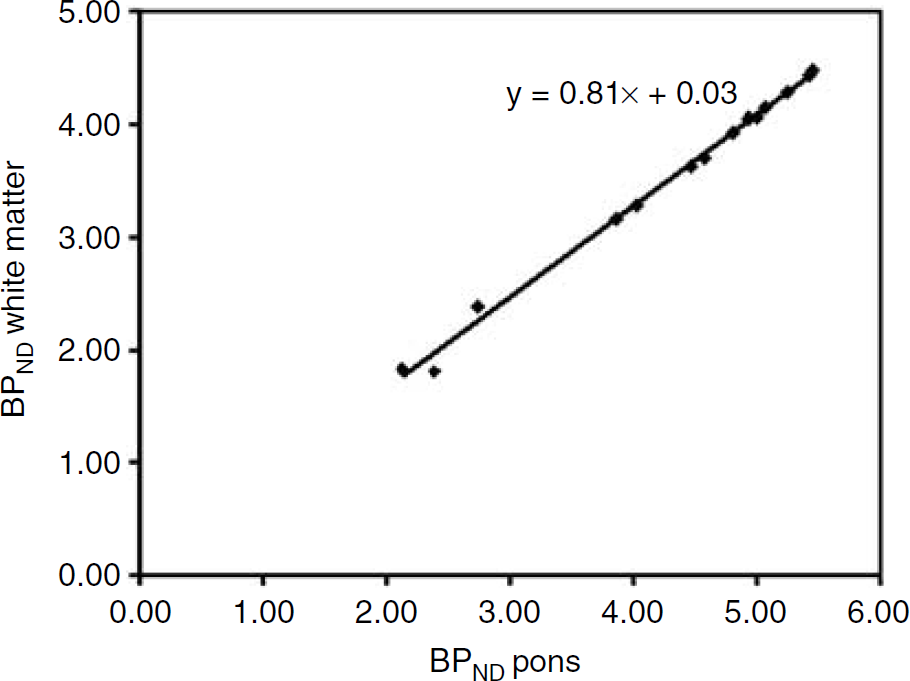
Comparison of BPND values for each of the bilateral ROIs, averaged across all 17 subjects, obtained with SRTM using both pons and centrum semiovale white matter as reference tissue. The line represents the linear regression between the two data sets (r = 0.997; P = 0.01). BPND using pons as reference tissue was on average 23% higher than BPND using white matter as reference tissue.
Reference Tissue Versus Plasma Input Models
On the basis of the findings of the previous sections, BPND values obtained with SRTM were compared with VT values obtained with the 1T plasma input model. Figure 5 shows the results of this comparison, where both pons and white matter were used as reference tissue for SRTM. The figure illustrates the higher BPND values obtained with pons as reference tissue. The correlation between BPND and VT, however, was similar when data were corrected for rejected fits (higher number in case of white matter as reference tissue).
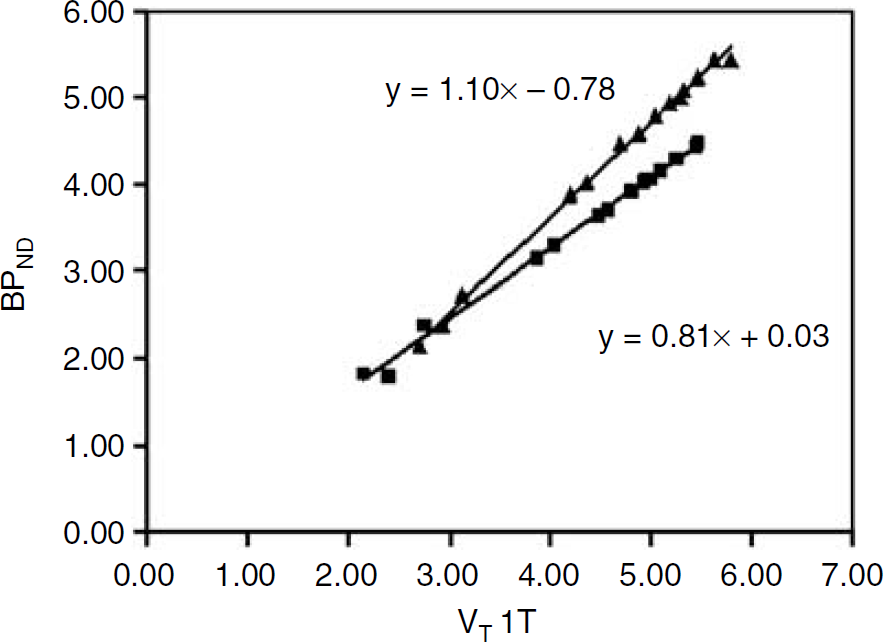
Relationship between VT 1T and BPND SRTM for pons and centrum semiovale white matter. Individual values represent bilateral ROIs, averaged across all 17 subjects. The upper line represents the linear regression for pons (r = 0.998; P = 0.01), the lower line for white matter (r = 0.995; P = 0.01). No fits were rejected in using pons as reference tissue. Use of white matter as reference tissue resulted in 5.5% rejected fits.
In this study, Pearson correlations between BPND from SRTM and VT from the 1T model were highly significant, being 0.998 using pons, and 0.995 for white matter as reference tissue, respectively. For the 2T model these were identical. The slightly higher rejection rate for the latter should, however, be kept in mind.
Discussion
[11C]Flumazenil kinetics have been described extensively in the original report by Pappata et al (1988) and in a number of subsequent studies (Koeppe et al, 1991; Holthoff et al, 1991; Price et al, 1993; Delforge et al, 1995; Lassen et al, 1995; Millet et al, 2002).
The main purpose of this study was not to re-address [11C]FMZ kinetics, but to assess whether reference tissue methods could be used for analysing [11C]FMZ studies. This assessment requires a comparison with the optimal plasma input model. Previously, it has been shown that [11C]FMZ kinetics are best described by a 1T compartment model (Koeppe et al, 1991; Lassen et al, 1995). Recently, however, it was shown that the ingrowth of labelled metabolites into plasma is best described by a Hill function (Lubberink et al, 2004). This was further confirmed in the present study, where metabolites were better fitted using a Hill function than using a multiexponential (Figure 2). As previously simple interpolation and multiexponential fits were used, these methods could have affected the quality of both 1T and 2T model fits and thereby also the relative preference between the two models. Therefore, the comparison of 1T and 2T models was repeated in the present study.
Both cortical and subcortical areas were investigated. To increase statistical power, data from depressive subjects and controls were pooled. This is justified, as no significant differences between depressive patients and healthy controls were observed for any of the ROIs investigated, in line with findings reported by Kugaya et al (2003). In addition, within the group of depressed patients, no relationship between severity of depression and either VT or BPND was found (data not shown).
In apparent contrast to previous studies (Koeppe et al, 1991; Lassen et al, 1995), after correcting for inferior fits, the 1T model was preferred in 41% of the fits and the 2T model in 59%, slightly favouring the 2T model. Owing to a sharp increase in coefficients of variation of fit parameters with increasing model complexity (20 to 50% for a three-parameter model and 50 to 100% for a four-parameter model), coupled with a nonsignificant improvement in goodness of fit, Koeppe et al (1991) preferred the 1T model. Only for regions with low receptor density, where free and nonspecific binding constitute a greater fraction of VT, the 2T model was implied to be superior. This latter finding could not be substantiated in this study, as the 1T model was actually preferred for deep grey matter structures with intermediate levels of receptor density.
Despite a slight preference for the 2T method in case of successful fits, its 7.3% failure rate, together with the very small difference between 1T and 2T VT values (1.6%), implies that the 1T model seems to be the method of choice for routine clinical studies, in line with previous studies.
It should be noted that a systematic difference between 1T and 2T models was observed, albeit small. This might have implications for techniques that automatically select the number of compartments in voxel-by-voxel analyses, such as spectral analysis (Cunningham and Jones, 1993). The 2T model was selected most often for regions with high, and less for regions with low receptor densities (Table 1). This could mean that, for within-group comparisons or when monitoring response to therapy, a reduction in receptor density will be overestimated (for higher densities the higher 2T VT would be favoured and for lower densities the lower 1T VT). Although effects would be small for [11C]FMZ, they should be taken into account for tracers where the differences in VT are larger.
With respect to reference tissue models it is clear that SRTM was superior to FRTM, irrespective of whether pons or (centrum semiovale) white matter was used as reference tissue. The high failure rate of FRTM is not surprising as it is based on the existence of two distinct tissue compartments. The plasma input models already indicated that this distinction is small, if not absent, given the good performance of the 1T model.
Pons and white matter have previously been considered as reference regions with very low or negligible benzodiazepine receptor densities, respectively (Savic et al, 1988; Persson et al, 1989; Blomqvist et al, 1990; Abadie et al, 1992; Price et al, 1993). In vitro studies on rat brain slices have indicated that the brain stem is not entirely free of receptors (Mans et al, 1992), which was confirmed in in vivo studies (Delforge et al, 1995; Lassen et al, 1995; Millet et al, 2000). Although the spherical properties of the pons limit partial volume effect due to contamination with cortical grey matter, it is also a small structure, potentially underestimating radioactivity concentration because of limited spatial resolution of PET. Moreover, pons comprises pontine grey matter nuclei. The ventral side of the pons, however, includes the ventral tegmentum, consisting of (white) axonal fibres. By defining the pons ROI on the ventral side of the pons, an attempt was made to minimise the effects of grey matter ‘contamination‘. It should be noted that, due to its small size, measured radioactivity concentrations especially in pons might be sensitive to even small patient movements, consequently affecting quantification. Therefore, care should be taken in minimising patient movement and, if required, appropriate movement corrections should be implemented.
To exclude potential effects of patient movement on the present results, all scans were checked for subject movement retrospectively. The majority of studies did not show observable displacement. Only for one patient, significant movement, that is a 12-mm translation in the cranial-caudal direction was observed. To assess the impact on quantification, this study was corrected for movement using a frame-by-frame realignment procedure. After movement correction, regional VT and BPND values changed with, on average, 1 and 9%, respectively. Pearson correlation remained unaltered, being r = 0.998 for 1T VT and SRTM BPND. As even for this most extreme case, the impact of patient movement on regional VT and BPND values was still small, it may be assumed that overall effects of patient movement on VT and BPND results in this study are minimal.
This conclusion may be extended to partial volume effects, given the excellent correlation between BPND obtained with pons as reference tissue input and VT obtained with plasma input (i.e., without using the pons).
Finally, a potential limitation of the use of white matter as reference tissue is the inherent assumption that the levels of nonspecific binding are identical in grey and white matter.
The results of this study are in favour of using pons rather than white matter as reference tissue. Firstly, pons resulted in no unsatisfactory fits. In contrast, white matter resulted in a small fraction (5.5%) of unsatisfactory fits, primarily for some deep grey matter structures. Secondly, pons used as reference tissue yielded BPND values that were on average 23% higher than those obtained with white matter. This suggests a higher level of specific or (more likely) nonspecific binding in white matter, which corresponds to the higher VT value for white matter than for pons (Table 2; 1T plasma input model).
The results presented here are in line with those of Abadie et al (1992), who compared pons, hemispheric white matter, and corpus callosum as reference tissue structures. Abadie et al (1992), however, employed a pseudo-equilibrium paradigm with Bmax and Kd as measures of central benzodiazepine receptor density and affinity, whereas here a dynamic approach with VT as parameter of interest was used. Nevertheless, it is reassuring that both methods favour the pons as reference structure.
Clearly, the most important question is whether a reference tissue rather than a plasma input model could be used. On the basis of excellent correlation (r = 0.998) between SRTM and the 1T plasma input model (Figure 5), this is certainly the case for the present study population, a mixture of normal controls and patients with depression. Correlations within any single subject may even have been higher (Koeppe et al, 1991), due to variability in free and nonspecific distribution volumes across subjects.
It should be noted that, despite the good correlation between SRTM and 1T plasma input models, both have their limitations. Firstly, accuracy of SRTM results may be compromised by above-mentioned partial volume effects, and by the low level of central benzodiazepine receptors observed in the pons (Lassen et al, 1995). Although, in theory, it should be possible to take into account this specific binding in pons using an extended reference tissue model (Watabe et al, 2000), for FMZ this is not possible in practice yet, as it would require an independent assessment of the level of specific binding in the pons. Secondly, VT results obtained using the 1T model include nonspecific binding. This will result in an increasing bias for decreasing levels of central benzodiazepine receptors. From Figure 5 it can be deduced that, in the present study, the level of nonspecific binding is around 12%, which is virtually identical to earlier reports (Price et al, 1993; Delforge et al, 1995; Lassen et al, 1995; Millet et al, 2002).
In conclusion, for clinical studies, an SRTM with pons as reference tissue can be used for quantification of [11C]FMZ binding. This obviates the need for arterial cannulation and significantly simplifies the scanning protocol.
Footnotes
Acknowledgements
The authors thank the PET radiochemistry and technologists staff of the Division of Nuclear Medicine and PET Research for production of isotopes and acquisition of PET and metabolites data.