
Abstract
A critical determinant of proliferation of progenitor cells is the duration of the cell division cycle. Stroke increases proliferation of progenitor cells in the subventricular zone (SVZ). Using cumulative and single S-phase labeling with 5-bromo-2′-deoxyuridine, we examined cell cycle kinetics of neural progenitor cells in the SVZ after stroke. In nonstroke rats, 20% of the SVZ cell population was proliferating. However, stroke significantly increased dividing cells up to 31% and these cells had a cell cycle length (Tc) of 15.3 h, significantly (P < 0.05) shorter than the 19 h Tc in nonstroke SVZ cells. Few terminal deoxynucleotidyl transferase-mediated biotinylated UTP nick end labeling-positive cells were detected in the SVZ cells of nonstroke and stroke groups, suggesting that the majority of dividing cells in the SVZ do not undergo apoptosis. Cell cycle phase analysis revealed that stroke substantially shortened the length of the G1 phase (9.6 h) compared with the G1 phase of 12.6 h in nonstroke SVZ cells (P < 0.03). This reduction in G1 contributes to stroke-induced reduction of Tc because no significant changes were detected on the length of S, G2 and M phases between two groups. Furthermore, compared with progenitor cells in nonstroke SVZ (10%), a greater proportion (14%) of progenitor cells in stroke SVZ reentered the cell cycle after mitosis (P < 0.05). These results show that an increase in proliferating progenitor cells in the SVZ contributes to stroke-induced neurogenesis and this increase is regulated by shortening the length of the cell cycle, decreasing the G1 phase and increasing cell cycle reentry.
Introduction
During development, neocortex forms by the orderly migration and subsequent differentiation of neuronal precursors arising from the proliferating ventricular zone (VZ) (Takahashi et al., 1993; Caviness et al., 2003; Noctor et al., 2004). The VZ is replaced by an ependymal layer, while the subventricular zone (SVZ) persists in the adult rodent (Morshead et al., 1998). The adult SVZ contains actively proliferating progenitor cells and relatively quiescent stem cells, which generate neurons and glia throughout adulthood (Luskin, 1993; Lois and Alvarez-Buylla, 1994; Morshead et al., 1998). Stroke increases neurogenesis in the SVZ and newly generated neurons migrate towards ischemic boundary regions (Arvidsson et al., 2002; Parent et al., 2002; Jin et al., 2003; Zhang et al., 2004b,c).
Proliferation of neural progenitor cells is tightly controlled by cell cycle kinetics (Takahashi et al., 1993; Caviness et al., 2003). The growth fraction (GF; proportion of proliferating cells) and the length of cell cycle (TC) are two critical parameters of the cytokinetics for neocortical neurogenesis (Nowakowski et al., 1989; Takahashi et al., 1993; Caviness et al., 2003). Studies in neonatal and postnatal rats show that the cell cycle length of the SVZ ranges from 14 to 18.6 h (Schultze and Korr, 1981; Smith and Luskin, 1998). Increases of the proliferating cell population in the SVZ after stroke could result from increases of GF and/or shortening of TC of progenitor cells in the SVZ. Cyclin-dependent kinases and their inhibitors mediate the cell division cycle during G1 phase. Reduction in p27kipl levels is concurrent with significant increases of proliferating cells in the SVZ after stroke (Zhang et al., 2004a). However, the influence of stroke on cell cycle kinetics in the adult brain has not been investigated. Accordingly, using cumulative and single 5-bromo-2′-deoxyuridine (BrdU) labeling protocols developed by Nowakowski et al. (1989), we investigated the sequence of cell cycle parameters including TC and the length of four cell cycle phases G1, S, G2 and M, and the rate of the cells produced in the SVZ of adult rats after stroke.
Materials and methods
All experimental procedures have been approved by the Institutional Animal Care and Use Committee of Henry Ford Hospital.
Animal Model of Stroke
Male Wistar rats (three to four months old) were employed. The right middle cerebral artery (MCA) was occluded by placement of an embolus at the origin of the MCA (Zhang et al., 1997). Animals used for cumulative BrdU study were killed 7 days after stroke based on our previous studies showing neurogenesis in the SVZ with a peak at 7 days after stroke (Zhang et al, 2001b, 2004c).
Histology and Immunohistochemistry
At the end of the experiment, animals were transcardially perfused with heparinized saline, followed by 4% paraformaldehyde. Brains were fixed in 4% paraformaldehyde and embedded in paraffin. Coronal sections (6 μm) of the lateral ventricles were cut serially at the level of AP + 10.6mm (genu corpus callosum) and AP +9.2 mm (anterior commissure crossing) (Paxinos and Watson, 1986).
For BrdU immunostaining, DNA was first denatured by incubating coronal sections in 50% formamide 2 × standard saline citrate at 65°C for 2 h and then in 2 N HCl at 37°C for 30 min (Zhang et al., 2001b). Sections were incubated with the anti-BrdU antibody (1:1000, Boehringer Mannheim, Indianapolis, IN, USA) overnight and then incubated with biotinylated secondary antibody (1:200, Vector, Burlingame, CA, USA) for 1 h. The reaction product was detected using 3′,3′-diaminobenzidine-tetrahydrochloride (DAB, Sigma).
Double immunostaining for BrdU and MCM-2 was performed on paraffin-embedded coronal sections (6 μm) using the Dako EnVision Doublestain System (Dako) according to the manufacturer's instructions. Goat anti-MCM-2 antibody at 1:300 (Santa Cruz) was used.
Double immunofluorescent staining for doublecortin (DCX) and phospho-histone H3 (HH3) or DCX and Ki67 was performed, as describe previouslyd (Zhang et al., 2001a), using goat anti-DCX (1:200, Santa Cruz Biotechnology Inc., Santa Cruz, CA, USA), rabbit polyclonal anti-HH3 antibody (1:1000, Upstate Biotech, Lake Placid, NY, USA), and rabbit polyclonal anti-Ki67 antibody (1:300, Abcam, Cambridge, MA, USA). Phospho-histone H3 is a marker of G2/M phases of proliferating cells and Ki67 is a marker proliferating cells (Kuan et al., 2004).
Terminal deoxynucleotidyl transferase-mediated biotinylated UTP nick end labeling (TUNEL) was performed using the Apotosis Detection Kit (ApopTag, Chemicon International) according to the manufacturer's protocol.
Cumulative 5-Bromo-2′-Deoxyuridine Labeling
Using a cumulative BrdU labeling protocol established by Nowakowski et al. (1989) and Takahashi et al. (1993), we estimated the length of cell cycle (TC), the length of S phase (TS) and proliferating population of SVZ cells (GF). This protocol requires that the serial BrdU injections be spaced so that the length of nonlabeled intervals between injections is less than the length of S phase such that all nuclei passing through S phase will be labeled (Nowakowski et al., 1989; Takahashi et al., 1993). Briefly, adult rats were intraperitoneally injected with BrdU (50 mg/kg, Sigma) at 2-h intervals over a total period of 18.5 h, beginning at 0800 h At 30 min after each of the BrdU injections, selected rats were killed. Three to four animals per time point were killed with a total of 10 time points. Nonstroke rats were used as control groups.
For analysis of BrdU-labeled cells, every 40th BrdU immunostained coronal section at the level of AP + 10.6 mm and AP + 9.2mm (Paxinos and Watson, 1986) was digitized under a × 60 objective (Olympus BX40) via the MCID computer imaging analysis system (Imaging Research, St Catharines, ON, Canada). 5-Bromo-2′-deoxyuridine-labeled and unlabeled cells along the SVZ of the lateral ventricular wall were counted on a computer monitor to improve visualization and in one focal plane to avoid oversampling. Endothelial cells were not counted. 5-Bromo-2′-deoxyuridine-labeled and unlabeled cells in each SVZ coronal section are presented as the number of the cells /section. Density for the four sections per rat was averaged to obtain a mean density value for each brain according to published methods (Kuhn et al., 1996; Zhang et al., 2001b). Using this method, we counted the number of BrdU cells in the SVZ and the dentate gyrus. The results are comparable to the number obtained from the stereology method (Kuhn et al., 1996; Zhang et al., 2001b). Focal cerebral ischemia results in cavitations in the ipsilateral hemisphere which precludes cutting accurate thicknesses of vibratome sections. Therefore, the stereology method was not used in the present study.
For each brain, an average labeling index (LI), that is, the ratio of labeled cells to total cells, was determined by averaging the LIs of four nonadjacent sections at each time point, and was plotted as a function of time after the initial injection (Nowakowski et al., 1989; Takahashi et al., 1993). The GF, that is, the ratio of proliferating cells to the total cells in the population, and the parameters of TC and TS were calculated by using a least-squares (LS) line fit to all considered data points (Nowakowski et al., 1989; Takahashi et al., 1993). TC and TS were calculated from the graphs based on two relationships: (1) the time required to label the GF, that is, the inflection point of the curve, is equal to TC–TS; and (2) the y-intercept of the curve is equal to (TC/TS) × GF (Nowakowski et al., 1989; Takahashi et al., 1993).
Single-Pulse 5-Bromo-2′-Deoxyuridine Labeling
To estimate the G2 and M phases (TG2 + M) of the cell cycle, a single-pulse BrdU protocol was used (Nowakowski et al., 1989; Takahashi et al., 1993). Animals received a single intraperitoneal injection of BrdU at 0800 h. and were killed 30, 40, 50, 60, 90, 120, 160 and 180 min later. At the end of the experiment, brain samples were collected, fixed and stained with BrdU, as described in the aforementioned paragraph. The numbers of BrdU-labeled and unlabeled mitotic cells in the SVZ were counted on every 40th BrdU immunostained coronal section per rat.
A single injection of BrdU labels a cohort of cells that are in S phase at the time of the injection, and the labeled cells progress through the cell cycle (Nowakowski et al., 1989; Takahashi et al., 1993). The mitotic labeled index (MLI) (i.e., the ratio of labeled mitotic figures to total mitotic figures) was determined for each section and presented as the total number for each animal. Data for each rat were plotted as a function of time after the BrdU injection using an LS fit (Nowakowski et al., 1989; Takahashi et al., 1993). From the plot, the duration of TG2 and TG2 + M was calculated as follows: the time during injection of BrdU and the appearance of the first labeled mitotic figure is a determination of TG2; the time required for the leading cells of the labeled cohort to enter M phase and MLI to reach 100% is TG2 + M. TG1 was estimated by the equation: TG1 = TC – (TS + TG2 + M) (Nowakowski et al., 1989; Takahashi et al., 1993).
Cell Cycle Reentry
To examine cell cycle reentry, a cohort of proliferating cells from nonstroke and 6-day stroke rats was labeled with a single intraperitoneal injection of BrdU (50 mg/kg). At 24 h after the injection of BrdU, the brains from both nonstroke and 7-day stroke groups were collected (Chenn and Walsh, 2002; Hodge et al., 2004) and fixed, as described above. Coronal sections (6 μm) were cut serially at the level of AP + 10.6 mm and AP + 9.20 mm, and four to six rats in each group were used for the analysis.
The numbers of BrdU+ and/or MCM-2+ cells were counted on every 40th double-immunostained coronal section, with a total of four sections per rat. MCM-2 is broken down rapidly on differentiation (Maiorano et al., 1996). Therefore, BrdU+ and MCM-2+ cells indicate the cells that remain in the cell cycle, whereas BrdU+ and MCM-2− cells represent the cells that exit the cell cycle.
Statistical Analysis
The LS approach was used to estimate cytokinetic parameters used in the present study and to fit the data into two regression lines at the same time. The first line has a slope 1/TC and the intercept GF × TS/TC, and the second line has a slope of zero and the intercept GF, or 100%. The LS estimation has performed for each rat group. The iteration was conducted until the estimation converged and best fitted to the data. We then calculated parameters of interest and their standard errors. Two-sample t-test was used to test the differences in the cytokinetic parameter between normal and ischemia rats. All data are presented as mean ± s.d. and statistical significance was set at P < 0.05.
Results
Expansion of the Subventricular Zone after Stroke
The SVZ of the lateral ventricular wall in nonstroke rats was approximately 15.35 μm (15.35 ± 3.04 μm) wide on the coronal sections being analyzed (Figure 1A), whereas the width of the SVZ expanded nearly fourfold (60.5 ± 11.63 μm) from the lateral ventricle to the striatum in the ipsilateral hemisphere at 7 days after stroke (Figure 1B). Expansion of the ipsilateral SVZ was associated with increases in the number of BrdU+ cells compared with the number in nonstroke SVZ (Figure 1A, arrows). To examine whether actively proliferating cells are migrating neuroblasts (type A cells) in the SVZ (Doetsch et al., 1997), we performed double immunostaining using antibodies against Ki67, a marker of proliferating cells, and DCX, a marker of migrating neuroblasts. Many Ki67+ cells (Figure 1C, red) in the SVZ were DCX+ (Figure 1C, green) in the ipsilateral SVZ, suggesting that these cells are type A cells. Hypoxia-ischemia triggers neurons to reenter the cell cycle and resume apoptosis-associated DNA synthesis (Kuan et al., 2004). However, these cells cannot develop into the G2 phase (Kuan et al., 2004). To examine whether migrating neuroblasts are in the G2 phase, double immunostaining with antibodies against DCX and HH3 (a marker of G2/M phases) was performed. We found that stroke increased the number of DCX+ and HH3+ cells (Figure 1I to 1K) compared with the number in nonstroke SVZ. In addition, TUNEL assay revealed few TUNEL-positive cells in both the non-stroke (Figure 1D) and stroke SVZ (Figure 1E). These data indicate that BrdU+ cells in the SVZ represent proliferating cells and DCX+ cells, and are newly generated migrating neuroblasts, but not mature neurons, that have reentered the cell cycle after stroke.
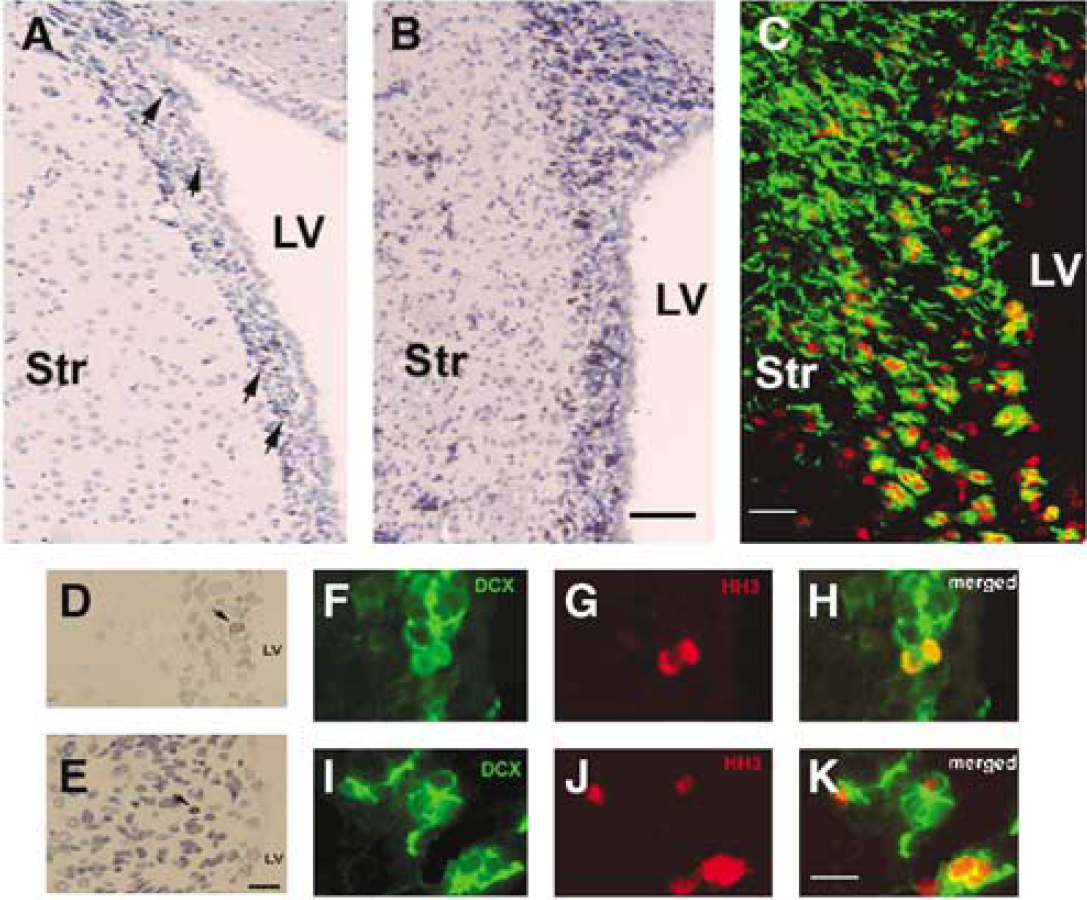
Stroke expands the SVZ. Coronal sections throughout the forebrain show a few (
Stroke Increases Growth Fraction and Decreases the Length of the Cell Cycle
To examine whether expansion of the SVZ after stroke is due to an increase in GF and/or shortening of TC of progenitor cells, we measured LI, the proportion of BrdU labeled cells to total cells in the SVZ, over time in stroke and nonstroke rats, using the cumulative BrdU labeling protocol. A few BrdU-labeled cells were detected in the SVZ at 0.5 h after the initial cumulative BrdU injection (Figure 2). However, the number of BrdU+ cells increased with time in both stroke and nonstroke rats, and more BrdU-labeled cells were detected in stroke than that in nonstroke rats (Figure 2). A plot of the LI versus the survival time for both stroke and nonstroke rats shows that LI increased linearly to a maximum value 14.4 h in nonstroke and 11.3 h in stroke, and then leveled off (Figure 2). Stroke reached a higher GF plateau value (31%) than nonstroke rats (GF, 20%), but showed no difference in the rate of ascent of LI for SVZ (Figure 2). These data indicate that stroke increases the actively dividing cell population in the SVZ.
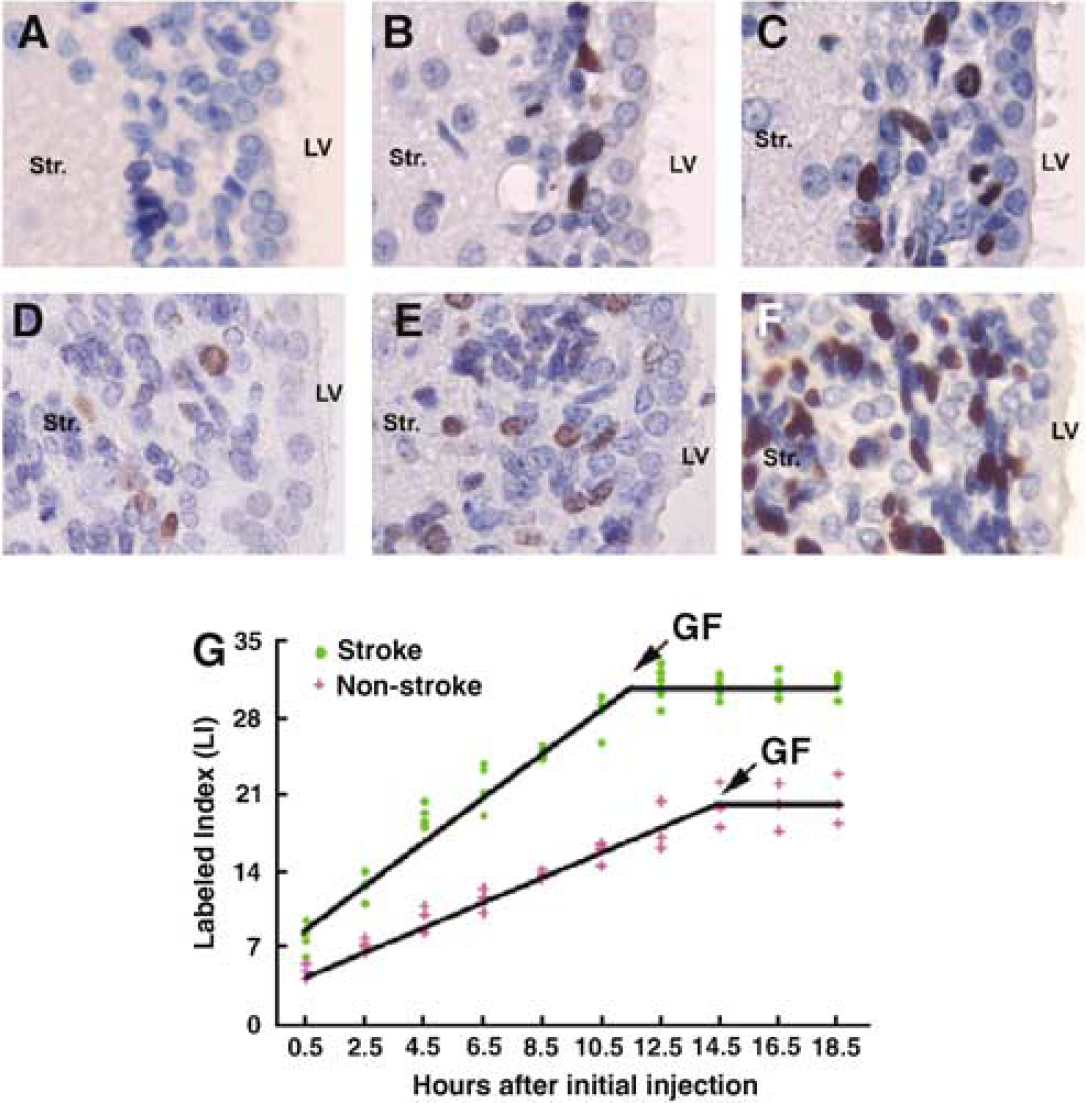
Stroke increases the number of BrdU+ cells. (
Using this plot, TC and TS were determined according to equations (1) and (2), described in the Materials and methods. TC was 19 and 15.3 h (P < 0.05) in nonstroke and stroke groups, respectively, while TS was 4.6 and 3.9 h for nonstroke and stroke, respectively (P > 0.05, Table 1). Thus, stroke increases the proliferating cell population in the SVZ by shortening the length of cell cycle, but does not significantly affect the duration of the S phase.
Cytokinetic parameters of SVZ in nonstroke and stroke rats
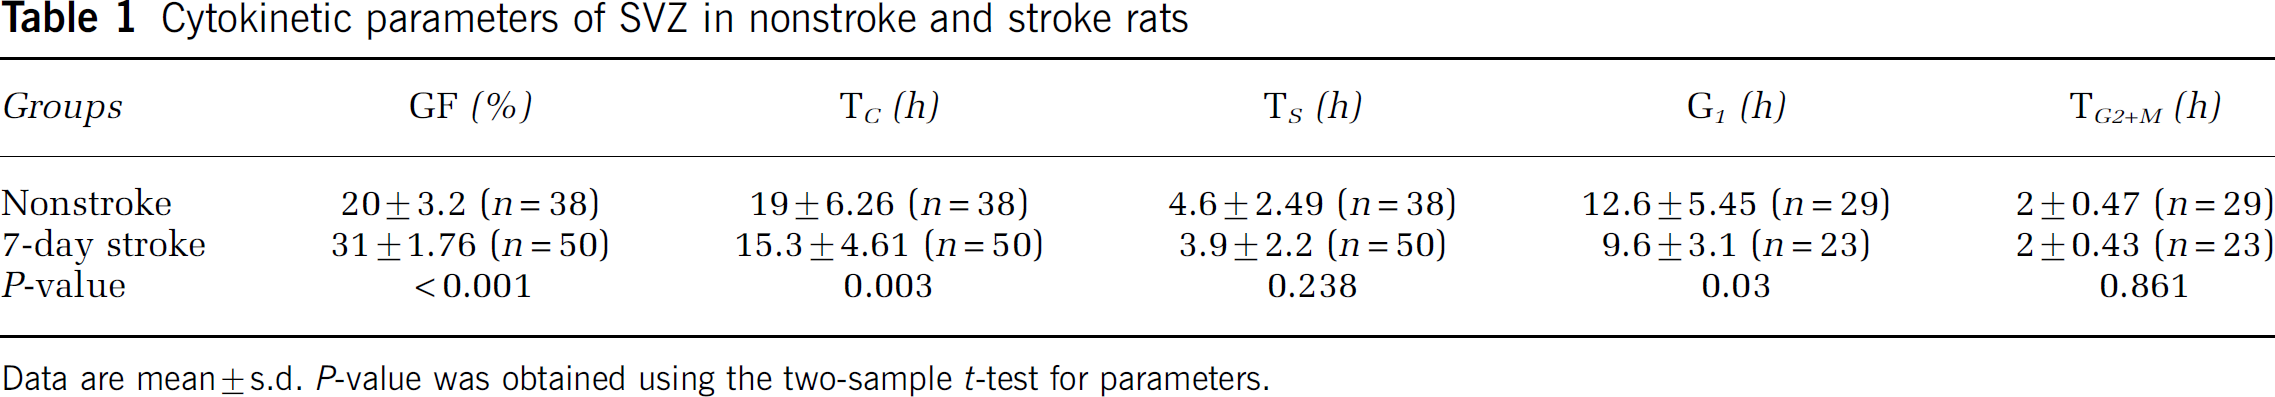
Data are mean ± s.d. P-value was obtained using the two-sample t-test for parameters.
Stroke does not Affect the Lengths of the G2 and M Phases of the Cell Cycle
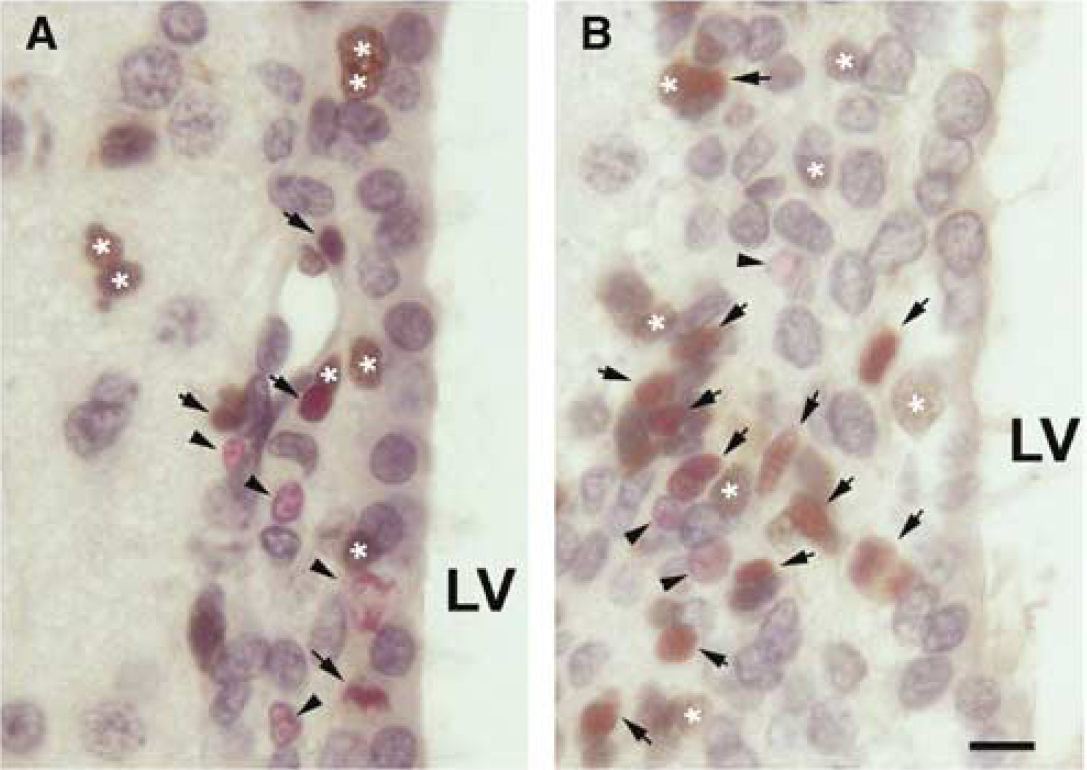
A decrease of the length of the cell cycle in stroke SVZ compared with nonstroke SVZ could result from changes in the duration of one or more particular cell cycle phases after stroke because the cell cycle is the sum of its component phases. To investigate the reason for the decreased length of the cell cycle in stroke SVZ, the combined length of the G2 and M phases was determined using the single BrdU labeling protocol. 5-Bromo-2′-deoxyuridine-labeled mitotic figures after the injection were detected nearby the lateral ventricular surface (Figure 3A). The combined length of TG2 + M phases corresponding to the time required for all of the mitotic figures to become labeled, had the same value of 2 h in nonstroke and stroke rats (Figure 3B). These data demonstrate that stroke does not change the lengths of the TG2 + M phases of the cell cycle.
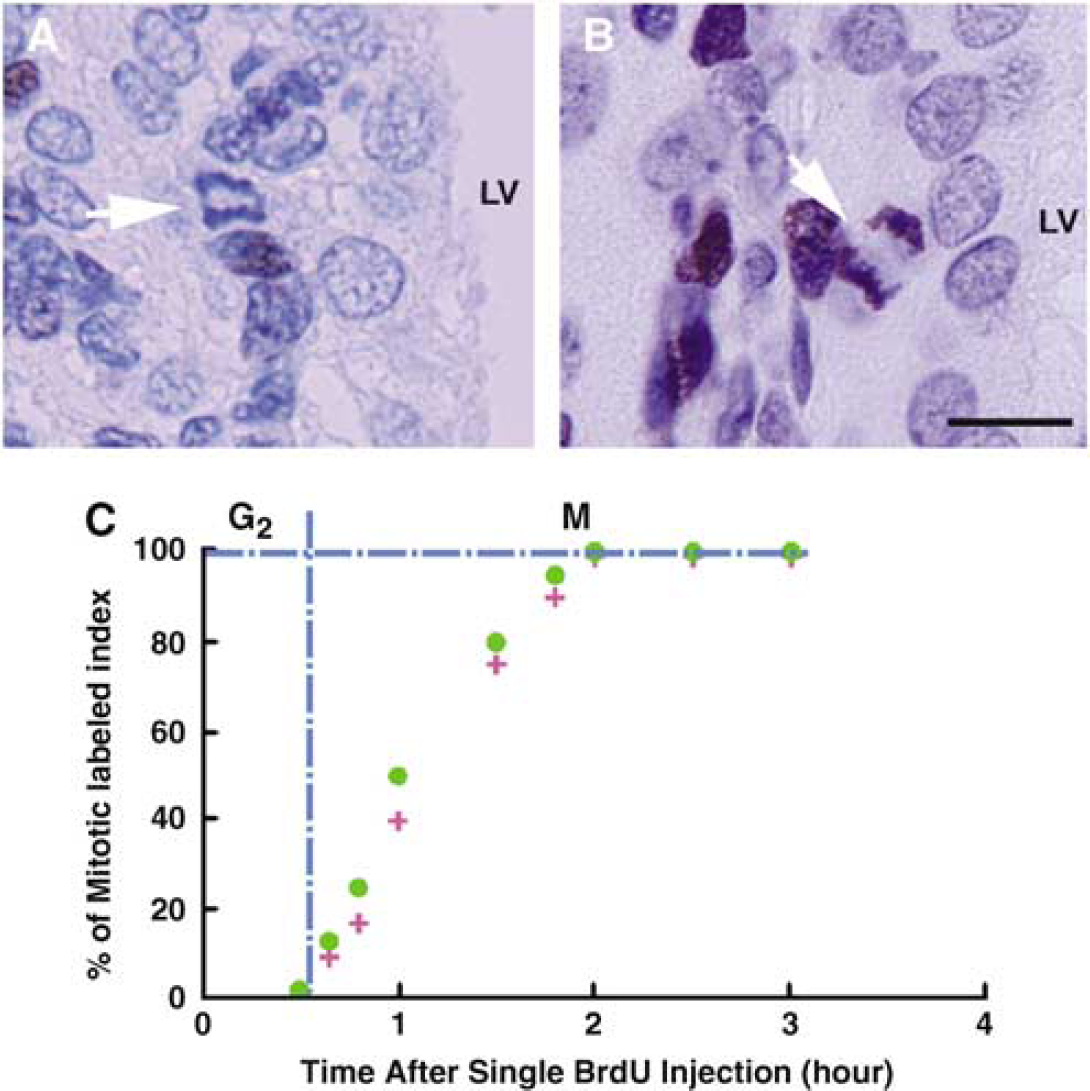
Single BrdU labeling. 5-Bromo-2′-deoxyuridine− (
Stroke Decreases the Length of the G1 Phase of the Cell Cycle
Although the length of the cell cycle decreases in stroke SVZ, the lengths of S, G2 and M phases are relatively invariant. This implies that a decrease in the length of the cell cycle in stroke SVZ could be due to a shortening of the length of G1 phase and not the S, G2 and M phases. Based on data from the cumulative and single BrdU labeling protocols, the length of the G1 phase was 12.6 and 9.6 h in nonstroke and stroke, respectively (Table 1). Thus, TG1 was 3 h shorter in stroke than that in nonstroke SVZ (P < 0.01).
Stroke Increases Cell Cycle Reentry
Symmetric progenitor cell division can expand the progenitor pool exponentially by maintaining both daughter cells as progenitors without differentiating (Chenn and McConnell, 1995). Stroke transiently switches SVZ cell division from asymmetric to symmetric (Zhang et al., 2004b). To examine whether a transient increase in symmetric division results in augmentation of the fraction of cells that remain in the cell cycle, we measured the proportion of SVZ cells that exit or reenter the cell cycle. Double immunostaining with antibodies against BrdU and MCM-2 on brain slices in rats 24 h after pulse labeling with BrdU revealed a significant (P < 0.05) increase of the proportion of BrdU+ and MCM-2+ cells in the stroke group (12.6 ± 1.3) compared with the nonstroke group (10.8 ± 1.1 (Figure 4)), while the proportion of BrdU+ and MCM-2− cells was significantly lower in the stroke group (9.9 ± 1.01) than this proportion in the nonstroke group (11.8 ± 1.06 (Figure 4)). MCM-2 is an essential factor for initiation of DNA replication in early G1 of the cell cycle and is rapidly broken down on differentiation (Maiorano et al., 1996). 5-Bromo-2′-deoxyuridine+ and MCM-2+ cells remain in the cell cycle, while BrdU+ and MCM-2− cells identify cells that leave the cell cycle (Chenn and Walsh, 2002; Hodge et al., 2004). Accordingly, our findings suggest that stroke stimulates cells to re-enter the cell cycle.
(
Discussion
The present study shows for the first time that stroke increases the GF and decreases the length of the cell cycle in SVZ cells, which result from shortening the G1 phase of the cell cycle. Moreover, stroke augments cell cycle reentry. These data suggest that changes in the cell cycle kinetics and a shift in the fraction of cells that reenter the cell cycle regulate GF, which contribute to stroke-induced neurogenesis in the adult rat brain.
The proliferating population and the kinetics of the cell cycle in the VZ regulate cortical neurogenesis during development. Our observation that approximately 20% of the SVZ population in the adult rat was actively dividing is consistent with the proliferating population (15% to 21%) in postnatal animals (Schultze and Korr, 1981; Smith and Luskin, 1998). Stroke increases the proliferating cell population to 31%. However, the cumulative BrdU labeling protocol may underestimate the proliferating population in the SVZ after stroke because stroke increases SVZ cell migration towards the ischemic striatum and olfactory bulb compared with the number of SVZ cells in nonstroke rats (Luskin, 1993; Arvidsson et al., 2002; Jin et al., 2003; Katakowski et al., 2003; Zhang et al., 2004c). Many of the proliferating cells are type A cells, as determined by the phenotype markers Ki67 and DCX. These findings are consistent with our previous data that stroke augments the number of proliferating type A and type C cells in the SVZ (Zhang et al., 2004c). Actively proliferating progenitor cells (type A and C cells) compose 34%, while relatively quiescent neural stem cells compose approximately 2% of the total population of SVZ cells in the adult rodent (Morshead et al., 1994; Doetsch et al., 1997). The proliferating population measured by the cumulative BrdU labeling protocol in nonstroke and stroke rats likely represents actively proliferating progenitor cells, because neural stem cells have a cell cycle of approximately 15 days in the adult SVZ (Morshead et al., 1994). Therefore, whether stroke affects the cell cycle of neural stem cells remains unknown. In addition, Calegari et al. (2005) show that neural progenitor cells undergoing proliferative division or undergoing neuron-generating divisions have different cell-cycle lengths. However, the cumulative BrdU labeling protocol employed in the present study cannot differentiate the cell cycle length of type A cells from type C cells.
Data from cumulative BrdU labeling method indicated that the cell cycle length in the non-stroke was 19 h. The cell cycle length in the pseudostratified ventricular epithelium of E14 mice is 15.1 h (Takahashi et al., 1993) and 18 to 21 h in the SVZ of adult rat (Schultze and Korr, 1981; Smith and Luskin, 1998). In adult rodent, the cell cycle length in the SVZ remains relatively constant throughout the animal lifetime (Smith and Luskin, 1998). However, stroke substantially shortened the cell cycle length to a duration of 15.3 h, which is close to the cell cycle length of (15.1 h) in progenitor cells during cortical neurogenesis (Takahashi et al., 1993), indicating that, after stroke, the progenitor cells in the adult SVZ recapture cell cycle kinetics of progenitor cells in the developmental brain (Cramer and Chopp, 2000).
Analysis of the cell cycle phases revealed that stroke did not significantly change the lengths of the S and G2 + M phases. However, stroke significantly shortened the G1 phase, indicating that a shortening of the G1 phase of the cell cycle likely contributes to stroke induced decreases in the cell cycle length. Our findings are comparable with data obtained from cortical neurogenesis in embryonic mice. The length of the cell cycle increases from 8 to 18 h in E11 to E17, which results entirely from an increase in the length of G1 phase and no change in the length of S, and G2 + M phases (Takahashi et al., 1993; Caviness et al., 1999, 2003; Cai et al., 2002).
During cortical development, the proportion of cells that exit versus reenter the cell cycle regulates cortical neurogenesis and brain size (Caviness et al., 1999, 2003; Chenn and Walsh, 2002). MCM-2 is required for all dividing cells and is expressed in actively proliferating and relatively quiescent SVZ cells of adult brain (Maiorano et al., 1996; Maslov et al., 2004). Our data show that stroke significantly increased the numbers of BrdU+ and MCM-2+ cells 24 h after a single injection of BrdU, which was coincident with the threefold expansion of the size of the SVZ. A recent study shows that stroke induces apoptotic cells to reenter the cell cycle (Kuan et al., 2004). Although these cells can synthesize DNA, they are not able to enter late G2/M phases measured by the expression of HH3 (Kuan et al., 2004). The present study shows few TUNEL-positive cells in the SVZ both in nonstroke and stroke animals. In addition, stroke increases the numbers of HH3+ cells in the SVZ, which is consistent with our previous findings (Zhang et al., 2004c). Thus, our data indicate that stroke increases neuronal progenitor cells that reenter the cell cycle, which results in expansion of the neuronal progenitor cell population and enlargement of the SVZ.
In summary, the present study shows for the first time that stroke changes cell cycle kinetics of neural progenitor cells in the adult brain, resulting in an increase of the progenitor cell population. Augmentation of the progenitor cell pool increases neurogenesis, which replenishes damaged neurons after stroke (Arvidsson et al., 2002; Parent et al., 2002; Jin et al., 2003; Zhang et al., 2004b,c). Further understanding of the molecular signals that regulate cell cycle changes and how the decision to exit or reenter the cell cycle is made after stroke in the adult brain will lend valuable insight into the mechanisms underlying stroke-induced neurogenesis.
Footnotes
Acknowledgements
The authors wish to thank Dr Xue-peng Zhang, Cynthia Roberts and Qing-e Lu for technical assistance.