
Abstract
Neural progenitor cells in the subventricular zone (SVZ) of the lateral ventricular wall give rise to new neurons throughout rodent life. Ischemic stroke induces angiogenesis and neurogenesis. Using laser capture microdissection (LCM) in combination with microarrays containing approximately 400 known genes associated with stem cells and angiogenesis, we investigated gene profiles of SVZ cells in the adult mouse subjected to middle cerebral artery occlusion. Our data revealed that nonstroke SVZ cells expressed sets of genes that are important for neural progenitor cell proliferation, differentiation, and migration. In addition, stroke SVZ cells expressed many genes involved in neurogenesis during embryonic development but were not detected in nonstroke SVZ cells. Stroke upregulated genes were verified by real-time reverse transcriptase-polymerase chain reaction and immunostaining. These data indicate that adult SVZ cells recapture embryonic molecular signals after stroke and provide insight into the molecular mechanisms, which regulate the biological function of neural progenitor cells in the SVZ of adult rodent brain under physiological and stroke conditions.
Introduction
The adult rodent subventricular zone (SVZ) of the lateral ventricular wall contains actively proliferating progenitor cells and relatively quiescent neural stem cells (Morshead et al, 1994). Neural stem cells in the SVZ give rise to neuroblasts that travel the rostral migratory stream to the olfactory bulb, where they differentiate into granule and periglomerular neurons throughout adult life (Morshead et al, 1994; Garcia-Verdugo et al, 1998; Luskin, 1998). Stroke increases neurogenesis in the SVZ and newly generated neuroblasts migrate towards ischemic boundary regions (Arvidsson et al, 2002; Jin et al, 2001; Parent et al, 2002; Zhang et al, 2001, 2004). However, genes that control proliferation, differentiation, and migration of neural progenitor cells in the adult SVZ have not been fully investigated. Profiling gene expression is a necessary step in understanding the biological function of adult SVZ neural progenitor cells.
Using microarrays, two groups have shown complex gene profiles in cultured SVZ cells and polysialylated NCAM positive SVZ cells purified by fluorescent activated cell sorting (FACS) (Gurok et al, 2004; Pennartz et al, 2004). Although these studies provide valuable information in gene profiling of SVZ cells, gene profiles can be greatly altered during cell culture conditions. Using Affymetrix GeneChips, Lim et al (2006) recently measured in vivo gene expression profiles of adult SVZ tissue and demonstrated RNA splicing and chromatin remodeling as prominent processes for adult neurogenesis.
Laser capture microdissection (LCM) allows the isolation of individual cells from heterogeneous cell types within tissue, which provides a homogeneous cell population for gene expression analysis (Luo et al, 1999; Suarez-Quian et al, 1999; Liu et al, 2006). In the present study, using LCM in conjunction with cDNA microarray, we analyzed gene profiles of endogenous SVZ cells of adult mice subjected to middle cerebral artery occlusion by specifically focusing on genes involved in stem cells and angiogenesis.
Materials and methods
Animals Models
Male C57BL/6J mice were employed in this study. The right middle cerebral artery was occluded by placement of an embolus (15 mm length) at the origin of the middle cerebral artery, as previously described (Zhang et al, 1997). Animals were killed 7 days after middle cerebral artery occlusion based on our previous study (Zhang et al, 2004). Brain coronal sections (8 μm thick) were cut on a cryostat set at −20°C and kept at −80°C until processing. Nonstroke mice were used as a control group.
Laser Capture Microdissection and Sample Preparation
Cryostat sections stored at −80°C were immediately immersed in acetone for 2 mins fixation and air-dried for 30 secs. After a brief rinse with 0.1% diethylpyrocarbonate treated phosphate-buffered saline (PBS), sections were stained with propidium iodide dye (1:3000 dilution, Sigma, St Louis, MO, USA) for 5 mins, rinsed with PBS twice, and dehydrated in graded alcohols (75%, 90%, and 100% ethanol, 30 secs each) and xylene for clearance for 5 mins. All reaction steps were performed in RNase-free solutions. Sections were then air-dried under laminar flow for 10 mins and immediately used for LCM.
Propidium iodide positive SVZ cells were captured onto a thermoplastic film mounted on optically transparent LCM caps using the PixCell II LCM System (Arcturus Bioscience Inc., Mountain View, CA, USA). The following parameters were used during LCM: 7.5-μm laser spot size, 60-mW power, and 750 μs duration. The transfer film was examined under the microscope to ensure cell lysis. Caps with cells were immediately placed into Eppendorf tubes containing 350 μL of lysis buffer and stored in −80°C before RNA isolation. Approximately 5000 cells were isolated in the SVZ from each animal (Figure 1).
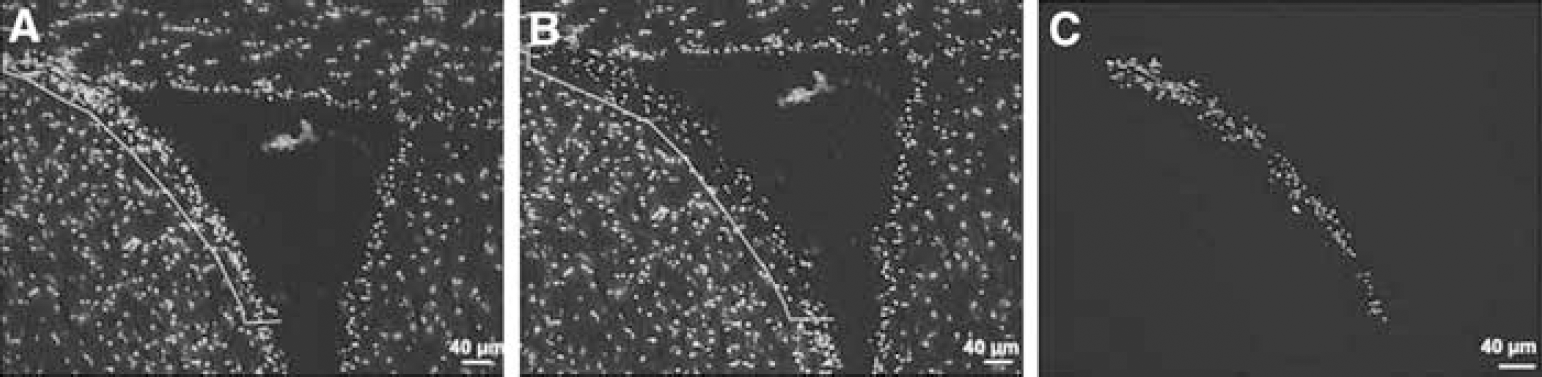
Fluorescent microscopic images of SVZ cells stained with propidium iodide. (
RNA Preparation from Laser Capture Microdissection Samples
Total RNA was extracted from the samples collected by LCM using an RNeasy spin column purification kit (Qiagen, Valencia, CA, USA) in accordance with the manufacturer's procedure. To remove possible genomic DNA contamination, RNase-free DNase was used during the RNA purification steps.
T7 RNA Polymerase-Based RNA Amplification and Purification
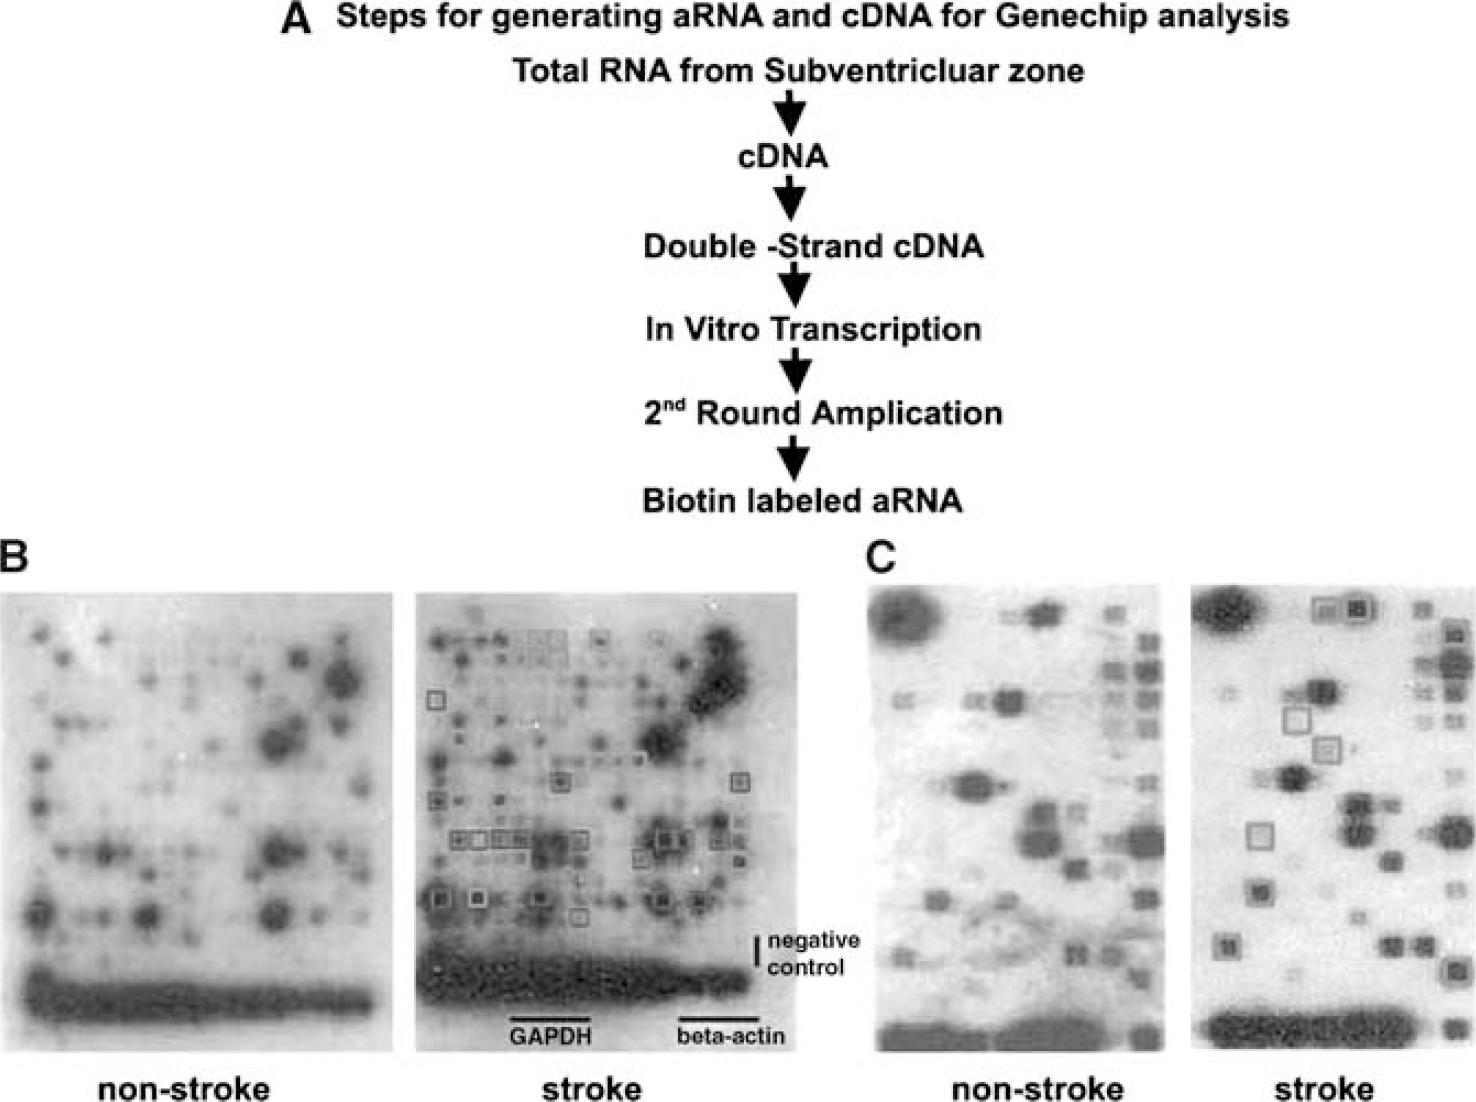
As low quantities of SVZ cells yield small amounts of RNA, extracted RNA obtained from single-cell populations were amplified using the RiboAmp™ RNA Amplification kit, according to the manufacturer's instructions (Arcturus, Mountain View, CA, USA). In brief, a first strand synthesis reaction yields cDNA incorporating a T7 promoter and a second-strand synthesis reaction using exogenous primers yields double-stranded cDNA. After purification, in vitro transcription yields antisense RNA by means of T7 RNA polymerase (Figure 2A). Two rounds of in vitro amplification were performed with the samples. Purified and amplified cDNA during the second linear round were selected for OligoArray analysis, while amplified RNAs were used for GE cDNA array analysis. The efficiency and quality of amplications were inspected by UV spectrophotometry.
(
Labeling and Hybridization
The nonradioactive GEArray Q series cDNA expression array filters (MM-601.2N; SuperArray Inc., Frederick, MD, USA) were used and hybridization procedures were performed as described by the manufacturer. The biotin dUTP-labeled cDNA probes (Biotin UTP-labeled oligo probes were applied in Oligo GEArray) were specifically generated in the presence of a designed set of gene-specific primers using total RNA (4 μg) and reverse transcriptase (1 μL). The array filters were hybridized with biotin-labeled probes at 60°C for 17 h. The filters were then washed twice with 2 × saline sodium citrate buffer/1% sodium dodecyl sulfate and twice with 0.1 × saline sodium citrate/1% sodium dodecyl sulfate at 60°C for 15 mins each. Chemilumilescent detection steps were performed by subsequent incubation of the filters with alkaline phosphatase-conjugated streptavidin and CDP-Star substrate.
For quantification, intensity of spots was measured by GEArray Expression Analysis Suite software (http://GEAsuite.superarray.com) and then the average intensities derived from blank spots were subtracted. Four random pictures from the bottom of each insert were acquired. These relative intensities were used to compare gene expression levels between nonstroke and stroke groups.
Reverse Transcription and Quantitative Real-Time Polymerase Chain Reaction
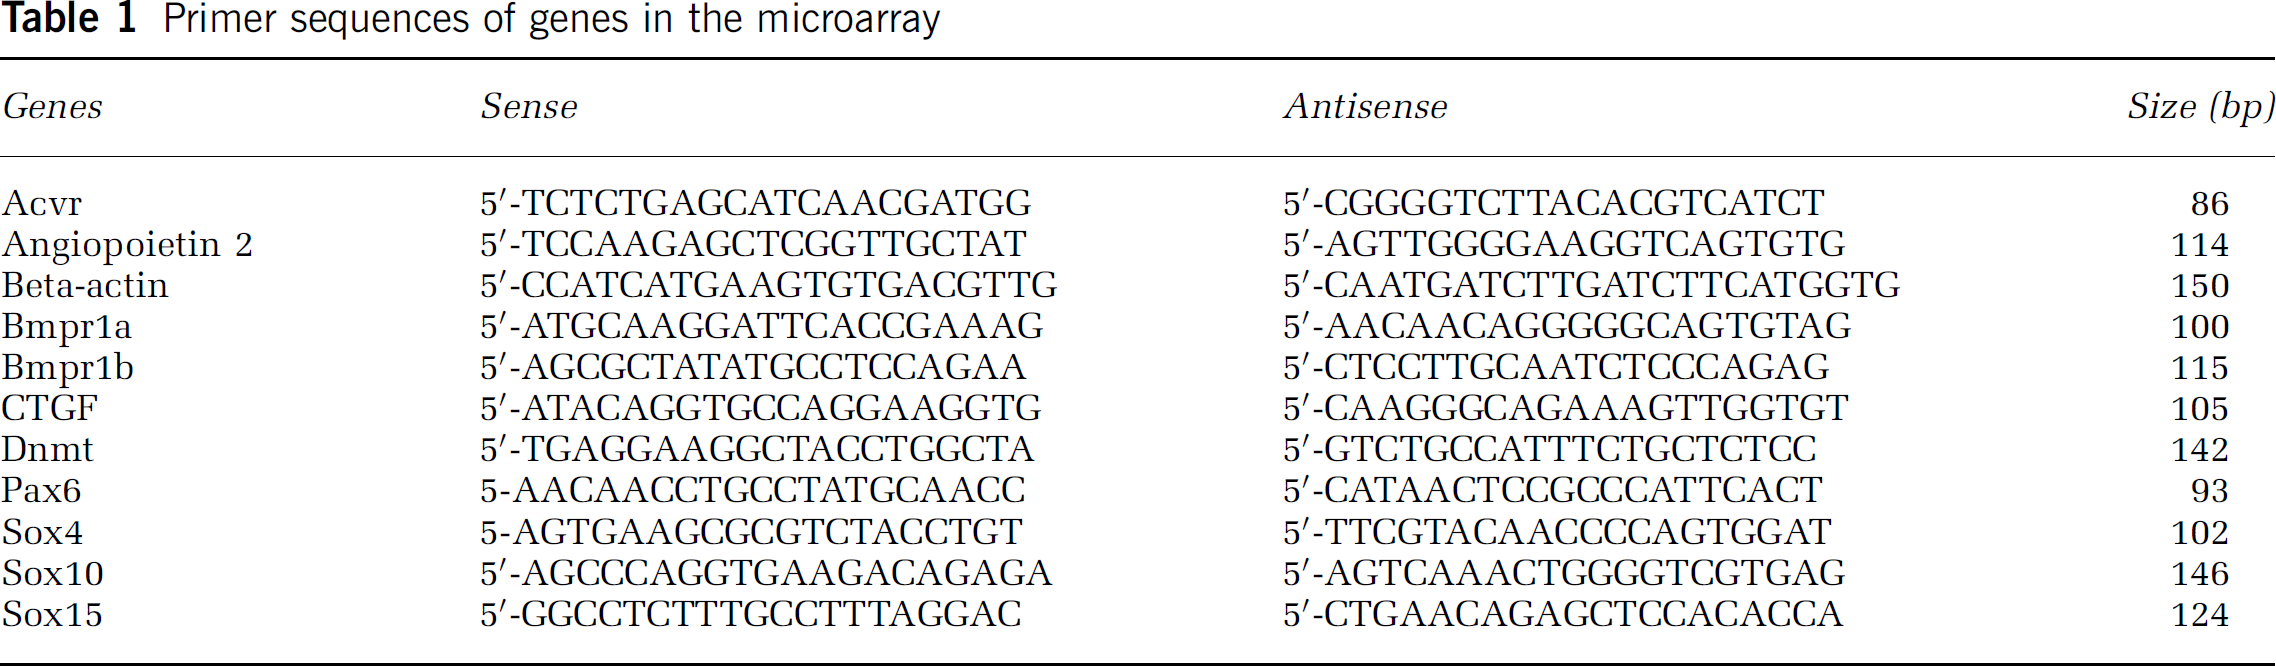
Total RNA from LCM cells was isolated using RNeasy Micro Kit (Qiagen Inc., Valencia, CA, USA) and followed by reverse-transcription. Quantitative reverse transcriptase-polymerase chain reaction (RT-PCR) was performed on an ABI 7000 PCR instrument (Applied Biosystems, Foster City, CA, USA) using three-stage program parameters provided by the manufacturer, as follows: 2 mins at 50°C to acquire optimal AmpErase uracil-N-glycosylase activity, 10 mins at 95°C to activate AmpliTaq Gold DNA polymerase, and then each cycle for 15 secs at 95°C, 1 min at 60°C for 50 cycles, 2 mins at 50°C, 10 mins at 95°C, and then 40 cycles of 15 secs at 95°C and 1 mins at 60°C. Table 1 lists primers (Invitrogen Inc., Carlsbad, CA, USA) specific for the genes examined in the present study. Each sample was tested in triplicate and data obtained from three independent experiments were expressed as a subtraction of the quantity of specific transcripts to the quantity of the control gene (β-actin) in mean arbitrary units. CT values were quantified by the 2−ΔΔCt method (Livak and Schmittgen, 2001).
Primer sequences of genes in the microarray
Immunohistochemical Assessment
For immunohistochemistry, briefly, frozen sections were air-dried for 30 secs, washed with PBS three times (5 mins each), followed by fixation with 4% paraformaldehyde for 20 mins at room temperature (Aceton was used for Integrin αV staining), then blocked with 1% bovine serum aluminum in PBS for 30 mins. Primary antibodies were applied for 1 h at room temperature. The following primary antibodies were used: goat polyclonal antibody against activin receptor type IIA (1:200, Abcam, Cambridge, MA, USA), rabbit polyclonal antibody against angiopoietin 2 (1:2000, Abcam), goat polyclonal antibody against bone morphogenetic protein 8a (1:1000, Santa Cruz biotechnology, CA, USA), rabbit polyclonal antibody against integrin alpha V (1:400, Chemicon international Inc., Temecula, CA, USA), after goat polyclonal antibody against sox 4 (1:500, Santa Cruz biotechnology, CA, USA). After three washes in PBS (5 mins each), biotinylated secondary antibodies (1:200, Vector, Burlingame, CA, USA) were applied for 30 mins at room temperature. The reaction product was detected using 3′-3′-diaminobenzidine-tetrahydrochloride (Sigma). PBS without primary antibody was used as a negative control.
For double immunofluorescent staining, following primary antibodies were used: polyclonal anti-bone morphogenetic protein 8a (1:200), polyclonal anti-angiopoietin 2 (1:200), mouse monoclonal anti-β-tubulin III (TuJ-1, 1:1,000; Covance company, Berkeley, CA, USA), rabbit polyclonal anti-glial fibrillary acidic protein (GFAP, 1:500; Dako, Carpinteria, CA, USA), and mouse monoclonal anti-nestin (1:100, BD Pharmingen, San Diego, CA, USA). Frozen coronal sections (8 μm) were incubated with the primary antibodies for overnight at 4°C and followed by incubation with species-specific secondary antibodies directly conjugated to fluorophores (Jackson ImmunoResearch, West Grove, PA, USA) for 1 h at room temperature. Nuclei were counterstained with 40, 60-diamidino-2-phenylindole (1:5000; Vector Laboratories, Burlingame, CA, USA).
Quantification
Semiquantitative measurements of immunoreactive cells were performed, according to our previously published methods (Zhang et al, 1999, 2005a). Briefly, immunoreactive cells in the nonstroke and stroke SVZ were digitized under a 40 × objective (BX40; Olympus Optical) using a 3-CCD color video camera (DXC-970MD; Sony, Tokyo, Japan) interfaced with an MCID image analysis system. The data are presented as a percentage of positive immunoreactivity area within the total SVZ area (pixel).
Statistical Analysis
Student's t-test was performed to analyze immunoreactivity between the nonstroke and stroke groups. The data are presented as mean±s.d.; P<0.05 was taken as significant difference.
Results
General Gene Profiles in Subventricular Zone Cells
Subventricular zone cells of the lateral ventricle were readily distinguished from other cells on propidium iodide stained sections (Figure 1). Using LCM, we isolated SVZ cells in the lateral ventricular wall from stroke and nonstroke mice. To analyze genes involved in neurogenesis and angiogenesis, we employed the GEArray S Series Mouse Stem Cell Gene Array containing 258 known genes and the Oligo GEArray Mouse Angiogenesis Microarray containing 113 known genes (www.superarray.com). Figures 2B and 2C show profiles of genes in stroke and nonstroke SVZ cells from representative mouse stem cell and angiogenesis gene arrays. As expected, two house-keeping genes, β-actin and glyceraldehydes-3-phosphate dehydrogenase, and two positive controls show hybridization signals, while blank negative controls show the absence of any hybridization signals (Figure 2B). To identify the relevant differentially expressed genes, all clones with more than 1.5-fold estimated differences were considered for further evaluation. This threshold is based on a statistical analysis using online software provided by Superarray company. The SVZ contains a heterogeneous population of cells (Marshall et al, 2003). Thus, genes detected in these microarrays represent gene profiles of cells in the SVZ niche.
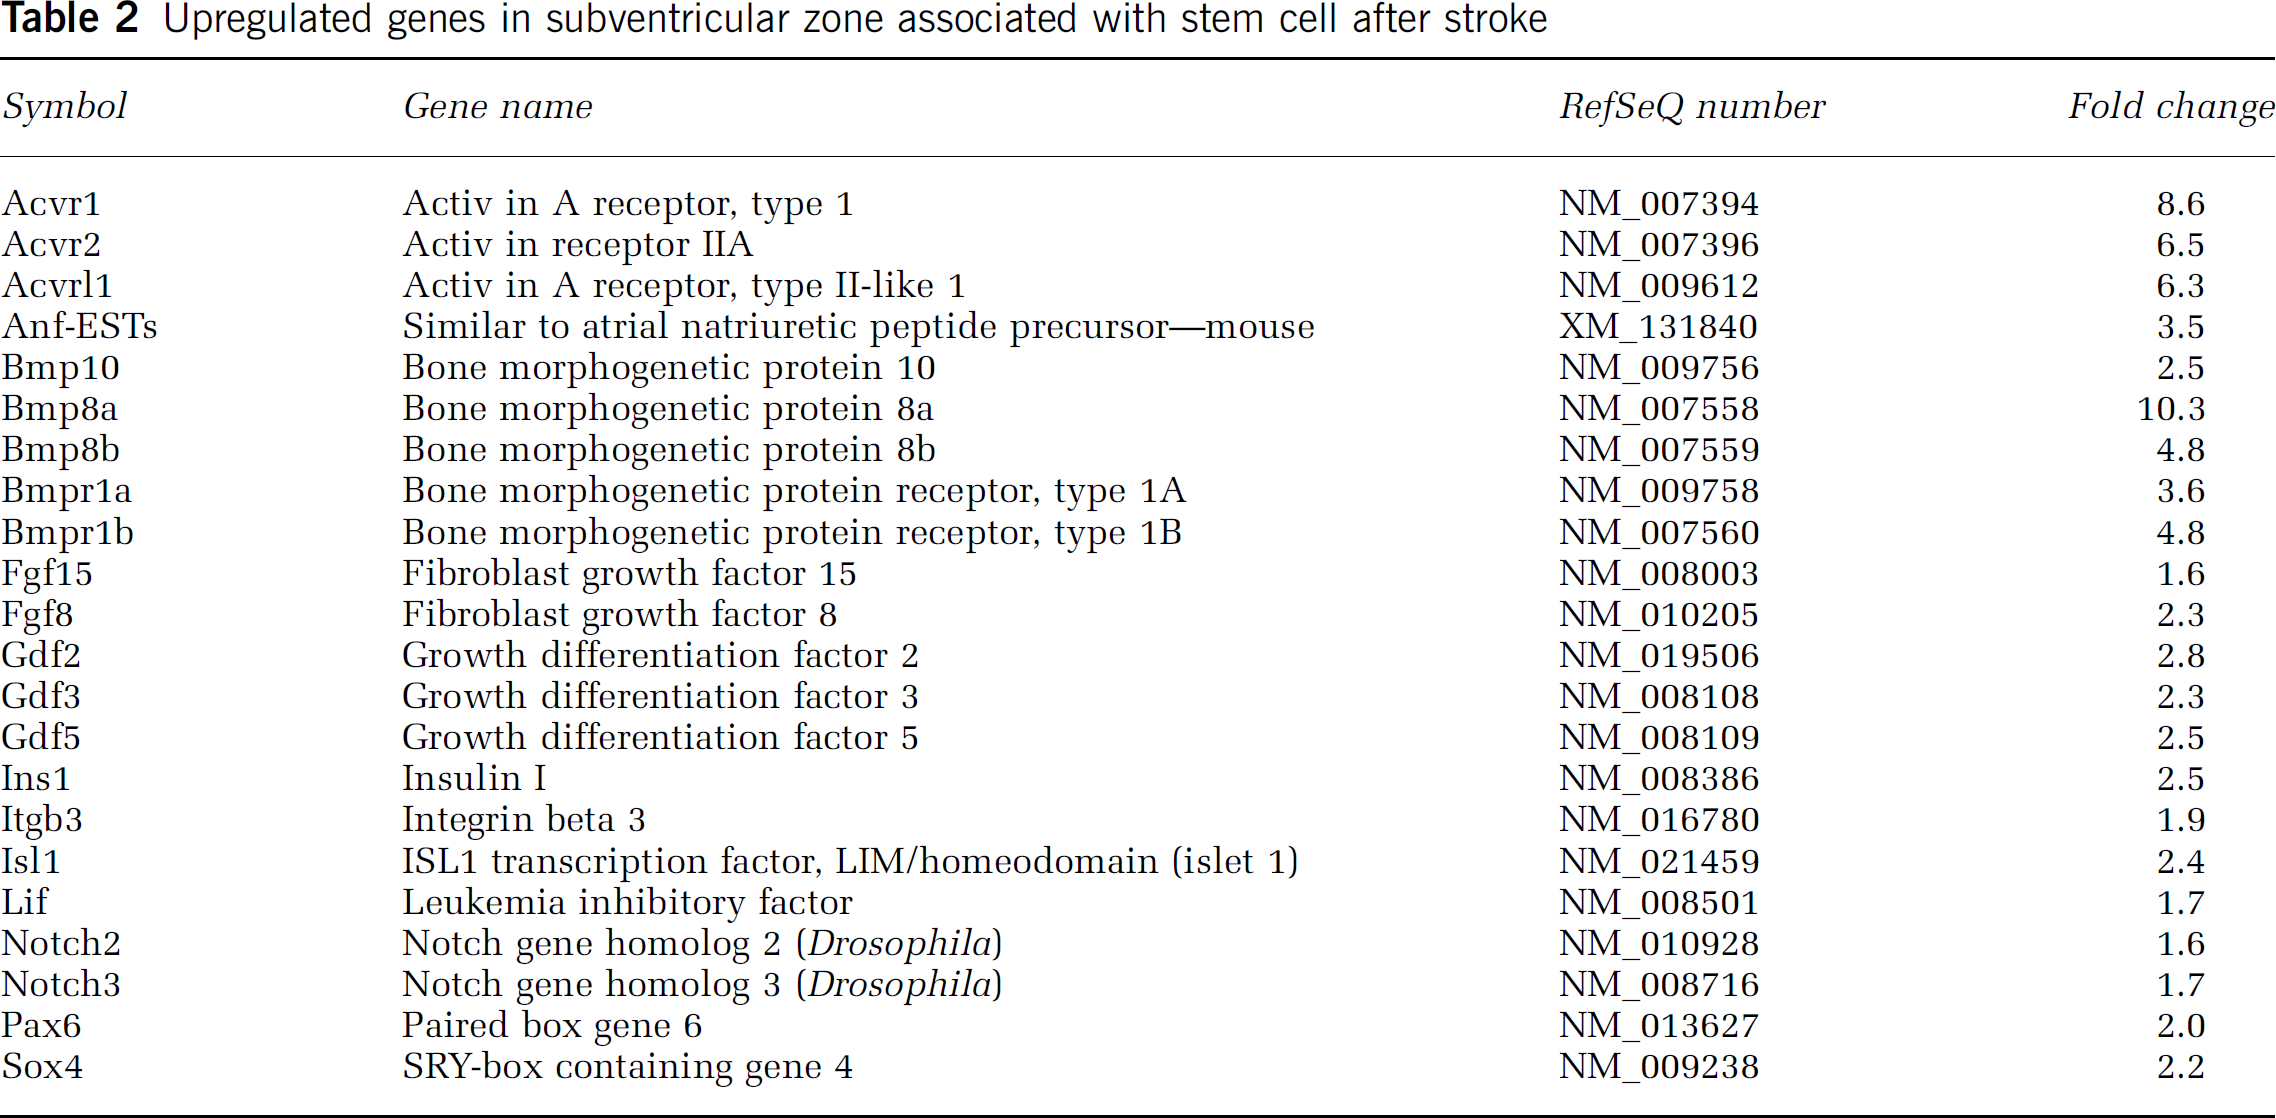
In nonstroke SVZ cells, 40 of 258 genes and nine of 113 genes were detected on the stem cell and angiogenesis gene arrays, respectively (Figure 2 and Tables 2, 3 and 4). Many of the 49 genes are associated with neural progenitor cells (Tables 2, 3 and 4). These genes included transforming growth factor-β superfamily, transcription factors, growth factors, Wnt, shh, and notch pathways, cell cycle, and angiogenesis.
Upregulated genes in subventricular zone associated with stem cell after stroke
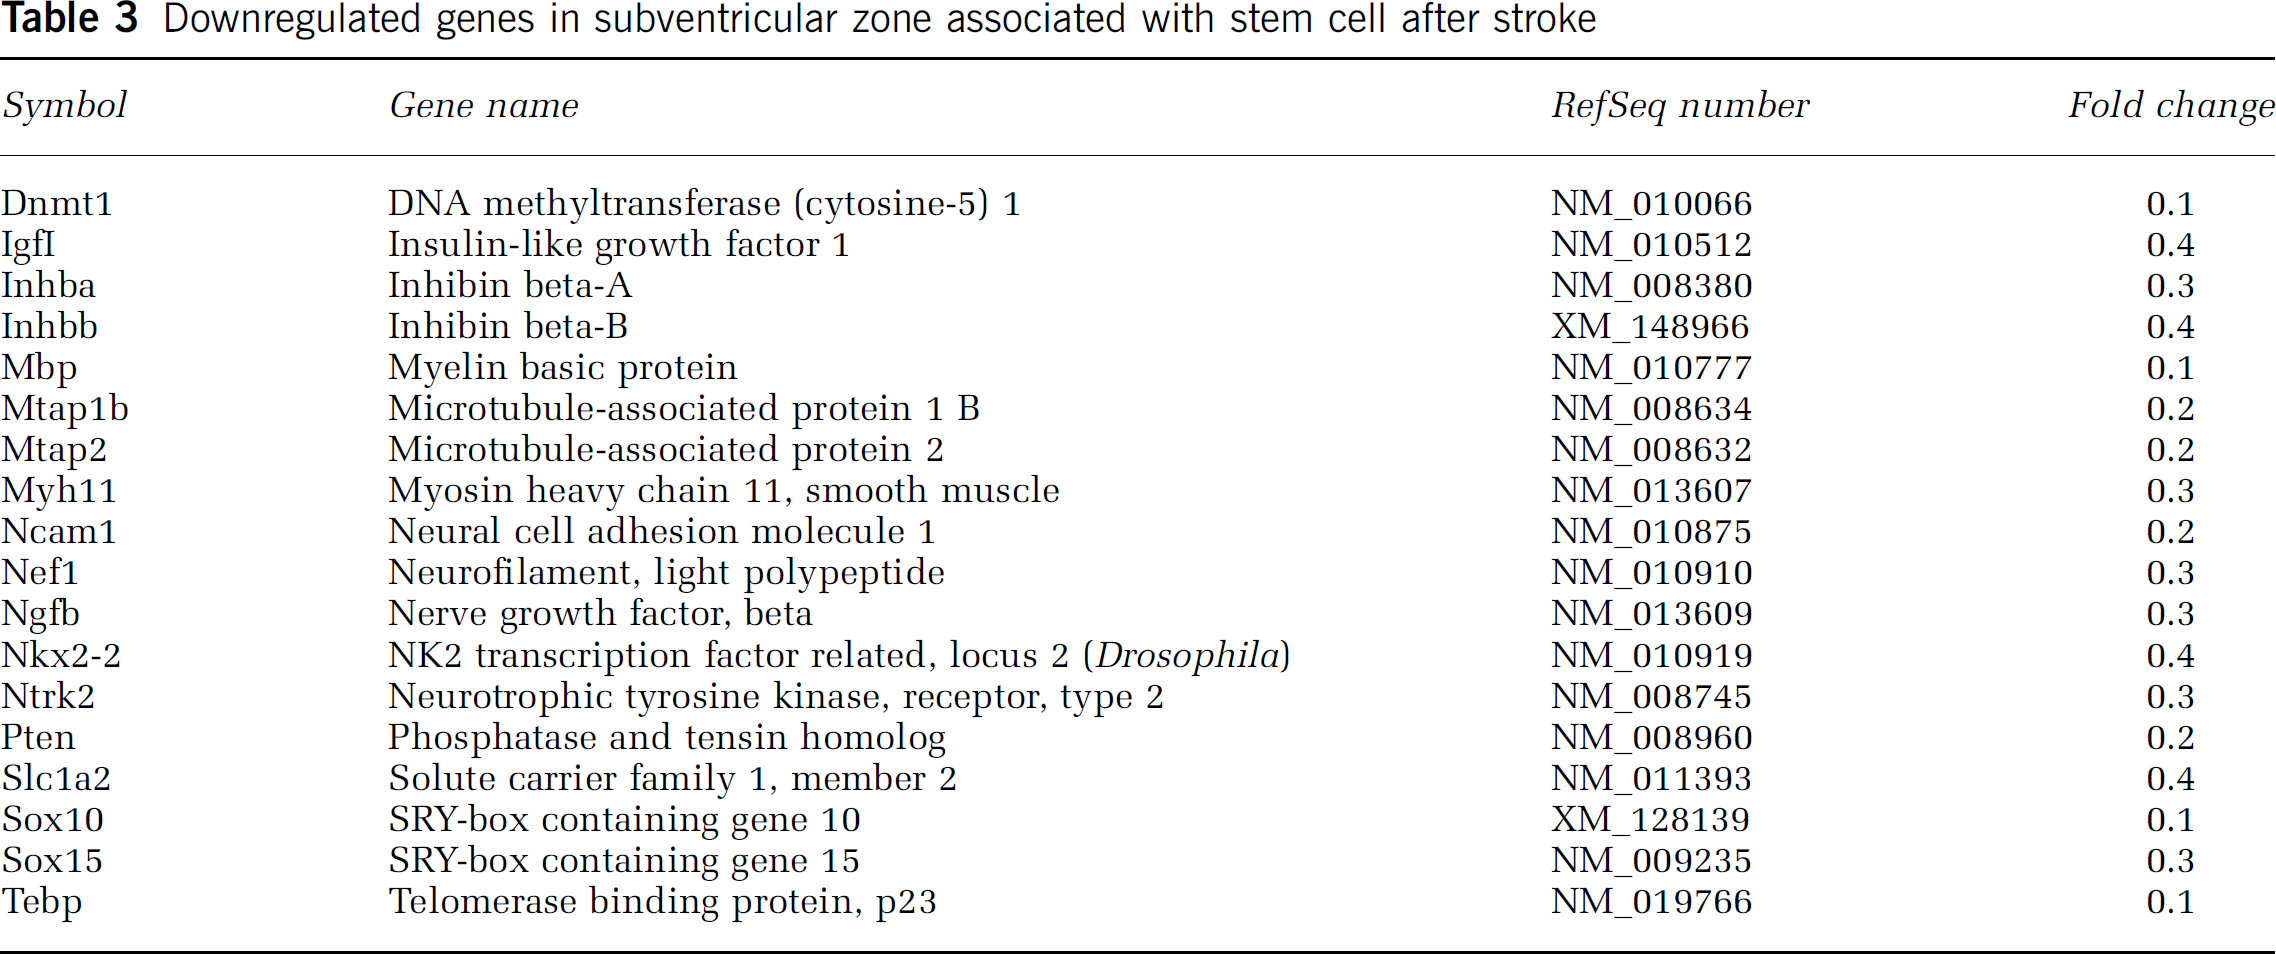
Downregulated genes in subventricular zone associated with stem cell after stroke
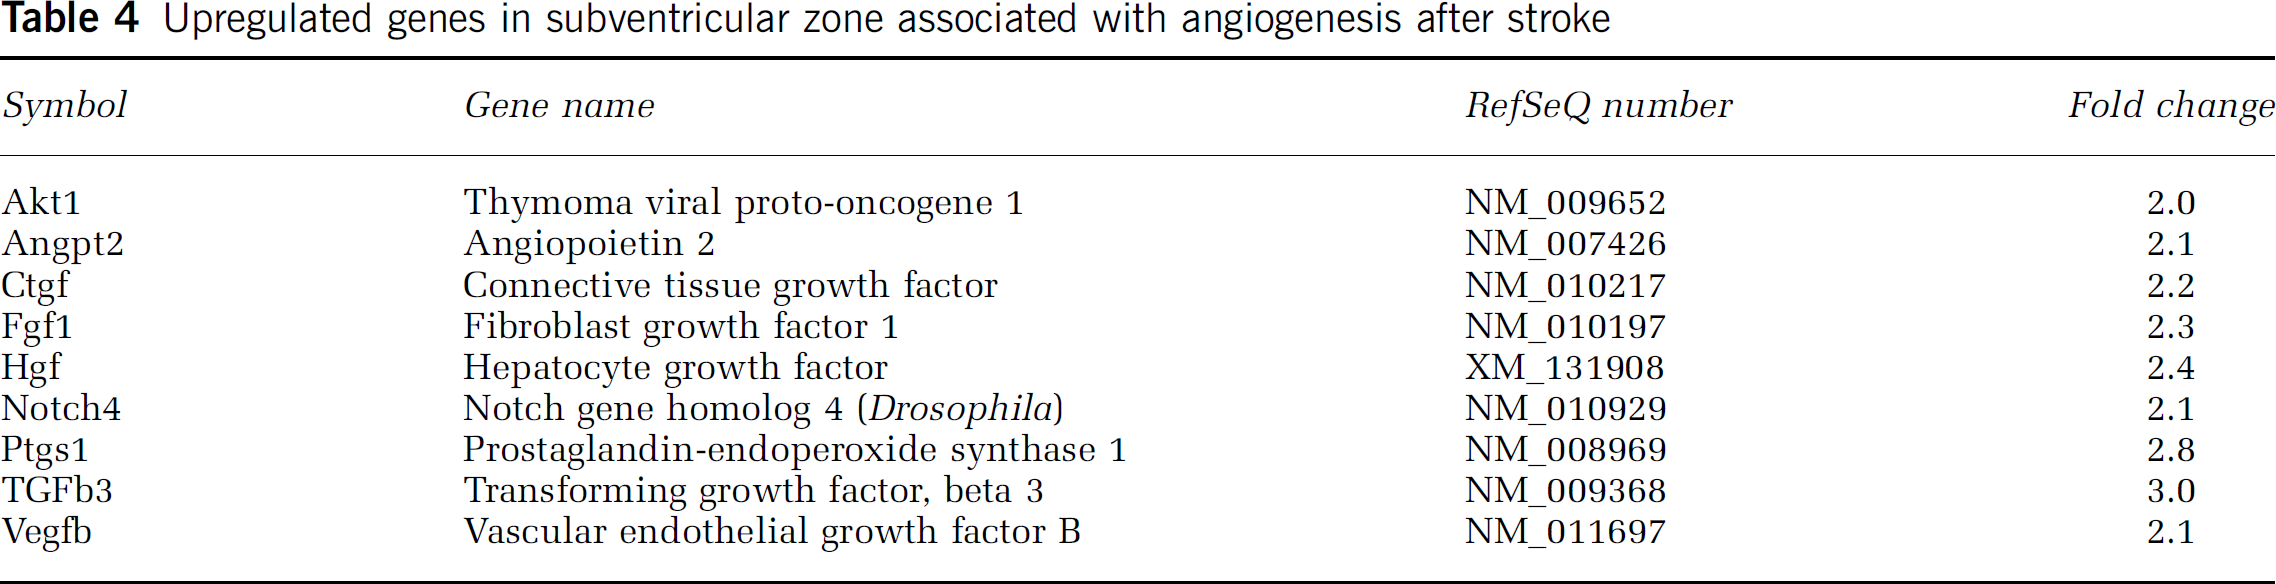
Upregulated genes in subventricular zone associated with angiogenesis after stroke
Expression of Transforming Growth Factor-β Superfamily Genes in Subventricular Zone Cells
Transforming growth factor β (TGF-β) signaling controls a diverse set of cellular processes, including cell proliferation, differentiation, and apoptosis (Patterson and Padgett, 2000; ten Dijke et al, 2002; Massagué et al, 2000). It contains two subfamilies, the TGF-β/Activin/Nodal subfamily and the bone morphogenetic protein (Bmp)/growth and differentiation factor (Gdf)/Muellerian inhibiting substance subfamily. Many members of these two subfamily genes were detected in nonstroke SVZ cells, which include Bmp 10, Bmp 8a, Bmpr1a, Bmpr1b, Gdf 2, 3, and 5, the ligands of activin A receptor type 1, type II-like 1, and activin recptor II A (Table 2). Stroke upregulated some of these genes on microarray and upregulation of Bmp 8a, Bmpr 1a and Bmpr 1b was confirmed using real-time RT-PCR analysis (Figure 3). Correspondingly, stroke significantly decreased expression of the antagonists of activin signaling, inhibin beta-A and beta-B, (Table 3). Collectively, these data suggest that TGF-β signaling could contribute to stroke-induced neural progenitor cell proliferation, differentiation, and survival.
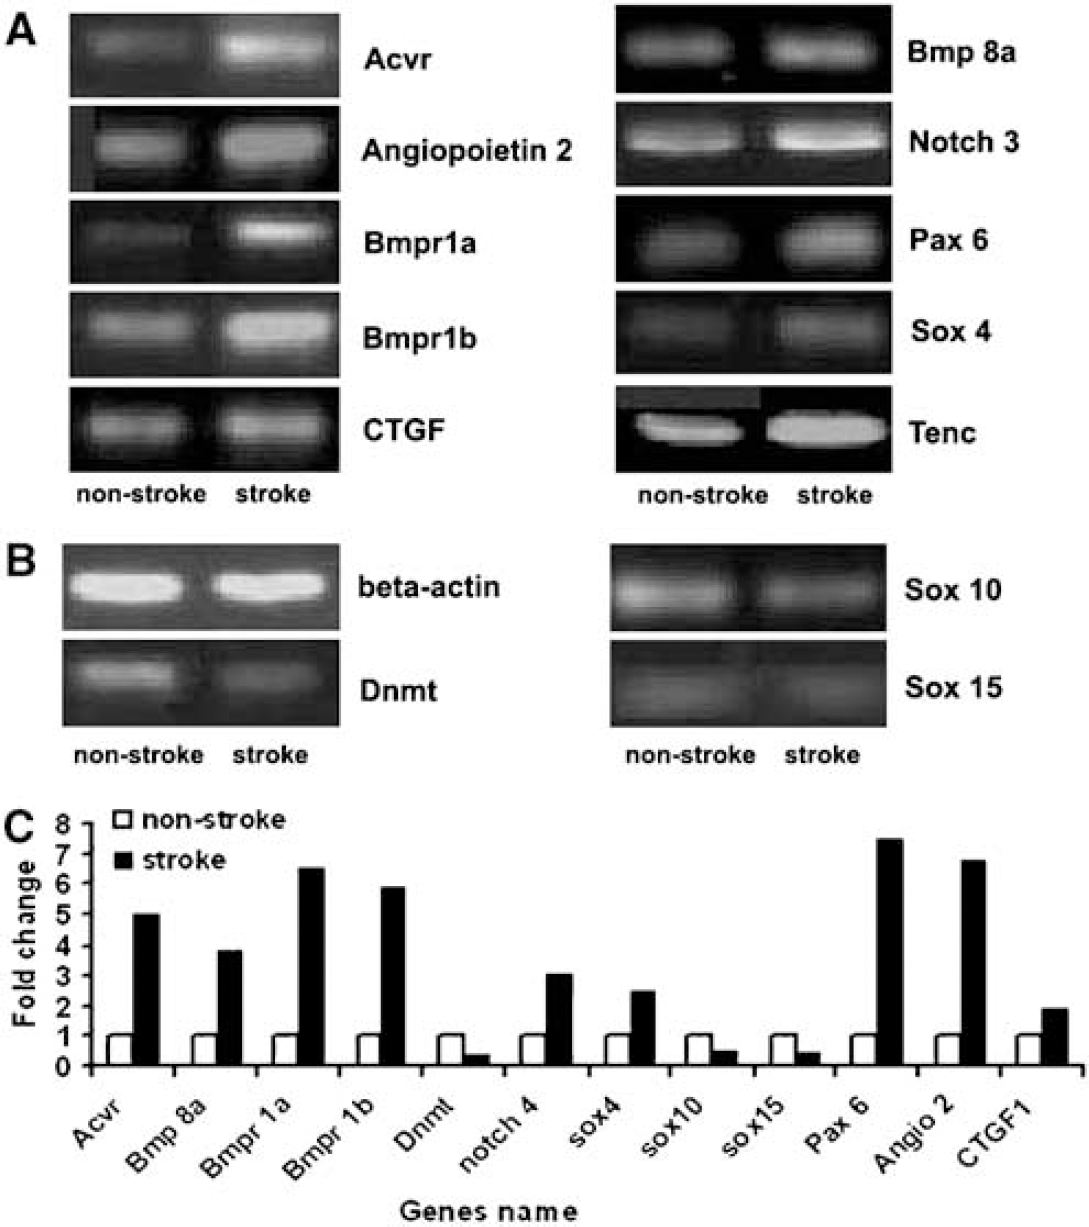
Real-time RT-PCR analysis of mRNA levels in nonstroke and stroke SVZ cells. (
Expression of Signaling Pathway Genes in Subventricular Zone Cells
Genes in the Wnt pathway, such as frizzled 1 and 8, and an shh receptor gene, Ptc, were detected in nonstroke SVZ cells, indicating that these morphogenes regulate SVZ cell function (Figure 2B) (Lie et al, 2005). Moreover, notch signaling pathway genes, notch 2, 3 were detected. Expression of these genes was upregulated in stroke SVZ cells (Table 2).
Expression of Transcriptional Factors in Subventricular Zone Cells
Transcriptional factors are expressed in SVZ cells (Pennartz et al, 2004; Gurok et al, 2004). We detected strong signals for several transcription factors which belong to different families in nonstroke SVZ cells (Figure 2). Among them were sox transcription factor family (sox 2, 3, 9, 18), transcription factors forehead box O1a (FKHR1) and G1 (Hfhbf1), POU domain class3, transcription factor 2 (Brn2), and zinc-finger transcription factors (Zfp 110).
Compared with normal SVZ cells, sox 4, a member of the sox transcription factor family, showed a striking increase in stroke SVZ cells (Table 2). Sox 4 belongs to sox subgroup C, and is expressed in the early differentiating cells of the embryonic SVZ (Hargrave et al, 1997; Cheung and Briscoe, 2003). In addition, sox 10 and sox 15 were downregulated in stroke SVZ cells (Table 3). Sox 10 has been shown to modulate glial specification and differentiation in the peripheral nervous system and spinal cord (Kordes et al, 2005).
Expression of Growth Factors and Cytokines in Subventricular Zone Cells
Fibroblast growth factors (Fgfs) are multifunctional signaling proteins that regulate neurogenesis (Gabay et al, 1996). Upregulation of Fgf 8 and Fgf 15 were detected in stroke SVZ cells (Table 2), which are involved in olfactory neurogenesis, whereas expression of insulin-like growth factor-I was decreased in stroke SVZ cells (Table 3). In addition, expression of leukaemia inhibitory factor was increased in stroke SVZ cells. Leukaemia inhibitory factor and its receptor are required to regulate embryonic stem cell proliferation and differentiation (Kurisaki et al, 2005; Meyn et al, 2005).
Expression of Neurotransmitters in Subventricular Zone Cells
One intriguing finding was the presence of a key member of the glutamate/neutral amino-acid transporter protein family. Solute carrier family 1 member 2 (Slc1A2) was easily detected in nonstroke and stroke SVZ cells, whereas solute carrier family 2 member 1 (Slc2A1, Glt1) was only identified in stroke SVZ cells (Figure 2B). The role of these genes in neurogenesis has not been investigated.
Expression of Genes Involved in Angiogenesis in Subventricular Zone Cells
Nonstroke SVZ cells expressed many genes that are involved in angiogenesis, including VEGF b, Flt1 (VEGFR 1), angiopoietin 2 and its receptor Tie 2, and Ephrin family genes, Ephrin A1, Ephrin A3, Ephrin B2, and Eph receptor B4 (Figure 2C). Expression of angiopoietin 2, Vegfb, and Prostaglandin-endoperoxide synthase 1 were increased after stroke (Table 4).
Expression of Genes Involved in the Cell Cycle in Subventricular Zone Cells
As expected, the genes associated with cell cycle including cyclin-dependent kinase inhibitor p27Kip1, cyclic nucleotide phosphodiesterase 1 (Cnp1) were highly expressed in nonstroke SVZ cells (Figure 2B). In addition, phosphatase and tensin homologue deleted on chromosome 10 (Pten), a tumor suppressor gene that suppresses cell growth, was detected in nonstroke SVZ cells and stroke substantially decreased Pten expression (Table 3).
Real-Time Reverse Transcriptase-Polymerase Chain Reaction and Immunohistochemistry
To verify stroke-upregulated genes observed in microarrays, we performed QRT-PCR analysis for selective 12 genes (Acvr, Angiopotein 2, Bmp 8a, Bmpr 1a, Bmpr 1b, CTGF, Dnmt, notch 4, Pax 6, sox 4, sox 10, and sox 15) in SVZ cells isolated by LCM. Upregulation of these genes was detected in stroke SVZ cells compared with that in nonstroke SVZ cells (Figure 3), confirming findings in the microarrays. Immunostaining showed significant increases of SVZ cell immunoreactivity of Acvr, Angiopoietin 2, Bmp 8a, Ccl 2, integrin αV, sox 4, and tenascin C compared with immunoreactivity in cells of the contralateral SVZ (Figures 4A and 4B).
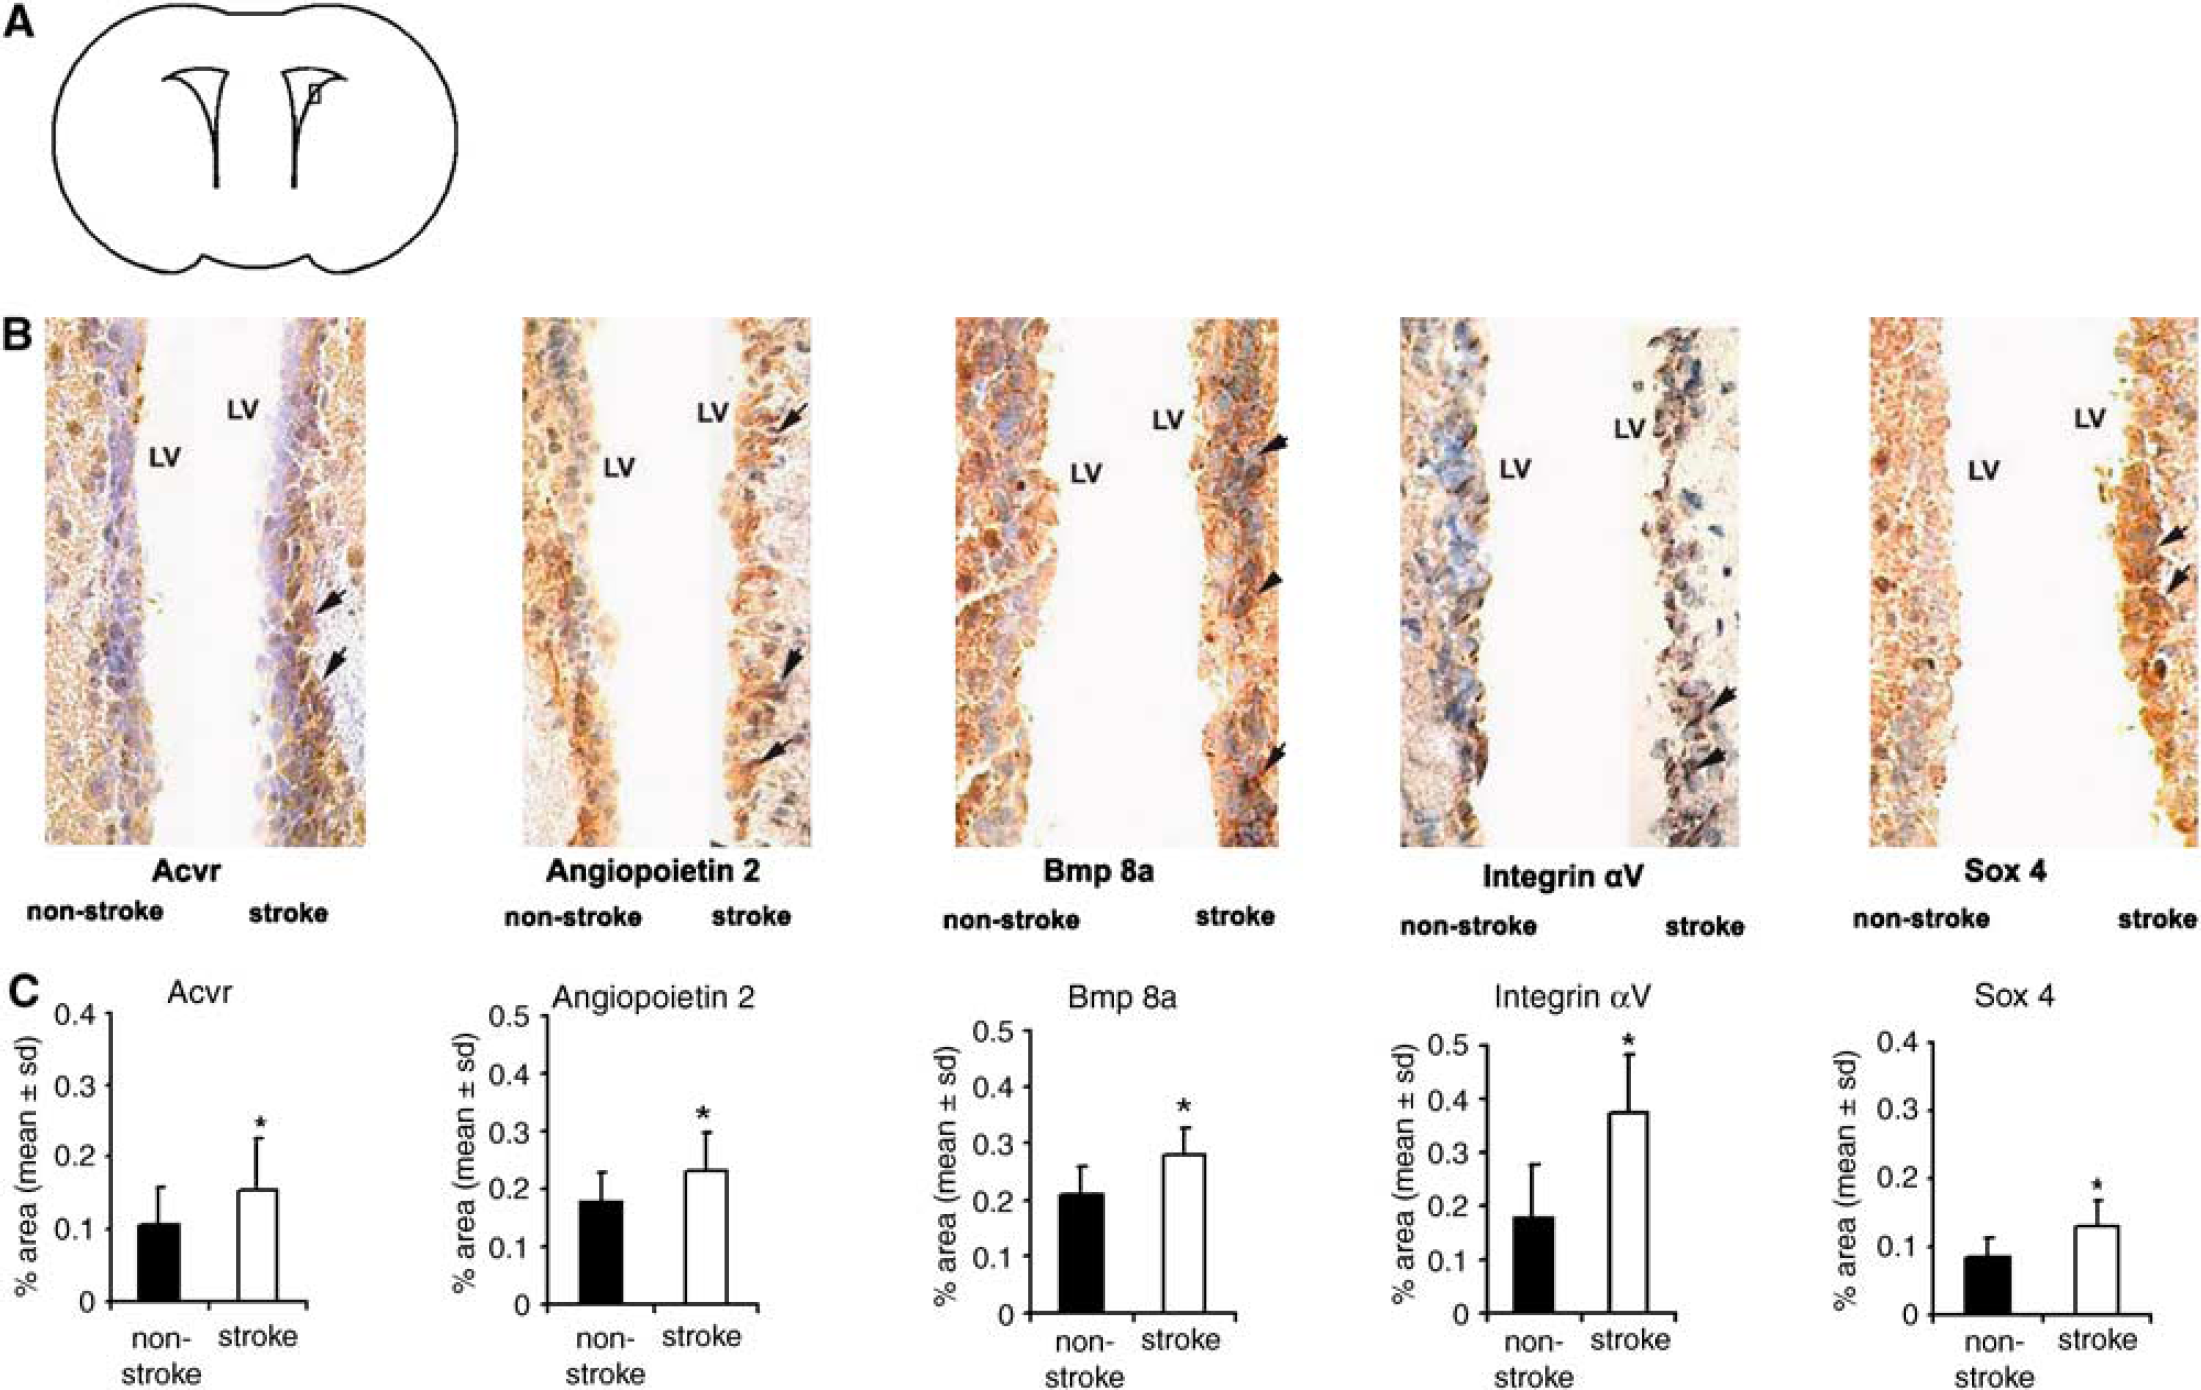
Images of immunoreactivity in SVZ cells. A box in (
Double immunofluorescent staining for selected genes revealed that Bmp 8a positive cells were nestin positive (Figures 5A–5D) and angiopoietin 2 positive cells were GFAP (Figures 5E–5H) or nestin immunoreactive (Figures 5I and 5L), indicating that type B and C cells express Bmp 8a and angiopoietin 2.
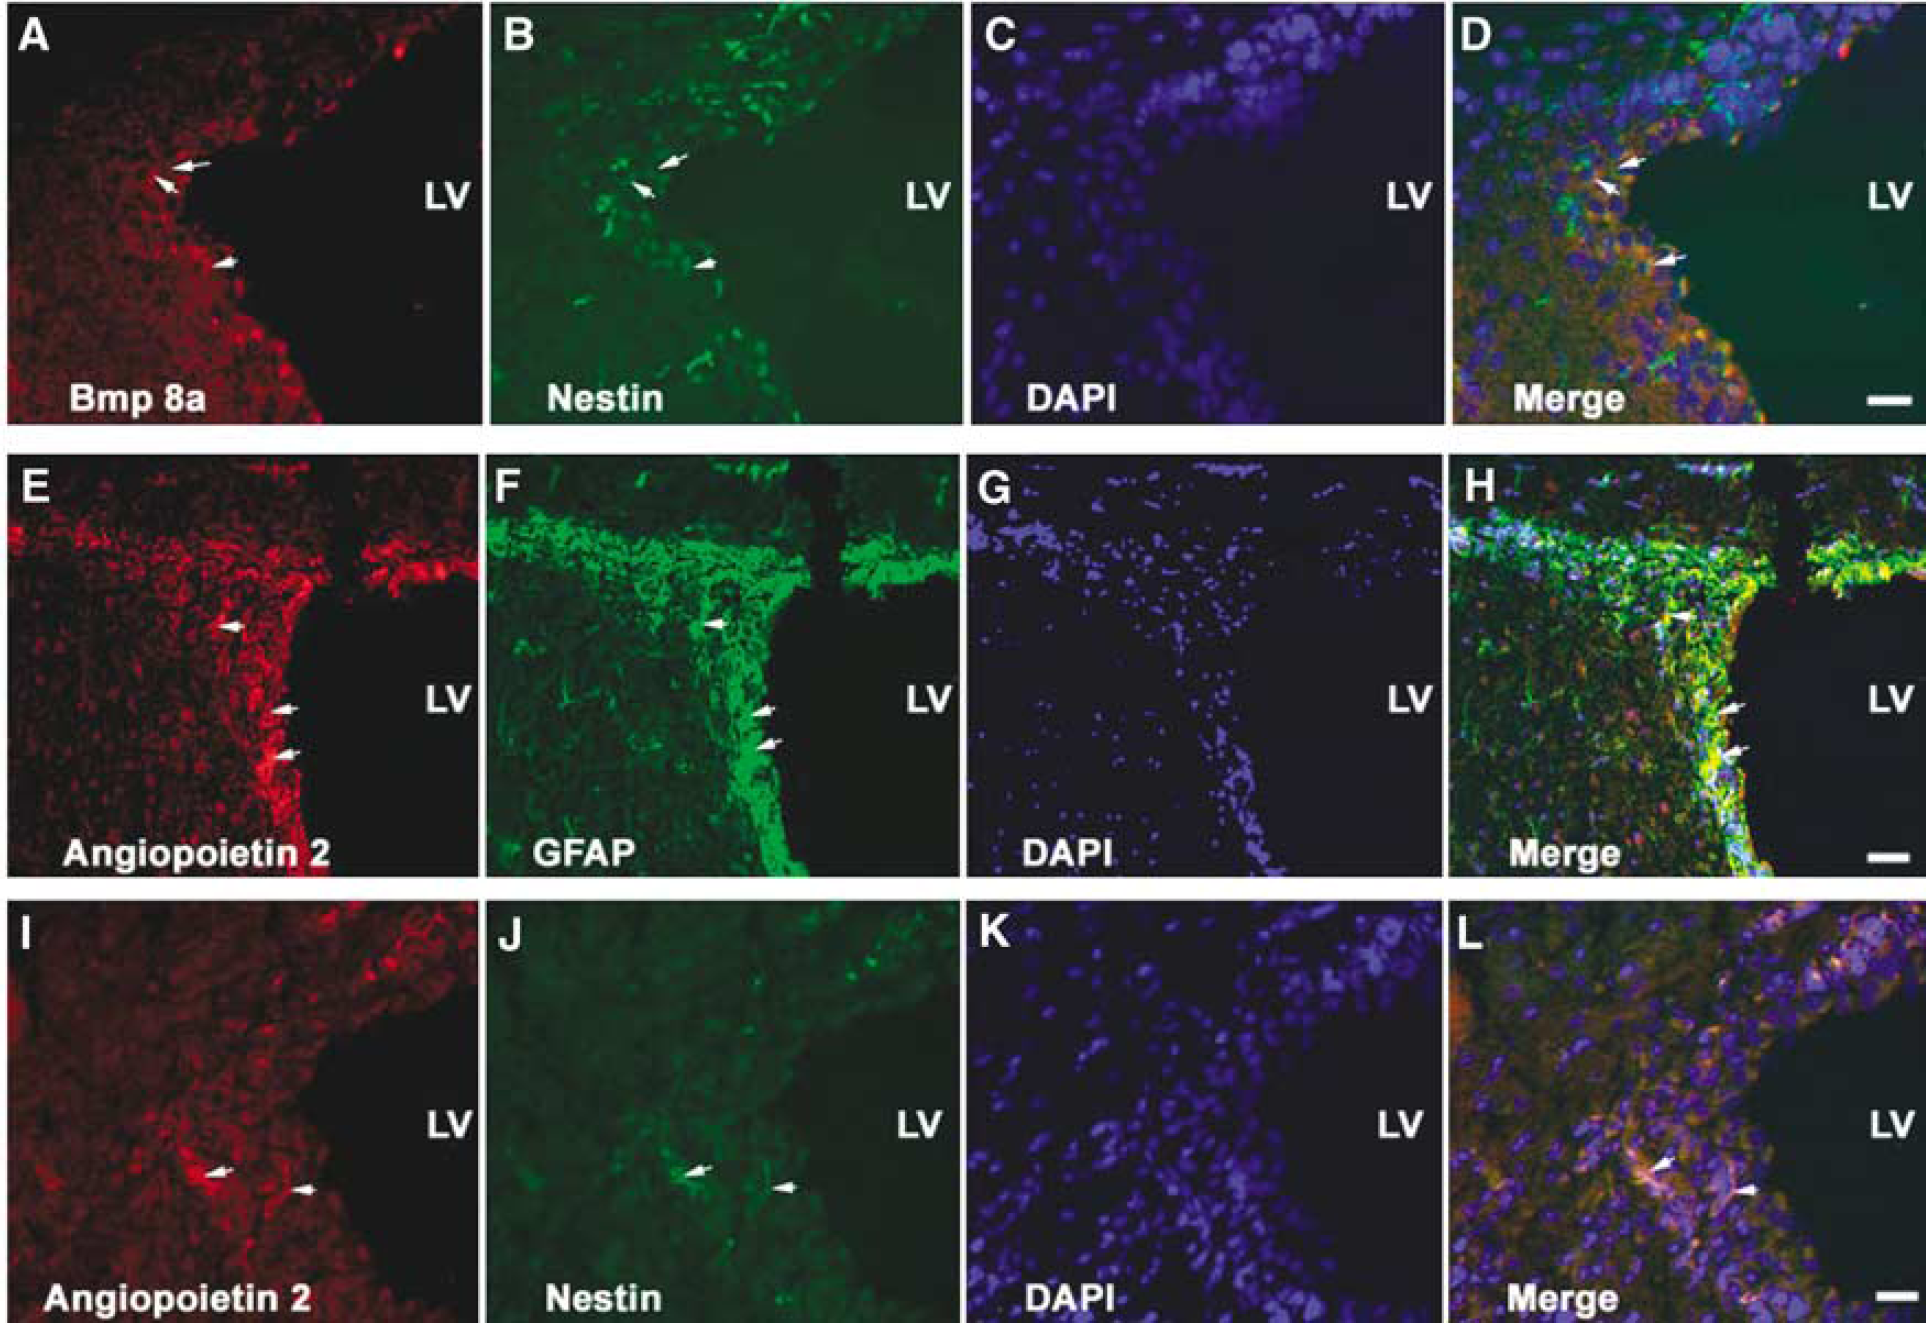
Micro-photographs of double immunofluorescent staining of SVZ cells. Bmp 8a immunoreactive cells (
Discussion
Using LCM in combination with customized microarrays focusing on genes involved in stem cells and angiogenesis, we analyzed gene profiles of adult SVZ cells in nonstroke and stroke mice. Our data revealed that nonstroke SVZ cells expressed sets of genes that are important for neural progenitor cell proliferation, differentiation, and migration. In addition, stroke SVZ cells expressed many genes that are involved in neurogenesis during embryonic development, but were not detected in nonstroke SVZ cells, indicating that adult SVZ cells recapture embryonic molecular signals after stroke. These data provide insights into the molecular mechanisms that regulate the biological function of neural progenitor cells in the SVZ of adult rodent brain under physiological and stroke conditions.
Gene expression profiles of adult SVZ cells have been examined in samples from brain tissue and cultured SVZ cells (Pennartz et al, 2004; Lim et al, 2006). The adult SVZ has notable gene expression and histological differences from both embryonic and postnatal SVZ (Tramontin et al, 2003). The SVZ contains a heterogeneous population of cells (Doetsch et al, 1997; Garcia-Verdugo et al, 1998). Type A cells are neuroblasts that divide relatively frequently and type B cells are astrocytes that form a glial boundary between migrating neuroblasts and the underlying striatum (B2) as well as between migrating neuroblasts and the ependymal cells (B1). Type C cells are the most actively proliferating cells, while type B2 cells are relatively quiescent neural stem cells (Doetsch et al, 1997; Garcia-Verdugo et al, 1998). Neurospheres derived from SVZ cells can generate neurons, astrocytes, and oligodendrocytes in the presence of bFGF and EGF, which have been widely used as an in vitro assay of neurogenesis. The high levels of exogenous growth factors used to propagate neurospheres deregulate normal gene expression, and likely lead to significant alterations in their gene profiles (Ben-Zion Shilo, 2005; Nakatomi et al, 2002). Gene expression profile analysis from brain tissue cannot exclude contamination of the adjacent cells around SVZ cells. We, therefore, employed LCM to isolate single population of SVZ cells in brain slices of adult mice and analyzed gene profiles of SVZ cells, which reflects endogenous SVZ neural progenitor cell gene profiles. Indeed, many genes detected in nonstroke SVZ cells in the present study matched genes previously identified in SVZ tissue and cultured SVZ cells (Gurok et al, 2004; Pennartz et al, 2004; Lim et al, 2006). Complex gene expression profiles in nonstroke SVZ cells are consistent with the SVZ cellular components containing a heterogeneous population of cells and their biological function of proliferation, differentiation, and migration.
We found that nonstroke SVZ cells expressed many members of TGF-β superfamily genes such as Bmp 8, Gdf 2, and Bmp type I receptors, which is consistent with previous studies in adult mice, which show that adult SVZ cells express Bmps and Bmp type I receptors (Lim et al, 2000; Peretto et al, 2002). Transforming growth factor-β superfamily genes have a broad range of biological effects and control processes during development and tissue repair (Mishra et al, 2005). Incubation of murine embryonic SVZ cells with Bmp 2, Bmp 4, and Bmp 7 promotes astroglial lineage commitment, and this effect is not mimicked by application of other members of TGF-β superfamily such as TGF-β1 and activin A (Gross et al, 1996). Blocking Bmps with Noggin, a Bmp antagonist which is expressed in the ependymal cells, enhances SVZ neurogenesis, whereas overexpression of Bmp 7 in the ependymal cells suppresses neurogenesis, indicating that Noggin antagonizes Bmp signaling to create a niche for adult SVZ neurogenesis (Lim et al, 2000). However, studies in the neonatal rat show that overexpression of Bmp type 1 receptor 1a in the anterior SVZ promotes SVZ cells to exit the cell cycle and differentiate into neurons, indicating that SVZ cells retain their neuronal commitment under augmented Bmp signaling (Coskun et al, 2001). The biological function of TGF-β superfamily genes in stroke SVZ cells has not been investigated. The present study shows that stroke substantially upregulated Bmp 8, Gdf 2, Bmp type I receptors, and activin receptors in SVZ cells. Stroke promotes proliferation of SVZ cells and enhances SVZ cell differentiation into neurons (Zhang et al, 2001, 2004, 2005b; Parent et al, 2002). Upregulation of Bmps and their receptors in SVZ cells after stroke suggests that these signaling molecules could mediate stroke-induced neurogenesis in the adult SVZ.
The Notch family of receptors participates in many developmental cell fate decisions and in certain contexts promotes an undifferentiated, precursor cell state. Notch1 and a cognate ligand, Jagged 1, are expressed in both the SVZ and subgranular zone (SGZ) of postnatal mice (Stump et al, 2002). Notch 1 and Jagged 1 are required for maintaining SVZ cell proliferation and differentiation (Nyfeler et al, 2005). In parallel, we detected expression of Jagged 1 in nonstroke SVZ cells and a moderate increase of notch 2 and notch 3 expressions after stroke.
A gene profile of transcriptional factors has been measured in cultured SVZ cells and these factors play an important role in the regulation of neurogenesis (Gurok et al, 2004; Pennartz et al, 2004). We found that stroke changed expression of several transcriptional factor genes, especially sox transcriptional factors. Stroke increased expression of sox 4’ but downregulated sox 10 and sox 15. Sox 4 is expressed in the early differentiating cells of the embryonic SVZ (Cheung and Briscoe, 2003). In addition, sox 10 maintains multipotency of neural progenitor cells, inhibits neuronal differentiation of neural crest stem cells, and modulates glial differentiation in the peripheral nervous system and spinal cord (Kordes et al, 2005, Kim et al, 2003; Maruyama et al, 2005). Collectively, these data suggest that upregulation of sox 4 and downregulation of sox 10 after stroke may contribute to stroke-induced neurogenesis in the adult mouse.
Pten negatively regulates the PI3K/Akt pathway and neural stem/progenitor cell proliferation (Stambolic et al, 1998, Groszer et al, 2001; Li et al, 2002). Stroke activates Akt in SVZ cells and the activated Akt promotes neuroblast migration and cell proliferation (Katakowski et al, 2003). The downregulation of Pten in SVZ cells after stroke could trigger activation of the PI3K/Akt pathway.
SVZ cells expressed DNA methyltransferase 1 (Dnmt1) and stroke remarkably decreased Dnmt1 expression in SVZ cells. The change of an undifferentiated progenitor cell to a specialized cell type requires switches in gene expression that alters the pattern of inactive and active genes of these two cellular states. This switch in gene expression involves changes of chromatin states that differ in the accessibility of genomic DNA regions for transcription factors that positively or negatively control certain target genes involved in this process. Downregulation of Dnmt1 in stroke SVZ cells indicate that altered methyl metabolism could induce epigenetic changes in SVZ neural progenitor cells.
Angiopoietin 2 (Ang 2) regulates angiogenesis (Acker et al, 2001). Expression of Ang 2 in SVZ cells indicates that in addition to its role in angiogenesis, Ang 2 may have function in neural progenitor cells. Indeed, a recent study shows that Ang 2 induces glioma cell invasion by stimulating MMP2 expression through the αVβ1 integrin (Hu et al, 2006). We have shown that activation MMP 2 and MMP 9 in the SVZ cells mediates neuroblast migration under normal and stroke conditions (Zhang et al, 2006). The present data show increases of mRNA and protein of αV integrin in SVZ cells after stroke. We speculate that upregulation of Ang 2 could activate MMP2 in the way as it does for glioma cell invasion.
Compared with gene profile changes detected in other brain cells after stroke, upregulation of Wnt, notch, sox family genes in SVZ cells of the present study appears specific for neural progenitor cells after stroke (Sharp et al, 2000; Schmidt-Kastner et al, 2002; Lu et al, 2004; Rickhag et al, 2006). However, the majority studies measured gene profiles in the brain cells other than SVZ cells focusing on the acute stage of ischemic stroke (Sharp et al, 2000; Kim et al, 2002; Schmidt-Kastner et al, 2002; Lu et al, 2004; Rickhag et al, 2006). Further studies to identify genes trigged by ischemia specific for neural progenitor cells are warranted.
In summary, our data show gene profiles of neural progenitor cells in adult nonstroke and stroke mice, which provide information for future analysis of the molecular and cellular mechanisms of neurogenesis in the adult rodent brain.
Supplement
The linkage to the full list of arrays is as followed: http://www.superarray.com/gene_array_product/HTML/OMM-024.html and http://www.superarray.com/gene_array_product/HTML/MM-601.2.html respectively.
Footnotes
Acknowledgements
We are grateful to Cindi Roberts who provided the technical support for immunohistochemistry.