
Abstract
Cerebral ischemia induces the expression of several growth factors and cytokines, which protect neurons against ischemic insults. Recent studies showed that granulocyte colony-stimulating factor (G-CSF) has a neuroprotective effect through the signaling pathway for the antiapoptotic cascade. The current study was designed to assess the neuroprotective mechanisms of G-CSF in ischemia/reperfusion injury using bone marrow chimera mice known to express enhanced green fluorescent protein (EGFP). Mice were subjected to ischemia/reperfusion and divided into two groups: those treated with G-CSF (G-CSF group) and vehicle (control group) (n = 35 in each group). Immunohistochemistry and immunoblotting for antiapoptotic protein, nitrotyrosine, and inducible nitrate oxide synthase (iNOS) were performed. G-CSF significantly reduced stroke volume (34%, P < 0.006). G-CSF upregulated Stat3, pStat3, and Bcl-2 (P < 0.05), and suppressed iNOS and nitrotyrosine expression. In EGFP chimera mice, G-CSF decreased the migration of lba-1/EGFP-positive bone marrow-derived monocytes/macrophages and increased intrinsic microglia/macrophages at ischemic penumbra (P < 0.05), suggesting that bone marrow-derived monocytes/macrophages are not involved in G-CSF-induced reduction of ischemic injury size. Our study indicated that G-CSF exerts a neuroprotective effect through the direct activation of antiapoptotic pathway, and suggested that G-CSF is important for expansion of the therapeutic time window in patients with cerebral ischemia.
Introduction
Stroke is a silent killer. It carries a high risk of death worldwide and 3 million women and 2.5 million men die from brain attack every year, constituting 10% of total deaths worldwide. The number of patients afflicted with cerebral ischemia is on the increase at present and stroke is a leading cause of disability worldwide, with no effective clinical treatment that enhances recovery. Currently, intravenous recombinant tissue plasminogen activator is used for acute ischemic stroke as thrombolytic therapy. Although it provides neuroprotection, its usefulness is limited in some patients mainly because of the limited time window for its administration. Therefore, attention has focused on neuroprotective treatment that could potentially expand the therapeutic time window in patients with acute ischemic stroke such as the use of free radical scavengers (Toyoda et al, 2004) and hypothermia (Hammer and Krieger, 2003). Several recent studies showed that intraventricular or intracerebral injections of neurotrophic factors, such as basic fibroblast growth factor, brain-derived neurotrophic factor, interleukin (IL)-1, and vascular endothelial growth factor, could limit experimental cerebral infarction (Ohtsuki et al, 1996; Schabitz et al, 2000; Ma et al, 2001; Sun et al, 2003). However, because these methods require surgical intervention, it is clinically desirable to explore less invasive therapeutic procedures.
Granulocyte colony-stimulating factor (G-CSF), which is clinically used for the treatment of neutropenia, is a member of cytokine family of growth factors. It stimulates the proliferation, survival, and maturation of the neutrophilic granulocyte lineage (Avalos et al, 1997). In addition, G-CSF has other nonhematopoietic effects. The binding of G-CSF to the G-CSF receptor activates Janus protein tyrosine kinase/signal transducer and activator of transcription (JAK/STAT) pathway. Recently, a few reports described the neuroprotective effect of G-CSF treatment in cerebral ischemia (Schabitz et al, 2003; Six et al, 2003). One of the main mechanisms of action for this effect is activation of the JAK/STAT pathway through intracellular signaling from G-CSF-G-CSF receptor binding in cerebral ischemia, which could be induced after activation of the antiapoptotic cascade (Konishi et al, 1993; Fukada et al, 1996; Shimozaki et al, 1997). Another nonhematopoietic effect of G-CSF is antiinflammatory action mediated by inhibition of the inducible nitric oxide synthase (iNOS) activity, as shown in splanchic ischemia/reperfusion injury (Squadrito et al, 1997). Other studies reported the relationships between G-CSF and glial activation (Zavala et al, 2002).
In the present study conducted in a transient focal ischemia model of mice, we tested the hypothesis that G-CSF has a neuroprotective effect in cerebral ischemia and that such effect is mediated through antiapoptotic pathway by activating the JAK/STAT pathway, in addition to the reduction of iNOS activity. We also analyzed the role of neutrophils in cerebral ischemia using enhanced green fluorescent protein (EGFP) chimera mice.
Materials and methods
Experimental Groups
The protocol described here received prior approval by the Committee on Animal Experimental Guidelines of Juntendo University School of Medicine. Adult male C57BL/6 mice (Charles River Japan Inc., Kanagawa, Japan), weighing 20 to 25 g, were divided at random into vehicle-treated group (control group, n = 35), injected intravascularly through the tail vein with 0.9% saline, and G-CSF-treated group (G-CSF group, n = 35), injected intravascularly with 50 μg/kg recombinant human G-CSF (Kirin Co., Tokyo, Japan) dissolved in the same volume of 0.9% saline for 60 mins beginning 30 mins after vessel occlusion. Mice were housed under diurnal lighting and provided with food and water before the experiments. All mice were transplanted with EGFP-expressing bone marrow from transgenic mice using the procedure reported by our group (Furuya et al, 2003; Tanaka et al, 2003).
Enhanced Green Fluorescent Protein-Expressing Bone Marrow Transplantation
Enhanced green fluorescent protein transgenic mice (8 weeks old) were treated with 5-fluorouracil and at 48 h after injection, bone marrow cells were collected. Recipients were 8-week-old male C57BL/6 mice (n = 30, Charles River Japan Inc.). To diminish the radiation effect on the mice brain, a lead cap was placed on the head of each mouse. Each mouse received 10 Gy of irradiation to the body and 5 Gy to the head while wearing the lead cap. After harvesting, the EGFP-expressing bone marrow cells were injected through the tail vein at a dose of 6.0 × 10⁷ cells. At 6 weeks after bone marrow transplantation, each recipient mouse was entered into the study of transient focal cerebral ischemia.
Transient Occlusion of the Middle Cerebral Artery
Animals were initially anesthetized with 4% and maintained with 1.5% isoflurane−70% N2O−30% O2. The left middle cerebral artery (MCA) was occluded for 60 mins followed by release of the occlusion, as described previously (Hara et al, 1996). During this procedure, the body temperature was kept at 37.0°C ± 0.5°C using a heat pad. Laser-Doppler flowmetry was used to monitor cerebral blood flow (CBF) before, during, and after occlusion of MCA. As a control, sham-operated mice underwent the same procedure except for MCA occlusion (MCAO). At 6 weeks after bone marrow transplantation, EGFP-bone marrow chimera mice, weighting 24 to 27 g, received the same surgical procedure for focal cerebral ischemia. At 6 and 24 h, a blood sample was withdrawn from the tail vein for leukocyte count in peripheral blood.
To measure the infarct volume, brains were removed at 24 and 72 h after reperfusion (n = 6 for each group) and evaluated using six 2,3,5-triphenyltertrazolium chloride-stained 1-mm-thick slices. The stained brain tissue was fixed in 10% buffered formalin solution. For quantification of the infarct volume, the brain slices were photographed using a charge-coupled device camera (FinePix S304, Fujifilm, Tokyo, Japan) with a commercially available image analysis program (Axio Vision 3.1, Zeiss, Japan). To compensate for brain edema, the correct infarct volume was calculated as described in detail by Lin et al (1993).
Neurologic Evaluation
At 24 and 72 h after reperfusion, clinical neurologic deficit was assessed by an observer masked to the treatment and scored into four categories as described previously (Hara et al, 1996): grade 0, no observable neurologic deficit (normal); grade I, failure to extend the left forepaw on lifting the whole body by the tail (mild); grade II, circling to the contralateral side (moderate); and grade III, leaning to the contralateral side at rest or no spontaneous motor activity (severe).
Immunohistochemistry
Animals of each group were anesthetized by intraperitoneal injection of pentobarbital (50 mg/kg) at 24 or 72 h after reperfusion (n = 5 for each group). The brain was removed immediately en bloc and postfixed for 24 h in 4% paraformaldehyde in phosphate-buffered saline (PBS) at 4°C before cryoprotection by bathing in 30% sucrose. It was then frozen and 20-μm-thick consecutive coronal sections were prepared on a cryostat (Leica CM 1900, Germany). To determine the origin and location of G-CSF-activating cells, immunohistochemical staining was performed for ionized calcium binding adapter molecule (Iba-1; Wako Pure Chemical Industries, Osaka, Japan), Stat3, pStat3 (Cell Signaling Technology, Beverly, MA, USA), Bcl-2 (Dako Corporation, Carpinteria, CA, USA), iNOS (BD Bioscience, San Jose, CA, USA), and nitrotyrosine(Upstate Biotechnology, Lake Placid, NY, USA). Sections were stained with monoclonal anti-iNOS antibody (dilution, 1:300) or anti-Bcl-2 antibody (dilution, 1:40), polyclonal anti-Iba-1 antibody (dilution, 1:2,000), anti-Stat3 antibody (dilution, 1:300), anti-pStat3 antibody (dilution, 1:300), or anti-nitrotyrosine antibody (dilution, 1:50) by the avidin–biotin–peroxidase complex method. The sections were incubated for 30 mins with 0.3% H2O2 at room temperature, and then incubated overnight at 4°C with 10% normal goat or house serum (Dako) and primary antibody. After washing in PBS, the sections were incubated for 2 h at room temperature with biotinylated goat anti-rabbit IgG or biotinylated house anti-mouse IgG (dilution, 1:300; Vector Laboratories, Burlingame, CA, USA). Then, the sections were incubated with avidin–biotin–peroxidase (Vectastatin ABC kit; Vector Laboratories) at 1:100 dilution for 1 h at room temperature. After washing in PBS, the sections were finally incubated for 10 to 20 mins with a solution containing 0.02% 3,3-diaminobenzidine tetrachloride and 0.03% H2O2 in PBS. Sections were dehydrated in serially concentrated ethanol solutions, immersed in xylene, and coverslipped with Malinol (Muto Pure Chemicals Co., Tokyo, Japan).
Double Immunofluorescence Staining
To determine the origin of EGFP-expressing cells, Iba-1-, Stat3-, pStat3-, Bcl-2-, and nitrotyrosine-positive cells, immunohistochemical staining was performed for micro-tubule-associated protein 2 (MAP-2, a neuron-specific marker), NeuN (a neuronal marker), Iba-1 (which is specifically expressed in microglia and cells of monocytic lineage), glial fibrillary acidic protein (GFAP, which is specifically expressed in astrocytes), and mouse Ly-6G (Gr-1, a granulocyte marker). Moreover, the association between Bcl-2 and Stat3 or pStat3 was also assessed by double immunofluorescence staining.
Free-floating sections of EGFP-bone marrow chimera mouse or C57BL6 mouse were washed with PBS and incubated in a blocking solution, 3% Block Ace (Yukijirushi, Sapporo, Japan) in T-PBS (0.5% Triton X-100), for 30 mins at room temperature. Double immunofluorescence staining was performed by simultaneous incubation of the sections overnight at 4°C with primary antibodies: anti-Stat3 (dilution, 1:100), anti-pStat3 (dilution, 1:50), anti-Bcl-2 (dilution, 1:40), anti-iNOS (dilution, 1:200), anti-MAP-2 (dilution, 1:100; Bio-Rad Technologies, Richmond, CA, USA), anti-NeuN (dilution 1:100; CHEMICON, Temecula, CA, USA), anti-Iba-1 (dilution, 1:2,000), anti-GFAP (dilution, 1:500; Dako), or anti-Gr-1 (dilution, 1:200; Pharmingen, San Diego, CA, USA). For double labeling, the primary antibodies were detected with Alexa594-conjugated secondary antibody (dilution, 1:500; Vector Laboratories) and fluorescein isothiocyanate-conjugated secondary antibody (dilution, 1:500; Vector Laboratories) after incubation for 1 h at room temperature. The sections were washed with PBS and mounted on microslide glass with Vectashield Mounting Medium (Vector Laboratories). The sections were examined with a confocal laser scanning microscope (Axiovert 100M) using the LSM 510 system (Zeiss, Tokyo, Japan). All images were obtained from individual optical sections. Data were minimally processed to generate superimposed images using Laser sharp processing and Photoshop software (Adobe System, San Jose, CA, USA).
Western Blots
Mice of each group were decapitated at 24 or 72 h after reperfusion (n = 4 for each group). Samples were taken from two regions: the ischemic region (comprised the cortex and striatum) and the control region, which comprised the same area on the contralateral side. The samples were lysed in CelLytic reagent (Sigma Chemical Co., St Louis, MO, USA) with protease inhibitor (Calbiochem, La Jolla, CA, USA). The protein concentration in the tissue lysate was determined using the BCA protein assay kit (Pierce, Rockford, IL, USA). Aliquots containing 40 μg of protein were subjected to 7.5% to 15% sodium dodecyl sulfate-polyacrylamide gel electrophoresis. After electrophoresis, the proteins were transferred onto polyvinylidene difluoride membranes (Bio-Rad). The membranes were blocked with Block-Ace (Yukijirushi) and sequentially incubated with the primary antibody. Rabbit polyclonal anti-Stat3 antibody, anti-pStat3 antibody (dilution, 1:5,000), anti-Bcl-2 antibody (dilution, 1:1,000), anti-iNOS antibody (dilution, 1:1,000), or anti-α-tubulin antibody (dilution, 1:2,000; Santa Cruz Biotechnology Inc., Santa Cruz, CA, USA) was used as the primary antibody. After incubation with the appropriate horseradish peroxidase-conjugated secondary antibody (dilution, 1:25,000; Amersham Life Science, Buckinghamshire, UK) for 1 h at room temperature, immunoreactive bands were visualized in the linear range with enhanced chemiluminescence ECL Western blotting system (Amersham). Quantitative evaluation of Western blot was performed using computerized digital image system (LAS-1000plus, Fujifilm).
Cell Count and Statistical Analysis
The numbers of Iba-1/EGFP-positive monocytes/macrophages and Iba-1-positive intrinsic microglia/macrophages were counted in three predefined areas (0.25 mm2, each) of Iba-1-stained coronal sections of EGFP chimera ischemic mice (n = 5, each group). Furthermore, the number of Bcl-2-positive cells was counted by the same method using a light microscope (EclipseTS100, Nikon, Tokyo, Japan) at a magnification of ×200 and assessed independently by two investigators.
Values presented in this study are expressed as mean ± s.e.m. After acquisition of all data, the randomization code was broken and data were assigned to each group. ANOVA and subsequent post hoc Fisher protected least significant differences test were used to determine the statistical significance of differences in physiologic variables, neurologic score, and volumes of infarction between the two groups. A P-value less than 0.05 denoted the presence of a statistically significant difference.
Results
Mortality Rate and Physiologic Parameters
No mouse died under our protocol of MCAO model, and all mice of this model showed infarct in the cortical and striatum area, which was identified by MAP-2 staining. Measurement of various physiologic parameters and CBF revealed no significant differences between the G-CSF group and the control group during the whole process of ischemia and reperfusion.
Granulocyte Colony-Stimulating factor Protects the Brain Against Transient Focal Cerebral Ischemia
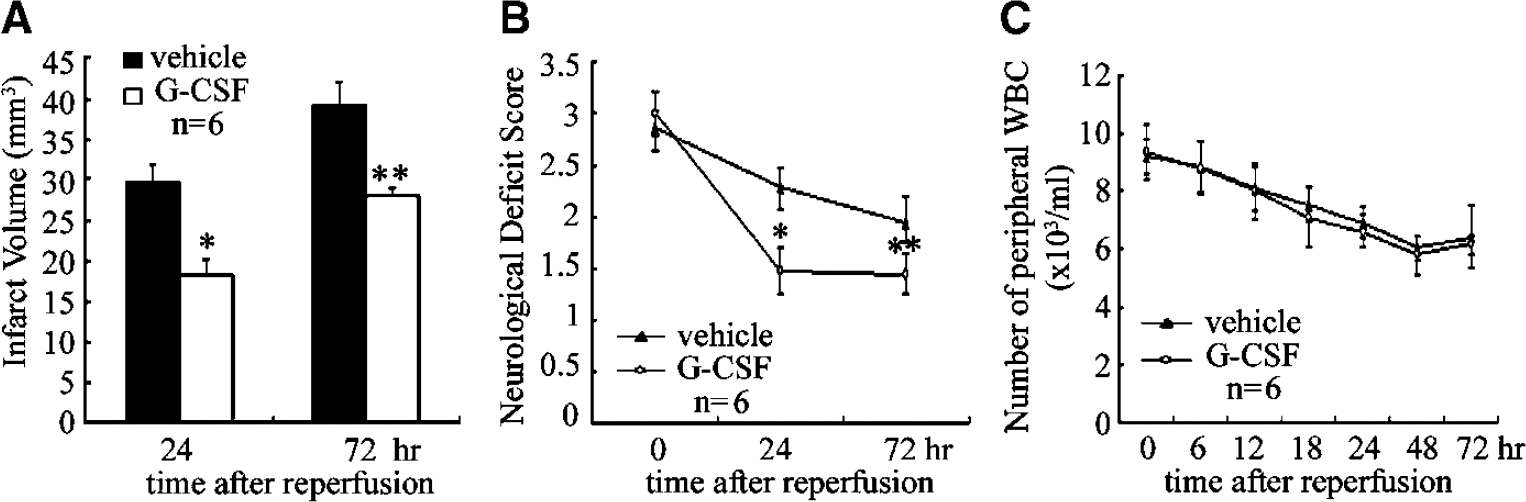
At 24 h after reperfusion, the infarct size in the G-CSF group (18.84 ± 3.72 mm3) was significantly smaller (P < 0.006) than in the control group (28.59 ± 3.26 mm3) (Figure 1A). At 72 h after reperfusion, the infarct size in the G-CSF group was 28.66 ± 2.13 and 38.28 ± 7.98 mm3 in the control group (P < 0.04). The neurologic deficit scores are shown in Figure IB. In all mice, the deficit after MCAO was at least grade II, indicating successful placement of the intraluminal suture. Granulocyte colony-stimulating factor significantly improved the neurologic deficit at 24 and 72 h after MCA occlusion, with 35% (P < 0.001) and 24% (P < 0.01) improvement, compared with the control mice (Figure 1B).
Effect of G-CSF treatment on stroke outcome. (
There was no statistical difference between the G-CSF and control groups with regard to body temperature, heart rate, and body weight. Peripheral blood leukocyte count was not different in the two groups at 24 and 72 h after reperfusion (Figure 1C), although the plasma concentration of G-CSF was higher in the G-CSF group (data not shown). In contrast to the results of previous study (Schabitz et al, 2003), G-CSF treatment did not cause neutrophilia.
Effect of granulocyte colony-stimulating factor on the Temporal Profile of Bone Marrow-Derived Monocytes/Macrophages and Intrinsic Microglia/Macrophages After Transient Focal Cerebral Ischemia
The distribution of infarct area was analyzed using MAP-2 immunoreactivity in immunohistochemically stained sections. For detailed analysis of the distribution of immunoreactive cells, we divided each ischemic lesion into three areas, the ischemic core, transition area, and periinfarct area, as shown schematically in Figure 2A (Co, Tr, and Pe areas, respectively). At 24 h, 72 h and 7 days after reperfusion, Iba-1-positive activated microglia/macrophages in the Tr area were significantly higher in number and more activated in the G-CSF group (Figure 2Bd–f) than in the control group (Figure 2Ba–c). To determine the origin of microglia/macrophages, that is, intrinsic microglia/macrophages or extrinsic monocytes/macrophages, immunohistochemical staining for Iba-1 was performed (Figure 2Ca–f). Intrinsic microglia/macrophages appeared red while extrinsic monocytes/macrophages appeared yellow with colocalization of Iba-1 and EGFP expression. The remaining green fluorescent cells were identified as leukocytes by colocalization of Gr-1 and EGFP (data not shown). In the Pe area, the number of intrinsic microglia/macrophages tended to be higher in the G-CSF group than in the control group, although insignificantly, at 24 h, 72 h, and 7 days after perfusion (Figure 2Da). In the Tr area, the number of resident microglia/macrophages was significantly higher in the G-CSF group than in the control group while the number of Iba-1/EGFP-positive extrinsic monocytes/macrophages was slightly reduced in the G-CSF group (Figure 2Db). Conversely, in the Co area, the number was not different between the two groups at 24 h after reperfusion, but at 72 h and 7 days after reperfusion, the number of extrinsic monocytes/macrophages was lower while the number of intrinsic microglia/macrophage was higher in the G-CSF group, compared with the control (Figure 2Dc).
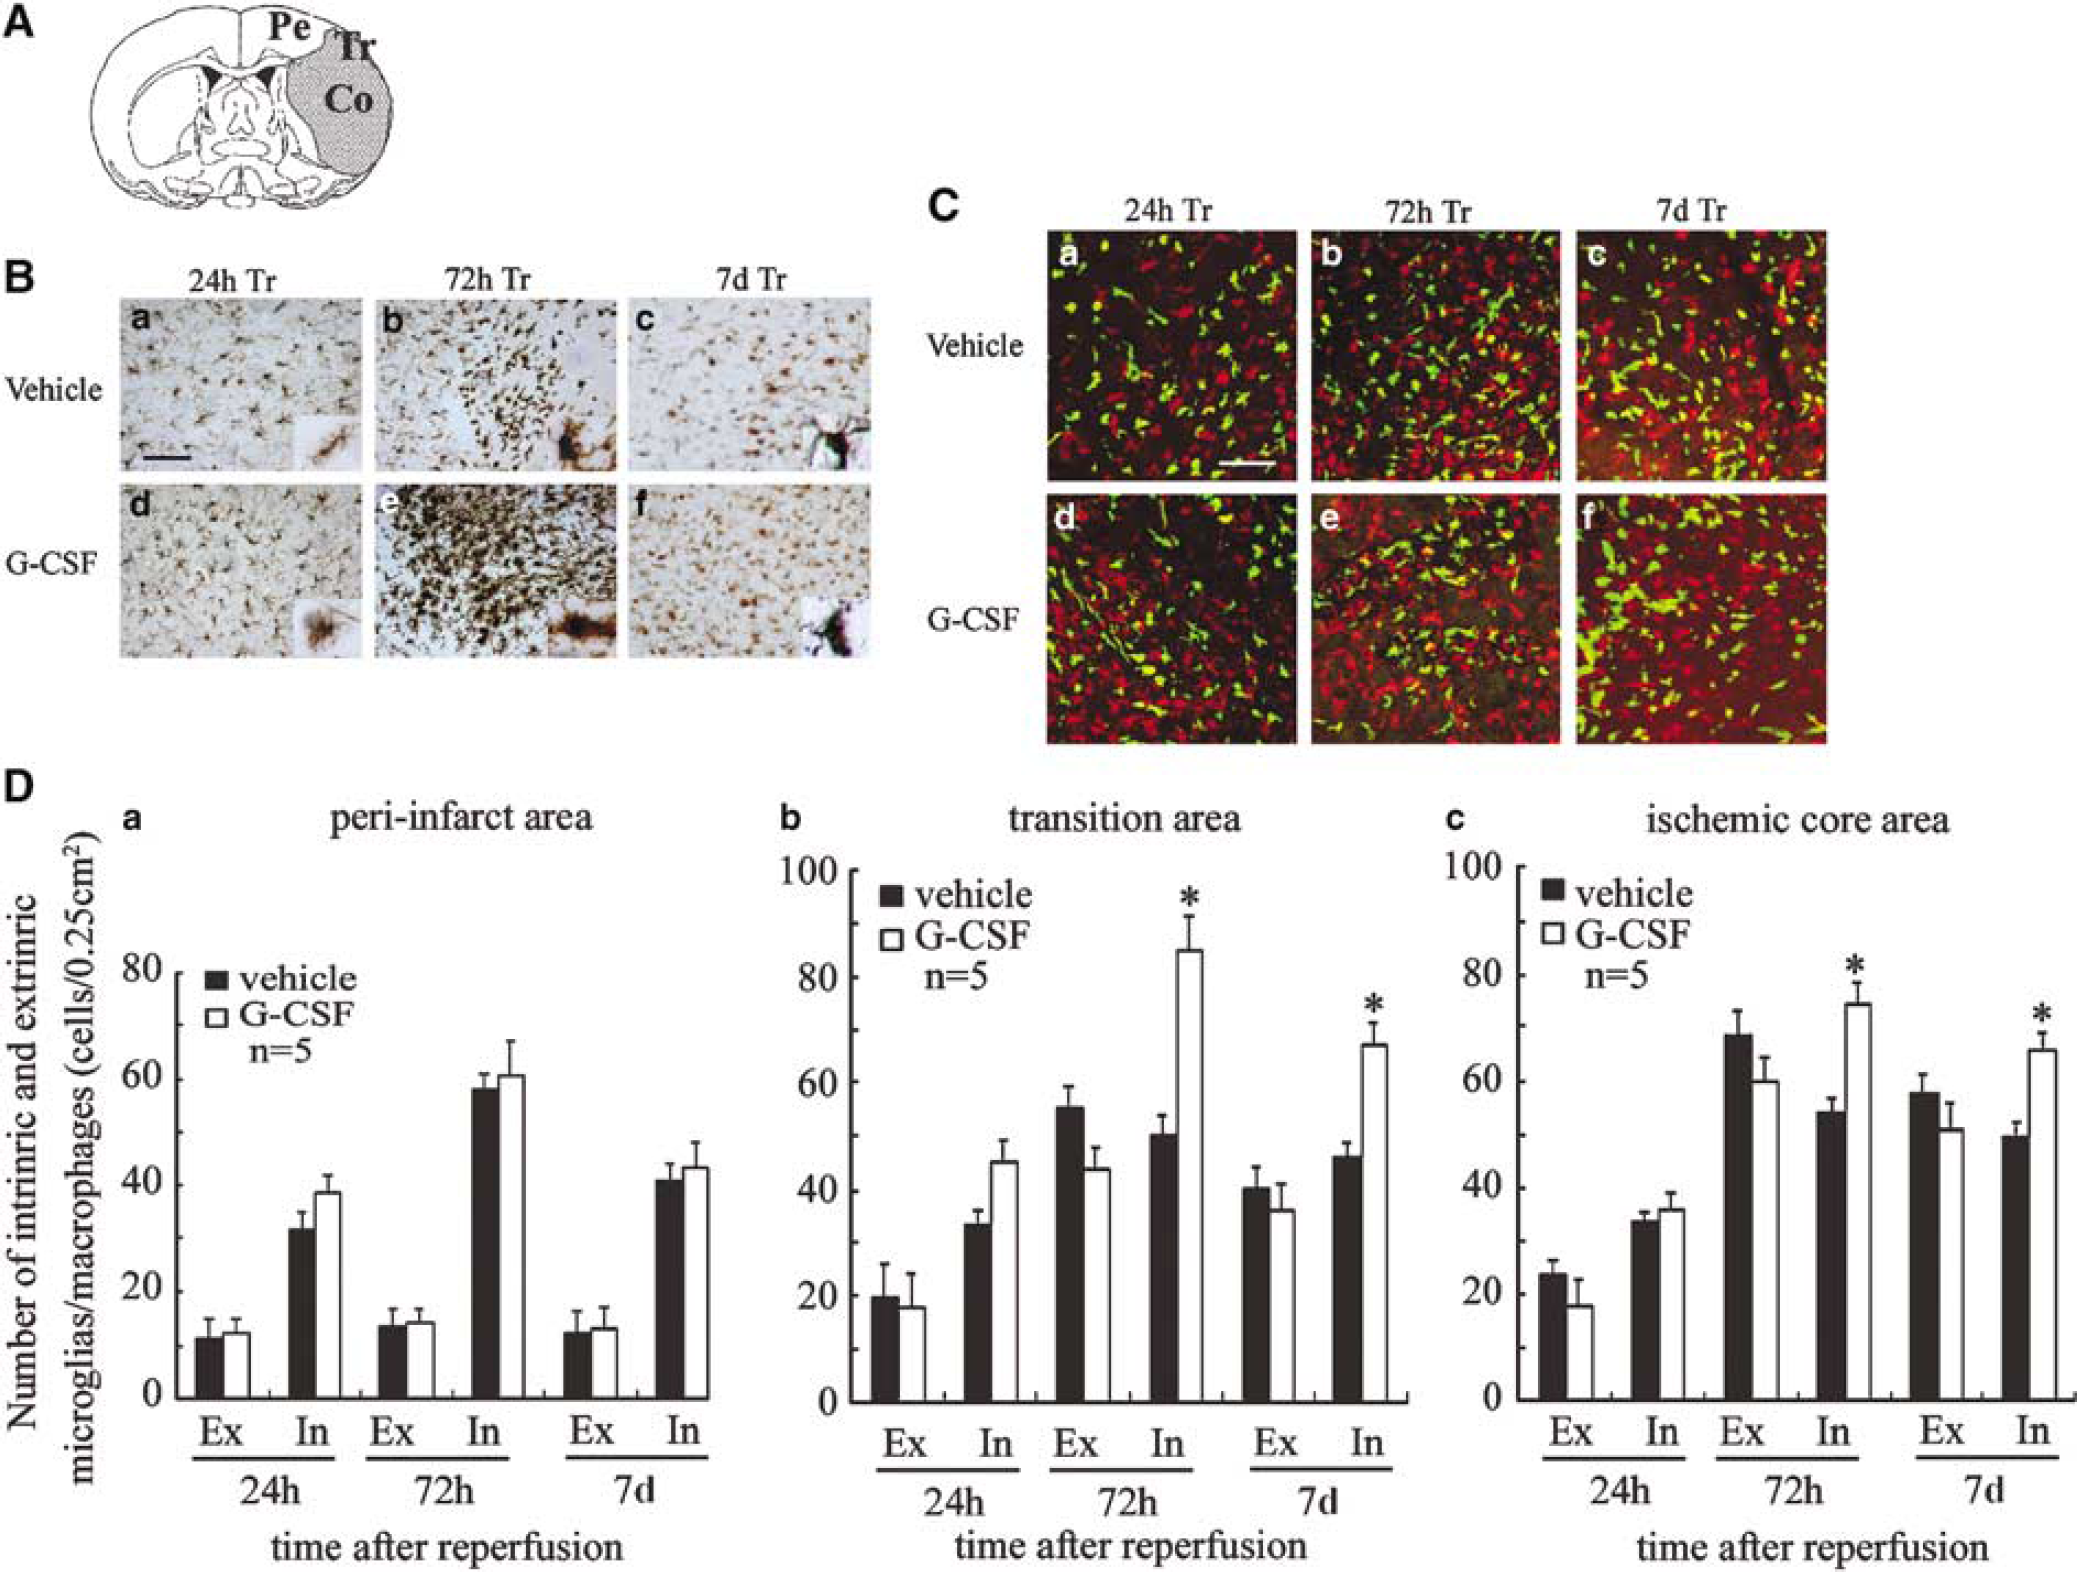
Temporal profile of bone marrow-derived lba-1/EGFP-positive monocytes/macrophages and intrinsic microglia/macrophages after brain ischemia/reperfusion. (
Effect of Granulocyte Colony-Stimulating Factor on Time-Dependent Expression of Stat3 After Transient Focal Cerebral Ischemia
Stat3 immunoreactivity was mainly localized in the cytoplasm of neurons in the sham-operated mice (Figure 3Aa). At 24 h after reperfusion, Stat3 immunoreactivity was detected in both the cytoplasm and nuclei of many neurons in the Tr area (Figure 3Ab and d) and more prominently in the G-CSF group (Figure 3Ad) than in the control group (Figure 3Ab). At 72 h after reperfusion, the immunoreactivity was more prominent in the G-CSF group (Figure 3Ae) than in the control group (Figure 3Ac). To identify the Stat3-expressing cells, double immunofluorescence labeling was performed, and cell type markers to identify neurons (NeuN), microglia (Iba-1), and astrocytes (GFAP) were used. Iba-1 and GFAP did not colocalize with Stat3, but NeuN-positive cells were Stat3 positive in the Tr area at 24 and 72 h after reperfusion (Figure 3B). As shown in Figure 3C, Western blot analysis using Stat3 antibody showed a specific single band with a molecular mass of 92 kDa. A sample taken from the stroke lesion showed a more intense band than the contralateral cortex in the same animal. The band intensity increased in a time-dependent manner in both the G-CSF and control groups. However, the rate of increase of intensity of the band in the G-CSF group somewhat exceeded that of the control group. In the G-CSF group, the band was stronger in the stroke side in a time-dependent manner compared with the control group (P < 0.001; Figure 3D).
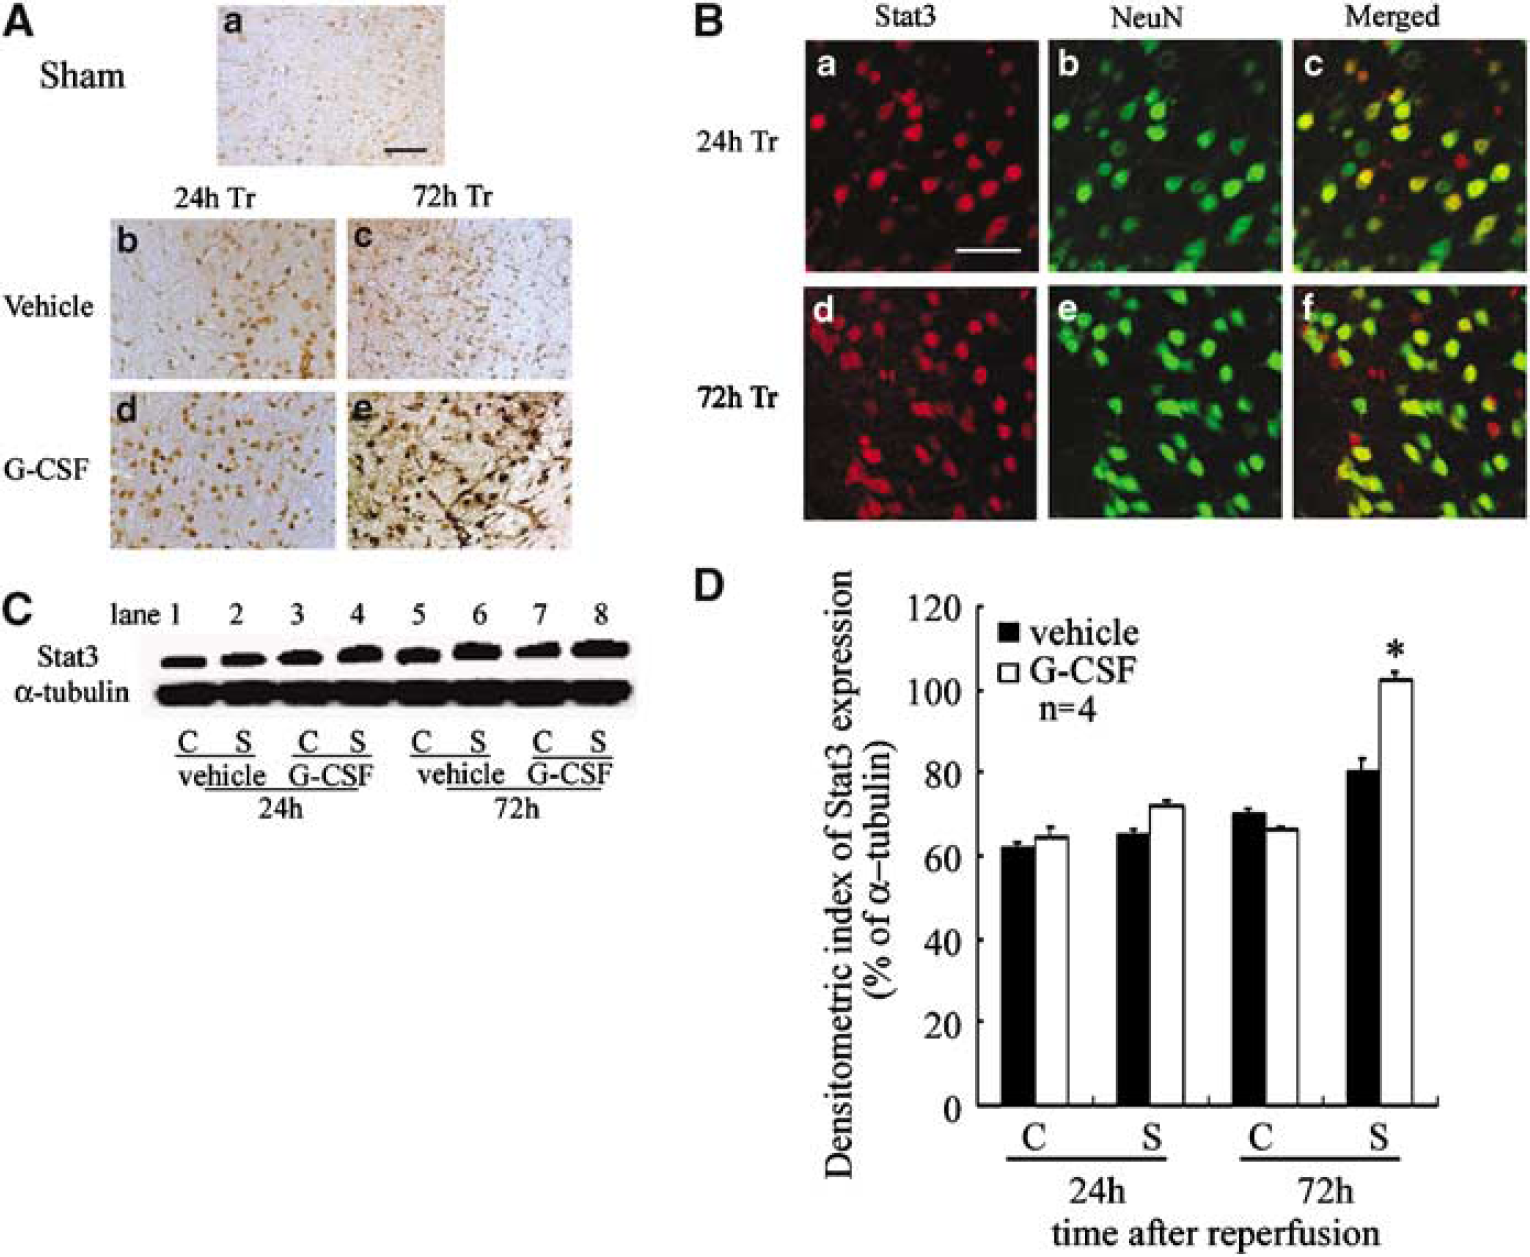
Treatment with G-CSF increased the level of Stat3 after focal cerebral ischemia. (
Effect of Granulocyte Colony-Stimulating Factor on the Temporal Profile of pStat3 Production After Transient Focal Cerebral Ischemia
At 24 h after reperfusion, pStat3 immunoreactivity in neurons was more prominent in the Tr area of the G-CSF group (Figure 4Ac) than the control group (Figure 4Aa), and it was still observed at 72 h after reperfusion (Figure 4Ad). To identify the pStat3-expressing cells, double immunofluorescence labeling was performed, and cell type markers to identify neurons (NeuN), microglia (Iba-1), and astrocytes (GFAP) were used. Iba-1 and GFAP did not colocalize with pStat3, but pStat3-positive cells were NeuN positive in the Tr area at 24 and 72 h after reperfusion (Figure 4B). Western blot analysis using pStat3 antibody showed a specific single band in the stroke side with a molecular mass of 92 kDa (Figure 4C). The band intensity increased in a time-dependent manner in both the G-CSF and control groups (Figure 4C). In the G-CSF group, the intensity of the band increased in the stroke side (P < 0.001) in a time-dependent manner compared with the control group (Figure 4D).
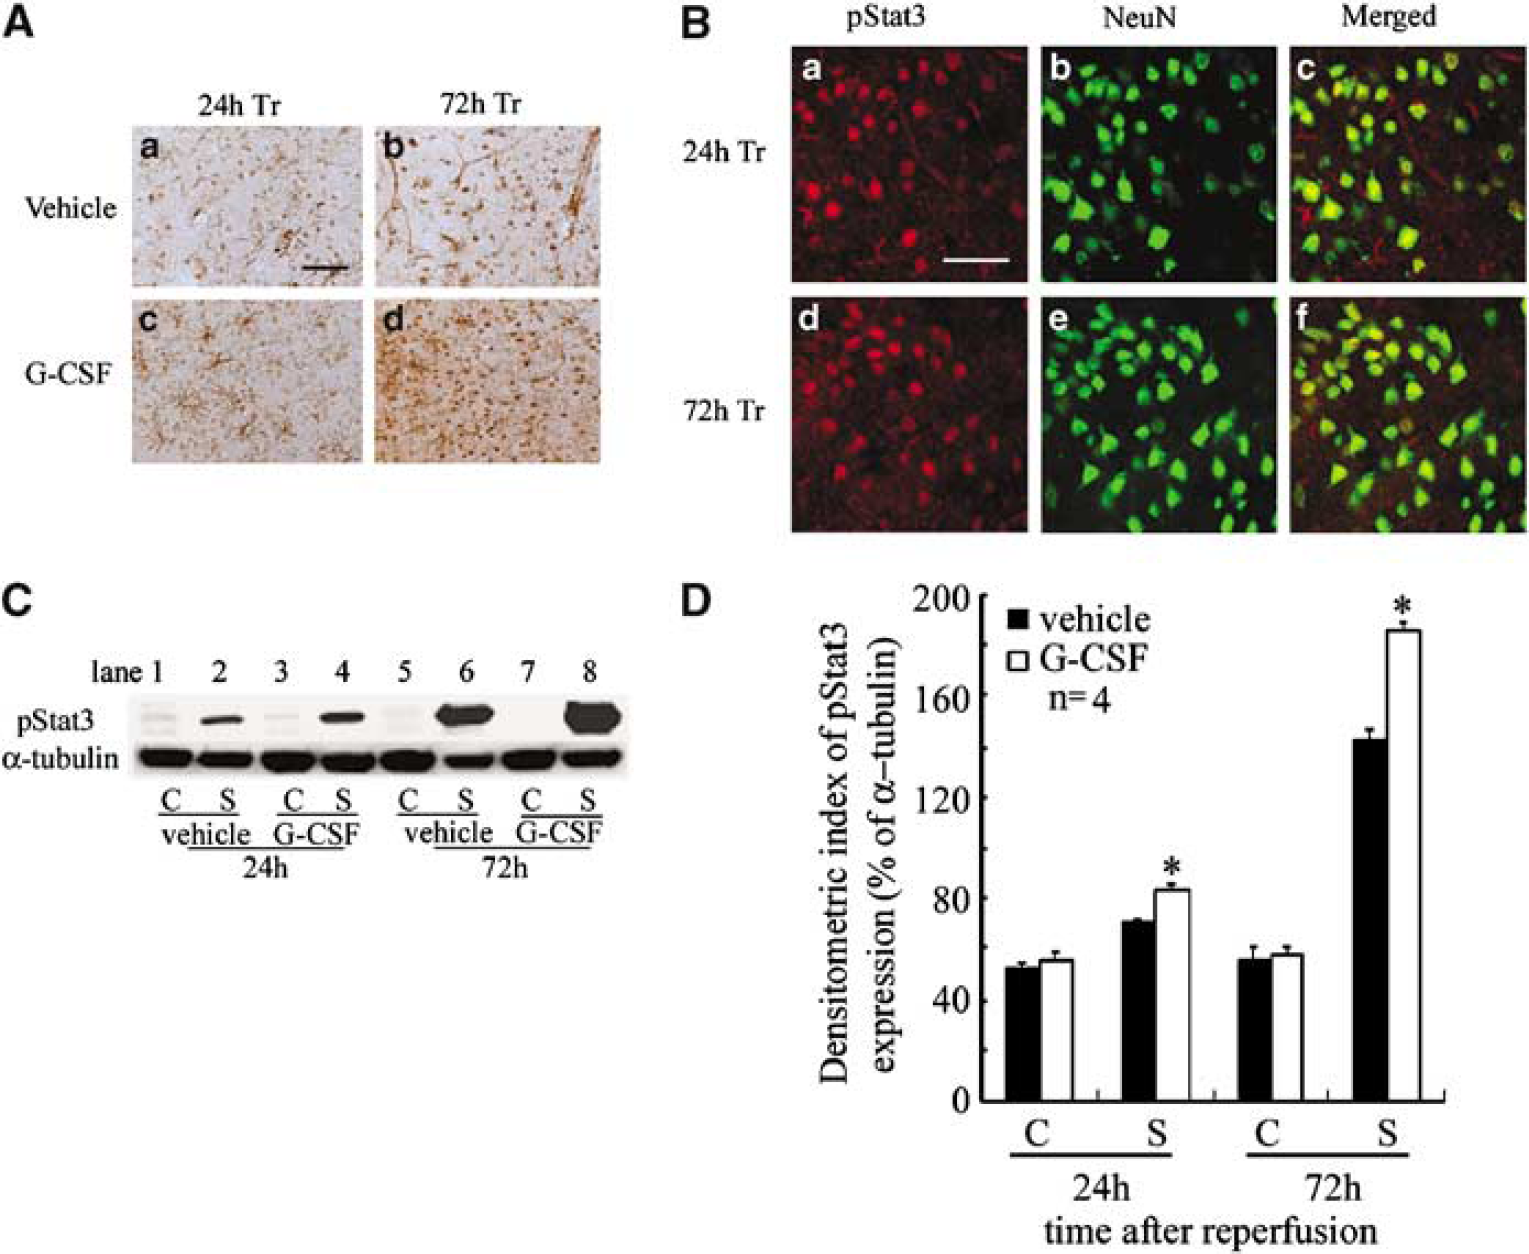
Treatment with G-CSF increased the number of pStat3-positive cells after transient cerebral ischemia. (A) Photomicrographs showing pStat3 staining at the Tr area of representative control and G-CSF groups. Control (a, b) and G-CSF-treated (c, d) mice at 24 h (a, c) and 72 h (b, d) after reperfusion. Scale bar = 20 μm. (
Effect of Granulocyte Colony-Stimulating Factor on the Temporal Profile of Bcl-2 Production After Transient Focal Cerebral Ischemia
In the control group, Bcl-2 immunoreactivity was detected in the vessel walls in the Co area, and in a few microglia and neurons in the Tr area at 24 h after reperfusion (Figure 5Aa). In contrast, some Bcl-2-expressing neurons were detected in the G-CSF group (Figure 5Ac). At 72 h after reperfusion, Bcl-2-positive neurons increased in the control group (Figure 5Ab) but the increase was higher in the G-CSF group (Figure 5Ad) in the Tr area. To identify the Bcl-2-expressing cells, double immunofluorescence labeling was performed, and cell type markers to identify neurons (MAP-2), microglia (Iba-1), and astrocytes (GFAP) were used. GFAP did not colocalize with Bcl-2, but MAP-2- and Iba-1-positive cells were Bcl-2 positive in the Tr area (Figure 5Ae-j). In the G-CSF group, Bcl-2 immunoreactivity in the Tr area was stronger compared with the control group (P < 0.001) (Figure 5B). Immunoblots of Bcl-2 were clearly detected in the stroke lesion as a protein band of 26 kDa (Figure 5C). In the G-CSF group, the intensity of the band increased in the stroke side (P < 0.001) in a time-dependent manner compared with the control group (Figure 5D).
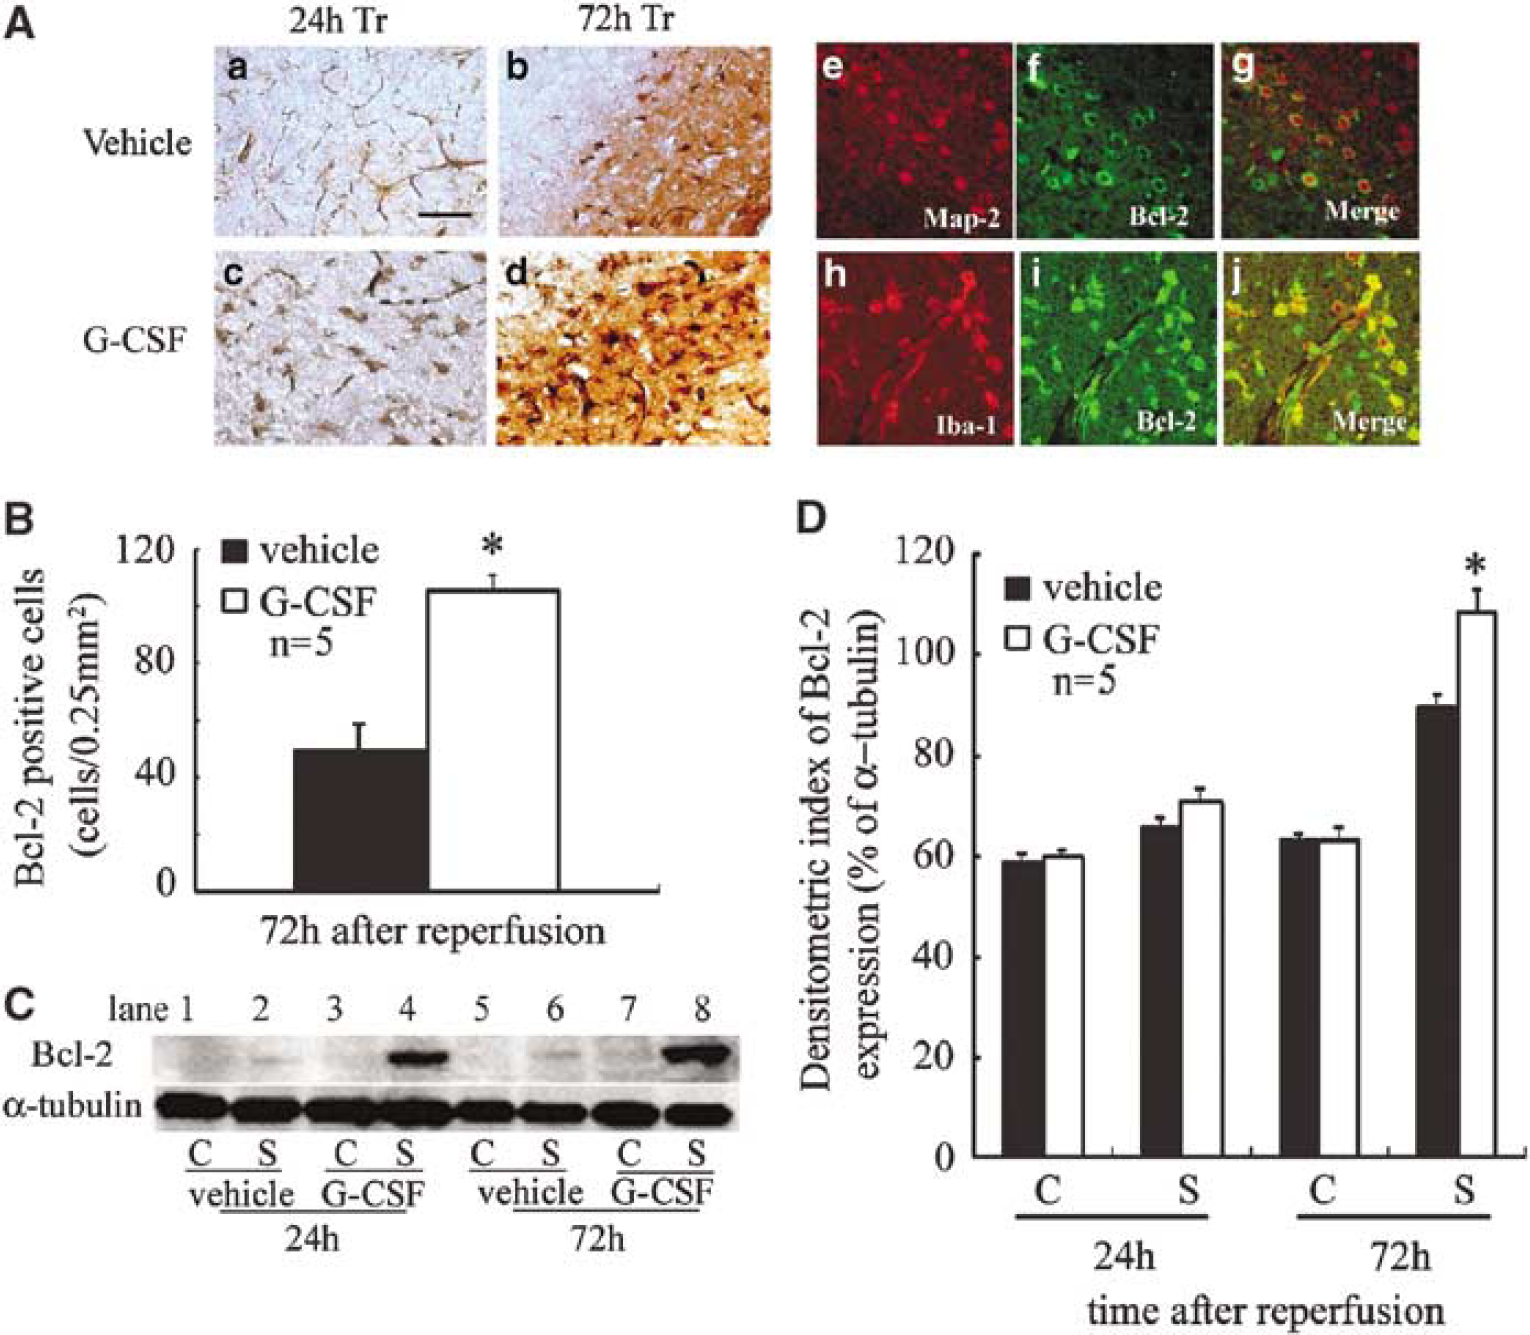
Treatment with G-CSF increased antiapoptotic Bcl-2 protein after brain ischemia/reperfusion. (
As assessment of the association between Bcl-2 and Stat3, pStat3, colocalization of Bcl-2 and Stat3, pStart3 was detected in neurons of the Tr area at 72 h after reperfusion (Figures 6A and 6B).
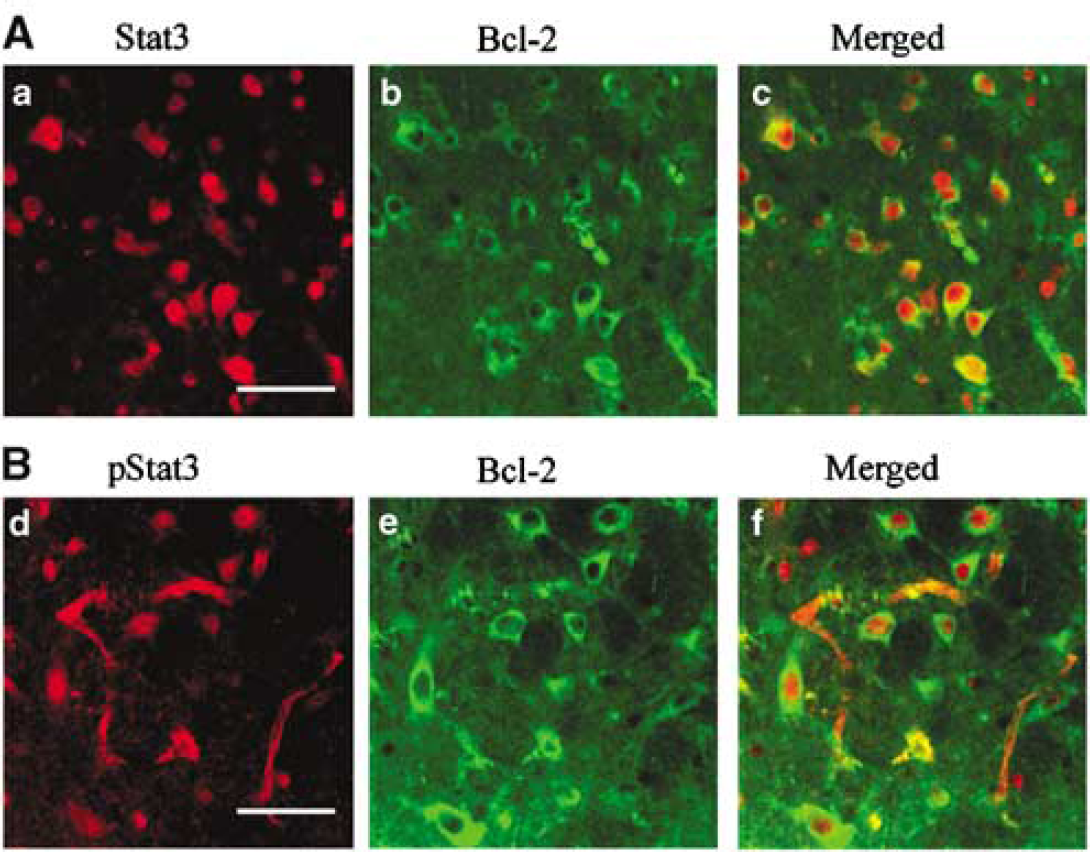
Assessment of the association between Bcl-2 and Stat3, pStat3. (
Effect of Granulocyte Colony-Stimulating Factor on Inducible Nitrate Oxide Synthase Expression and Nitrotyrosine Production After Cerebral Ischemic Injury
In each group, iNOS expression was detected in endothelial cells in the Co area at 24 and 72 h after reperfusion (data not shown). However, iNOS immunoreactivity was strongly detected in some microglia in the Tr area in the control group (Figure 7Aa and b), but only a few iNOS-positive microglia were detected in the G-CSF group (Figure 7Ac and d). Immunoblots of iNOS were detected as a 130-kDa protein band. In the control group, the intensity of iNOS band in the stroke side was stronger (P < 0.03, < 0.001) than the corresponding site of the G-CSF group (Figures 7B and 7C). Nitrotyrosine immunopositivity was prominent in the cytoplasm but not in the nuclei of neurons in the control group at 24 and 72 h after reperfusion (Figure 7Da and b). However, only partial or weak staining was noted in the G-CSF group (Figure 7Dd and e). At 72 h after reperfusion, accumulation of nitrotyrosine was also evident in astrocytes in the control group (Figure 7Dc and f). Double immunofluorescence labeling was performed to identify the nitrotyrosine-expressing cells—nitrotyrosine-positive cells were NeuN positive in the Tr area at 24 and 72 h after reperfusion (Figure 7Dj and k). Besides, colocalization between nitrotyrosine and astrocyte marker (GFAP) was detected at 72 h after reperfusion (Figure 7D1).
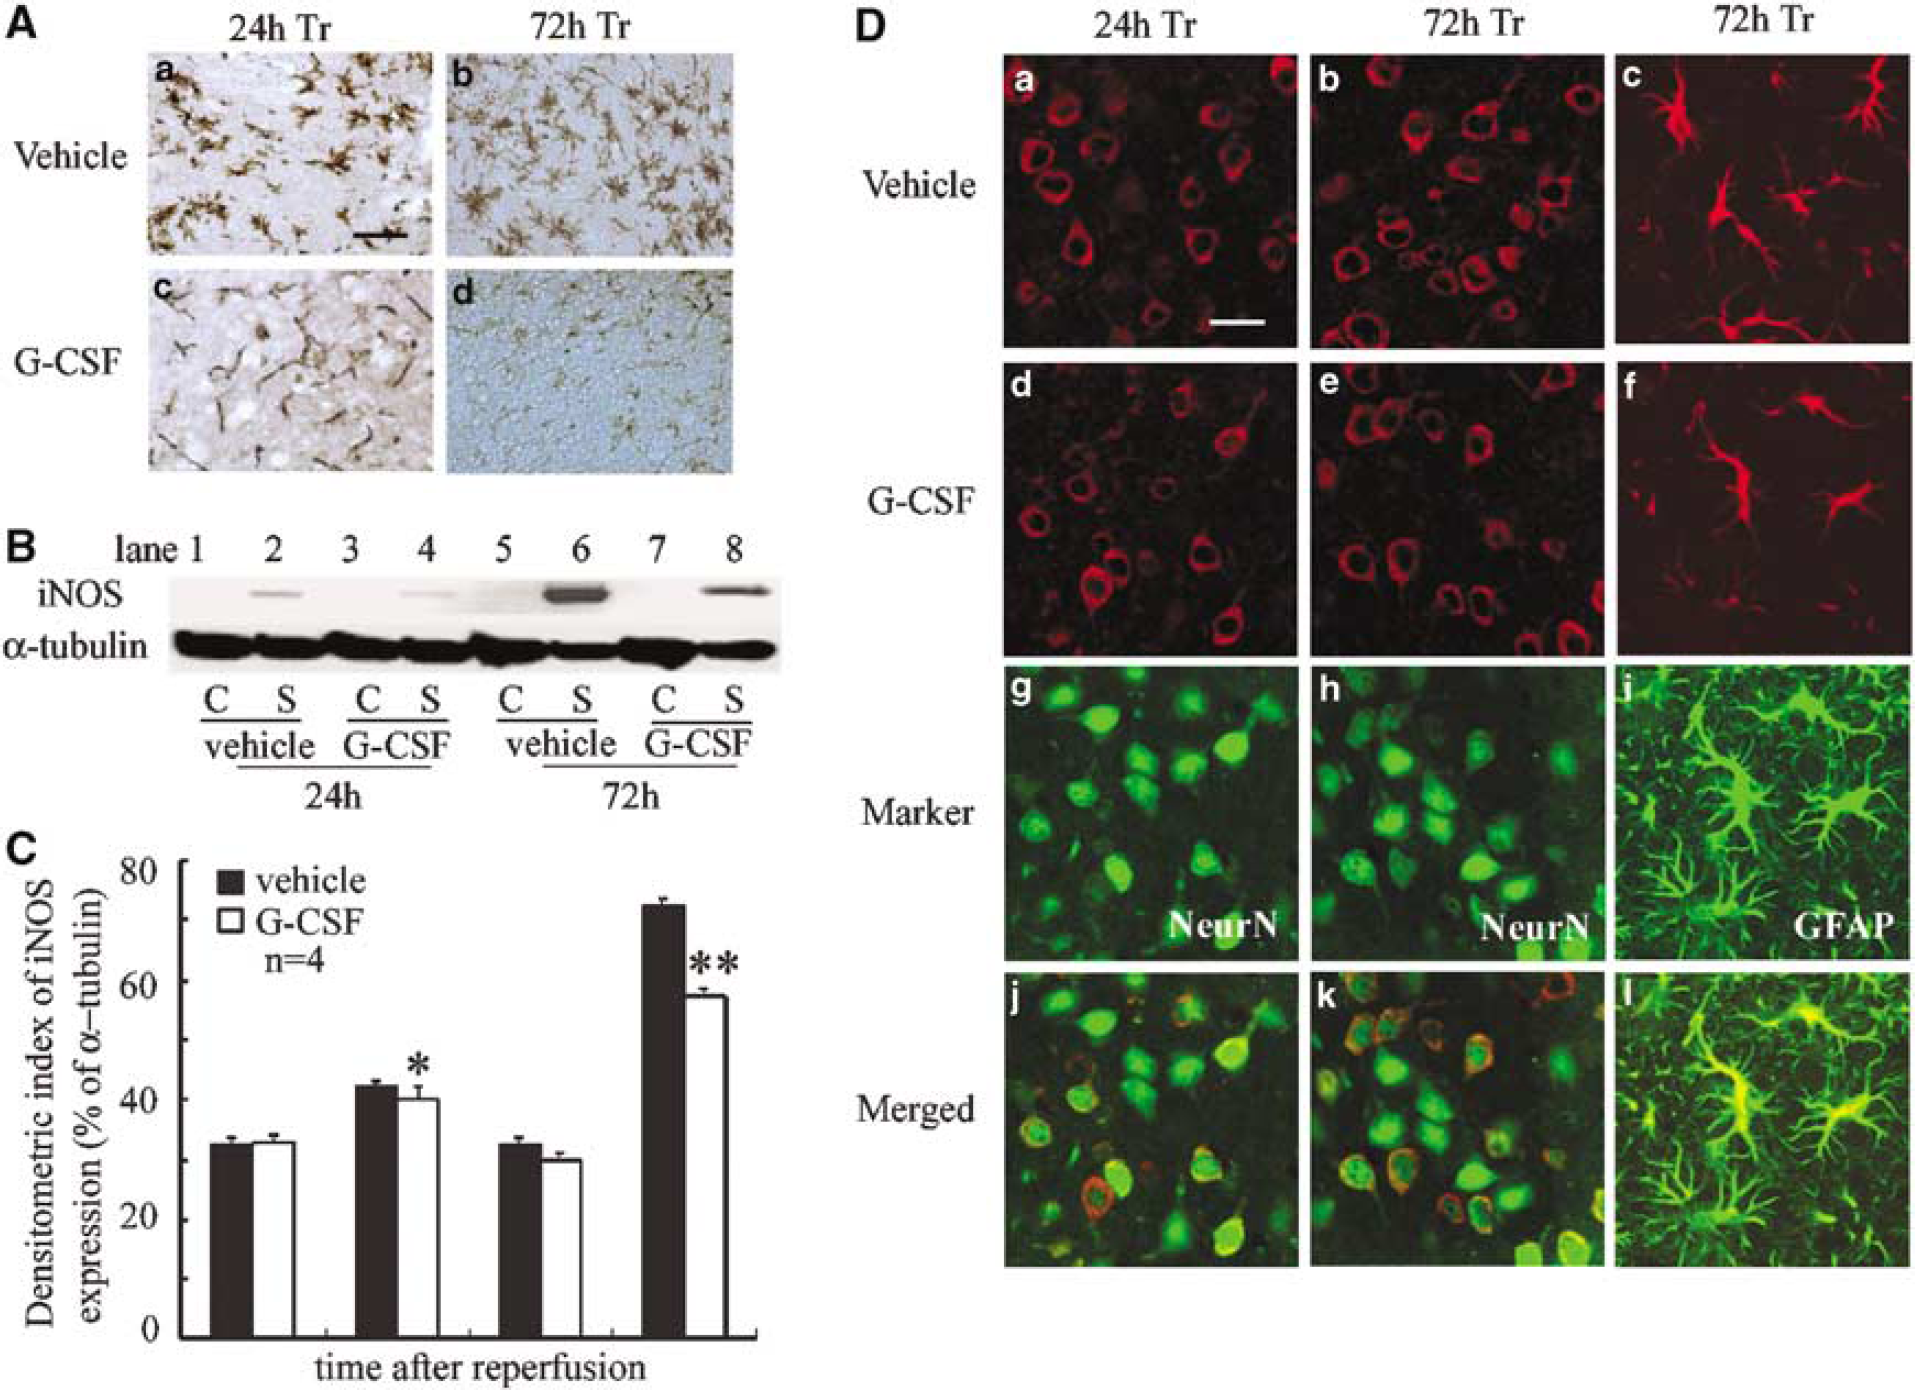
Treatment with G-CSF reduced iNOS induction and nitrotyrosine production after cerebral ischemia. (
Discussion
In the present study, we analyzed the mechanisms of action of G-CSF treatment in brain ischemia/reperfusion injury. The major finding of the present study was that G-CSF treatment protected mice against progression and expansion of the infarct volume at 24 and 72 h after transient focal cerebral ischemia. In EGFP chimera mice, G-CSF treatment tended to decrease the migration of EGFP-positive bone marrow-derived extrinsic monocytes/macrophages into both the Co area and the Tr area. In addition, in agreement with the kinetics of G-CSF hematopoietic effect, the recombinant hormone did not cause any increase in leukocyte count during the course of the study. Moreover, we also showed that G-CSF-induced improvement with reduction of stroke volume did not depend on an overflow of neutrophils from the bone marrow or on stimulation of neutrophil proliferation and differentiation in the stroke lesion. This result suggests that the neuroprotective role of G-CSF does not involve bone marrow-derived cells. Nevertheless, G-CSF treatment significantly increased the number of intrinsic Iba-1-positive microglia. While several studies examined the relationship between astrocytes and G-CSF (Meeuwsen et al, 2003), to our knowledge, our study is the first that reports G-CSF-induced microglial activation. Microglia/macrophages are considered the major source of inflammatory cytokines in the ischemic brain (Gregersen et al, 2000; Lambertsen et al, 2002). Previous studies showed that the pleiotropic and antiinflammatory cytokine transforming growth factor β1 was induced in activated microglia/macrophages after ischemia (Lehrmann et al, 1998), and that proliferating microglia/macrophages may contribute to the ischemic tolerance and act as a neuroprotective element (Liu et al, 2001). Taking into consideration our results of the distribution and number of intrinsic and extrinsic microglia/macrophages, it is possible that the increased number of intrinsic microglia was caused by G-CSF treatment, which subsequently provided some neuroprotective effect.
The present study showed that pStat3 and Bcl-2 were highly expressed in the G-CSF-treated group after reperfusion. Our results clearly indicate that the neuroprotective role of G-CSF was manifested through the antiapoptotic effect through the JAK/STAT signaling pathway and subsequent activation of Bcl-2. Recently, several reports showed that cerebral ischemic stress activates the JAK/STAT pathway with pathologic contribution from neurons and glia (Planas et al, 1996; Justicia et al, 2000; Wen et al, 2001). In the transient cerebral ischemia rat model, Suzuki et al (2001) elucidated the chronological, topographical, and cellular alterations in pStat3 protein. Previous studies showed that activation of pStat3 results in the formation of Stat3 dimers, which consequently translocate to the nucleus (Shuai, 2000) and regulate the transcription of target protein, such as Bcl-2, which is known to protect against both apoptotic (Israels and Israels, 1999) and necrotic death (Kane et al, 1993).
Several studies indicated that overexpression of Bcl-2 protected against postischemic cerebral neuronal death (Linnik et al, 1995; Ferrer and Planas, 2003; Zhao et al, 2003). This pathway is dependent on the main intracellular signal of G-CSF (Tian et al, 1994; Fukada et al, 1996; Avalos et al, 1997). Recently, Schabitz et al (2003) showed that G-CSF receptor exists not only on hematopoietic cells but also on neurons and glial cells, and that the neuroprotective effect of G-CSF treatment was dependent on G-CSF receptor-mediated activation of the JAK/STAT pathway, especially increased Stat3 expression in the ischemic penumbra. The report did not investigate the expression of Bcl-2, which is induced downstream of the activated JAK/ STAT pathway. To our knowledge, the present study provides the first evidence for the neuroprotective role of the antiapoptotic cascade through JAK/STAT pathway and subsequent activation of Bcl-2 induced by G-CSF in cerebral ischemia/reperfusion injury.
Another interrelated mechanism that might account for the neuroprotective effect of G-CSF is the antiinflammatory effect mediated by inhibition of iNOS activity. This conclusion is consistent with recent evidence that inhibition of iNOS gene provides protection against cerebral ischemia. Previous studies showed that G-CSF protects against death in a nonseptic model of ischemia/reperfusion injury and concluded that such beneficial effect is the consequence of either reduction of TNF-α or inhibition of iNOS activity (Gorgen et al, 1992; Kitabayashi et al, 1995; Squadrito et al, 1997). Moreover, other investigators showed that G-CSF decreased the level of IL-1β, IL-6, and IL-8 under several conditions (Hebert et al, 1997; Heard et al, 1998; Heard and Fink, 1999). Our results of Western blot analysis and immunohistochemistry of iNOS clearly indicated that G-CSF significantly reduced iNOS levels and decreased the activation of iNOS-positive microglia. Peroxynitrite is formed through the rapid reaction of NO with superoxide. The appearance of ONOO−-mediated nitrotyrosine paralleled NO synthesis, as shown by induction of iNOS, which produces high, potentially toxic, levels of NO. Based on our results that G-CSF reduced nitrotyrosine production, the possible scenario behind the G-CSF-induced reduction of infarction volume after brain ischemia/reperfusion includes suppression of induction of iNOS in microglia and inhibition of peroxynitrite production. These findings suggest that one neuroprotective mechanism for G-CSF may involve inhibition of peroxynitrite production through reduction of iNOS activity. Taken together, the neuroprotective effect of G-CSF may include part of its antiinflammatory mechanisms.
In conclusion, we have shown that G-CSF protects against the lethal effects of cerebral infarction in a focal transient cerebral ischemia model. In the current study, we show that G-CSF has antiapoptotic properties (which result in the activation of Bcl-2 through the JAK/STAT signaling pathway) and antiinflammatory effects (which result in the reduction of iNOS production) and that both effects are important for the neuroprotective effect of G-CSF in stroke. Our results are considered important for extension of the therapeutic time window in acute cerebral ischemia.