
Abstract
Indirect evidence from laboratory studies suggests that mitochondrial energy metabolism is impaired in progressive supranuclear palsy (PSP), but brain energy metabolism has not yet been studied directly
Keywords
Introduction
Progressive supranuclear palsy (PSP) is a sporadic neurodegenerative disorder characterized by an akinetic-rigid syndrome with prominent postural instability, oculomotor deficits and neuropsychological deficits in frontal lobe-related functions (Litvan et al, 1996). Neuropathologically, PSP is characterized by neuronal loss and somatodendritic aggregation of the microtubule-associated protein tau, predominantly in the basal ganglia, brain stem nuclei and the frontal lobes; the occipital lobes and the cerebellum are relatively spared (Hauw et al, 1994). The median survival time is 5 to 10 years (Golbe and Ohman-Strickland, 2007). To date, there are no effective symptomatic or neuroprotective treatments available (van Balken and Litvan, 2006). Therefore, a detailed understanding of the pathogenesis underlying PSP is urgently needed to allow the development of novel rational therapies.
Although the etiology of PSP is unknown, several lines of evidence point to an impairment of mitochondrial energy production: (1) Cerebral glucose metabolism is reduced, as shown by [18F]-2-fluoro-2-deoxy-
Experimental findings also suggest that mitochondrial failure might play a crucial role in the pathophysiology of PSP. A PSP-like tauopathy endemic in the island of Guadeloupe has been linked to the consumption of fruit and infusions of the leaves of
The main function of the mitochondrial respiratory chain is to maintain adequate concentrations of high-energy phosphates (HEP), particularly ATP, in cells. It is important to note, however, that brain mitochondria can tolerate a 60% decrease in complex I activity, without a significant decrease in ATP production (Davey et al, 1997). In the experimental models using annonacin and rotenone, a significant decrease in ATP levels was required to induce tau pathology; mild complex I inhibition without ATP depletion had no effect (Höglinger et al, 2005; Escobar-Khondiker et al, 2007). To date, however, there has been no direct demonstration
High-energy metabolites (ATP and phosphorylated creatine (pCre)) and inorganic phosphate (Pi) can be quantified
Materials and methods
This study was approved by the Ethics Committee of Marburg University and is registered online (http://clinicaltrials.gov/, identifier NCT00328874).
Participants
Patients examined in the Department of Neurology of the University of Marburg were qualified for participation in the study if they had clinically probable PSP (Litvan et al, 1996). This criterion was chosen to obtain the highest degree of diagnostic certainty possible
The healthy volunteers were free of neurologic, systemic or psychiatric diseases, including alcohol or substance abuse, as verified by a detailed evaluation of their medical histories and by a comprehensive physical examination. Furthermore, participants were included only if they were willing and able to give written informed consent to participate in the study.
We excluded a variety of conditions that might influence the levels of cerebral energy metabolites. Exclusion criteria for all participants were age > 50 or > 85 years; Parkinson's syndromes other than PSP; dementia (Mini-Mental State Examination (MMSE) score ⩽24); a history of epilepsy, structural brain disease, brain surgery, electroconvulsive therapy, stroke and arterial hypertension (systolic > 180 or diastolic > 110mmHg); systemic disorders affecting the metabolism or function of the brain (e.g., diabetes mellitus); other serious illnesses; participation in drug studies or the use of drugs that modify mitochondrial activity (e.g., coenzyme Q10, statins) or antioxidants (e.g., vitamin E, C) within the last 60 days; the use of drugs interfering with catecholamine metabolism (e.g., reserpine, amphetamines, MAO-A inhibitors, methylphenidate and cinnarizine) within the last 30 days; an unstable dosage of CNS-active drugs (e.g., antiparkinsonian drugs, anxiolytics, hypnotics, tranquillizers and antidepressants) within the last 30 days.
Clinical Evaluation
Motor functions were assessed with the Unified Parkinson's Disease Rating Scale (UPDRS), part III, the PSP staging system (Golbe, 1997) and the PSP rating scale (PSP-RS) (Golbe and Ohman-Strickland, 2007). Activities of daily living were scored with the UPDRS, part II. Global cognitive function was evaluated with the MMSE. Neuropsychiatric symptoms were evaluated with the Frontal Assessment Battery (FAB) (Dubois et al, 2000) and the Montgomery-Åsberg Depression rating scale (MADRS).
1H-MRS
A 3-T system (Magnetom Trio; Siemens, Erlangen, Germany) with a double-tuned 1H/31P volume head coil (Rapid Biomedical, Würzburg, Germany) was used for 1H-MRS, with a two-dimensional chemical shift imaging double echo (CSI) sequence with PRESS volume selection. A 1.5-cm axial slice, including the basal ganglia, was recorded. Data were acquired with circular-phase encoding using a 16 × 16 matrix, which was extrapolated before Fourier transformation to 32 × 32 matrix. The field of view was 240mm2, the repetition time 1,500 msecs and the echo time 30 msecs. For quantitative analysis, spectra were fitted in the frequency domain by a linear combination of a set of model spectra using the LCModel software (Provencher, 1993). Cramer–Rao lower bounds for NAA, choline (Cho) and creatine (Cre) were typically between 5% and 10%. Data with the Cramer–Rao lower bounds of more than 20% were discarded. Corrections for 1H-T1 and 1H-T2 relaxation were applied (Hattingen et al, 2007).
Phosphorus Magnetic Resonance Spectroscopy
Phosphorus magnetic resonance spectroscopy data were acquired using a three-dimensional CSI phase-encoding scheme applying a pulse-free induction decay sequence with WALTZ4 proton decoupling. A 300 × 300 × 200mm3 three-dimensional CSI slab was recorded with angulation and offset identical to the 1H-slice. Circular-phase encoding was employed with a weighted acquisition scheme on a 10 × 10 × 8 matrix extrapolated to 16 × 16 × 8, resulting in a series of axial slices with nominal 25mm thickness and 18.75 × 18.75mm2 in plane resolution (flip angle 60°, repetition time 2000 msecs and echo time 2.3 msecs). Before spatial Fourier transformation, the data set was multiplied with a linear increasing phase in the foot to head direction. Phase increments were adjusted to cause a shift of 12.5mm toward the feet, resulting in a perfect alignment of slice 5 from the 31P data with the 1H-slice. Spectra were analyzed in the time domain with jMRUI software employing the non-linear least square-fitting algorithm AMARES (Vanhamme et al, 1997). The time domain model function was composed of 14 exponentially decaying sinusoids in the frequency domain. Six of those, which had identical damping, corresponded to peaks assigned to pCre, phosphoethanolamine, phosphocholine, glycero-phosphocholine, glycero-phosphoethanolamine and Pi. pCre was adjusted to 0 p.p.m. and, except for Pi, constraints for the chemical shifts of the other signals were applied as a fixed difference with respect to the position of pCre. ATP was represented by seven exponentially damped sinusoids, defining each multiplet by the respective number of peaks with identical damping and adequate amplitude ratios. The coupling constant was fixed at 18 Hz. One signal with a fixed chemical shift of 2.24 p.p.m. and maximum line width of 50 Hz was used to account for potential macromolecule signals in the phosphodiester region. Corrections were performed for 60° flip angle and partial saturation using T1 of 2.4 secs for pCre, 1.1 secs for Pi and 1.0 secs for ATP, resulting in respective intensity correction terms of 1.60, 1.27 and 1.24. The relaxation times are within the error margins of published data measured at 1.5 T (Buchli et al, 1994) and 4 T (Hetherington et al, 2001).
External Calibration
Signal intensities were quantified in terms of absolute concentrations by the phantom replacement method (Michaelis et al, 1993). The phantom solution, which was used as external calibration reference, contained 20 mmol/l creatine and 20 mmol/l phosphate. In contrast to the
Regions of Interest
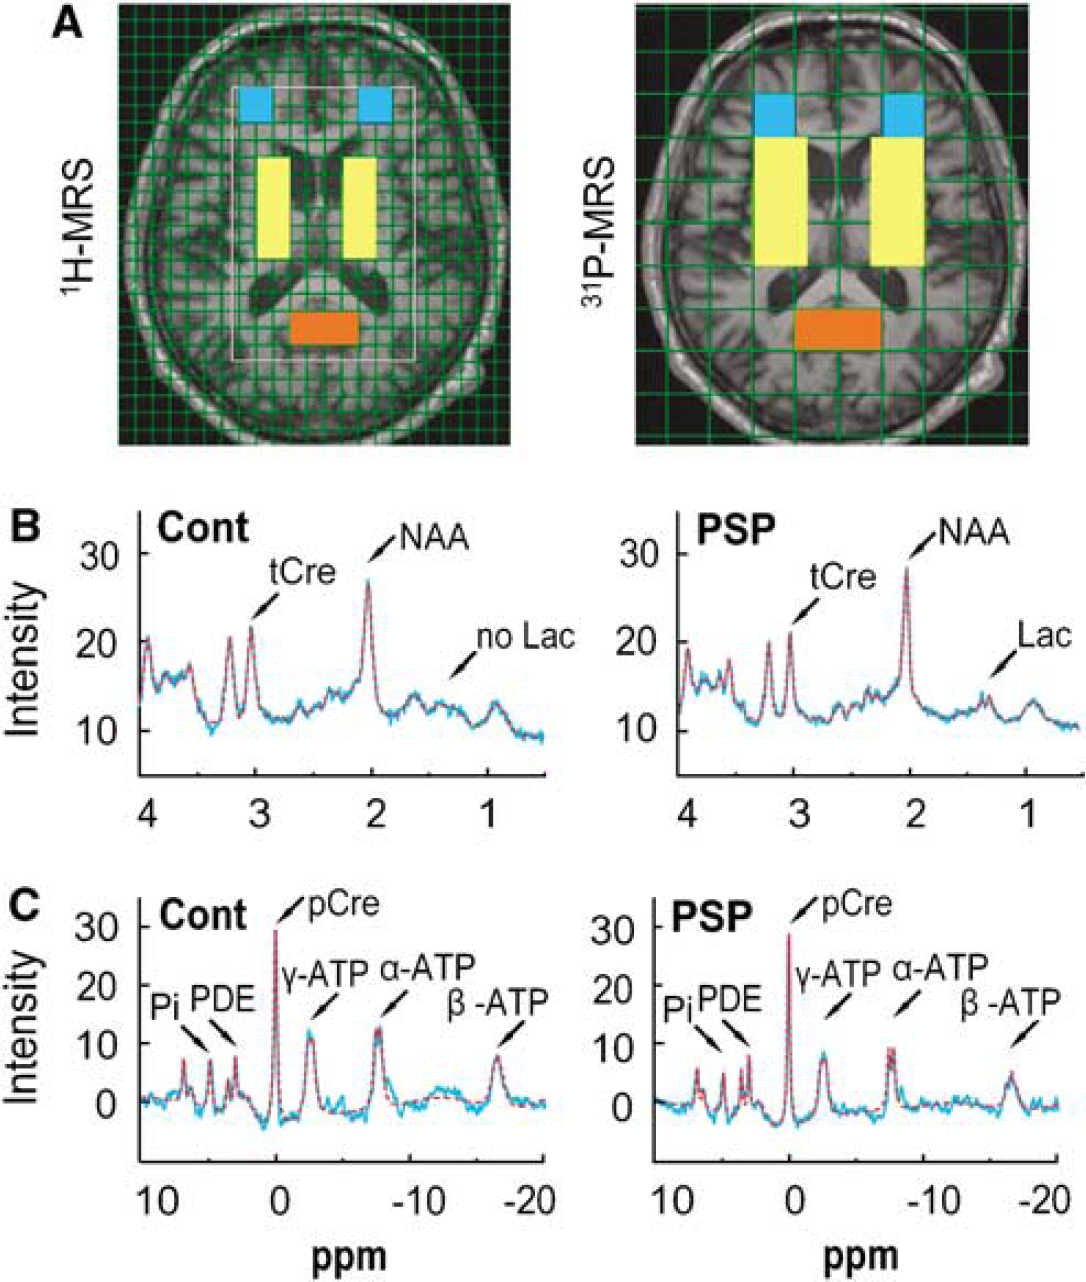
Figure 1A shows the axial plane of a T1-weighted magnetic resonance image from a control brain. The grid indicates the resolution of each modality, whereas the location of the templates defines the regions of interest (ROIs) in the ‘basal ganglia’, ‘frontal lobe’ and ‘occipital lobe’ for 1H- and 31P-MRS. As the data from the left and right ‘basal ganglia’ and ‘frontal lobe’ ROIs did not differ significantly from each other, only the averaged values are given. The ROI for the ‘occipital lobe’ crossed the midline and thus yielded only one set of data.
Magnetic resonance spectroscopy (MRS). (
MRS Data Acquisition
The signals for tCre, NAA and lactate were obtained from the 1H spectra (Figure 1B). Those for Pi, pCre and ATP were from the 31P spectra (Figure 1C).
The following parameters were calculated from the measured values:
ADP= [(tCre–pCre) *β–ATP]/[pCre × H × KCK]
with KCK = 1.66 × 10⁹ mol/L−1 and H= 10−pH mol/L (Pietz et al, 2003);
uCre = tCre–pCre;
HEP= β-ATP + pCre (Rango et al, 2006);
LEP =ADP+ uCre (Rango et al, 2006);
Phosphorylation potential (PP) =ATP/(ADP × Pi) (Pietz et al, 2003).
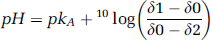
where δ1 = 3.27, δ2 = 5.63,
Statistical Analysis
As data on cytosolic ADP levels measured by 1H-MRS in the occipital lobes of PSP patients compared with those of healthy controls are available (Martinelli et al, 2000), ADP was used as the main outcome parameter for sample size calculation. With a 2:1—the patient/control ratio, 16:8 available individuals are needed to obtain 90% power to detect a significant difference (
Results
Study Population
A total of 67 patients were screened for eligibility, of which 46 were excluded: 21 for clinically possible but not clinically probable PSP, 21 for Parkinson's syndrome other than PSP, 14 for a PSP stage > III, 14 for dementia, 5 for structural brain disease, 2 for insufficiently treated arterial hypertension, 2 for a systemic disease affecting the brain and 2 for another serious illness. The total number of excluded patients was less than the sum of the individual items, as some patients fulfilled more than one of the exclusion criteria. Twenty-one patients met the inclusion and none of the exclusion criteria and participated in the study.
The clinical characteristics of the analyzed participants are shown in Table 1.
Clinical characteristics of the participants
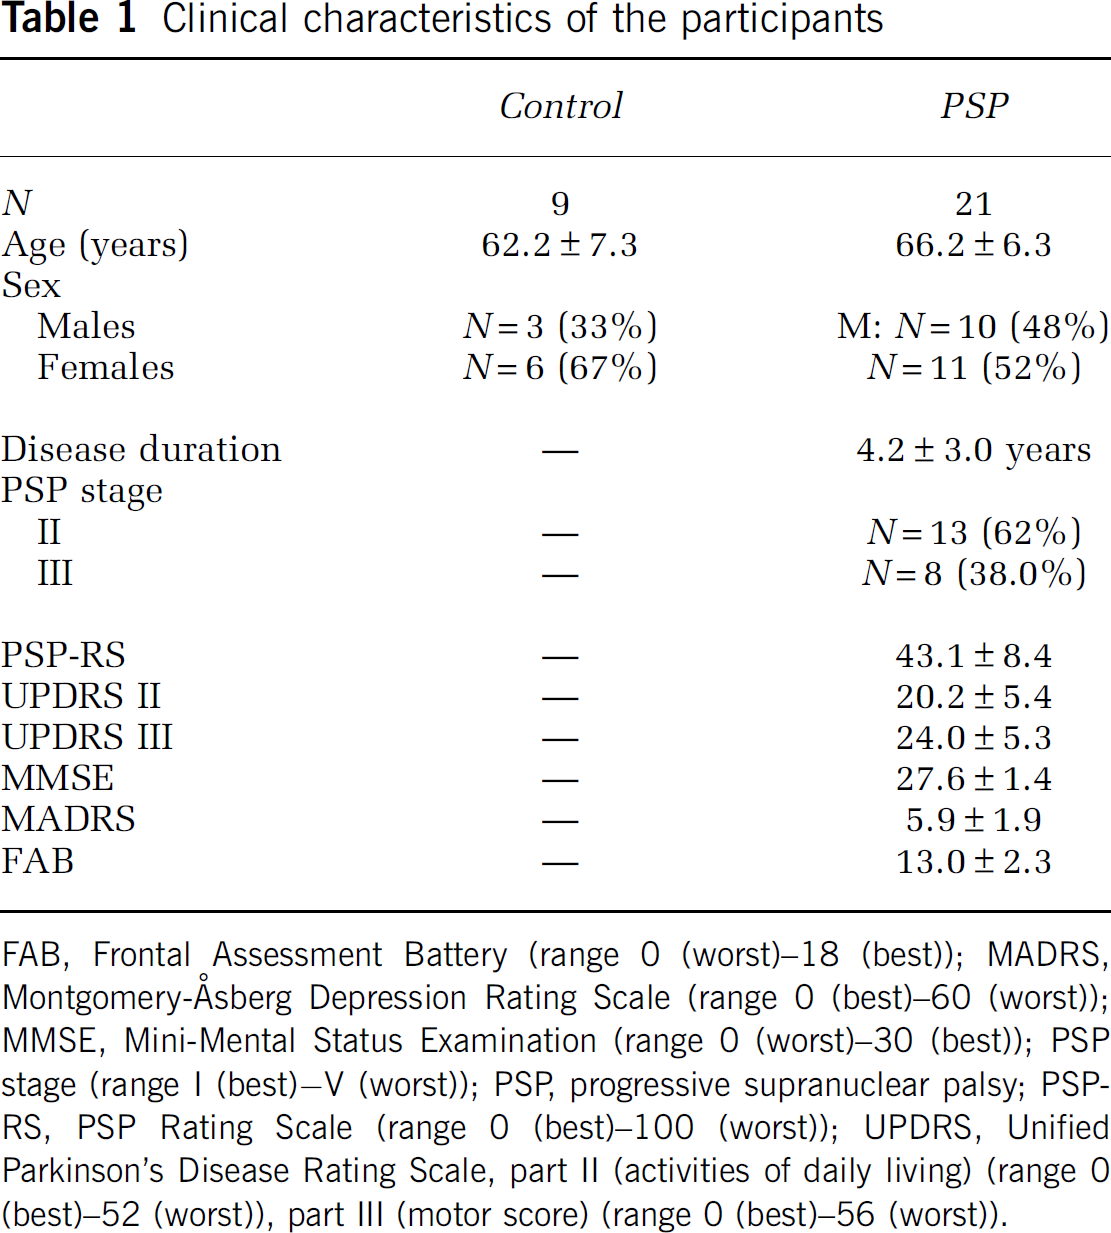
FAB, Frontal Assessment Battery (range 0 (worst)−18 (best)); MADRS, Montgomery-Åsberg Depression Rating Scale (range 0 (best)−60 (worst)); MMSE, Mini-Mental Status Examination (range 0 (worst)−30 (best)); PSP stage (range I (best)–V (worst)); PSP, progressive supranuclear palsy; PSP-RS, PSP Rating Scale (range 0 (best)−100 (worst)); UPDRS, Unified Parkinson's Disease Rating Scale, part II (activities of daily living) (range 0 (best)−52 (worst)), part III (motor score) (range 0 (best)−56 (worst)).
N-Acetylaspartate
We found no significant differences in NAA, tCre or the NAA/tCre ratio in patients and controls in any of the ROIs analyzed (Figure 1B, Table 2), suggesting that the patients studied, who were in early stages of the disease, had only mild neuronal disintegrity in the analyzed ROIs.
Cerebral metabolites measured by magnetic resonance spectroscopy
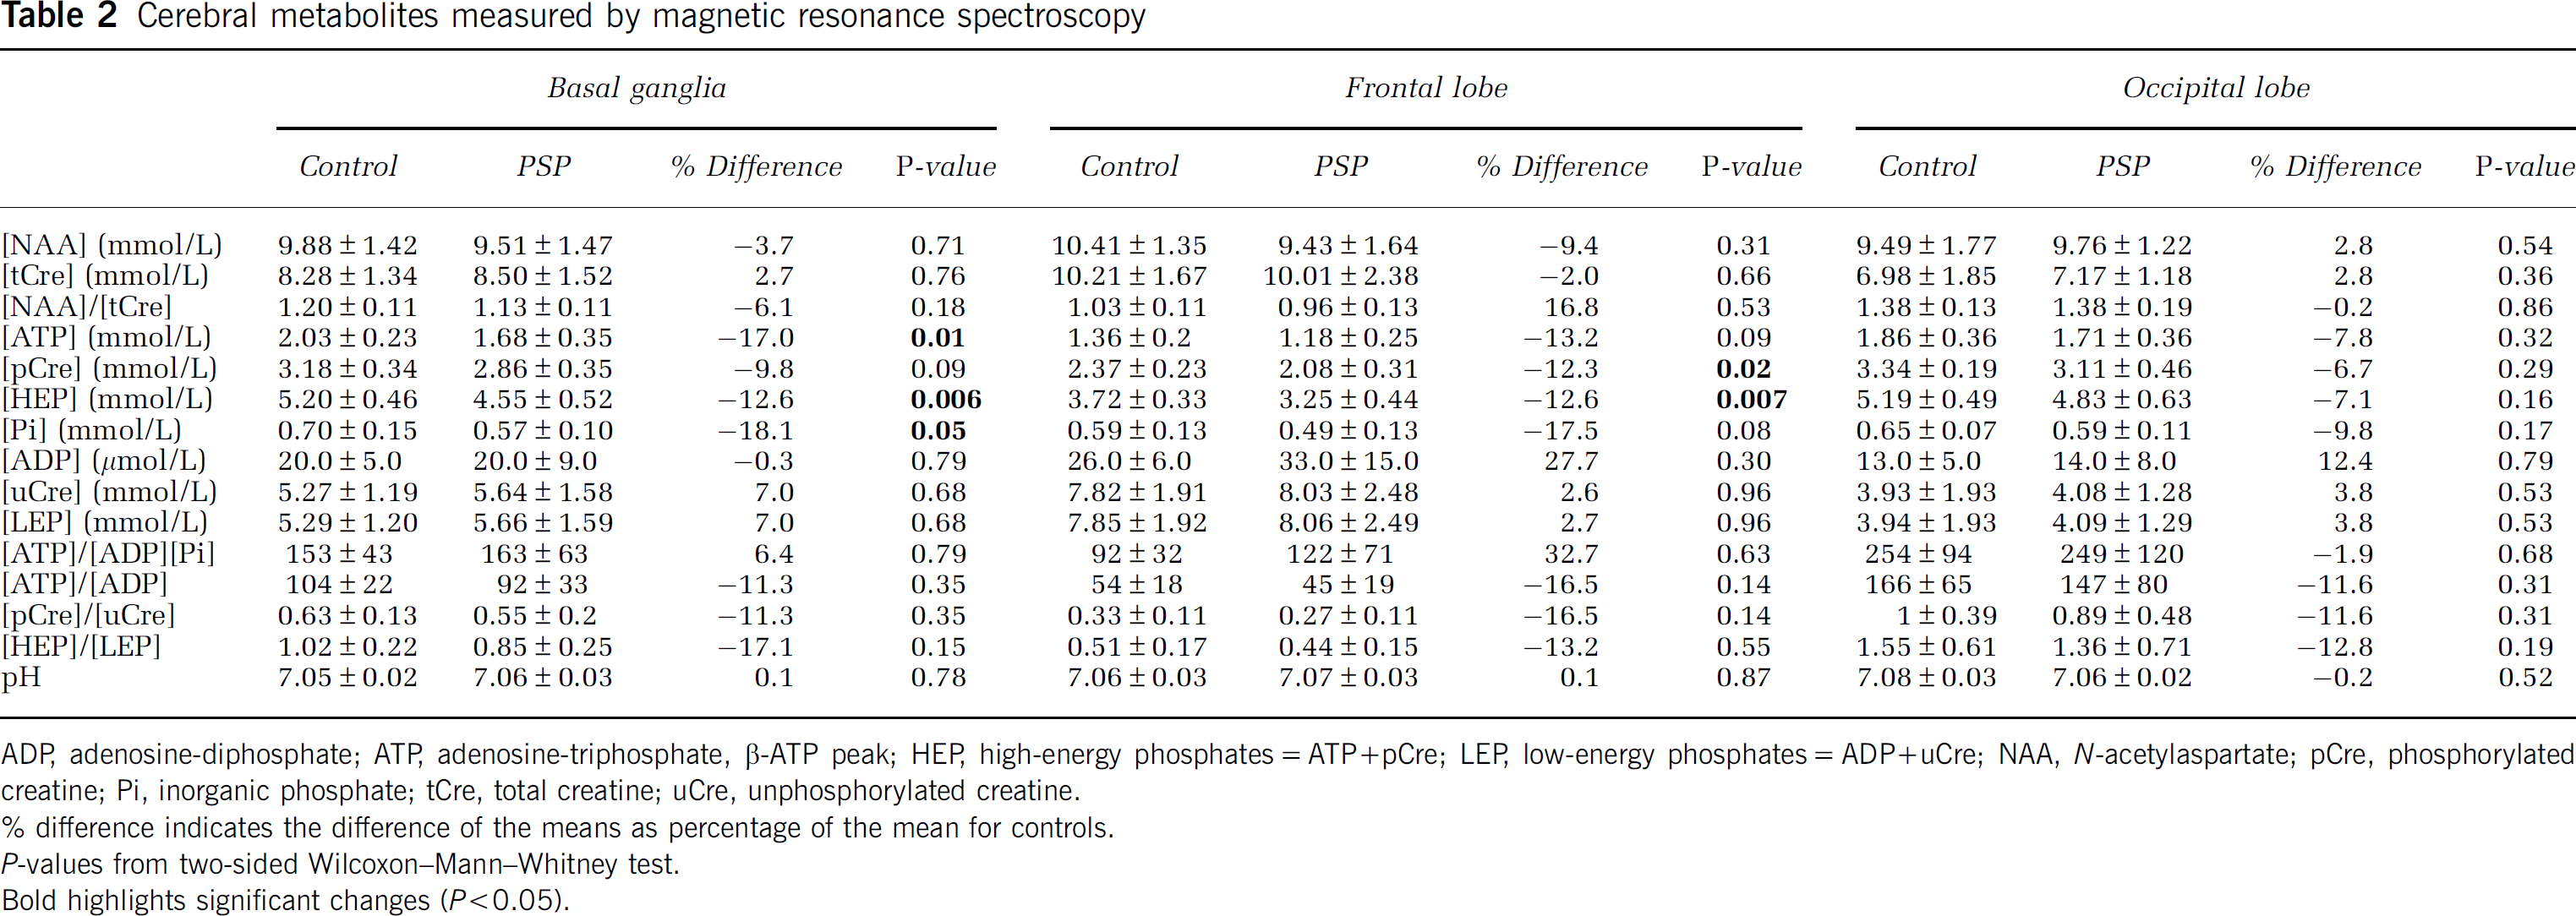
ADP, adenosine-diphosphate; ATP, adenosine-triphosphate, β-ATP peak; HEP, high-energy phosphates=ATP+pCre; LEP, low-energy phosphates=ADP+uCre; NAA,
difference indicates the difference of the means as percentage of the mean for controls.
Bold highlights significant changes (
Energy Metabolites in the Basal Ganglia
In the ‘basal ganglia,’ ROI (averaged value of the left and the right hemisphere), there was a significant reduction in the concentration of ATP (
When the analysis of the ‘basal ganglia’ ROI was carried out separately for the left and right hemispheres, the HEP concentration was also significantly lower in patients on both sides (left: −12.1%,
Free phosphate (Pi) levels were also decreased in the averaged ‘basal ganglia’ ROI of patients (
In contrast, there were no significant differences in the LEPs, ADP and uCre, and the sum of both (LEPs) in the averaged ‘basal ganglia’ ROI of patients and controls (Table 2).
The ratios of the HEPs to their low-energy counterparts (PP =ATP/(ADP × Pi), ATP/ADP, pCre/uCre and HEP/LEP), which are considered to represent the cellular energy load that drives all energy-dependent biochemical processes (Iles et al, 1985; Pietz et al, 2003), were not altered in the ‘basal ganglia’ ROI of the PSP patients (Table 2). Neither were the HEP/Pi (Rango et al, 2006), ATP/Pi (Hu et al, 2000) and pCre/Pi ratios (Penn et al, 1995) (data not shown).
Energy Metabolites in Other Brain Areas
In the averaged ‘frontal lobe’ ROI of patients, changes in the concentrations of energy metabolites were similar to those in the ‘basal ganglia’ ROI: there were significantly lower concentrations of HEP (
In the averaged ‘occipital lobe’ ROI, none of the parameters measured differed significantly in patients and controls (Table 2).
Lactate
In healthy control brains, lactate is not detectable by 1H-MRS, using the data acquisition scheme described earlier (Isobe et al, 2007). Consistently, we found no lactate peaks in the 1H-MRS data of any of healthy control subjects. In contrast, lactate peaks suggestive of increased anaerobic glycolysis (Prichard et al, 1991) were found in 7 of 20 (35%) PSP patients. These lactate peaks were typically found in a paraventricular location in the ‘basal ganglia’ ROIs (Figure 1B).
pH
The intracellular pH was not significantly different in any of the ROIs of the patients compared with those of the controls (Table 2).
Dependence of MRS Outcomes on Age and Sex
In view of slight, nonsignificant imbalances in the age and sex distributions of patients and healthy controls (Table 1), we calculated robust regressions of the MRS outcomes in patient status adjusted for age and sex as sensitivity analyses. The results were in line with the nonadjusted analyses (data not shown).
Clinical Correlations
We calculated the Spearman rank correlations between the concentrations of the HEPs (ATP, pCre, HEP) and the PP in the averaged ‘basal ganglia’ ROI and the scales measuring motor dysfunction (PSP-RS total score and UPDRS III). No significant correlations were observed (data not shown). We also found no significant rank correlations of the concentrations between the HEPs (ATP, pCre, HEP) and the PP in the frontal lobes with the FAB scale measuring frontal lobe dysfunction (not shown).
Differentiation of Patients From Controls
In our data set, a preliminarily assumed threshold of ⩽4.95 mmol/L for HEP would have distinguished PSP patients from controls free of neurologic symptoms with a sensitivity of 85% and a specificity of 71%.
Discussion
Phosphorus magnetic resonance spectroscopy is an excellent technique for monitoring cerebral energy metabolism
Reduced cerebral glucose metabolism has already been shown
An important question arising from our observations concerns the nature of the biochemical deficit at the origin of the metabolic alterations. The decrease in ATP might be explained by either an increase in ATP hydrolysis or a decrease in ATP production through glycolysis and oxidative phosphorylation. In the first case, one would expect an increase in glucose metabolism, but the inverse is seen in the brains of PSP patients (Foster et al, 1988). Therefore, our results support the hypothesis of a primary impairment of mitochondrial ATP production in PSP (Figure 2). The increase in lactate levels in a proportion of PSP patients, which was not observed in controls, is indicative of an excess of anaerobic glycolysis over aerobic oxidative phosphorylation (Prichard et al, 1991), suggesting that ATP generation through anaerobic glycolysis is increased to compensate for the reduction in ATP generation caused by defective oxidative phosphorylation. The reduction of pCre, the second high-energy metabolite that contributes to rapid ATP production in situations of high-energy demand, is also compatible with an impairment of oxidative phosphorylation that prevents the regeneration of this metabolite. Our earlier published observation that oral administration of coenzyme Q10, a physiologic cofactor of complex I of the mitochondrial respiratory chain, improves not only clinical disability scores but also the increased ATP/ADP, pCre/uCre and HEP/LEP ratios measured by the same 31P-MRS and 1H-MRS method, in the same PSP patients studied here (Stamelou et al, 2008), which provides further support for the concept of a functionally relevant impairment of oxidative phosphorylation in PSP.
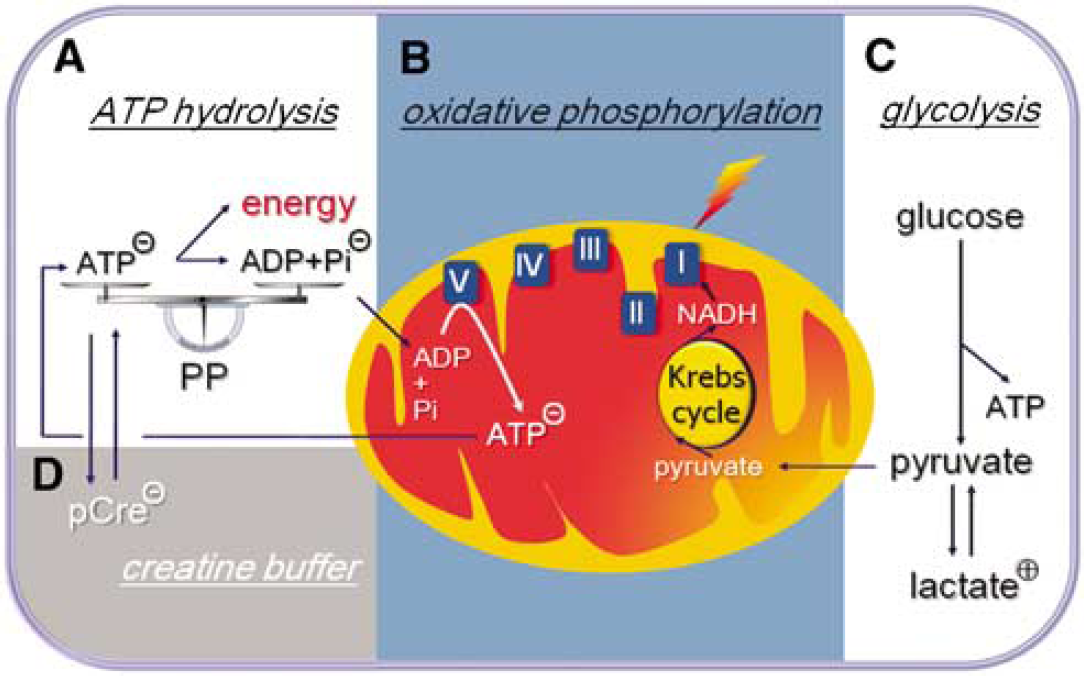
Schematic representation of the basic pathways of energy metabolism and the alterations observed in PSP patients in this study. (
It is important to note that brain mitochondria can tolerate a 60% decrease in complex I activity, without a significant decrease in ATP production (Davey et al, 1997). Inversely, the presence of a small significant ATP loss strongly suggests the presence of a much more severe inhibition of the respiratory chain. The reduction in high-energy metabolites in PSP was detected at rest, whereas in Parkinson's disease, another neurodegenerative disorder with presumed mitochondrial complex I dysfunction (Schapira, 2006), similar metabolic alterations were only observed after functional activation (Rango et al, 2006). This may suggest that the mitochondrial dysfunction in PSP is more severe than in Parkinson's disease. Therefore, we are tempted to conclude that the small, yet significant alterations in the cerebral high-energy metabolites determined in this study provide important insights into the pathophysiology of PSP.
It is interesting that the decrease in high-energy metabolites observed in the PSP patients was not accompanied by an increase in their low-energy counterparts, as it occurs during acute ischemia (Hems and Brosnan, 1970) or in Leber's hereditary optic neuropathy (Lodi et al, 2000). However, there is solid
Indeed, the fact that the PP [=ATP/(ADP × Pi)] and the other ratios of high-energy metabolites when compared with their low-energy counterparts (ATP/ADP, pCre/uCre and HEP/LEP), which determine the energy level driving all cellular energy-dependent processes (Iles et al, 1985; Pietz et al, 2003; Schapira, 2006), was not significantly altered in the patients suggests that the affected cells can still compensate, at rest, for the decrease in high-energy metabolites (Iles et al, 1985; Pietz et al, 2003; Schapira, 2006). This may mean that the neurons in the affected brain areas in the early-stage PSP studied were not dysfunctional at rest. This perspective is consistent with the observation that the severity of the clinical symptoms was not correlated with the concentrations of HEPs or the PP in PSP patients. Further, the observed metabolic deficit, particularly the ATP depletion, may render the affected neurons more prone to neurodegeneration and somatodendritic tau accumulation, as we have shown experimentally (Höglinger et al, 2005; Escobar-Khondiker et al, 2007).
In summary, our data provide the first
Footnotes
Acknowledgements
We thank O Arias-Carrión for skilful help with the graphics.
The authors declare no financial interest related to the materials and methods presented here.