
Abstract
We examined whether the degree of hemodynamic stress in patients with chronic occlusive cerebral vascular disease can be quantitatively evaluated with the use of perfusion-weighted magnetic resonance imaging (PWI). Thirty-six patients with moyamoya disease (mean age, 26.8 years; range, 18 to 59) underwent PWI and positron emission tomography (PET) within a month's interval. The PWI data were calculated by three different analytic methods. The cerebral blood flow (CBF) ratio, cerebral blood volume (CBV) ratio, and mean transit time (MTT) of the anterior circulation were calculated using the cerebellum as a control region and compared with PET data on the same three parameters and oxygen extraction fraction (OEF). Parametric maps of PWI attained a higher resolution than the PET maps and revealed focal perfusion failure on a gyrus-by-gyrus level. The relative CBV and MTT obtained with PWI showed significant linear correlations with the corresponding PET values (CBV, R2 = 0.47 to 0.58; MTT, R2 = 0.32 to 0.68). We also found that we could detect regions with abnormally elevated OEF and CBV based on the delay of PWI-measured MTT relative to the control region by defining a 2.0-sec delay as a threshold. The sensitivity and specificity were 92.3% and 100% in detecting regions with abnormally elevated OEF, and 20.0% and 100% in detecting regions with abnormally elevated CBV, respectively. Among the parameters obtained with PWI, our results suggested that the relative CBV value and delay of MTT might be quantitatively manipulated to assist in clinical decision-making for patients with moyamoya disease.
Introduction
To understand the pathophysiology and determine the optimal treatment of occlusive cerebrovascular disease, it is vital to clarify the degree of hemodynamic compromise in each patient. Patients at a high risk of ischemic stroke generally exhibit abnormally high oxygen extraction fraction (OEF) and elevated cerebral blood volume (CBV), a combination of states described as misery perfusion or grade 2 hemodynamic stress (Derdeyn et al, 2002; Grubb et al, 1998). The concurrent measurement of cerebral blood flow (CBF), metabolism, and blood volume on the same occasion by positron emission tomography (PET) serves as the optimal method for evaluating hemodynamics in patients. Positron emission tomography is usually unavailable in daily clinical practice, however, and it provides only poor information on the structural integrity of hypoperfused tissue.
Perfusion-weighted magnetic resonance (MR) imaging (MRI) (PWI) provides various parameters of cerebral dynamics noninvasively and in less time than PET. A newly developed technique for determining absolute CBF using MRI by introducing an empirical normalization constant in animals (Ostergaard et al, 1998b) and humans (Ostergaard et al, 1998a) has recently been applied to evaluate occlusive cerebrovascular disorder (Baird and Warach, 1998; Maeda et al, 1999; Warach et al, 1996). To apply this technique effectively in decision-making for individual patients, however, we first have to clarify the reliability of the obtained parameters. In this study, we examined the same individual patients by PWI and PET within a short period in an attempt to confirm whether the numerical parameters obtained with PWI can be manipulated as quantitative values.
Moyamoya disease is a slowly progressive cerebrovascular disease with terminal internal carotid artery (ICA) occlusion and collateral formation of abnormal arteries (Matsushima, 1999; Suzuki and Takaku, 1969). Patients with moyamoya disease show various degrees of hemodynamic insufficiency and clinical symptoms. This variability might be due to the variable interaction between the worsening hemodynamic factors with disease progression and the protection conferred by the collateral development (Ikezaki et al, 1994; Nariai et al, 2005). The ischemic episodes in moyamoya patients are often caused by hemodynamic stress rather than thromboembolism (Ikezaki et al, 1994). These features of moyamoya disease make it an appropriate subject for comparing quantified hemodynamic factors with multiple modalities (Nariai et al, 1995). The use of PWI in moyamoya patients has been reported by several groups (Calamante et al, 2001; Kassner et al, 2003; Lee et al, 2003; Tsuchiya et al, 1998; Yamada et al, 1999). However, the accuracy of quantitative evaluation of cerebral hemodynamics by PWI in moyamoya patients has not yet been discussed. Moreover, we have yet to understand the significance of the abnormalities in the PWI parameters in relation to the severity of hemodynamics in patients with occlusive cerebrovascular disease. The purposes of the present study were to evaluate whether PWI can accurately measure hemodynamic parameters, and to certify the reliability of quantitation. We also discussed the range of application of this method in various types of cerebrovascular disease.
Subjects and methods
Forty-one examinations of 36 patients with angiographically confirmed moyamoya disease were evaluated in this study. The subjects consisted of 4 men and 32 women, ranging in age from 18 to 59 years (mean age, 26.8 years). All of the patients exhibited complete obstruction or stenosis in the terminal portion of bilateral ICA with moyamoya vessels, but no abnormal findings in cerebellar circulation. They underwent both PWI scan and PET scan within the same 30-day period for diagnosis or follow-up evaluation of cerebral hemodynamics. Five of the patients underwent postoperative scans at least 1 year after the bilateral indirect bypass surgery (encephalo-duro-arterio-synangiosis). The transient ischemic symptoms disappeared and good revascularization was confirmed by angiography in all five of these patients at the time of the scanning. Thus, their hemodynamic status was confirmed to be stable when the comparative examinations using PWI and PET were performed.
Perfusion-Weighted Magnetic Resonance Imaging
The MR imaging studies were performed using a 1.5-T superconducting system with a 25 mT/m maximal gradient capacity (Magnetom Vision; Siemens, Erlangen, Germany) and a circularly polarized head coil. Perfusion-weighted magnetic resonance imaging was performed using a multislice, single-shot, spin-echo echo-planar imaging sequence. The imaging parameters were as follows: repetition time = 1200 ms, echo time = 66 ms, field of view = 230 × 230 mm2, matrix size = 128 × 128. A total of 50 scans with 7 slices were repeated in quick succession without delay (3 scans before injection). The device scanned a series of seven 5-mm-thick slices separated by 7.5-mm gaps. The lowermost slice included the cerebellar hemisphere as a control area, and another slice included the ICA to enable estimation of the arterial input function (AIF). The seven slices were also set to cover both cerebral hemispheres. Each patient received a bolus injection of gadodiamide (0.2 mmol/kg body weight; OMNISCAN, Daiichi Seiyaku, Tokyo, Japan) via an antecubital vein using a power injector (Nemoto Kyorindo, Japan) at a rate of 3 mL/sec, followed by a 15-mL saline flush.
Perfusion-Weighted Magnetic Resonance Imaging Image Processing
All of the PWI data and PET data were transferred to a personal computer after the measurement. The PWI data were analyzed by three separate analyses using Dr View/LINUX R2.0 software (Asahi Kasei Information Systems, Tokyo, Japan). In preparation, we calculated the transverse relaxation rate (ΔR2) by the equation ΔR2(t) = −ln(S(t)/S0)/TE, where S(t) was signal intensity at time t, S0 was the precontrast baseline signal intensity, and TE was the sequence echo time. Next, we applied a 3 × 3 uniform smoothing kernel to the raw image and commenced the three analyses to generate the parameters. In the first analysis, we generated a CBF map and CBV map by deconvolving the change in tissue concentration over the first pass of contrast agent with an arterial AIF using singular value decomposition (SVD) (Ostergaard et al, 1996a, b) (deconvolution method) and then calculating the mean transit time (MTT) by CBV/CBF. While this method generally yields accurate measurements of CBF, the flow estimates using SVD are susceptible to error due to bolus delay and dispersion. To improve reliability, we evaluated the PWI data by our second analysis, a pixel-based numerical integration analysis with the measured data for calculation of the relative CBV (rCBV) and relative MTT (rMTT) (PIX method). The rCBV and rMTT were directly calculated from the time–ΔR2 curve
where Tstart was the starting time of the first pass of contrast medium in each pixel and Tend was the ending time. The relative CBF (rCBF) was obtained as rCBV/rMTT. Our third analysis was based on what we call the FIX method. The analysis was performed by measuring the mean start time and end time of the bolus passage of contrast medium in the entire brain and then applying the values to each pixel to measure parameters as the first-pass-start time and first-pass-end time, respectively. The equations to generate rCBV and rMTT were the same as those used in the PIX method. Having generally witnessed good correlations between FIX results and PET results in the past, we decided to include the former in this study. All the generated maps were filtered with a 5-mm full-width at half-maximum (FWHM) to achieve a resolution similar to that of the PET maps.
Positron Emission Tomography Study with 15O Gases
The method used for our PET study has been described previously (Nariai et al, 1994). Briefly, the PET study was performed using a Headtome-V scanner (Shimadzu Corporation, Kyoto, Japan). The regional CBF and OEF were measured during continuous and consecutive 9-min inhalations of C15O2 and 15O2 with continuous arterial blood sampling, employing a table-lookup technique (Senda et al, 1988). The regional CBF and OEF were obtained by calculating the values with lookup tables created from the arterial whole blood and plasma radioactivity curves, and then correcting them for delay and dispersion (Iida et al, 1986). The CBV was measured by a 3-min inhalation of C15O with blood sampling (Grubb et al, 1978). The OEF was corrected for the effect of the regional CBV (Lammertsma and Jones, 1983; Mintun et al, 1984). The MTT was calculated as CBV/CBF. All the PET images were reconstructed into a series of seven 5-mm-thick axial images with 7.5-mm intergaps, matched to the PWI level in each patient to set the regions of interests (ROIs) for PET and PWI in the same locations.
Analysis by Placing Region of Interests and Statistics
Abnormalities of cerebral hemodynamics in each patient were evaluated by manually placing the ROIs over the cerebral cortex (frontal, temporal parietal, and sensorimotor cortex) supplied by the internal carotid system (anterior circulation) and the upper cortex of the cerebellum, avoiding the infarcted area. Each ROI consisted of a series of 1-cm-diameter circles along the cortical rim. The mean values of MTT or rMTT, rCBF or CBF, and CBV or rCBV of the ROIs in each hemisphere were calculated (anterior MTT, anterior CBF, and anterior CBV, respectively) for both PWI and PET. In the PWI data, we also calculated the ratios of the anterior CBF (CBF ratio) and anterior CBV (CBV ratio) to the cerebellum. The corresponding data between the PWI and PET of CBF (PWI–CBF ratio versus PET–anterior CBF), CBV (PWI–CBV ratio versus PET–anterior CBV), and MTT (PWI–anterior MTT versus PET–anterior MTT) were compared with each other. The delay of the anterior MTT compared with the MTT or rMTT of the cerebellum measured by PWI was termed the ‘MTT delay’ and examined for correlations with the OEF and CBV obtained by PET.
All the data were expressed as mean ± s.d. Spearman's test and linear regression analysis were used to assess correlations between PWI and PET parameter values of the CBF ratio, CBV ratio, and anterior MTT. Correlations of the MTT delay of PWI with the OEF ratio and CBV from PET measurements were statistically analyzed by various regressions. Cluster analysis by the K-mean method was also applied to analyze the distribution of pixel values between PWI and PET. A P-value of <0.05 was considered statistically significant throughout the study.
Results
General Findings
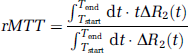
Both PET and PWI data showed various hemodynamic abnormalities in unilateral or bilateral hemispheres in all of the patients studied. Yet, a comparison between the images obtained by the two methods clearly illustrated that only PWI could provide regional information on a gyrus-by-gyrus level (see Figure 1). Perfusion-weighted magnetic resonance imaging could be directly compared with morphological MRI, allowing the direct detection of abnormalities in CBF, CBV, and MTT on a precise anatomical basis. Perfusion-weighted magnetic resonance imaging could also be performed rapidly, with an acquisition time only 60 secs longer than that of a conventional MRI examination. Positron emission tomography, in contrast, took more time and required registration process with morphological images (Nariai et al, 1997; Shimada et al, 2000). The high spatial resolution of the MR perfusion maps was more useful for regional evaluation than the lower resolution of the PET images (Figure 1).
Parametric maps to indicate CBF and CBV obtained by PWI (Fix method) and PET in a 35-year-old woman with moyamoya disease. The MTT map of PWI is also shown. The CBF–PWI map indicated a decrease in CBF in the bilateral parietal regions (white arrows). The MTT-PWI map indicated MTT prolongation in the same regions (red arrows). The regional distribution of CBF and CBV detected by PWI correlated well with that detected by PET, but the spatial resolution of the former was far better than that of the latter.
Correlation Between Magnetic Resonance Imaging and Positron Emission Tomography-Measured Cerebral Blood Flow, Cerebral Blood Volume, and Mean Transit Time
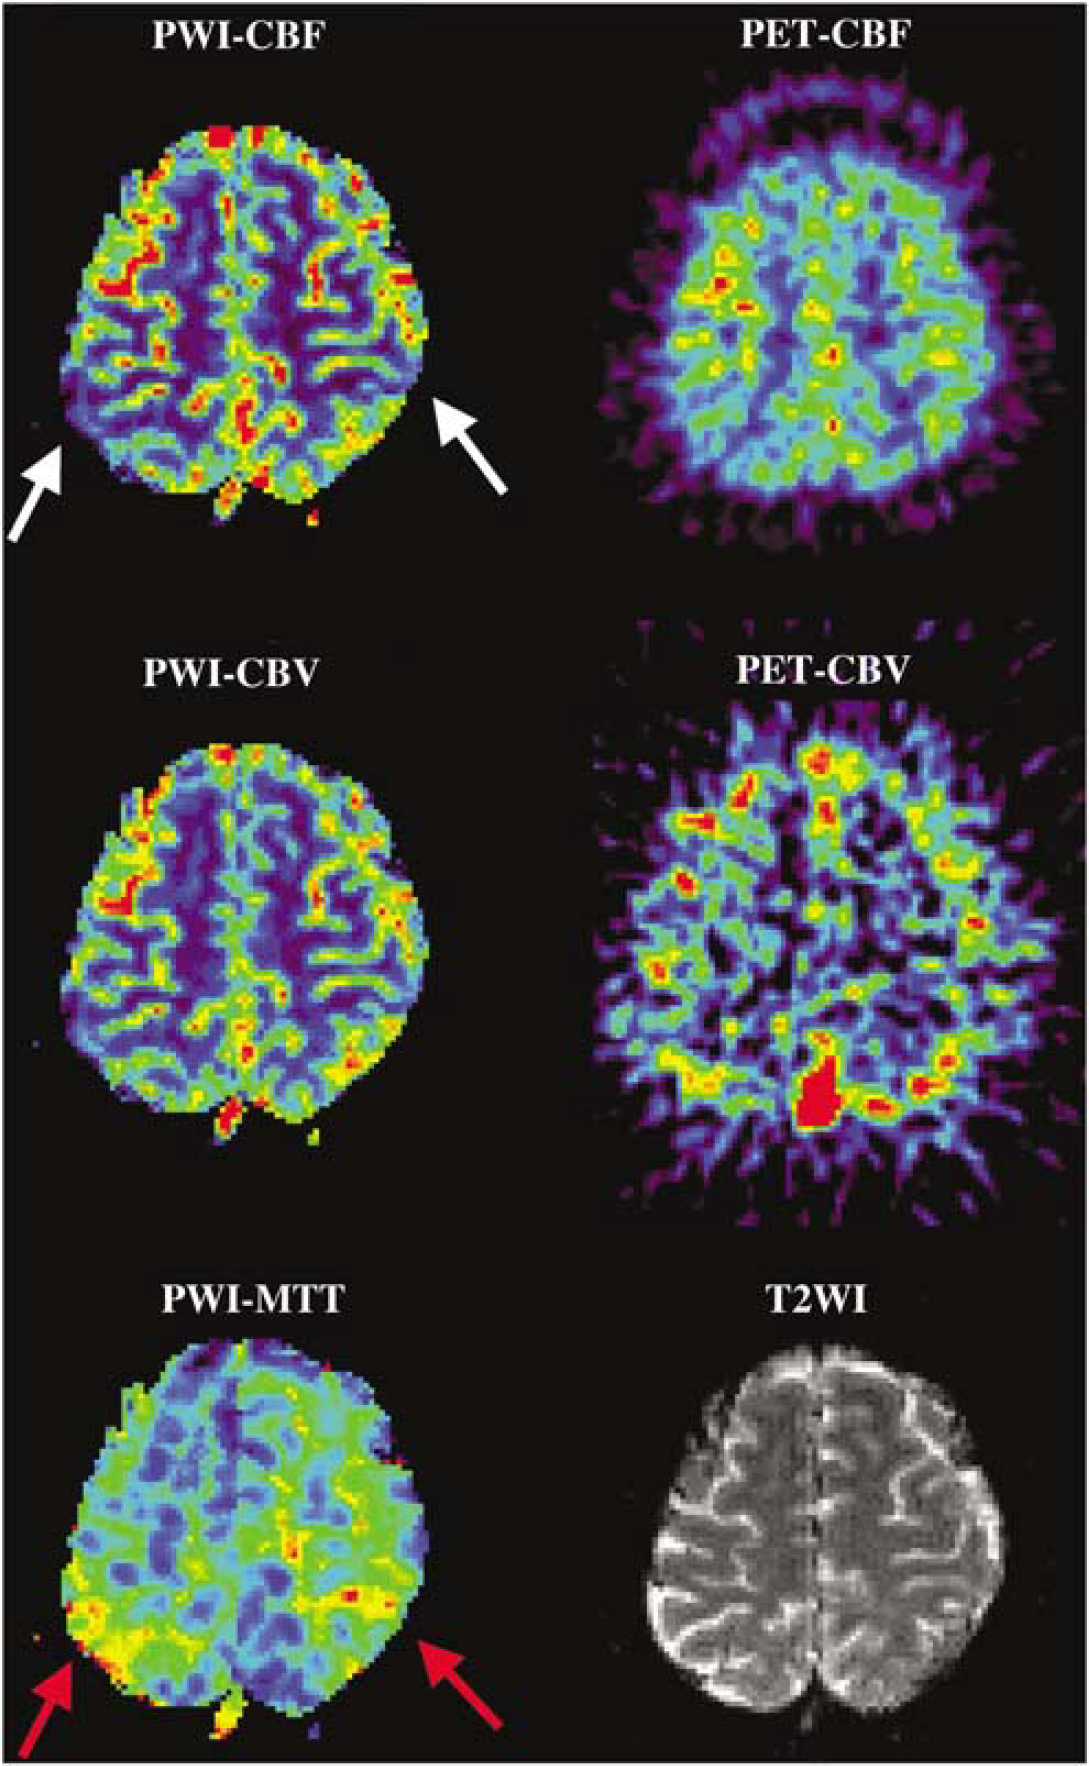
The correlations between PWI data and PET data on CBF, CBV, and MTT are illustrated in Figure 2. All CBV and MTT measurement variables calculated by the three analytic methods corresponded significantly with the PET data. The CBV ratio obtained by the PIX method had the highest correlation with the PET-measured CBV value (R2 = 0.58, P < 0.01, with the PIX method) among the three methods, and the ratios determined by the PIX and FIX analytic methods in the MTT measurement correlated well with the PET data (R2 = 0.58, P < 0.01, with the PIX method; R2 = 0.67, P < 0.01, with the FIX method). However, the only association between the PW1-measured CBF and PET-measured CBF was a weak but less than significant correlation determined by the FIX method (R2 = 0.06, P = 0.06). Based on these results, variables applied by PIX and FIX methods were used for further analysis.
Correlation between PWI and PET measurements of CBF (
Detection of Misery Perfusion Using Perfusion-Weighted Magnetic Resonance Imaging
While the MTT has been used as an index of reduced cerebral perfusion pressure (Gibbs et al, 1984), an MTT prolonged beyond normal (i.e., reduced perfusion pressure) does not necessary lead to a reduced CBF. The compensatory mechanism to increase the focal vascular bed works well to preserve CBF until the reduction of perfusion pressure exceeds a certain threshold. This threshold is thought to correspond to the border between grade 1 and 2 hemodynamic stress, as defined by Powers et al (Powers, 1991; Powers et al, 1987). As MTT is theoretically considered a reciprocal of perfusion pressure, we might be able to detect grade 2 hemodynamic stress (misery perfusion) by defining the threshold of MTT prolongation.
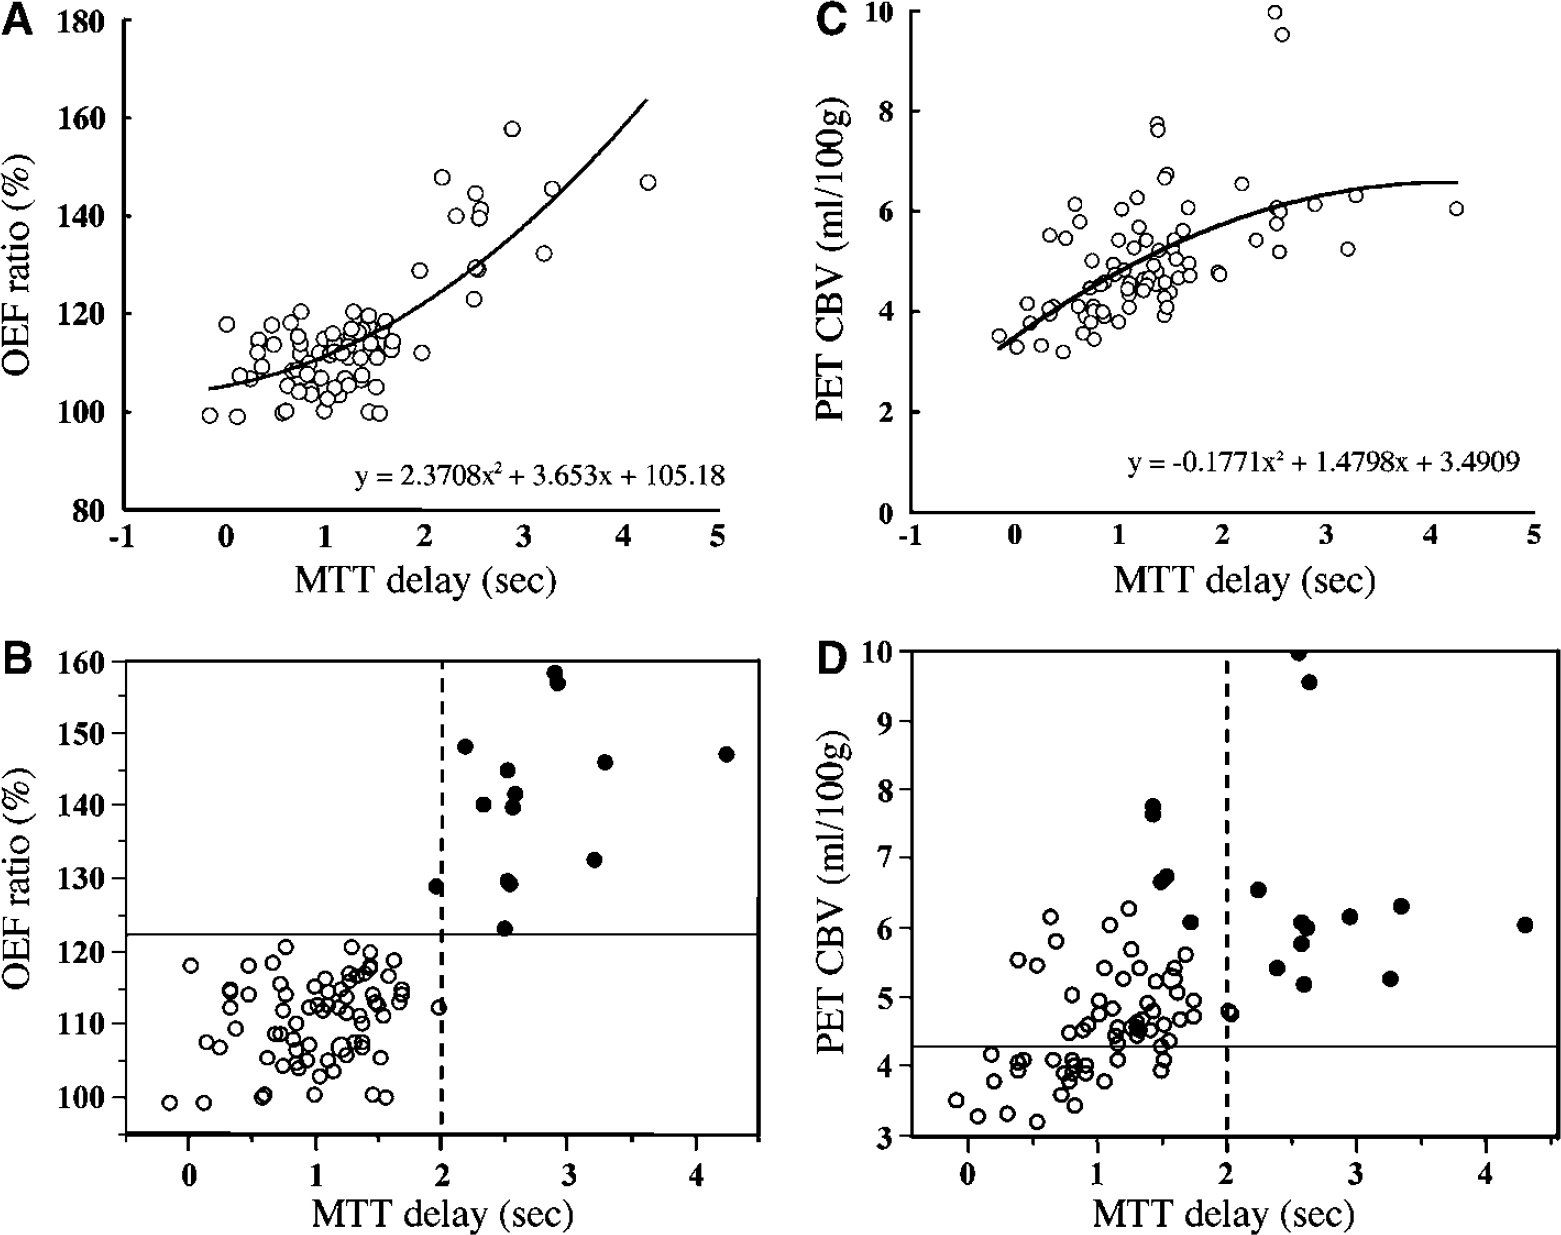
In our comparison between PWI-MTT and PET-OEF on the parametric image maps, the areas with highly prolonged MTT closely corresponded with the areas with elevated OEF measured by PET (Figure 3). We therefore plotted the PET-measured OEF (ratio to control) against the MTT (MTT delay) measured by the PIX and FIX methods in the PWI analysis. Correlations between the MTT delay obtained by the PIX method and the OEF ratio obtained by PET were slightly better fit by quadratic correlation (R2 = 0.61, P < 0.001) than by linear correlation (R2 = 0.57, P < 0.001). Correlations between the MTT delay obtained by the FIX method and the OEF ratio obtained by PET were lower than that obtained by PIX method (quadratic correlation, R2 = 0.46, P < 0.001; linear correlation, R2 = 0.43, P < 0.001). Thus, the MTT delay calculated by the PIX method was used for further analysis (Figure 4). We statistically clustered the distribution of pixels into two categories by the K-mean method, as shown in the graph in Figure 4B. This figure clearly indicates the division of the pixels into normal OEF and abnormally elevated OEF using an MTT delay of 2.0 secs as a threshold. In the cerebral hemispheres where the MTT delay was within 2 secs, the OEF value did not exceed 120% of control. When the MTT delay exceeded 2 secs, however, the OEF value rose in proportion to the MTT delay. This suggests that the presence and grade of misery perfusion might be detectable by measuring the MTT delay with PWI.
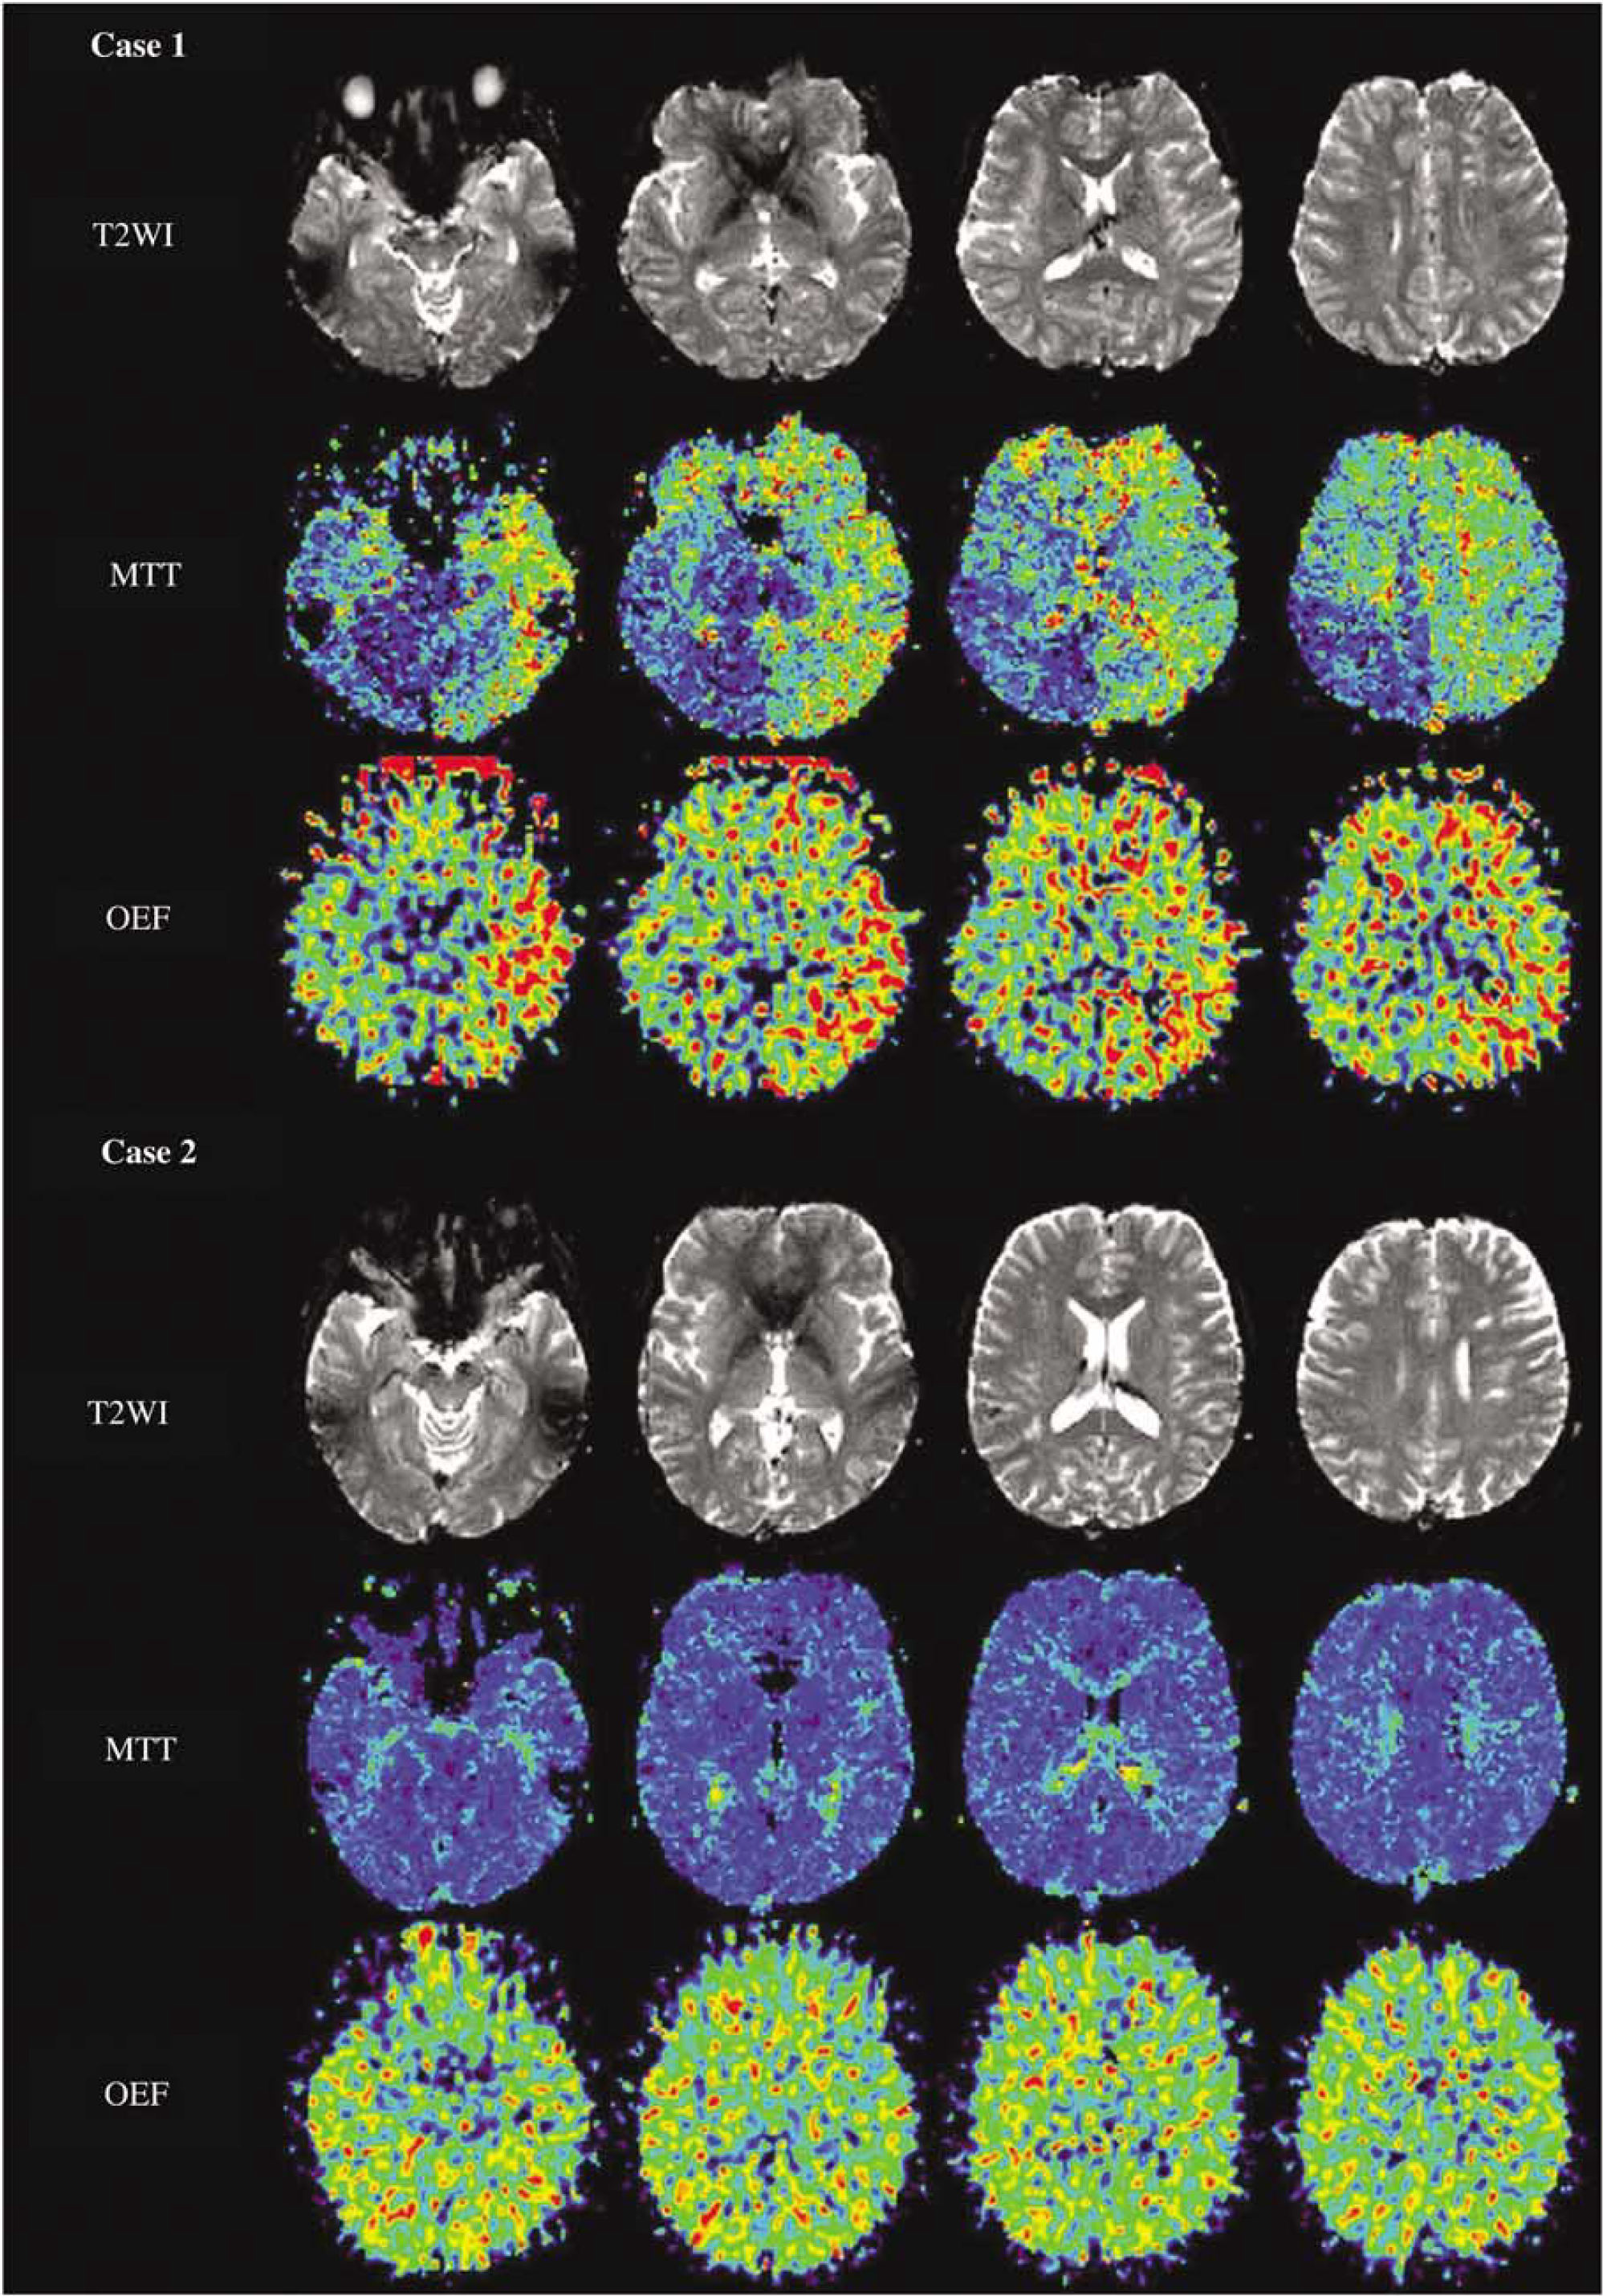
T2-weighted MRI (T2WI) (upper row), parametric maps to indicate MTT obtained with PWI (MTT) (middle row) and OEF images obtained with PET (lower row) of two representative moyamoya patients. Conventional MRI of case 1, a 26-year-old woman suffering from frequent temporary ischemic attacks (TIAs), depicted an infarcted area in the left frontal lobe. A parametric map of MTT showed a severe prolongation of transit time in the left entire hemisphere and right frontal lobe, and these findings closely corresponded with the OEF-elevated area. Case 2 was a 42-year-old woman who had been diagnosed with moyamoya disease incidentally and had no history of ischemic episodes. An infarcted area was also detected in the left frontal lobe, but the MTT map revealed almost normal circulation time in the entire brain. The parametric map of OEF also presented no abnormal elevation. MTT, mean transit time; OEF, oxygen extraction fraction; T2WI, echo-planar T2-weighted image.
(
In our examination of the relationship between the MTT delay by the PIX method and the CBV measured by PET, the latter tended to rise gradually in proportion to the duration of the MTT delay up to a delay of about 2.0 secs (Figure 4C). In the highly prolonged range, however, the CBV remained stably at around the 6 mL/100 g level irrespective of the duration of the MTT delay. The correlation between the MTT delay obtained by the PIX method on MRI and the CBV obtained by PET was slightly better fit by negative quadratic correlation (R2 = 0.34, P < 0.001) than by linear correlation (R2 = 0.31, P < 0.001). By clustering the pixels into two categories, we could differentiate the dimension with prolonged MTT and elevated CBV from that with only moderate abnormalities of the two parameters (Figure 4D). Clustering on the x-axis was not as clearly depicted as it was in the case of OEF, but the MTT delay of 1.5 to 2.0 secs could be used as a divider.
Before applying the threshold MTT delay value in actual clinical decision-making, we need to ascertain its sensitivity and specificity in detecting abnormally elevated OEF and CBV using the 2-sec MTT delay as a threshold. We did this by calculating the sensitivity and specificity of the method in detecting the mean + 2s.d. of the OEF ratio to the cerebellum and CBV using normal control data from our earlier study (Nariai et al, 2005). Lines to indicate these threshold values are displayed in Figures 4B and 4D. Through the calculation with these values, we determined that the threshold MTT delay value of 2.0 secs had a sensitivity and specificity of 92.3% (12/13) and 100% (12/12) in detecting regions with abnormally elevated OEF ratio, and 20.0% (12/60) and 100% (12/12) in detecting regions with abnormally elevated CBV, respectively.
Discussion
In the present report, we used data from moyamoya patients to analyze whether the hemodynamic parameters obtained with PWI are reliable for use in clinical decision-making in the treatment of patients with chronic occlusive cerebrovascular disease.
In making clinical decisions in the treatment of patients with occlusive cerebrovascular disease, it is now considered important to ascertain the degree of hemodynamic stress to predict the patient outcome (Derdeyn et al, 2002; Grubb et al, 1998). Simultaneous PET measurement of CBF and metabolism is the only known way to confirm the established risk factors (elevated OEF, misery perfusion, grade 2 hemodynamic stress). But rather than offering information of physiological significance, elevated OEF merely tells us that the decrease in focal perfusion pressure exceeds the maximum limit of the compensatory mechanism to increase the vascular bed for the preservation of CBF. As MTT measured by PWI is theoretically considered a reciprocal of perfusion pressure, we speculated that a comparison between PWI-measured MTT and PET-measured OEF may provide information useful for the detection of grade 2 hemodynamic stress.
In our analysis presented in Figure 4, OEF remained largely unchanged until the MTT delay in the anterior circulation of the cerebral hemisphere reached approximately 2 secs, whereupon it increased in proportion to the MTT delay beyond the 2-sec level. In our comparison of the CBV value from PET and the MTT value from the PIX method, however, the CBV showed no apparent increase once the MTT delay reached approximately 1.5–2.0 secs. The pixels were statistically clustered into two categories in both plots: pixels with only moderately prolonged MTT with normal OEF and moderately increased CBV, and pixels with markedly prolonged MTT with abnormally elevated OEF and saturated CBV.
By interpreting these plots with the theoretical consideration of the compensatory mechanism against major vessel occlusion proposed by Powers et al (Powers, 1991; Powers et al, 1987), we can align the threshold of the perfusion delay with the limit of vasodilatation to keep the CBF. In other words, we can detect the border between grade 1 and grade 2 hemodynamic stress at the threshold MTT delay value of around 2.0 secs, and the area with delay exceeding this point can be assumed to represent a state of misery perfusion. The analysis of sensitivity and specificity to detect abnormal OEF and CBV using this threshold value in Figure 4 also supports this assumption. High sensitivity and high specificity in detecting the region with elevated OEF indicate high reliability of the threshold MTT delay value to detect the border between grade 1 and grade 2. However, the low sensitivity of the 2.0-sec MTT delay in detecting the elevated CBV tells us that the CBV is already elevated before the MTT delay reaches 2.0 secs, without any corresponding elevation of OEF. This means, in turn, that the hemodynamic stress falls within the grade 1 range when the MTT delay remains less than 2.0 secs. Moreover, the 100% specificity of the more than 2 secs MTT delay in detecting elevated CBV tells us that grade 2 hemodynamic stress is always accompanied by elevated CBV. While several reports have investigated the use of PWI for the analysis of perfusion deficit (Baird and Warach, 1998; Maeda et al, 1999; Warach et al, 1996) and the loss of cerebrovascular reserve capacity (Schreiber et al, 1998) based on the MTT delay, no reports have interpreted the usefulness of the perfusion delay in depicting critical points for the prediction of misery perfusion. Our success in detecting this critical point by PWI in the present study may relate to the characteristics of moyamoya disease.
Moyamoya disease is a slowly progressive cerebrovascular disease which characteristically manifests variable degrees of perfusion deficit (Nariai et al, 2005). This variability in perfusion deficit makes the disease a suitable subject for comparative study using multiple modalities. However, our present results may also provide valuable insight into the specific pathophysiology of moyamoya disease. The application of PWI in cases with moyamoya disease has already been reported (Calamante et al, 2001; Kassner et al, 2003; Lee et al, 2003; Tsuchiya et al, 1998; Yamada et al, 1999). However, no studies have fully evaluated the accuracy of PWI measurement in moyamoya disease patients through comparisons with quantitative data acquired by other modalities, such as PET. Moyamoya disease usually exhibits a specific cerebral circulation pattern through leptomeningeal collaterals, and the focal perfusion is generally highly delayed. Thus, PWI and other methods to detect the bolus passage of contrast media are probably heavily affected by delay and dispersion (Calamante et al, 2000; Wu et al, 2003). Our result suggested that PWI potentially has the same level of reliability as PET in the quantitative measurement of CBV and MTT. Given the considerable scatter seen in the plots of Figure 2, however, caution should be taken in using this method for clinical decision-making. Henceforth, we will need to conduct ongoing comparative studies between PWI and PET to confirm the clinical reliability. Studies comparing the PWI parameters with clinical symptoms and treatment courses in individual patients with moyamoya disease will also be needed to confirm the utility of PWI measurement in the daily clinical setting.
In contrast to the PWI measurements of MTT and CBV and their promising utility, none of the three analysis methods using PWI showed any correlation with CBF measured by PET. We attributed this to the larger errors generated in the calculation of CBF due to the measurement errors of CBV and MTT in the PIX method. We also noted that the deconvolution method seemed to skew the CBF values. Further, the poor reliability of the AIF obtained from the internal carotid arteries already manifesting the lesional changes of the type seen in most patients with moyamoya disease hampers the accurate assessment of CBF by the AIF method.
Arterial spin-labeling (ASL) might have promise as an alternative method for evaluating CBF quantitatively. It should be noted, however, that ASL methods such as flow-sensitive alternating inversion recovery (FAIR) can also be affected by the delay of the labeled spin passage (Calamante et al, 2001; Kim, 1995). Due to the specific circulation pattern of moyamoya disease, the transit time is prolonged and the FAIR technique is unable to differentiate between very long transit times and no flow (CBF = 0, no signal in the arterial spin labeling image).
As discussed above, our present analysis might be strongly influenced by the specific circulation pattern of moyamoya disease. To examine whether the same approach can be applied in other types of cerebrovascular disorder, we need to perform further comparative studies between PWI and PET with expanded populations of study candidates. Further research on the moyamoya patients from the present study is now underway to determine the correlations between the clinical features of the disease and the MTT delay measured in our current results. We are also currently conducting a prospective observation of both surgically and medically treated patients based on PWI data. These further analyses will better clarify the utility and limitations of PWI for clinical application.
In conclusion, PWI measurement provided sufficient quantitative evaluations of CBV and MTT in moyamoya patients. The measurement of CBF had limitations, however. Among the various parameters investigated, our results suggested that the duration of MTT delay might be used to detect the presence and degree of misery perfusion.