
Abstract
The objective of this study was to determine whether hemodilution could normalize the mean transit times of red blood cells (Tr) and plasma (Tp) through cerebral microvessels in a partially ischemic brain. Wistar-Kyoto (WKY) rats, aged 30–40 weeks, were divided randomly into three groups. The first group was the nonocclusion, nonhemodilution (NN) normal control group. The second group was the occlusion, nonhemodilution (ON) group, in which animals were treated with bilateral carotid artery ligation. The third group was the occlusion–hemodilution (OH) group, in which animals were treated with bilateral common carotid artery ligation and, then, isovolemic hemodilution by replacing blood with the same volume of 3% modified fluid gelatin. Local cerebral blood flow (lCBF) and microvascular volumes of red blood cells (Vr) and plasma (Vp) in 14 brain structures were measured using 14C-iodoantipyrine, iron-55-labeled red blood cells, and 14C-inulin, respectively. The amount of oxygen delivered to local brain structures (OD), cerebral microvascular blood volume (Vb), mean transit time of blood (Tb), Tr, and Tp through cerebral microvessels were calculated from the data. Two hours after carotid artery ligation, lCBF decreased by ∼38% in forebrain structures, 22% in rostral hindbrain areas, and 8% in the caudal hindbrain (29% for all 14 structures). The decreases in ODs were parallel with those of lCBFs, at 33, 17, and 2% in the three regions, respectively (24% for all structures). In contrast, Vb increased by 68, 37, and 16% in the three regions, respectively (48% for all structures). Tr and Tp were markedly prolonged (180% for Tr and 154% for Tp) in the forebrain regions, moderately (91% for Tr and 73% for Tp) in the rostral hindbrain, and mildly (60% for Tr and 13% for Tp) in the caudal hindbrain, with a mean increase of 136% for Tr and 111% for Tp in all structures. When data in the OH and NN groups were compared, lCBF values tended to be slightly higher and Vb values were significantly higher (p < 0.05) in the OH group. ODs in the eight forebrain structures were all significantly less (p < 0.05) in the OH group than the NN group. Tr and Tp values in the forebrain were similar between the OH and the NN groups. In conclusion, occlusion of the bilateral common carotid arteries in WKY rats causes partial forebrain ischemia, in which both Tr and Tp are prolonged. These prolongations of Tr and Tp can be normalized by isovolemic hemodilution. However, the ischemic forebrain remains hypoxic after hemodilution.
Carotid artery occlusion is frequently encountered in clinical patients with various etiologies, such as atherosclerosis of the carotid artery, subarachnoid hemorrhage-induced arterial vasospasm, and transient or permanent arterial occlusion for treating certain neurosurgical diseases. Changes in cerebral blood flow (CBF), brain metabolites, and histology after carotid artery ligation have been studied extensively in animals. In normotensive Wistar rats after occlusion of the bilateral carotid arteries, there is a modest decrease in CBF (Eklof and Siesjo, 1973; Fujishima et al., 1981), an elevation of the lactate level in the brain (Fujishima et al., 1975), and multiple small cerebral infractions (Ogata et al., 1976). However, changes in plasma and red blood cell (RBC) volumes in cerebral microvessels after carotid occlusion have not yet been reported. These plasma and RBC volumes can be used to clarify the question whether carotid occlusion will lead to a decrease in perfused cerebral microvessels (Lin et al., 1990a; Tajima et al., 1992; Theilen et al., 1993). Moreover, these data together with the data on local CBF (lCBF) can be used to calculate the mean transit times of RBCs (Tr), plasma (Tp), and blood (Tb) through cerebral microvessels (Tajima et al., 1992; Wei et al., 1993). Therefore, the flow patterns of RBCs and plasma in cerebral microvessels after carotid occlusion can be clarified.
Hemodilution is frequently used for treating patients with stroke, but its therapeutic effect is controversial (Mast and Marx, 1991; Goslinga et al., 1992). Hemodilution causes an increase in lCBF in normal human subjects (Hino et al., 1992) and animals (Hudak et al., 1989; Waschke et al, 1994) and in ischemic stroke patients (Vorstrup et al., 1989) and dogs with focal cerebral ischemia (Tu et al., 1988). Hemodilution also induces increases in flow velocities of RBCs and plasma in cerebral arterioles of normal mice (Rosenblum, 1970). However, effects of hemodilution on lCBF, plasma volume in cerebral microvessels (Vp), RBC volume in cerebral microvessels (Vr), Tr, Tp, and Tb in carotid-occluded rats have not been reported. Therefore, we hypothesized that (a) lCBF is restored to normal in the occlusion–hemodilution (OH) group by hemodilution; (b) hemodilution in this rat occlusion model changes the Tp, the Tr, and the mean velocities of plasma and RBC flows back to relatively normal values. Since the extraction fractions of nutrients and oxygen and the clearance of waste products in the brain are related to the lCBF, Tr, and Tp, knowing these parameters will lead to a better understanding of the effect of hemodilution on material exchanges in cerebral microvessels of carotid-occluded animals.
The present study was designed to elucidate the above hypotheses. lCBF, Vr, and Vp were measured with 4-iodo-[N-methyl-14C]antipyrine (IAP) (Tajima et al., 1992), iron-55-labeled RBCs (Lin et al., 1990a), and 14C-inulin, respectively. From these data, blood in cerebral microvessels (Vb), Tb, Tr, and Tp were calculated for animals in normal control, carotid-occluded, and OH groups.
METHODS
Animal grouping
Fifty-four animals were randomly divided into three groups. The first group was the nonocclusion, nonhemodilution (NN) normal control group. The second group was the occlusion, nonhemodilution (ON) group, in which animals were treated with bilateral carotid artery ligation. The third group was the OH group, in which animals were treated with bilateral common carotid artery ligation and, then, isovolemic hemodilution.
Animal preparation and carotid artery ligation
Male Wistar-Kyoto (WKY) rats averaging 35.5 weeks (30–40 weeks) of age and weighing 360–425 g were used. The animals were anesthetized using a gas mixture of halothane and oxygen. Cannulas were placed in the femoral arteries bilaterally for the recording of arterial pressure and withdrawal of blood and in a femoral vein for injection of the radiotracers and a 3% modified fluid gelatin (MFC). The surgical wounds were infiltrated with lidocaine hydrochloride jelly and closed with sutures. For carotid artery ligation animals, a midline incision was made in the neck, and common carotid arteries were identified and ligated with silk sutures. The neck wound was also infiltrated with lidocaine and closed. A plaster cast was fitted below the midthorax of each rat to immobilize the hindlimbs and protect the catheters. Anesthesia was discontinued, and each rat was allowed 1.5 h to recover before beginning the hemodynamic experiment. Body temperature was continuously monitored and maintained at ∼37°C using a heat lamp.
Isovolemic hemodilution
The aim of hemodilution was to lower the systemic hematocrit from ∼50 to 30–35%. This was achieved by replacing 10–12 ml of whole blood with the same amount of 3% MFC (Roger Bellon, France) in 2 min.
The arterial blood pressure of each rat was continuously monitored and recorded (RS3200; Gould) throughout the experimental procedure, and the following physiological variables were determined 15–20 min after hemodilution by measuring arterial blood gases (ABL3; Radiometer Copenhagen), plasma glucose level (Dri-Chem 100; Fuji Film), systemic hemoglobin (ABL3; Radiometer Copenhagen), and hematocrit levels. Immediately after completion of the measurements of physiological variables, the animals were subjected to the following cerebral microvascular hemodynamic studies.
Measurement of lCBF
lCBF was measured in the three groups of WKY rats using the IAP technique developed by Sakurada et al. (Tajima et al., 1992). IAP was purchased from Amerson Corp. For each rat, approximately 12 μCi of IAP in 1 ml of normal saline was infused at a constant rate via the femoral venous catheter for a period of 30 s, during which arterial blood samples were collected every 5 s for assay of the arterial concentration of IAP. The animals were decapitated at 30 s, and their brains quickly removed, then immersed in isopentane chilled to −40°C. The brains were placed on a dissecting plate kept in a freezer with the temperature at −10°C.
Blood samples were centrifuged and plasma 14C radioactivity Pi was determined by β counting (Bechman LS6000TA). Referring to a standard anatomical atlas (Paxinos and Watson, 1982), brain tissue samples of bilateral hemispheres were dissected from the following 14 areas. Eight areas were in the forebrain, including the frontal cortex (FC), the sensorimotor cortex (SMC), the temporal cortex (TC), the caudate-putamen (CP), the occipital cortex (OC), the thalamus (THA), the hypothalamus (HYP), and the hippocampus (HIP); three areas were in the rostral hindbrain, including the superior colliculus (SC), the inferior colliculus (IC), and the ventral midbrain (MID); and the other three areas were in the caudal hindbrain, including the pons (PON), the medulla oblongata (MED), and the cerebellar vermis (VER). The brain tissue samples were weighed, dissolved in 0.5 ml of 1.0 N sodium hydroxide, vortexed, hydrolyzed for about 15 h at 45°C in a shaking water bath, and neutralized with 1.0 N hydrochloric acid before adding scintillant. The 14C radioactivity of each brain tissue sample was determined by β counting. lCBF was calculated from the brain tissue and the plasma radioactivity data using the Kety-Sokoloff equations.
Measurement of Vr
The Vr was measured in each group of animals (six rats in each group) by the use of iron-55-labeled RBCs (55Fe-RBCs). The method of labeling RBCs with 55Fe has been described by Lin et al. (1990a). In brief, 55Fe-ferrous chloride solution (3 μCi; Amersham) diluted with 6 ml of saline was injected intraperitoneally after opening the peritoneal cavity of each donor rat. Seven days later, the blood of the donor rat that contained 55Fe-RBCs was harvested. The ratio of the radioactivity between plasma and RBCs of the donor rat blood was <1%. The blood, 1–1.4 ml, was injected intravenously into each WKY rat. One minute after injection of the radioactive blood, a small blood sample (15 μl) was collected and the 55Fe-RBC radioactivity (Rr) was derived from the 55Fe radioactivity data on the blood (Rb) and plasma (Rp), the systemic hematocrit (sHct), and the equation Rr = Rb − Rp(1 − sHct)]/sHct. The Vr was calculated from the Rr and the equation Vr = Ar/Rr, where Ar is the 55Fe activity of brain tissue.
Measurement of Vp
The Vp was also measured in each group of animals (six rats in each group) with 14C-inulin. For each animal, 15 μCi of inulin (Amersham) in 1 ml of saline was injected intravenously. One minute after the injection, a small blood sample (20 μl) was collected and the Pi was measured by β counting. At the end of blood sampling, the rats were decapitated and their brains removed and frozen. The radioactivities of the 14 brain structures (Ai) were measured by β counting. The Vp was derived from the Ai and Pi using the equation Vp = Ai/Pi (Ohno et al., 1978; Lucchesi and Gosselin, 1990).
The Vb was calculated as follows: Vb = Vr + Vp. The hematocrit in cerebral microvessels (mHct) was determined by mHct = Vr/Vb. The Tb was determined by Tb = Vb/lCBF. The Tr and Tp through cerebral microvessels were calculated by Tr = Tb × (mHct/sHct) and Tp = Tb × [(1 − mHct)/(1 − sHct)], respectively (Bereczki et al., 1993). The amount of oxygen delivered to local brain structures (OD) was calculated by OD = lCBF × OC, in which OC is the arterial oxygen content.
Statistical analysis
All physiological parameters are presented as mean ± SD. Differences in physiological variables among the three groups were assessed with the unpaired Student t test.
Data on lCBF, Vr, and Vp are presented as mean ± SD. Differences among the NN, ON, and OH groups for lCBF, Vr, and Vp were assessed by analysis of variance with repeated measures for the 14 brain structures (MANOVA) (Wei et al., 1993). When the MANOVA assessments showed significant differences between groups, the unpaired Student t test was used to highlight the brain structures in which the differences in data between groups were large (Wei et al., 1993).
Vb, OD, Tb, Tp, and Tr were derived values from Vr, Vp, and lCBF and, therefore, are reported as estimated mean ± standard error of the estimate (Wei et al. 1993). The unpaired Student t test was again used to highlight the areas in which the differences in Vb, OD, Tb, Tp, and Tr between groups were large.
When p ≤ 0.05, the difference between groups was assumed to be significant or large.
RESULTS
Physiological data
One and a half hours after bilateral common carotid occlusion, the awake rats in the ON group displayed different physiological parameters compared to those in the NN group. Mean arterial blood pressure, heart rate, sHct, and hemoglobin concentration were significantly higher (p < 0.05) in the ON than the NN group (Table 1). In contrast, the arterial Paco2 level was lower (p < 0.05) in the ON than the NN group. The arterial pH and plasma glucose were similar in the ON and NN groups.
Physiological parameters of the three groups of WKY rats
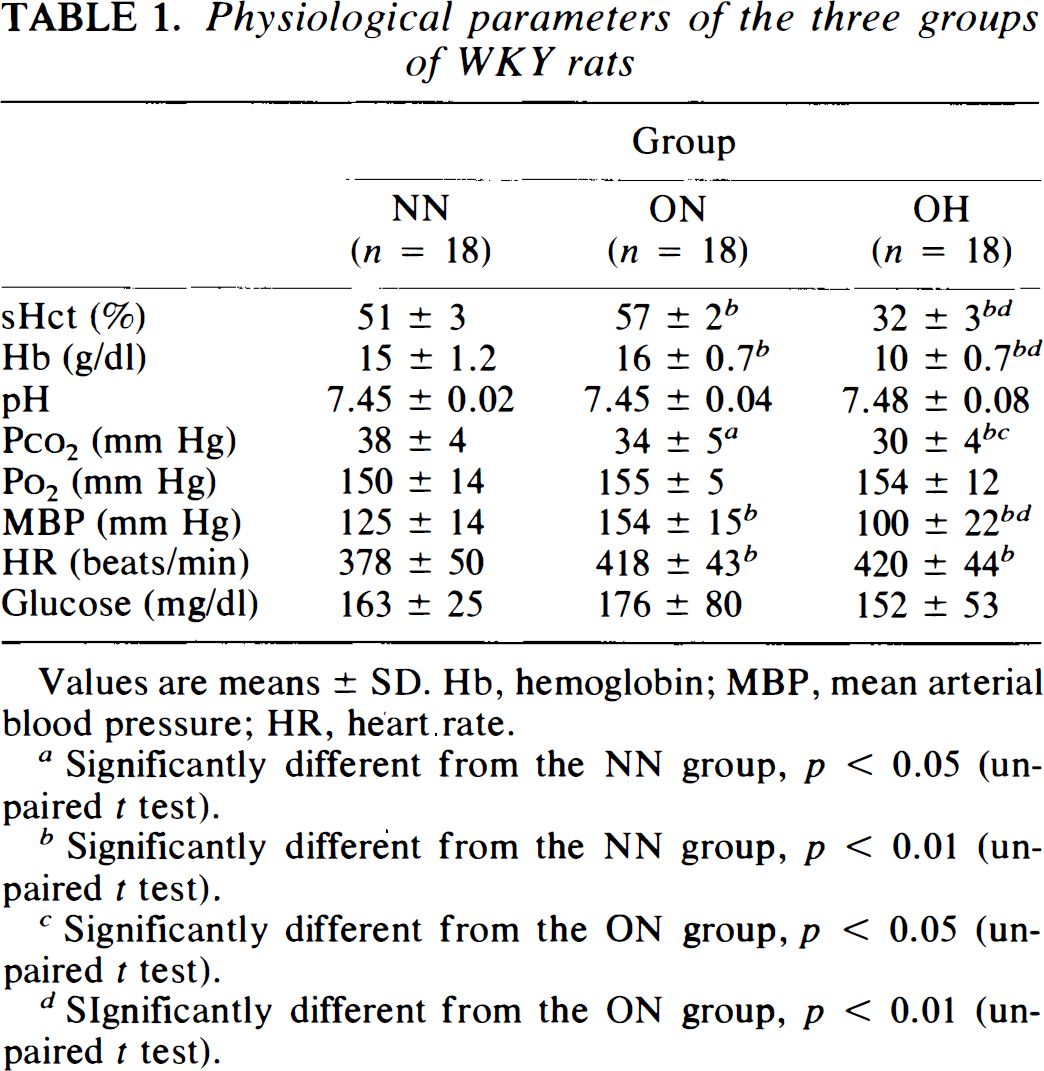
Values are means ± SD. Hb, hemoglobin; MBP, mean arterial blood pressure; HR, heart rate.
Significantly different from the NN group, p < 0.05 (unpaired t test).
Significantly different from the NN group, p < 0.01 (unpaired t test).
Significantly different from the ON group, p < 0.05 (unpaired t test).
Significantly different from the ON group, p < 0.01 (unpaired t test).
Arterial hematocrit and hemoglobin of the OH group were lowered by isovolemic hemodilution to 32 ± 3% and 10 ± 0.7 g/dl, respectively (Table 1). The hemodilution also caused significant decreases in mean blood pressure (100 ± 22 mm Hg) and arterial Paco2 (30 ± 4 mm Hg). Other physiological data (pH, Po2, and plasma glucose) were not altered after hemodilution (Table 1).
lCBF
For animals in the NN group, lCBF values ranged from 59 ± 15 (mean ± SD) ml 100 g−1 min−1 in the MED to 142 ± 52 ml 100 g−1 min−1 in the SMC (Fig. 1). Analyzed by MANOVA, differences in lCBF values between the NN and the ON groups were shown to be very significant (p < 0.01), namely, occlusion of the carotid arteries resulted in a general decrease in lCBF's in all 14 brain structures compared to those in the NN group (Fig. 1).
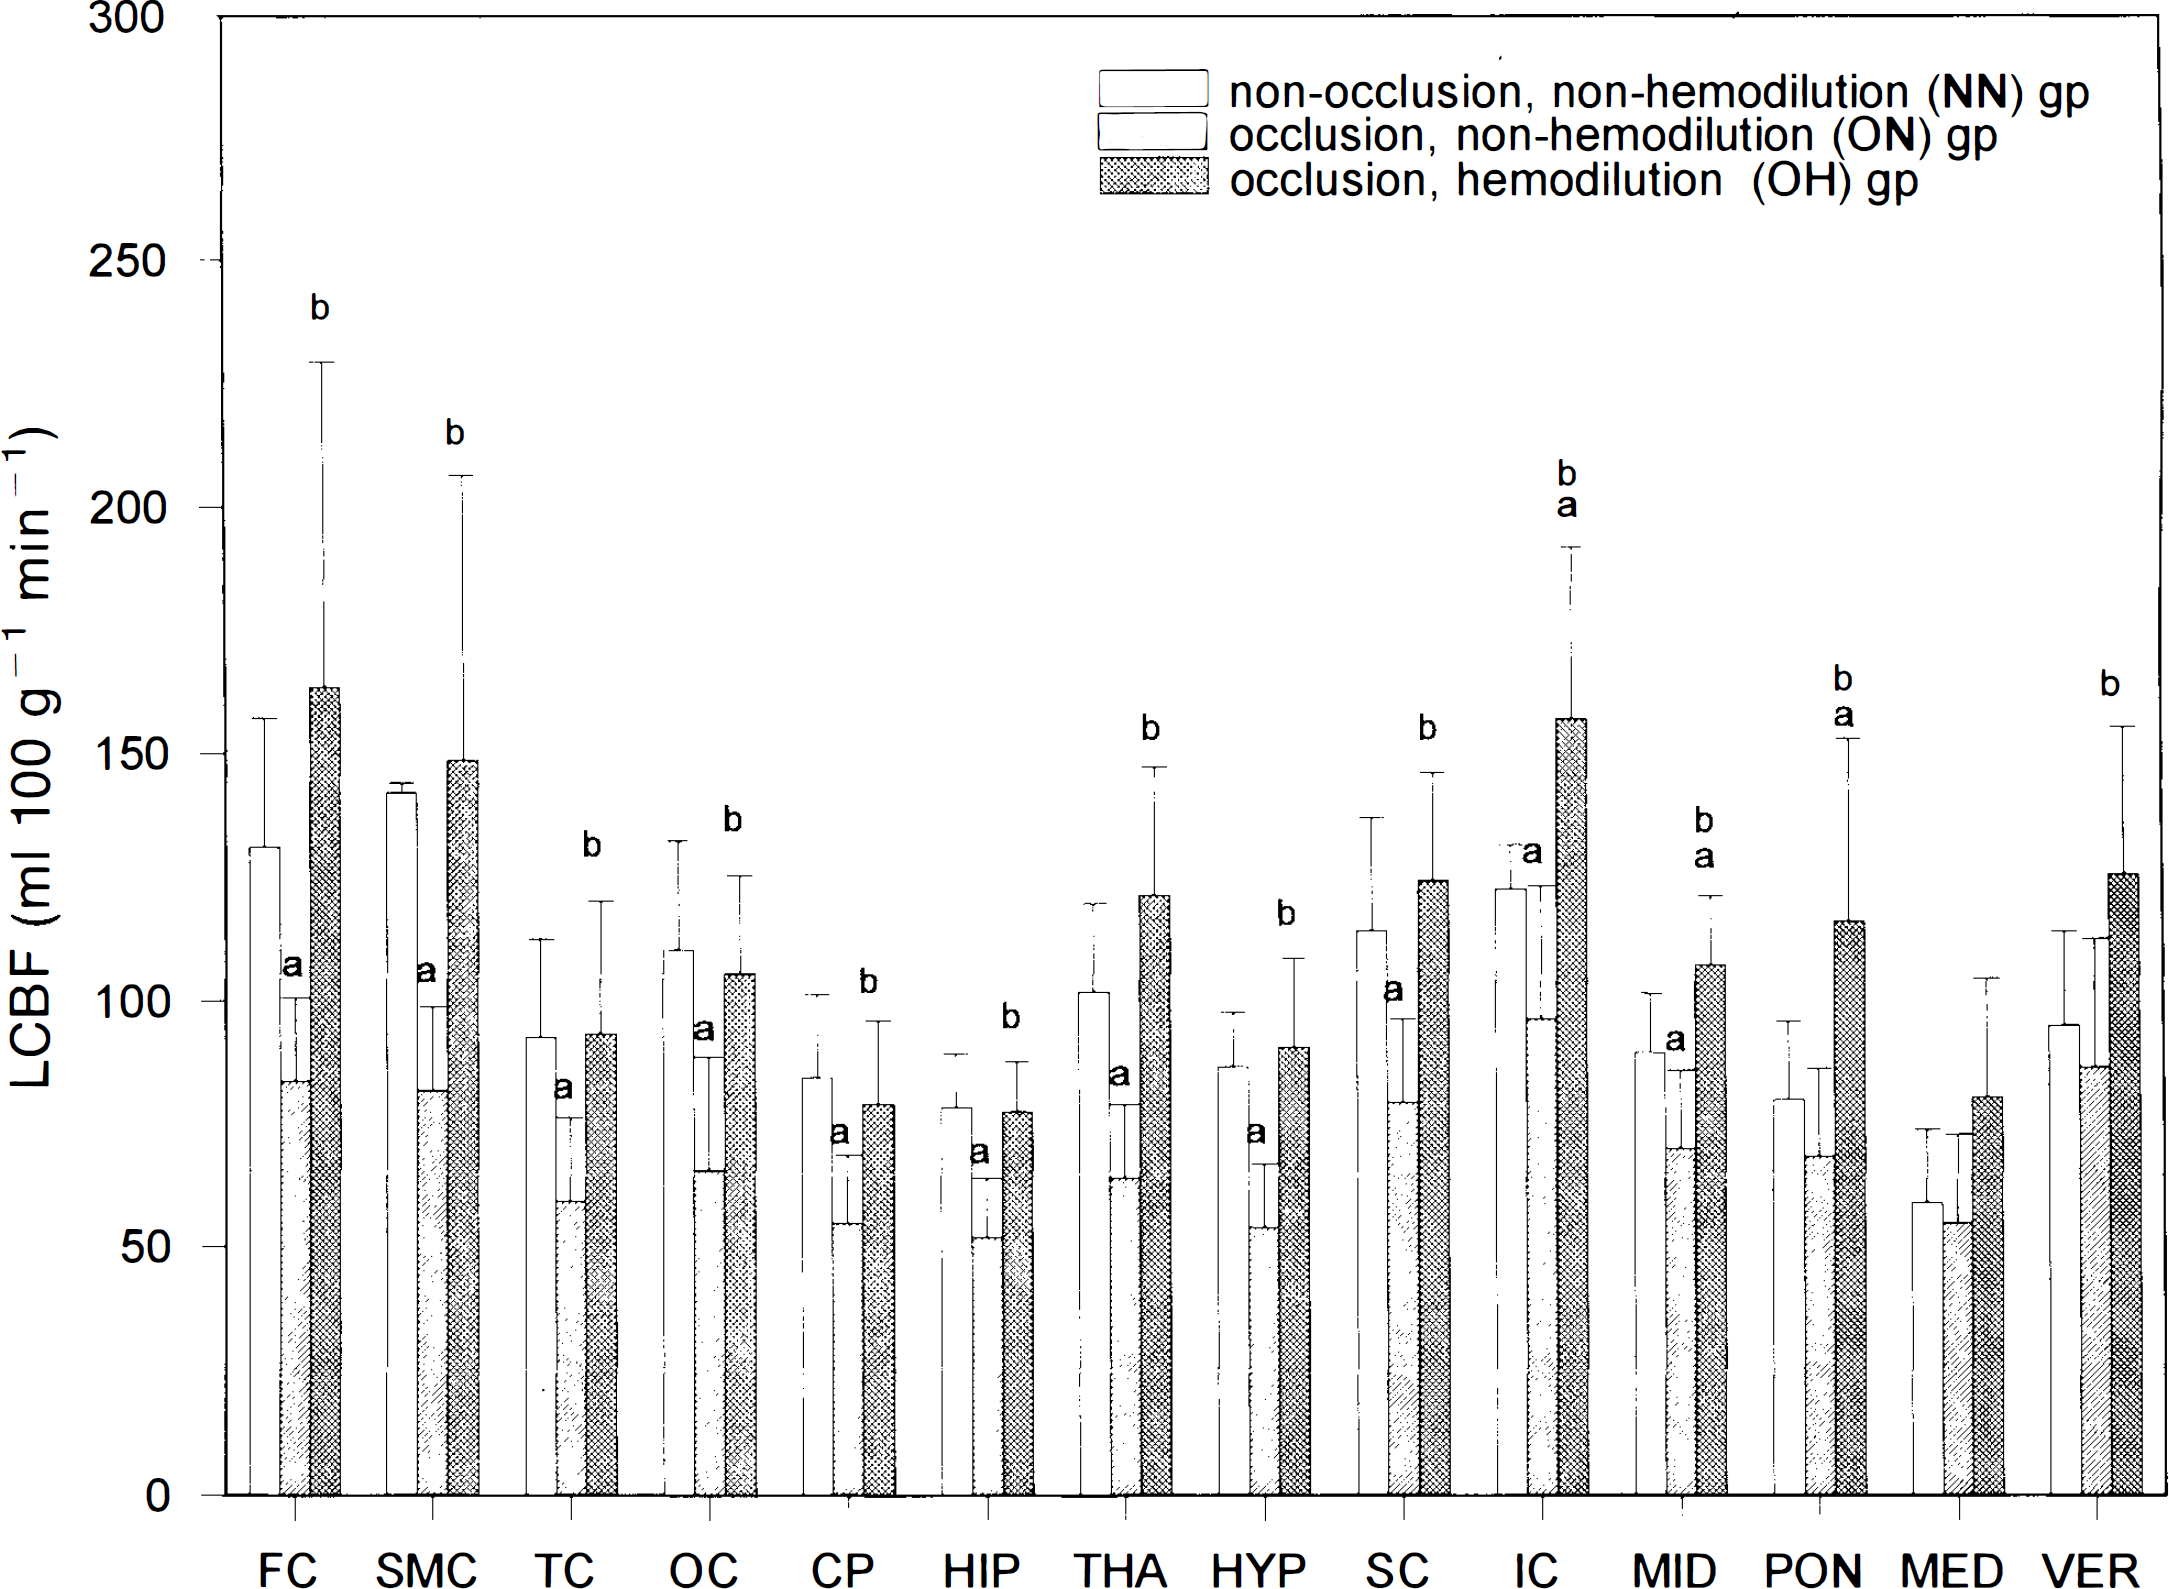
lCBF (mean ± SD) in 14 brain areas in the three groups of WKY rats. (a) p < 0.05 vs. NN group; (b) p < 0.05 vs. ON group. Carotid occlusion resulted in significant decreases in lCBF's in the forebrain and rostral structures, which were totally reversed by hemodilution.
Further assessed by uncorrected t test, differences in lCBF values for each brain structure between the NN and the ON groups were found to be large in all eight forebrain and three rostral hindbrain structures (Fig. 1). Among these 11 brain structures, the decreases in lCBF values after carotid occlusion ranged from 42% in the SMC to 22% in the SC and IC.
lCBF values in 14 brain structures in the OH group were generally higher than those in the ON group (p < 0.01 by MANOVA; Fig. 1). Among the 14 areas, 13 (except the MED) were significantly higher in the OH group than the ON group (Fig. 1). When data for the OH and NN groups were compared, lCBF values were similar in the eight forebrain areas as well as the three hindbrain structures (except the IC, MID, and PON; Fig. 1).
Vr and Vp
In the NN group, Vr values were smallest in the PON (3.3 μl/g) and largest (6.6 μl/g) in the superior colliculus (Table 2). In the ON group, Vr's ranged from 6.8 to 16.3 μl/g and were generally higher than those in the NN group (p < 0.01 by MANOVA). Differences in Vr's between the ON and the NN groups were large in six of the eight forebrain areas and two of the six hindbrain structures (Table 2). In the OH group, Vr's varied from 2.6 to 4.6 μl/g and were generally much lower than those in the ON group (p < 0.01 by MANOVA; Table 2). Differences in Vr's in the OH and ON groups were large in all 14 brain areas (Table 2). When data for the OH and NN groups were compared, Vr's were similar in five of the eight forebrain areas, but different in four of the six hindbrain structures (Table 2).
Vr, Vp, and Tb in 14 brain areas in the three groups of WKY rats
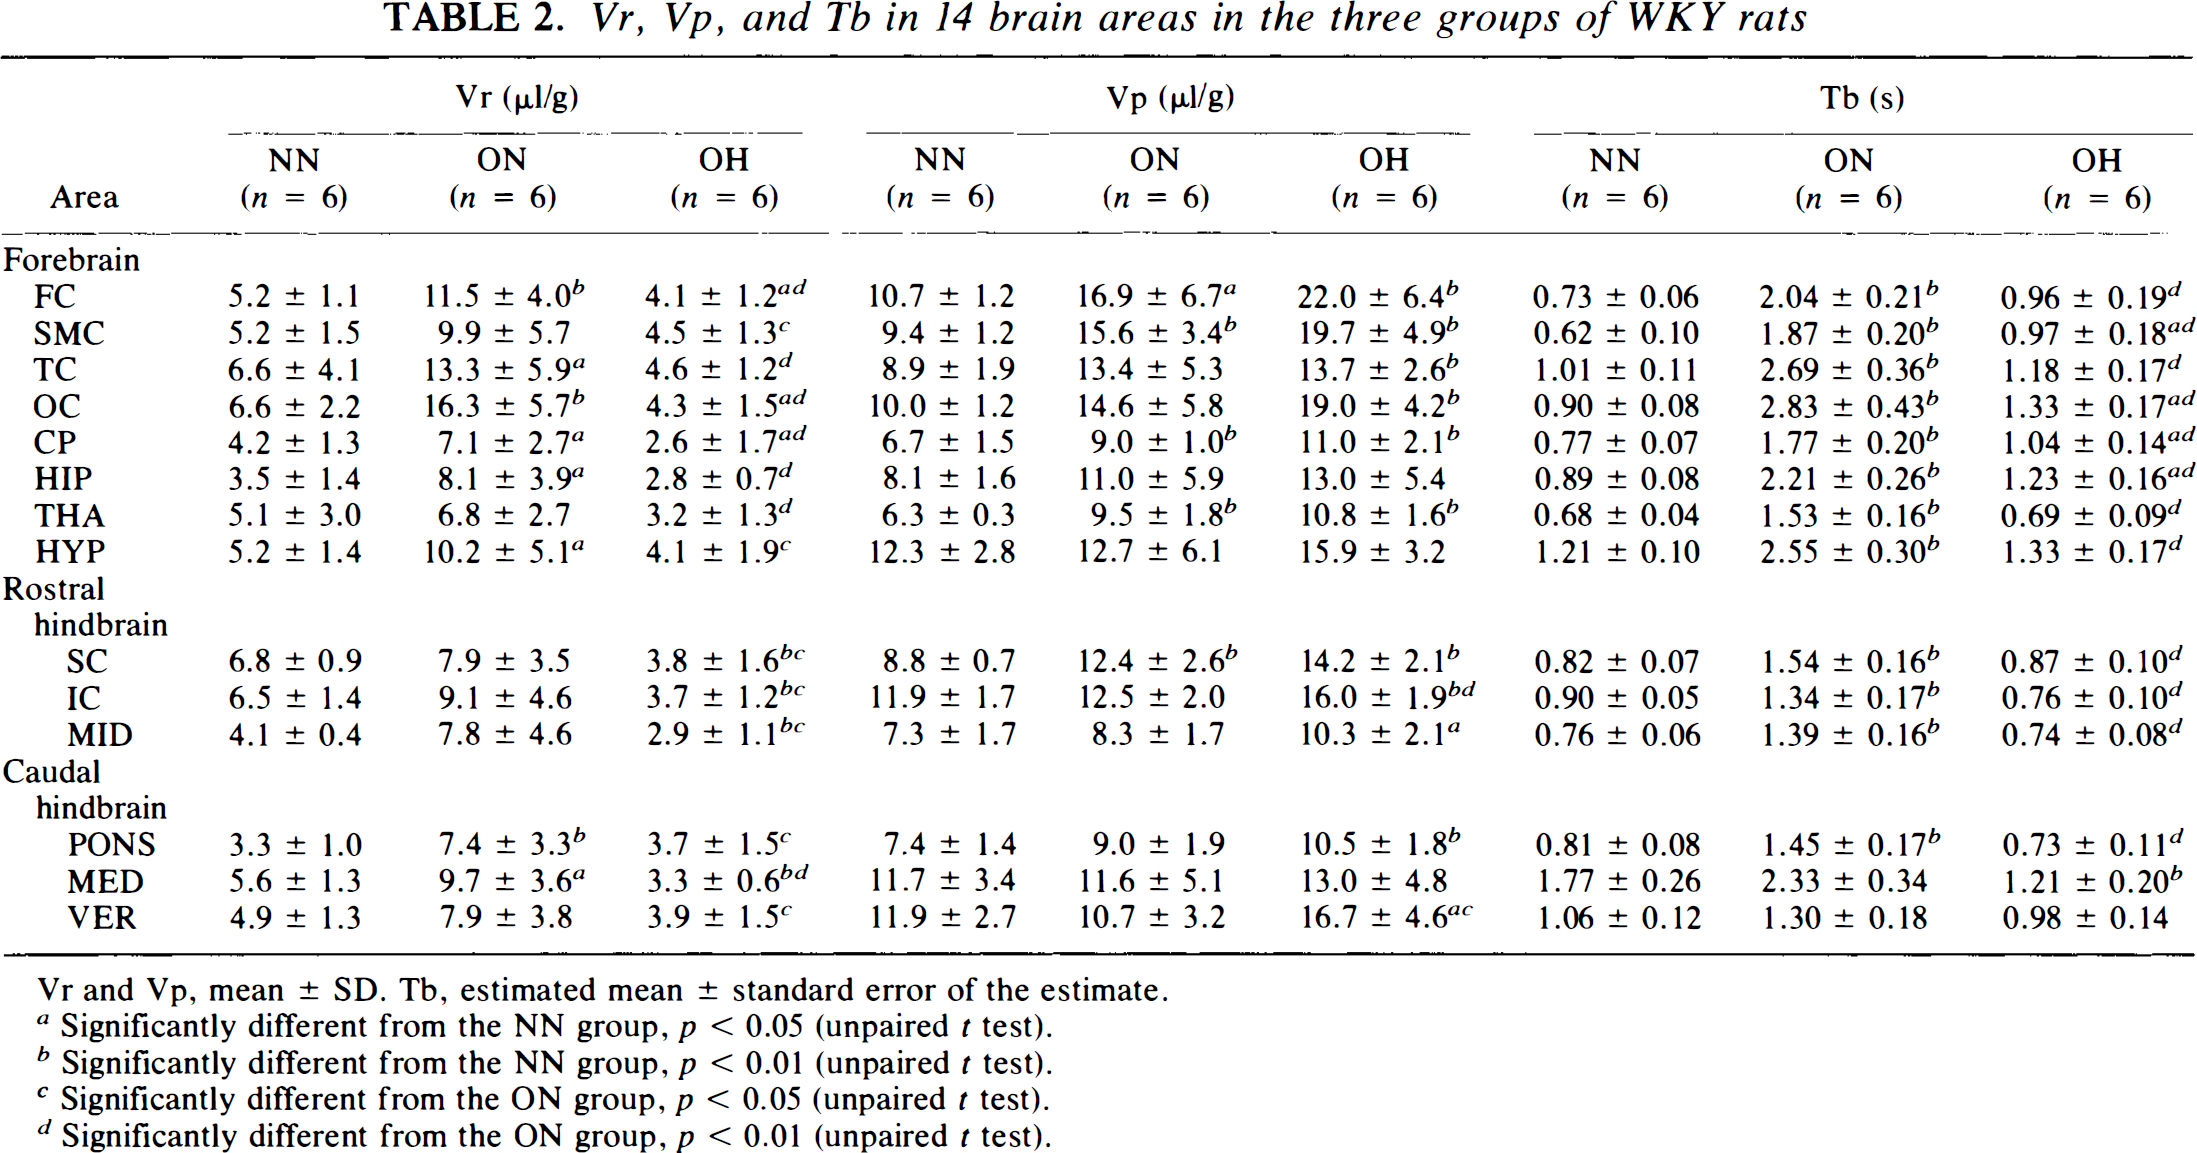
Vr and Vp, mean ± SD. Tb, estimated mean ± standard error of the estimate.
Significantly different from the NN group, p < 0.05 (unpaired t test).
Significantly different from the NN group, p < 0.01 (unpaired t test).
Significantly different from the ON group, p < 0.05 (unpaired t test).
Significantly different from the ON group, p < 0.01 (unpaired t test).
In the NN group, Vp values were smallest in the THA (6.3 ± 0.3 μl/g) and largest in the hypothalamus (12.3 ± 2.8 μl/g; Table 2). Carotid occlusion resulted in general increases in Vp's of the eight forebrain structures. Among them, the increases were large in four areas, the FC, SMC, CP, and THA (Table 2). Vp's of the hindbrain structures were similar between the NN and the ON groups (Table 2).
Hemodilution performed on the carotid-occluded animals resulted in general increases in Vp (p < 0.05 by MANOVA between the ON and the OH groups; Table 2). However, these increases were large in only 2 of the 14 structures (the IC and VER) when compared using the uncorrected t test (Table 2). In contrast, 11 of the 14 areas displayed large increases in Vp's when data were compared between the OH and the NN groups (Table 2).
Vb
Vb values were lowest in the PON (10.7 ± 0.7 μl/g) and highest in the IC (18.4 ± 0.9 μl/g) in animals in the NN group (Fig. 2). Carotid occlusion resulted in a general increase in Vb in the 14 areas ranging from 11% in the VER to 86% in the OC, with a mean of 48% (Fig. 2). These increases in Vb were large in 13 of the 14 areas (except the VER) as data were compared between the ON and the NN groups. Vb's of the OH group were generally slightly decreased compared to those of the ON group. Among the 14 areas, decreases in Vb were large in the TC, OC, MID, PON, and MED (Fig. 2). In contrast, Vb's were generally slightly higher in the OH group than in the NN group, and the increases were large in seven of the eight forebrain areas and two of the six hindbrain structures (Fig. 2).
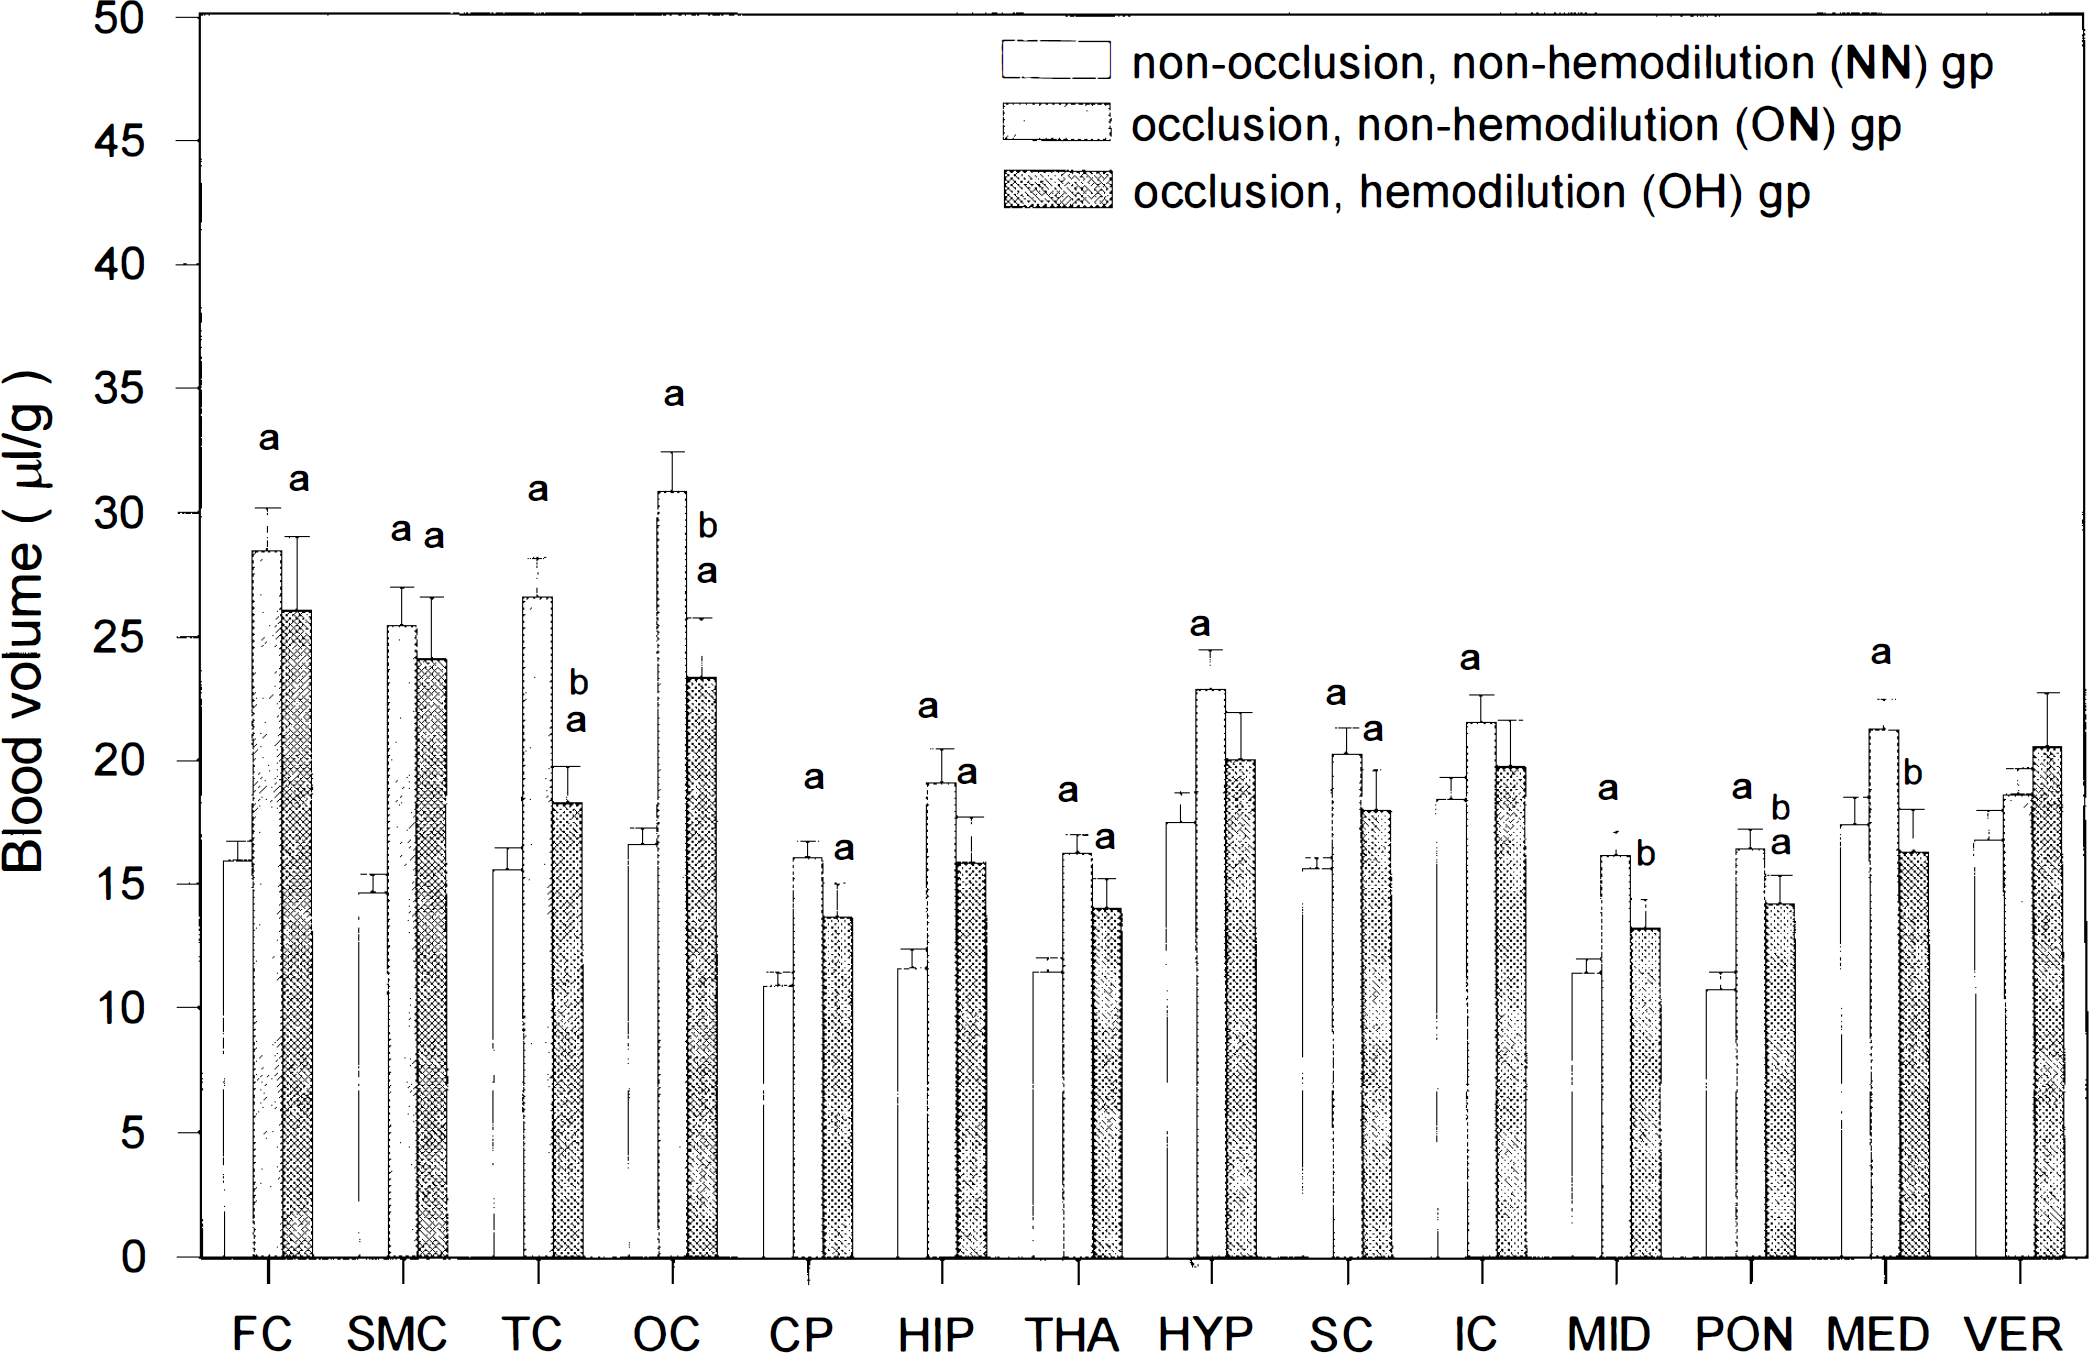
Vb (estimated mean ± standard error of the estimate) in 14 brain structures in the three groups of WKY rats, (a) p < 0.05 vs. NN group; (b) p < 0.05 vs. ON group. Carotid occlusion led to a general increase in Vb in the fore- and hindbrain structures, which was partially reversed by hemodilution.
Tb, Tr, and Tp
Tb was shortest in the SMC (0.62 ± 0.1 s) and longest in the MED (1.77 ± 0.26 s) for rats in the NN group (Table 2). For these animals, Tr's ranged from 0.44 ± 0.09 s in the SMC to 1.15 ± 0.22 s in the MED (Fig. 3). while Tp's were generally much longer than Tr's and varied from 0.78 ± 0.06 s in the THA to 2.5 ± 0.5 s in the MED (Fig. 4). For animals in the ON group, Tb's in 14 areas ranged from 1.3 ± 0.18 s in the VER to 2.83 ± 0.43 s in the OC, with a mean increase of 116% compared with those of the NN animals (Table 2). This increase in Tb was due to the general prolongation of both Tr's (mean increase, crease, 136%) and Tp's (mean increase, 111%) in all 14 areas, especially in both forebrain and rostral hindbrain structures (Figs. 3 and 4). For animals in OH group, Tb's ranged from 0.69 ± 0.09 s in the THA to 1.33 ± 0.17 s in the OC. These values were generally much shorter than those of the ON group (very large differences in 13 of 14 areas; Table 2) but were similar to those of the NN group (Table 2).
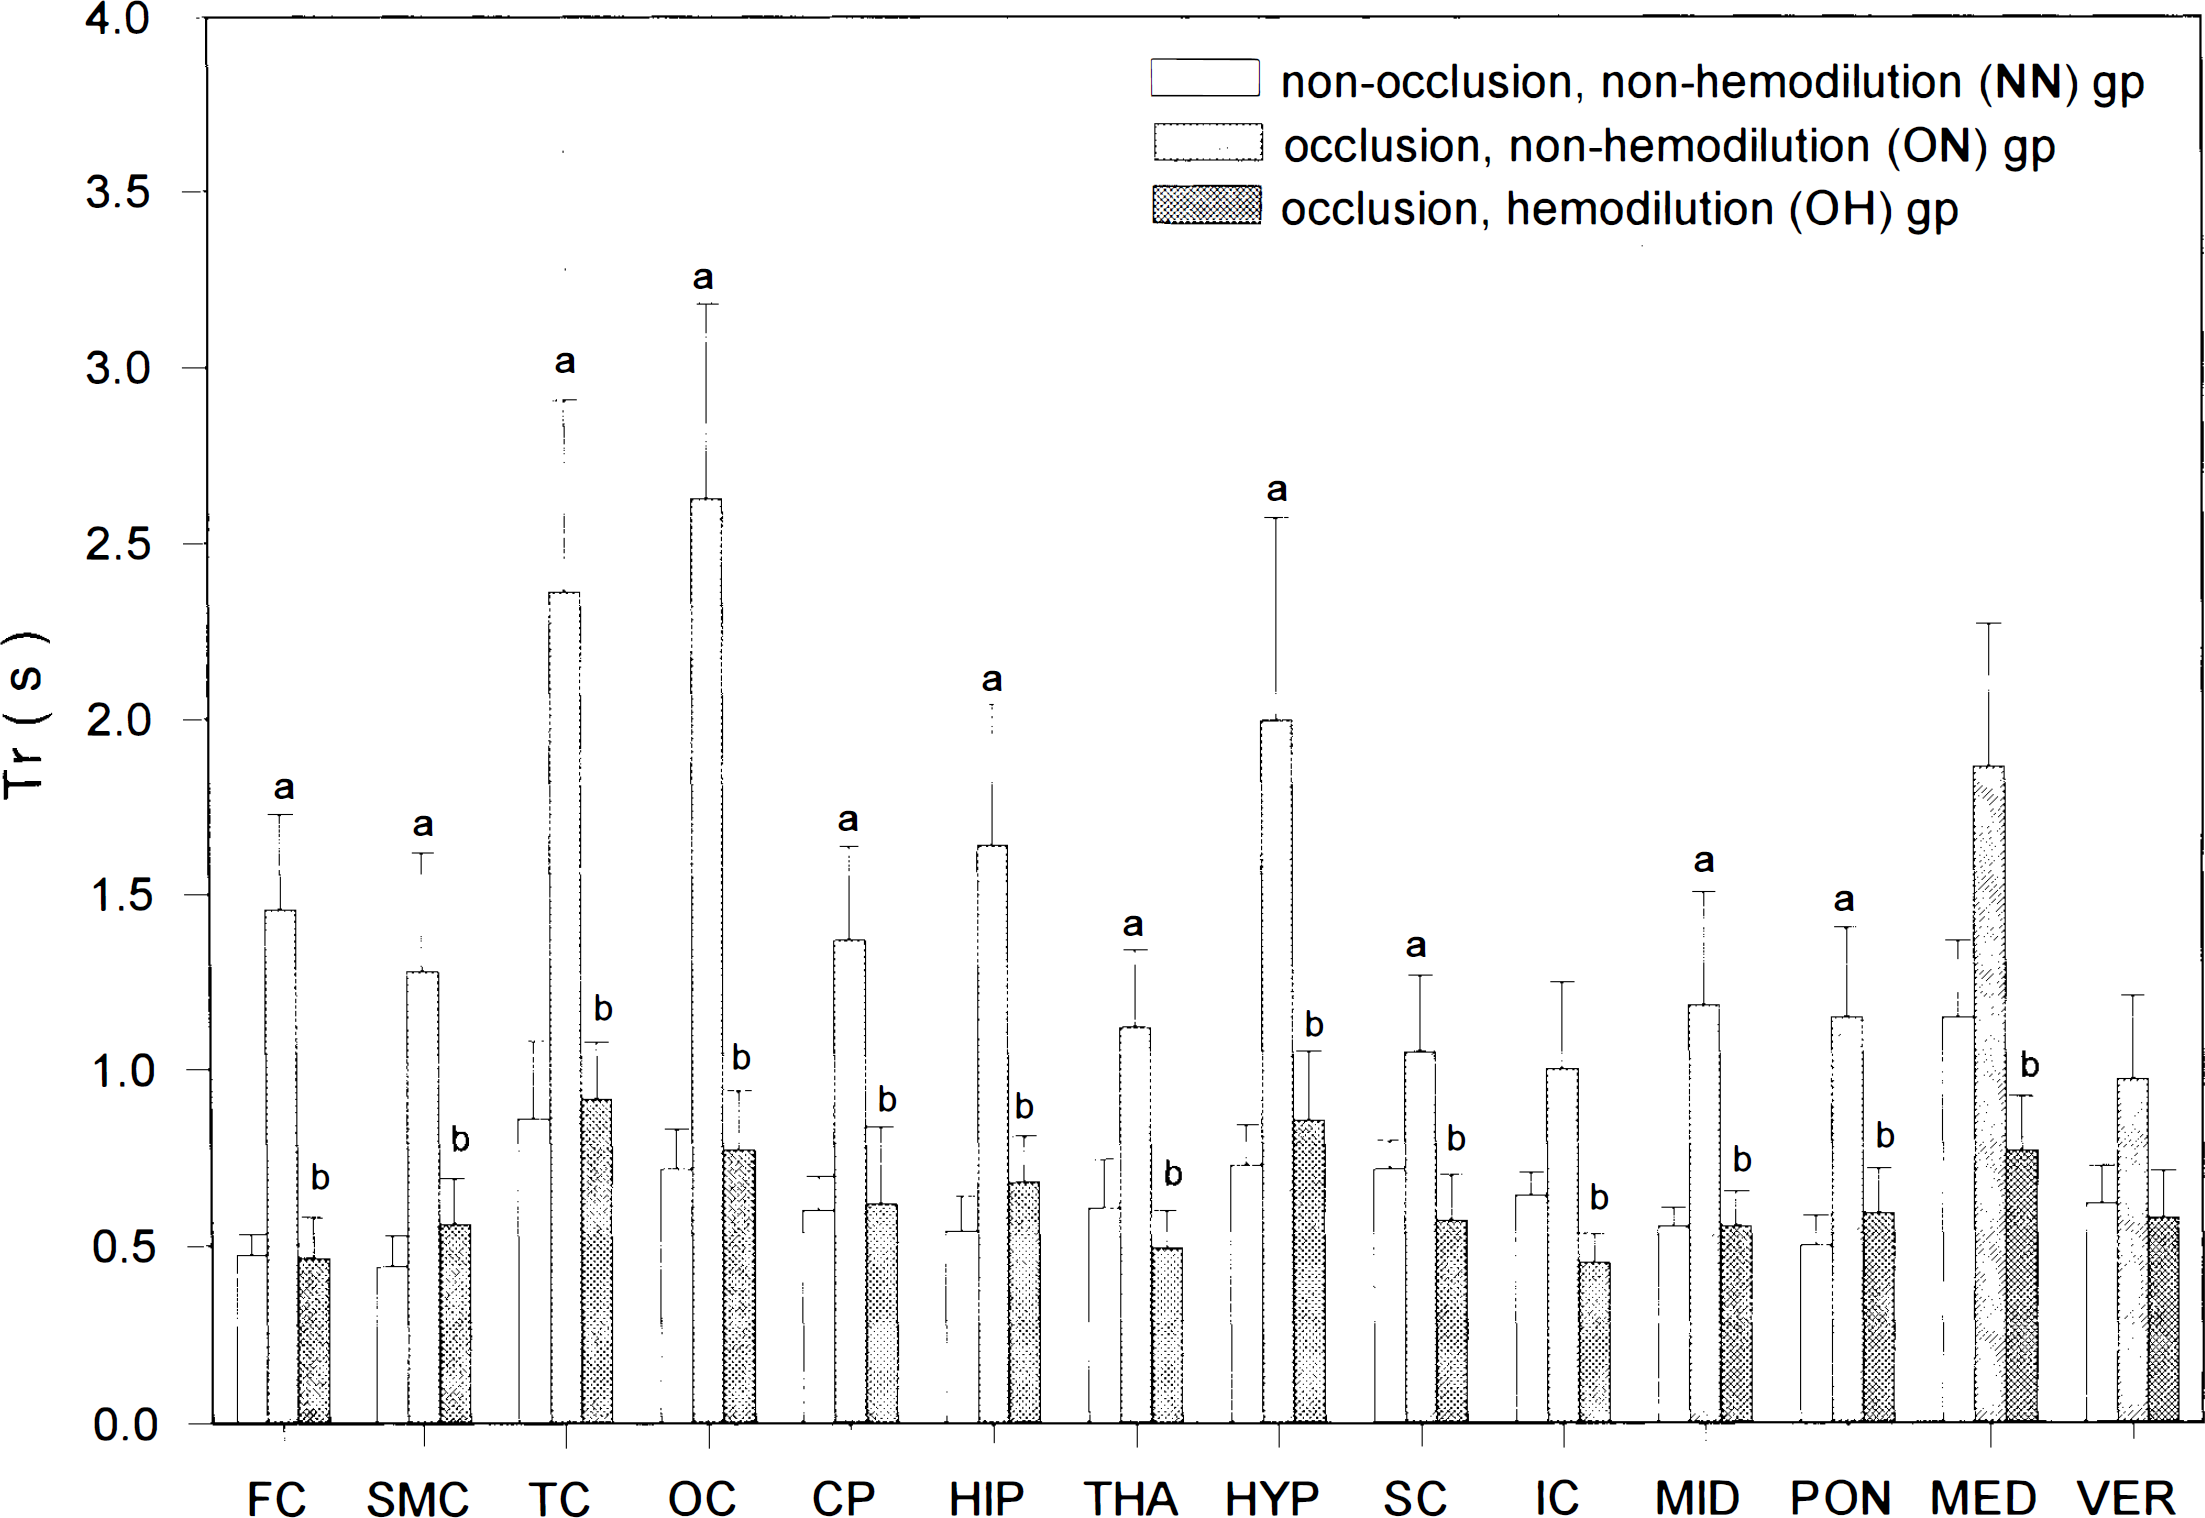
Local Tr (estimated mean ± standard error of the estimate) in the 14 brain areas of the three groups of rats, (a) p < 0.05 vs. NN group; (b)p < 0.05 vs. ON group. Tr's, prolonged in the forebrain and rostral hindbrain areas after carotid occlusion, were totally normalized by hemodilution.
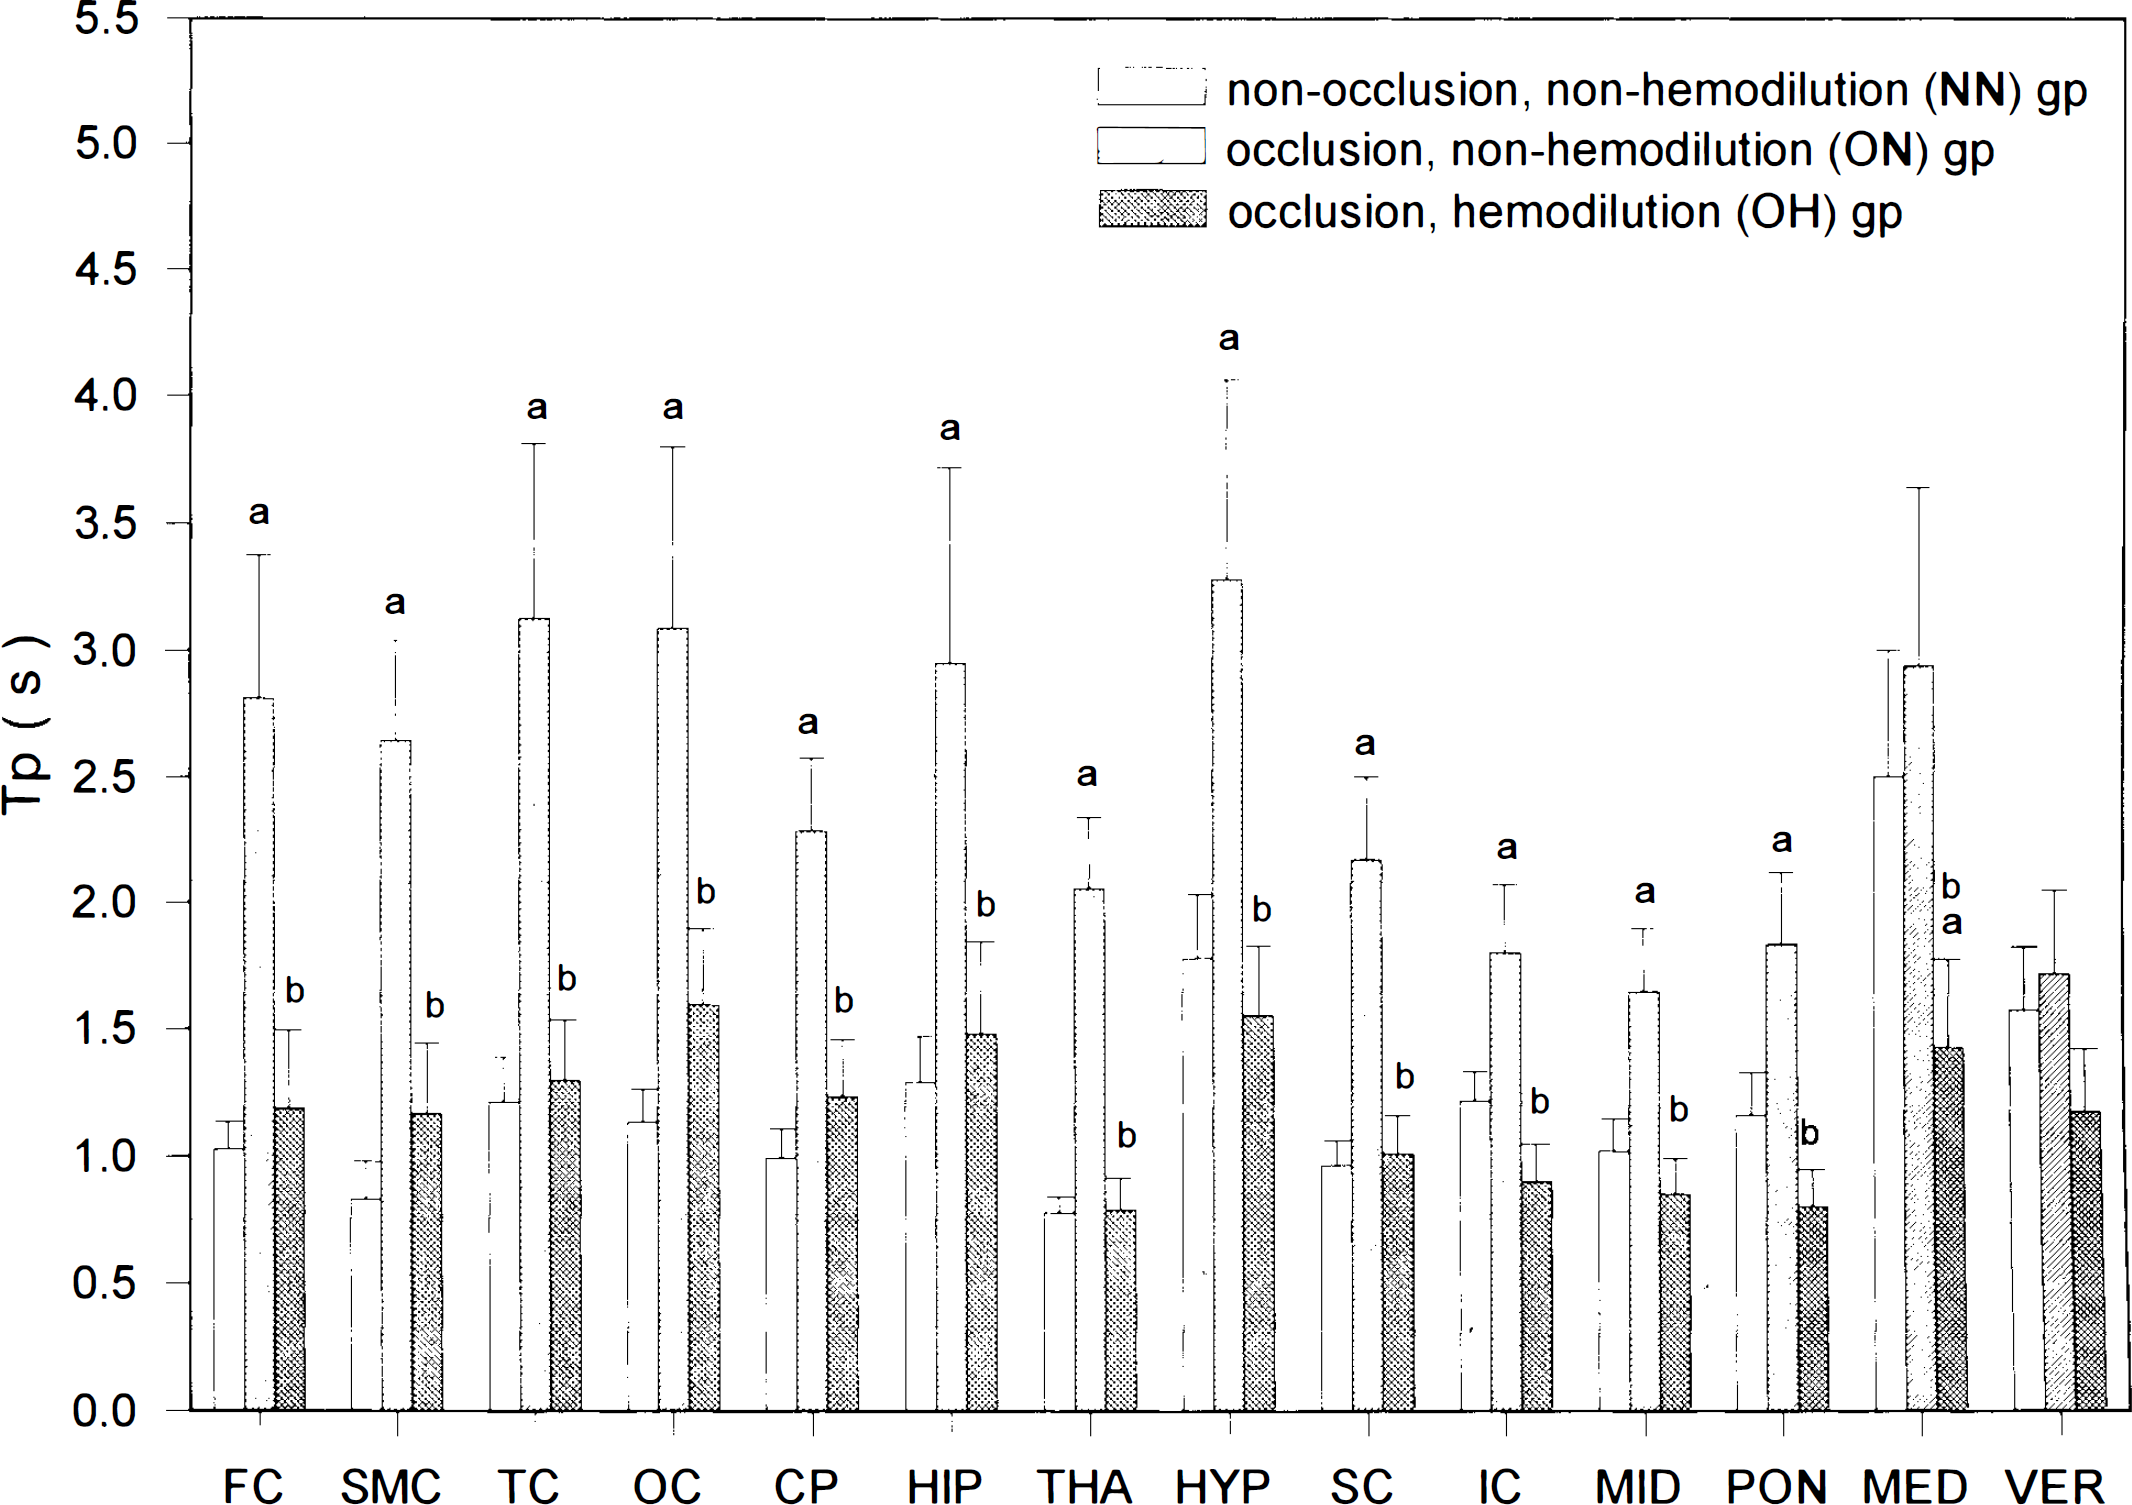
Local Tp (estimated mean ± standard error of the estimate) in the 14 brain areas of the three groups of rats. (a)p < 0.05 vs. NN group; (b) p < 0.05 vs. ON group. Tps were prolonged in the forebrain and rostral hindbrain structures after carotid occlusion and were totally normalized by hemodilution.
The normalized Tb's in the OH group were dependent on the normalization of both Tr's and Tp's of the OH group, which were generally much shorter than those of the ON group and the same as those of the NN group (Figs. 3 and 4).
OD
OD ranged from 12.7 to 30.7 ml 100 g−1 min−1 in the 14 brain areas of the NN group. After carotid ligation, ODs decreased by 33% in the 8 forebrain structures, 17% in the 4 rostral hindbrain areas, and 2% in the 2 caudal hindbrain areas, with a mean decrease of 14% in all 14 brain areas. ODs in the OH group were similar to those in the ON group. When data in the OH and NN groups were compared, ODs were significantly less (p < 0.05; mean decrease, 31%) in the eight forebrain structures in the OH group.
DISCUSSION
The present results reveal that occlusion of the bilateral common carotid arteries induces modest decreases in lCBF's and increases in Vb's in the forebrain. Tb, Tp, and Tr are all markedly prolonged in these cerebral microvessels. These altered microvascular hemodynamics in the forebrain of carotid-occluded rats can be nearly normalized by isovolemic hemodilution.
Occlusion of the bilateral carotid arteries induces a moderate decrease in lCBF in the forebrains of animals and humans (Fujishima et al., 1981). In anesthetized Wistar rats, a 50% reduction of the frontoparietal cortical blood flow was reported (Eklof and Siesjo, 1973). In anesthetized WKY rats, occlusion of the carotid arteries resulted in a reduction in the lCBF of the frontoparietal cortex by 34% (Choki et al., 1977) or 60% (Fujishima et al., 1981). Our data displayed a 42% decrease in lCBF of the SMC (Fig. 1) 2 h after carotid occlusion in awake WKY rats. Although lCBF reduction in the forebrain after carotid ligation was by only ∼34–60%, the lactate concentration in the forebrain was significantly elevated 1 h after carotid occlusion (Fujishima et al., 1975), and multiple small infractions in the forebrain were noted 24 h to 5 days after carotid occlusion in 50% of WKY rats (Ogata et al., 1976). These findings indicate that carotid ligation leads to partial ischemia of the forebrain in WKY rats.
In normal control WKY rats, isovolemic hemodilution, which lowered the sHct to 32%, leads to a general increase in lCBF's of the forebrain and hindbrain structures by 60% (Song et al., 1993). In the canine focal cerebral ischemic model induced by ligation of the ipsilateral carotid artery and middle cerebral artery, isovolemic hemodilution resulted in a mild reversal of the decreased lCBF in the ischemic region (Tu et al., 1988). In the present study isovolemic hemodilution completely reversed lCBF's in the partially ischemic forebrain of WKY rats induced by carotid occlusion (Fig. 1). These findings suggest that the effect of isovolemic hemodilution on the normalization of lCBF in the ischemic brain is more effective in the carotid occlusion model than in the middle cerebral artery ligation model. The latter has a less effective collateral circulation (through cortical arterioles) than the former (through the circle of Willis). Therefore, the normalization effect of hemodilution on the decreased lCBF in ischemic brain depends on the effectiveness of collateral vessels supplying blood to the ischemic brain.
In the present study lCBF in the forebrain decreased by ∼38% (vs. the NN group) in the ON group and was slightly increased, by 5% (vs. NN group), in the OH group. To understand whether the increased lCBF by hemodilution did offer additional oxygen delivered to the ischemic forebrain, the OD was calculated by multiplying arterial oxygen content by lCBF. Our results revealed that OD of the forebrain decreased by 33% (vs. NN group) after carotid ligation and by 31% (vs. NN group) after hemodilution. Therefore, isovolemic hemodilution with a non-oxygen-carrying plasma substitute did not improve the hypoxic status of the forebrain induced by carotid ligation. To overcome the lowered oxygen-carrying capacity of the hemodiluted blood, an oxygen-carrying blood substitute, such as polymerized hemoglobin, can be used for hemodilution. However, whether the hypoxic status of the ischemic forebrain induced by carotid ligation can be normalized by hemodilution with polymerized hemoglobin needs further investigation.
Occlusion of the carotid arteries caused a generalized increase (mean, 48%) in microvascular blood volumes in both ischemic forebrain and nonischemic hindbrain structures (Fig. 2). Since the cerebral capillaries are constantly and totally perfused with blood in normal and incomplete forebrain ischemic conditions (Gobel et al., 1991; Theilen et al., 1993), the increased blood volume in the partially ischemic forebrain induced by carotid ligation indicates that (a) the total capillaries in the ischemic forebrain may remain totally perfused with blood and (b) the small and large parenchymal microvessels are dilated in the ischemic forebrain structures. The increased blood volume in the nonischemic caudal hindbrain structures after carotid occlusion suggests that carotid occlusion leads to a dilation of the parenchymal microvessels in the vertebrobasilar system.
The Tb depends partly on the segments of cerebral microvessels measured or observed. Tb's through the system of small parenchymal microvessels (<50 μm) range from 0.2 to 0.8 s and from 0.2 to 1.3 s in various brain structures of Sprague–Dawley rats in the awake and pentobarbital-anesthetized conditions, respectively (Wei et al., 1993). Blood transit time through pial arterioles to emerging venues on the parietal cortex of anesthetized Wistar rats is 0.95 s (Cox et al., 1993). In the present study, Vb was measured in both small (<50 μm) and large (arteriole, <55 mm; venule, <182 μm) parenchymal vessels (Harper and Bohlen, 1984; Lin et al., 1990b). Tb through these microvessels in the sensorimotor cortex is 0.62 s in awake WKY rats (Table 2).
The Tb varies in different pathological conditions. Tb is prolonged by anesthetization with pentobarbital (Wei et al., 1993) and shortened by either exposure to an hypoxic environment (Bereczki et al., 1993) or administration of nicotine (Hans et al., 1993). In the present study, carotid occlusion results in a general prolongation of Tb (mean, 110%; Table 2) in both ischemic forebrain and nonischemic hindbrain structures. We further clarify that the prolonged Tb after carotid occlusion is due to similar increases in both Tp (mean, 111%; Fig. 4) and Tr (mean, 136%; Fig. 3). The increases in Tr and Tp indicate that carotid occlusion leads to decreases in flow velocities of both RBC and plasma in these parenchymal microvessels.
Rosenblum (1971) observed that hemodilution accelerated flow velocities of RBCs and plasma in pial arterioles of anesthetized mice. Our results showed that hemodilution shortened the Tb's of the carotid-occluded rats in both the ischemic forebrain and the nonischemic hindbrain structures (Table 2). This shortening effect of Tb's by hemodilution was due to the shortenings of both Tr (Fig. 3) and Tp (Fig. 4). These findings indicate that hemodilution accelerates flow, velocities of both RBCs and plasma in cerebral microvessels of the forebrain and hindbrain structures of awake carotid-occluded animals. Since Tr and Tp of the OH group were similar to those of the NN group (Figs. 3 and 4), hemodilution seems to normalize the flow velocities of RBCs and plasma in the ischemic forebrain of carotid-occluded rats.
The Tb is related to the extraction fraction of materials from microvessels into the brain by the equation E = 1 − [exp − (P × Tb/r4)], where E is the extraction fraction, P is the permeability of material across microvascular vessels, and r is the mean radius of the microvessels. Accordingly, an increase in Tb will lead to an increase in the extraction fraction of substances into tissues. Carotid artery occlusion markedly prolonged the Tb in the forebrain structures of WKY rats and, thus, might lead to an increase in the extraction fraction of materials in the forebrain tissue. Hemodilution normalized Tb and, therefore might normalize the extraction fraction of substances in the brain of carotid-occluded rats.
In ischemic brain tissue, lactic acid and other waste products are accumulated because cells in the ischemic brain undergo anaerobic glycolysis. To rescue these acidic ischemic cells, lactic and waste products in them need to be cleared. An acceleration of plasma flow velocity may alter the clearance rate of the waste products in the ischemic tissue. Isovolemic hemodilution, which shortens Tp, thus, may alter the clearance of waste products in brain tissue.
The λ value used for calculating lCBF is defined as the ratio of IAP distribution spaces between the brain and the blood. In normal control rats, λ is 0.8 (Tajima et al., 1992). Since RBCs contain certain amounts of the hemoglobin, in which IAP may not distribute, the distribution space of IAP may be less in RBCs than in plasma. Hemodilution decreases the RBC mass in blood, thus the distribution space of IAP in hemodiluted blood may slightly increase. Accordingly, λ will be slightly decreased by hemodilution, and the lCBF of the hemodiluted animals may be underestimated if the λ value is assumed to be 0.8.
In conclusion, carotid artery occlusion of WKY rats results in a partially ischemic forebrain, in which Tb, Tr, and Tp are prolonged. Isovolemic hemodilution normalizes lCBF, Tb, Tr, and Tp in these ischemic forebrain structures.
Footnotes
Acknowledgment:
The authors thank Fu-Ying Wu and Chiou-Ling Lin for preparation of the manuscript. This work was supported by Research Grants NSC 79-0412-B-016-95, NSC 80-0412-B-016-119, and NSC 81-0412-B-016-559 from the National Science of Council, Republic of China.