
Abstract
After intracerebral hemorrhage (ICH), many changes of gene transcription occur that may be important because they will contribute to understanding mechanisms of injury and recovery. Therefore, gene expression was assessed using Affymetrix microarrays in the striatum and the overlying cortex at 24 h after intracranial infusions of blood into the striatum of adult rats. Intracerebral hemorrhage regulated 369 of 8,740 transcripts as compared with saline-injected controls, with 104 regulated genes shared by the striatum and cortex. There were 108 upregulated and 126 downregulated genes in striatum, and 170 upregulated and 69 downregulated genes in the cortex. Real-time reverse transcriptase-polymerase chain reaction (RT-PCR) confirmed upregulation of IL-1-beta, Lipcortin 1 (annexin) and metallothionein 1,2, and downregulation of potassium voltage-gated channel, shaker-related subfamily, beta member 2 (Kcnab2). Of the functional groups of genes modulated by ICH, many metabolism and signal-transduction-related genes decreased in striatum but increased in adjacent cortex. In contrast, most enzyme, cytokine, chemokine, and immune response genes were upregulated in both striatum and in the cortex after ICH, likely in response to foreign proteins from the blood. A number of these genes may contribute to brain edema and cellular apoptosis caused by ICH. In addition, downregulation of growth factor pathways and the phosphatidylinositol 3-kinase (PI3K)/Akt pathway could also contribute to perihematoma cell death/apoptosis. Intracerebral hemorrhage-related downregulation of GABA-related genes and potassium channels might contribute to perihematoma cellular excitability and increased risk of post-ICH seizures. These genomic responses to ICH potentially provide new therapeutic targets for treatment.
Introduction
Intracerebral hemorrhage (ICH) is a devastating clinical event. More than 40% of patients die, and many survivors are disabled (Woo and Broderick, 2002). Currently, there are no effective therapies to increase survival after ICH or to improve the quality of life of those who do survive (Mendelow et al, 2005; D'Ambrosio et al, 2005; Pouratian et al, 2003). Better knowledge of the pathophysiology of ICH will lead to the development of effective treatments.
The effects of ICH on brain tissue are biphasic. The initial injury results from sheer forces and mass effect of the growing hematoma. Next, clot formation, inflammation, and edema that occur after ICH can worsen neurological deficits. Clotting factors, inflammatory cells, and various components of blood have been identified as important mediators of edema and inflammation after ICH (Larive and Carhuapoma, 2004; Rincon and Mayer, 2004; Hoff and Xi, 2003; Xi et al, 2003). However, little is known regarding the genomic response to blood in the brain.
DNA microarray analysis allows for the examination of changes in the expression of thousands of genes in a single tissue sample. Therefore, this study examined the genomic response of the striatum and the overlying cortex at 1 day after infusion of blood into the striatum of adult rats as compared with controls with infusions of saline. A number of genes were regulated in the hemorrhage site in the striatum as well as in the overlying cortex. The majority of these changes have not been previously reported. These studies provide a framework for increasing understanding of the many signaling pathways that contribute to the unique pathophysiology of ICH. Our previous study highlighted common and unique genomic changes after ischemic stroke, ICH, kainate seizures, and other types of injury (Tang et al, 2002), whereas this study focuses on ICH. The goal was to provide an overview of genomic changes that occur in the brain after ICH and identify individual genes or groups of genes or processes that could be treatment targets.
Materials and methods
Male Sprague–Dawley rats weighing 250 to 300 g were used for this study. The animals were allowed to acclimate in the animal housing facility for at least 3 days before entry into the study to decrease any effects of stress on gene expression in blood or brain (Sharp et al, 1991; Tang et al, 2001). All animal protocols were approved by the University of Cincinnati animal care committee and conform to the National Institutes of Health Guide for Care and Use of Laboratory Animals.
Intracerebral Hemorrhage Model
This study used an intrastriatal blood infusion ICH model as reported previously (Tang et al, 2002; Xi et al, 1998a). Briefly, rats were deeply anesthetized with isoflurane (3% in 21% oxygen and 76% nitrogen) and placed into a Kopf stereotaxic frame (n = 3). After removing the hair and cleaning the scalp, the skin was incised. A burr hole was drilled 0.5 mm anterior and 4 mm lateral to bregma. A 27 G needle was lowered to a depth of 4 mm below the dural surface into the striatum. Fifty microliters of lysed, autologous arterial blood was infused using a minipump more than a period of 10 mins. The core temperature of each animal was maintained at 37°C, with a rectal thermistor connected to a feedback-controller-driven heating pad. The needle was removed, the wound cleaned and the scalp sutured. The animals were allowed to recover in their home cages in an incubator maintained at 37°C for a period of 24 h. During the recovery period, the animals had free access to food and water and were maintained on a 12 h light–dark cycle. This model of ICH results in marked brain edema 24 h after the blood infusion (Xi et al, 1998a).
Sham Hemorrhage (Saline Infused)
The sham-hemorrhage animals (n = 3) were treated similarly to those that had the ICH. They were anesthetized, placed in the stereotaxic, the head shaved, the skin incised and had burr holes drilled at the same coordinates. The needle was lowered into striatum. However, 50 μL of saline was infused into the striatum more than a period of 10 mins in place of the lysed blood. The needle was removed, the wound cleaned, the skin sutured, and animals allowed to recover from anesthesia in their home cages with free access to food and water.
RNA Preparation
At 24 h after intracranial blood infusions (ICH) or saline infusions (sham hemorrhage), the animals were anesthetized with ketamine (000 mg/kg) and xylazine (20 mg/kg). Once deeply anesthetized, animals were decapitated. Brains were quickly removed and placed in a brain matrix in a 4°C cold room. The brain was then cut into three slices each of which was 2-mm thick, beginning 3 mm from the anterior tip of the frontal lobe. The entire striatum and the neocortex (cortex overlying and adjacent to striatum) were then dissected from each slice and all striatal tissue pooled and all neocortical tissue pooled. To perform the Affymetrix GeneChip microarray analyses and real-time quantitative (reverse transcriptase-polymerase chain reaction) RT-PCR, total RNA was isolated with TRIZOL reagent (Invitrogen, Carlsbad, CA, USA) as per the manufacturer's instructions. Briefly, the brain tissue was emulsified in TRIZOL reagent using a homogenizer. RNA was extracted with chloroform and precipitated using isopropyl alcohol. The RNA was further purified with an RNeasy mini kit (Qiagen, Hilden, Germany).
Microarray Analysis
Microarray expression analysis was performed according to the Affymetrix expression analysis technical manual and as previously described from our laboratory (Lu et al, 2003; Tang et al, 2002). Briefly, double-stranded complementary DNA (cDNA) was synthesized from total RNA. Biotin-labeled complementary RNA (cRNA) was synthesized from the cDNA using biotin-labeled ribonucleotides and T7 RNA polymerase. The cRNA was assessed for quality using gel electrophoresis. The cRNA was hybridized to Affymetrix U34A rat arrays (Affymetrix, Santa Clara, CA, USA) and the arrays scanned with an argon-ion laser at λ = 570 nm, with a resolution of 3 μm/pixel. These arrays contained probes for 8,740 known genes as well as some expression sequence tags (ESTs).
Data analysis was conducted using the Affymetrix GeneChip expression analysis software according to the Affymetrix GeneChip Analysis Suite. The initial analysis reported the hybridization intensity data and whether transcripts were present from each probe array. A comparison analysis was then run to determine if the expression levels of transcripts were increased, decreased or not changed. Three sets of chips were used for each group (hemorrhage cortex, hemorrhage striatum, sham-hemorrhage cortex and sham-hemorrhage striatum). Cross-comparisons were made between a sham group and its respective hemorrhage group, that is, sham-hemorrhage cortex versus hemorrhage cortex (nine comparisons) and sham hemorrhage striatum versus hemorrhage striatum (nine comparisons). In order for genes to be included in the analysis, the transcripts had to meet all of the following (stringent) criteria: they were present in all samples from both the sham and hemorrhage groups; five comparisons out of nine comparisons showed increased or decreased expression when hemorrhage animals were compared with the sham-treated animals; and, the fold changed in each of the individual comparisons was at least 1.7-fold.
Real-Time Quantitative RT-PCR
Four genes were selected for confirmation by RT-PCR based on their role in inflammation and cell survival. Real-time quantitative PCR was performed for these genes using the ABO Prism 5700 Sequence Detection system (Applied Biosystems, Foster City, CA, USA). Primer and probe sequences were determined using the Primer Express 2.0 software and were synthesized using PE OligoFactory (Applied Biosystems). Each probe was labeled with the reporter dye VIC at the 5′-end and with the quencher dye TAMRA (6-carboxytetramethyl-rhodamine) at the 3′-end. Phosphorylation at the 3′-end was used to block extension of the probe with AmpliTaq Gold DNA polymerase. Quantitative RT-PCR was performed as described in the Taqman One-Step RT-PCR Master Mix Reagent kit protocol (Applied Biosystems). Briefly, 50–100 ng total RNA was mixed with 900 nmol/L primer and 250 nmol/L probe for each gene. Thermal cycling was then used to reverse transcribe the RNA and to amplify the transcripts (reverse transcription, 30 mins at 48°C; activation of AmpliTaq Gold DNA polymerase, 10 mins at 95°C; thermocycling, 15 secs at 95°C, and 1 min at 60°C for 40 cycles). Amplified transcripts were quantified using the relative standard curve method with GADPH as a loading control (Lu et al 2003; Tang et al, 2002).
Results
Total Number of Regulated Genes
A large number of genes were regulated 24 h after ICH (Figure 1, Tables 1–8). Of the 369 transcripts that were regulated after ICH as compared with the sham-operation group, 234 genes were regulated in the striatum, 239 genes were regulated in the cerebral cortex, with 104 being regulated in both the striatum and the cortex. In the striatum, 108 genes were upregulated and 126 were downregulated. In the cortex, 170 genes were upregulated and 69 were downregulated. Figure 1 shows that the 369 regulated genes cluster into two groups: those that increase in animals with ICH and those that decrease in animals with ICH (Figure 1). This is an unsupervised cluster and shows that one cortex hemorrhage (CH) animal does not cluster directly with the other two CH animals, although the pattern of gene expression is similar. Overall, the cluster shows the relative consistency of upregulated (red, threefold increase) and downregulated genes (green, threefold decrease) in the three ICH animals in the cortex (CH) and in the striatum (SH) compared with cortex (CS) and striatum (SS) of the three sham-operated animals (Figure 1). PubMed searches, combined with Blast analyses, found that 59 of the 369 regulated genes (16%) had been reported in previous ICH studies. Three hundred and six known genes (83%) and four unknown ESTs (1%) had not been reported in previous ICH studies (Figure 2).
Functional categories and changes of genes
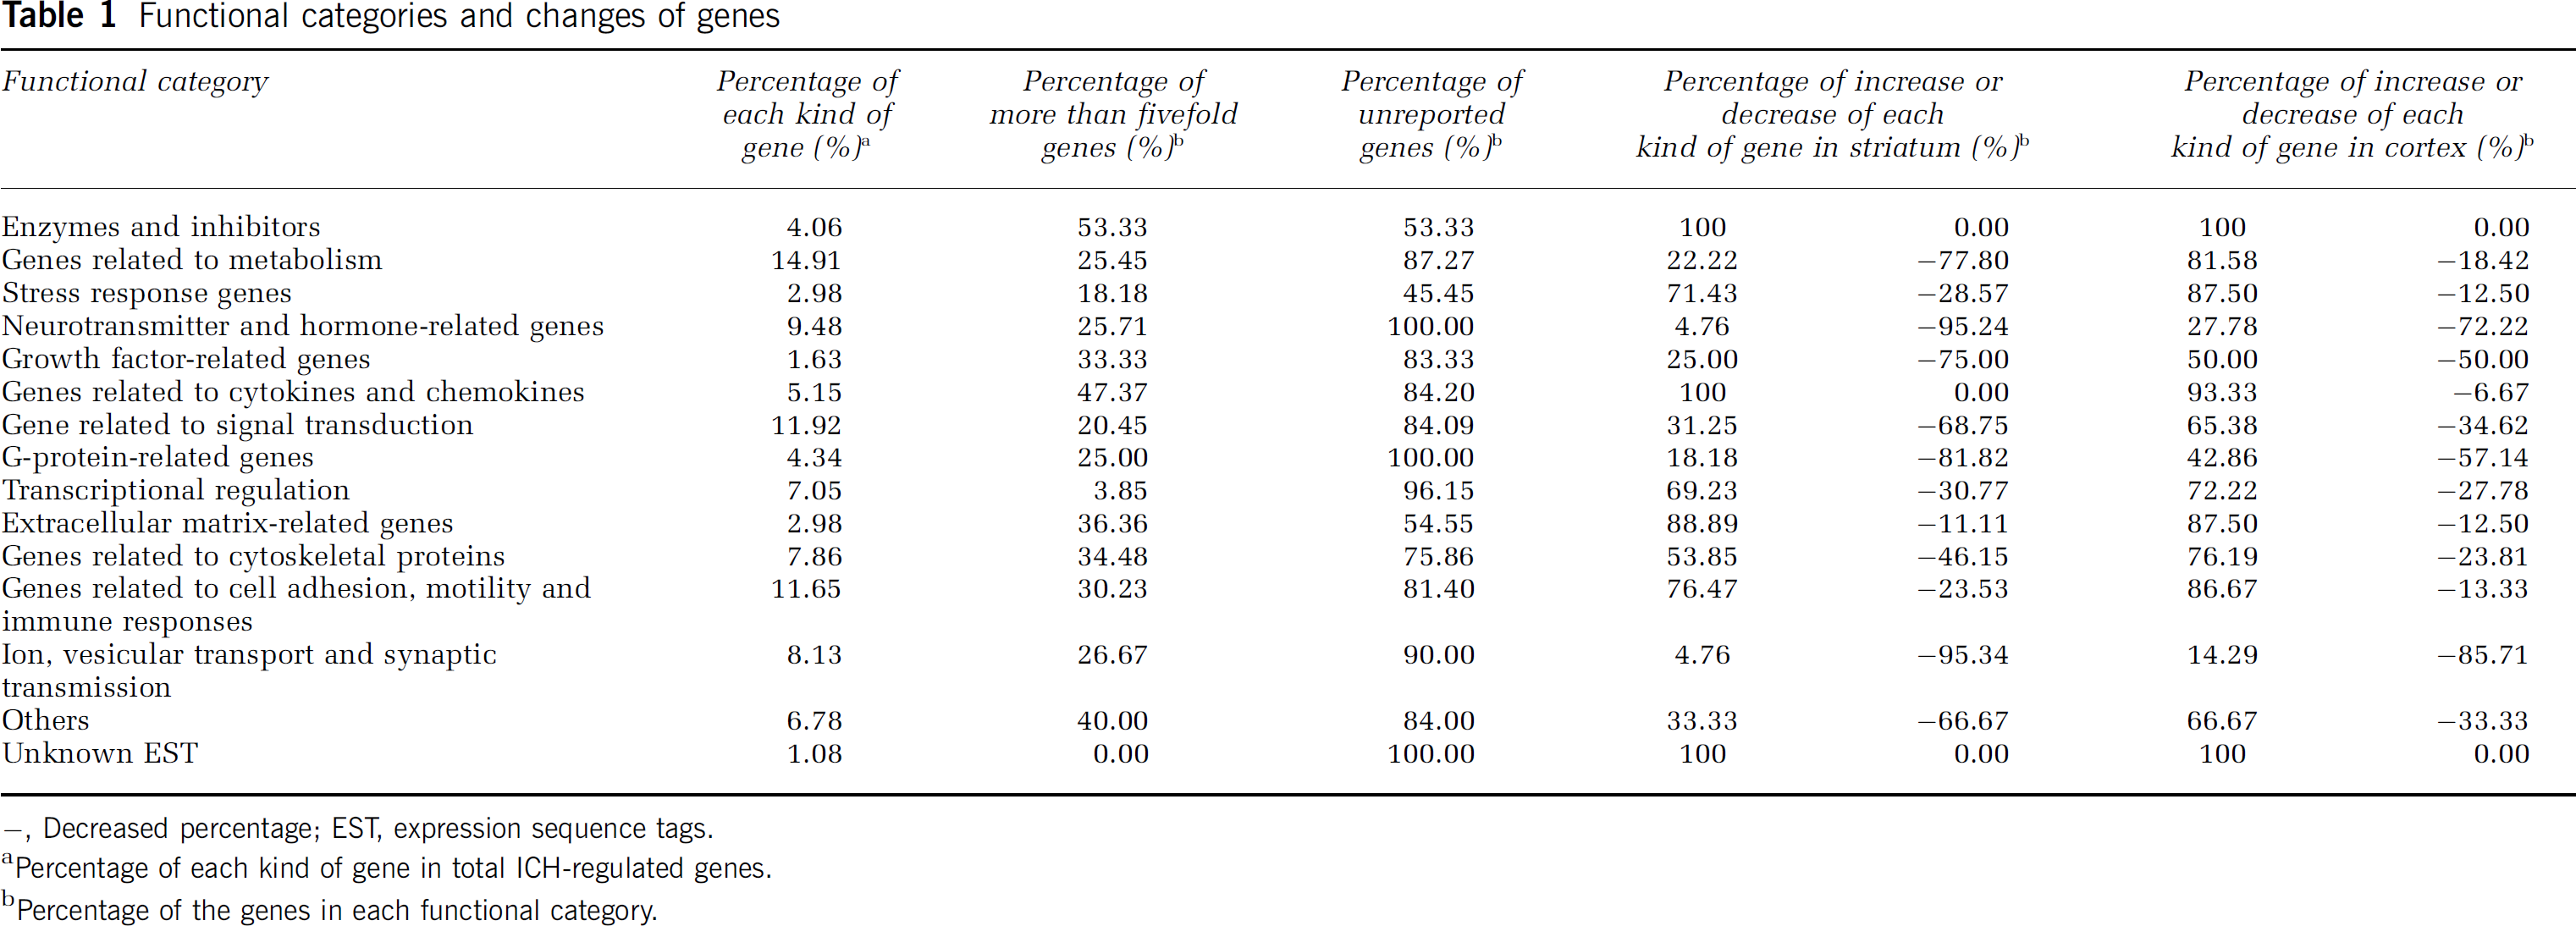
-, Decreased percentage; EST, expression sequence tags.
Percentage of each kind of gene in total ICH-regulated genes.
Percentage of the genes in each functional category.
Genes related to enzymes, their inhibitors and metabolism
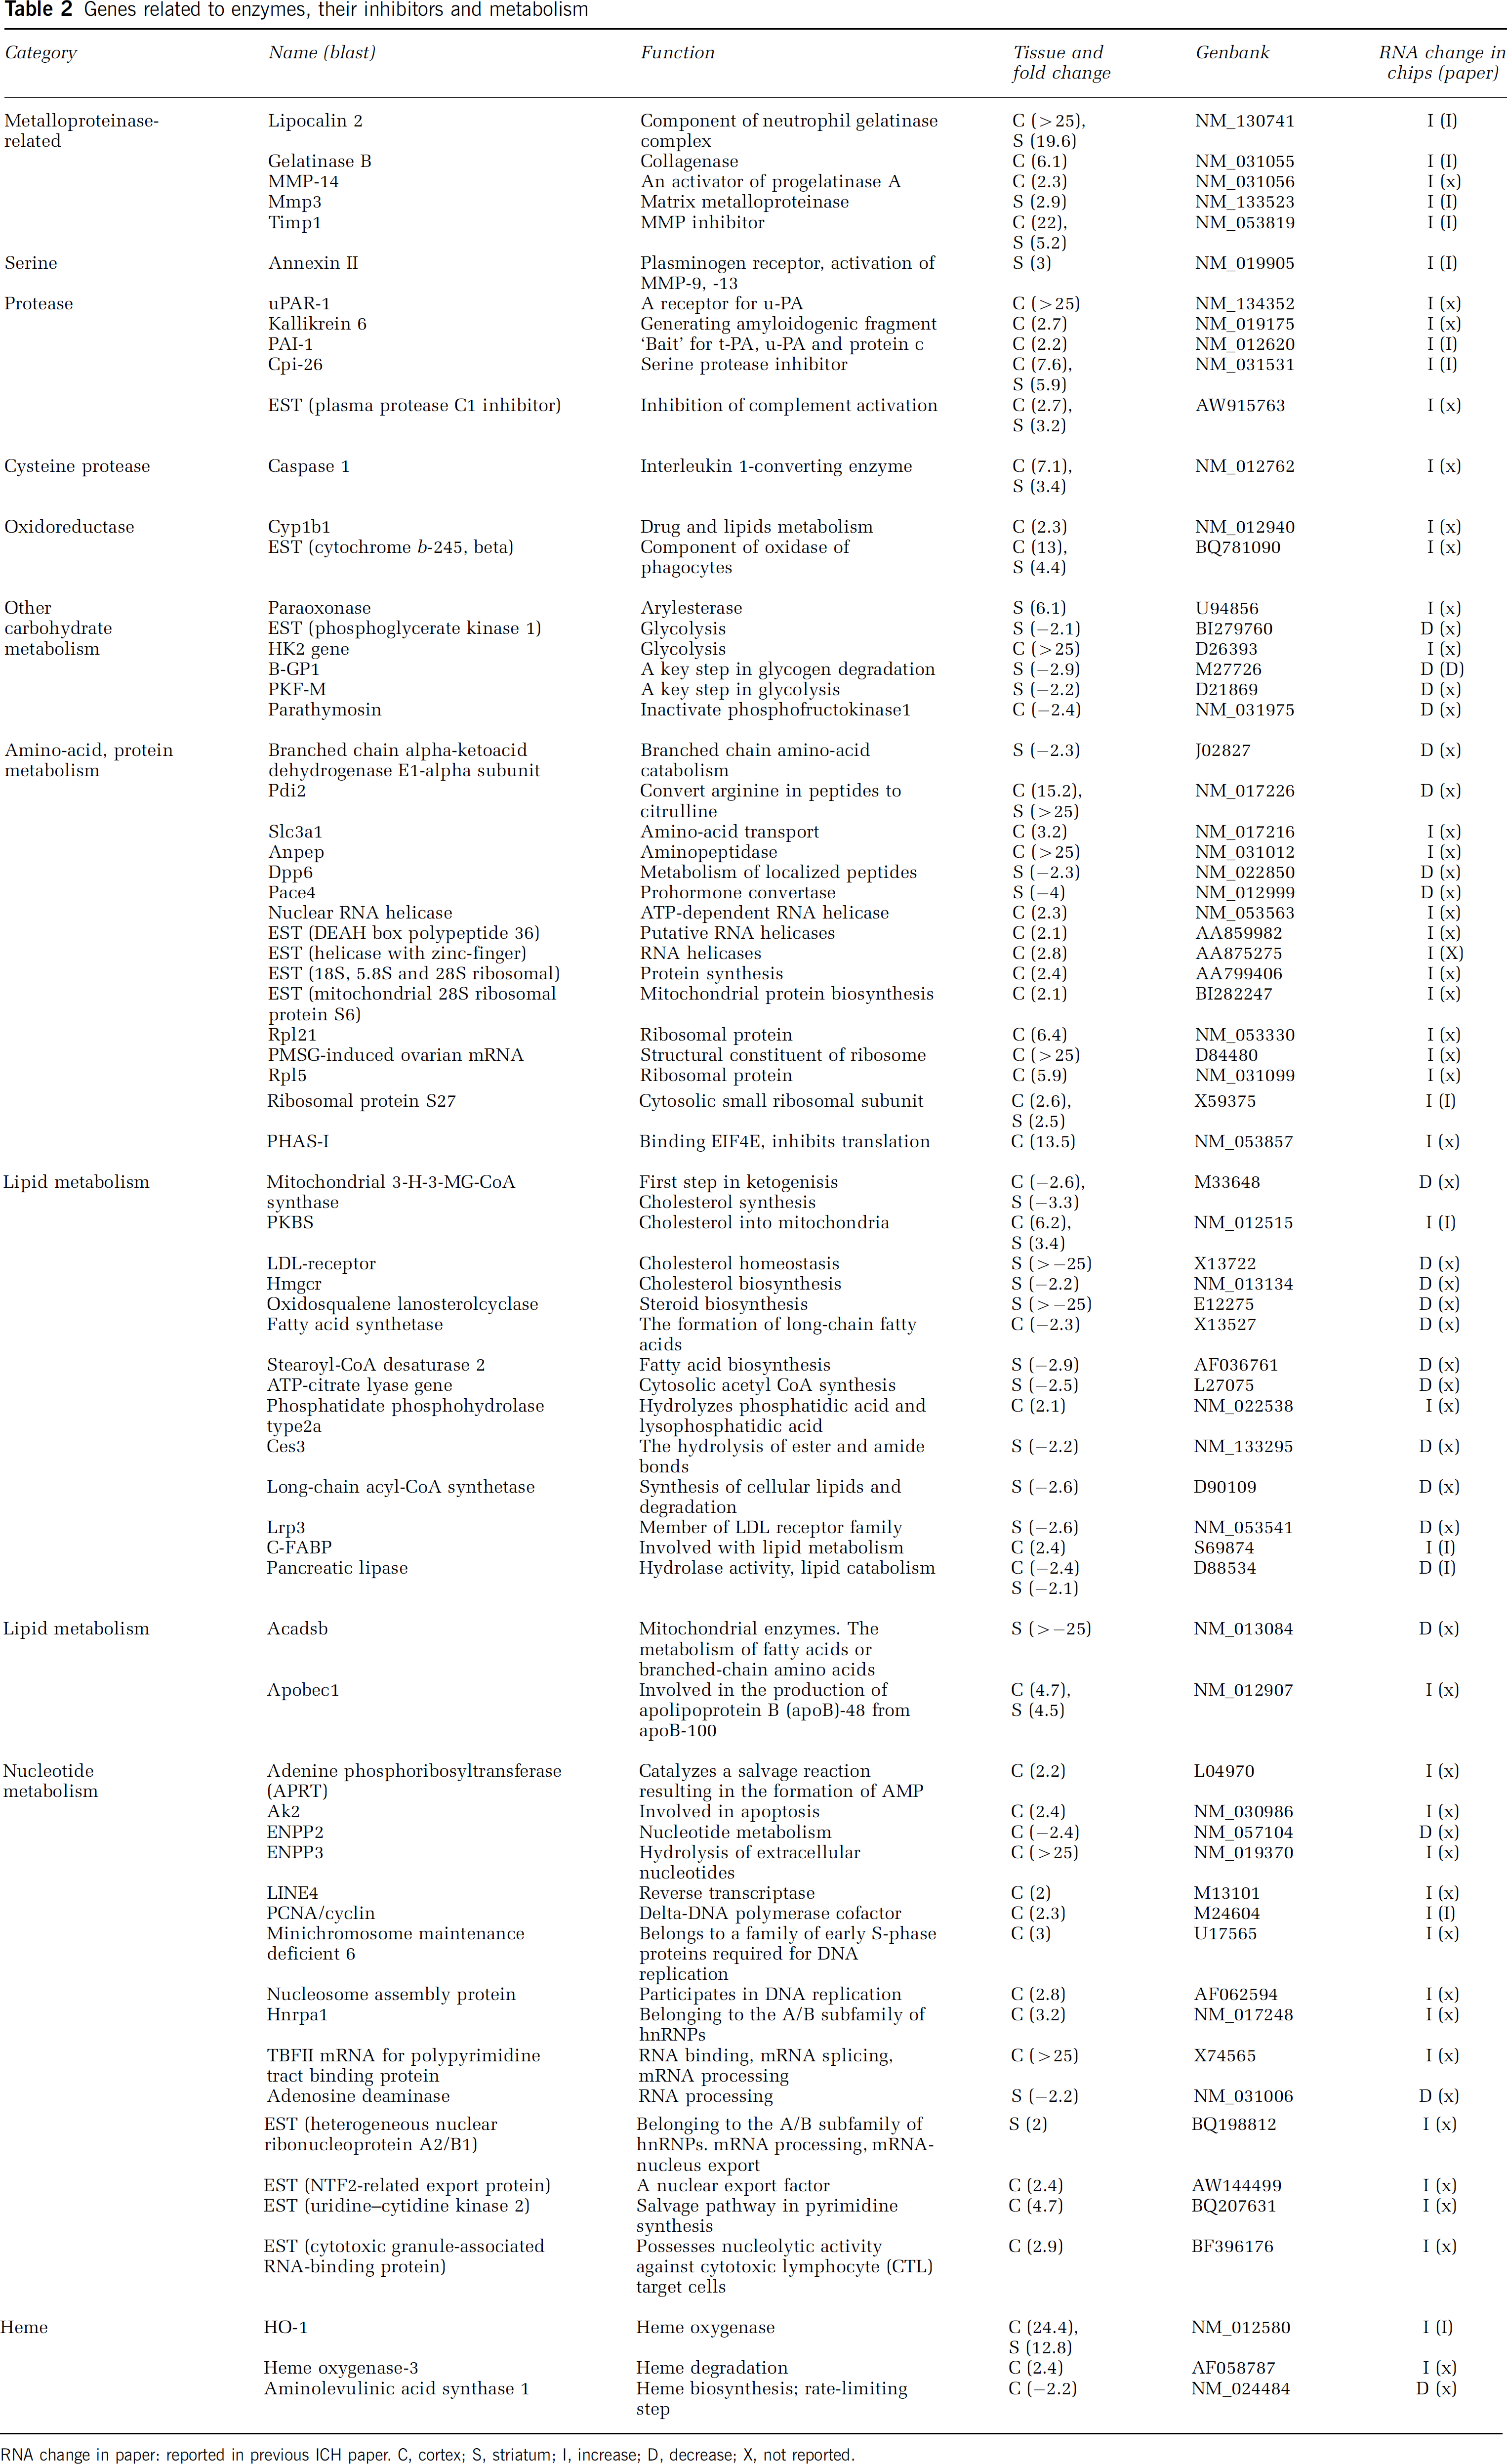
RNA change in paper: reported in previous ICH paper. C, cortex; S, striatum; I, increase; D, decrease; X, not reported.
Genes related stress response, neurotransmitters and hormones
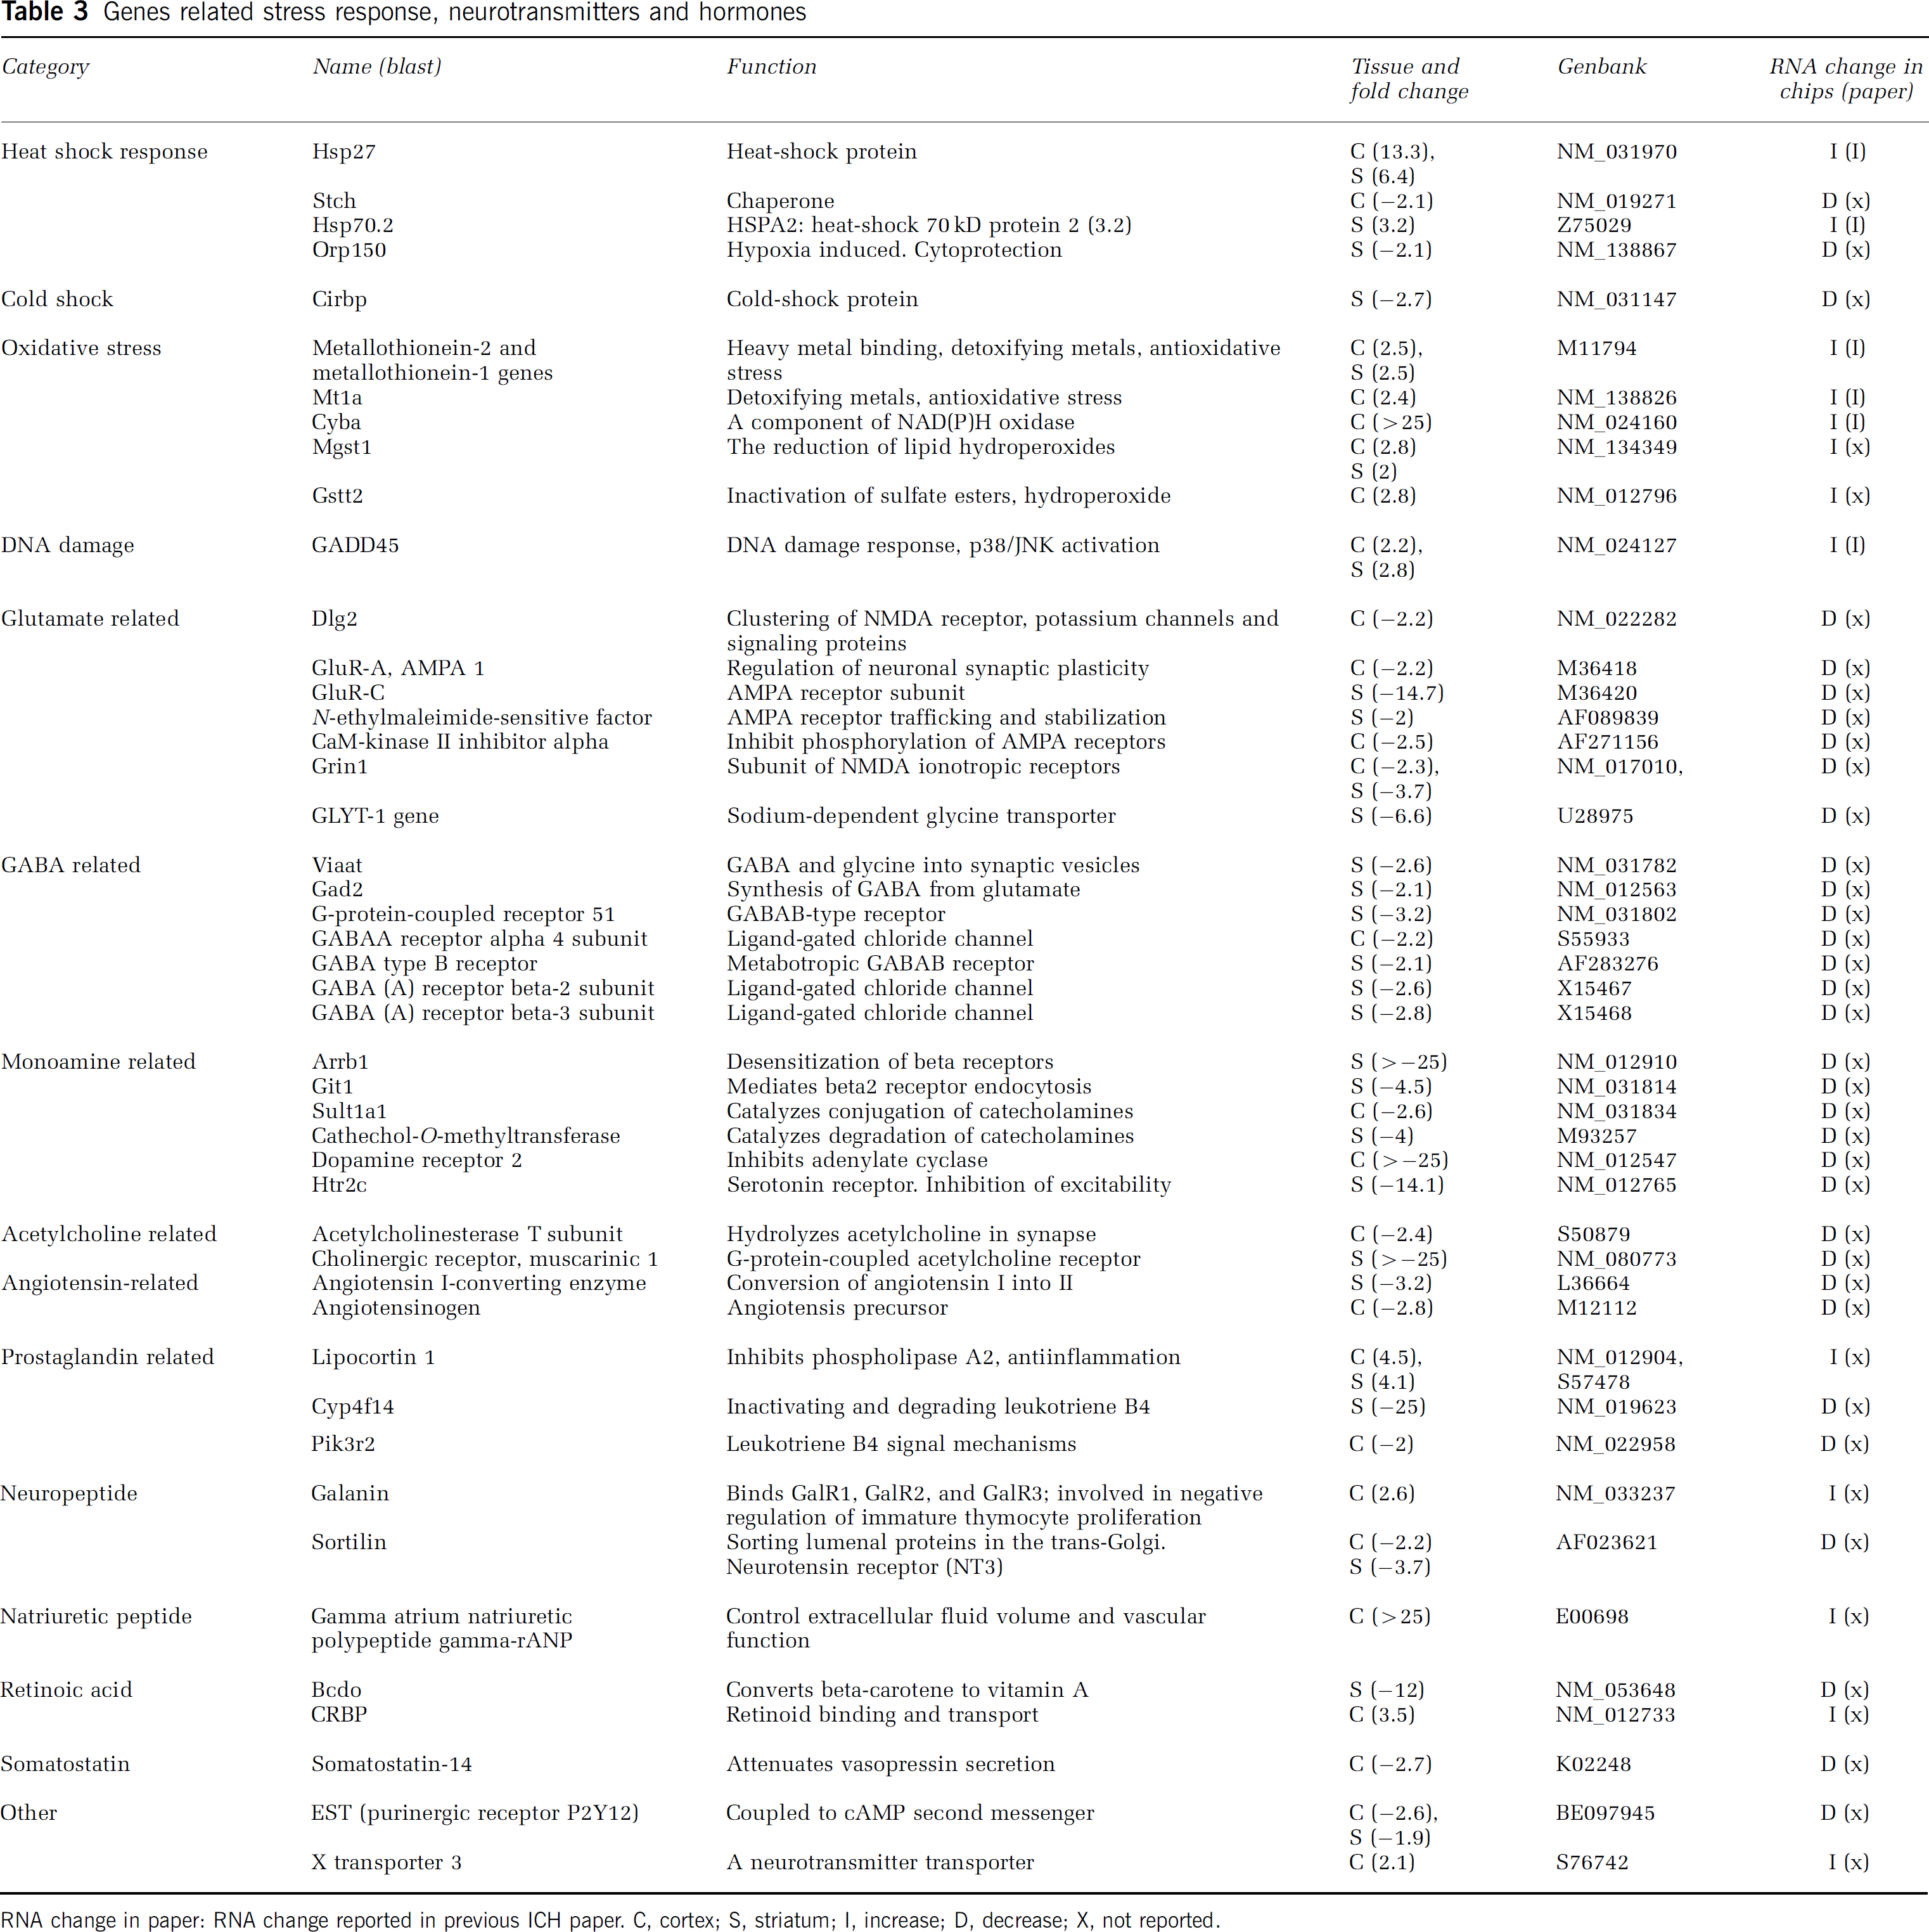
RNA change in paper: RNA change reported in previous ICH paper. C, cortex; S, striatum; I, increase; D, decrease; X, not reported.
Genes related to growth factors, cytokines and chemokines
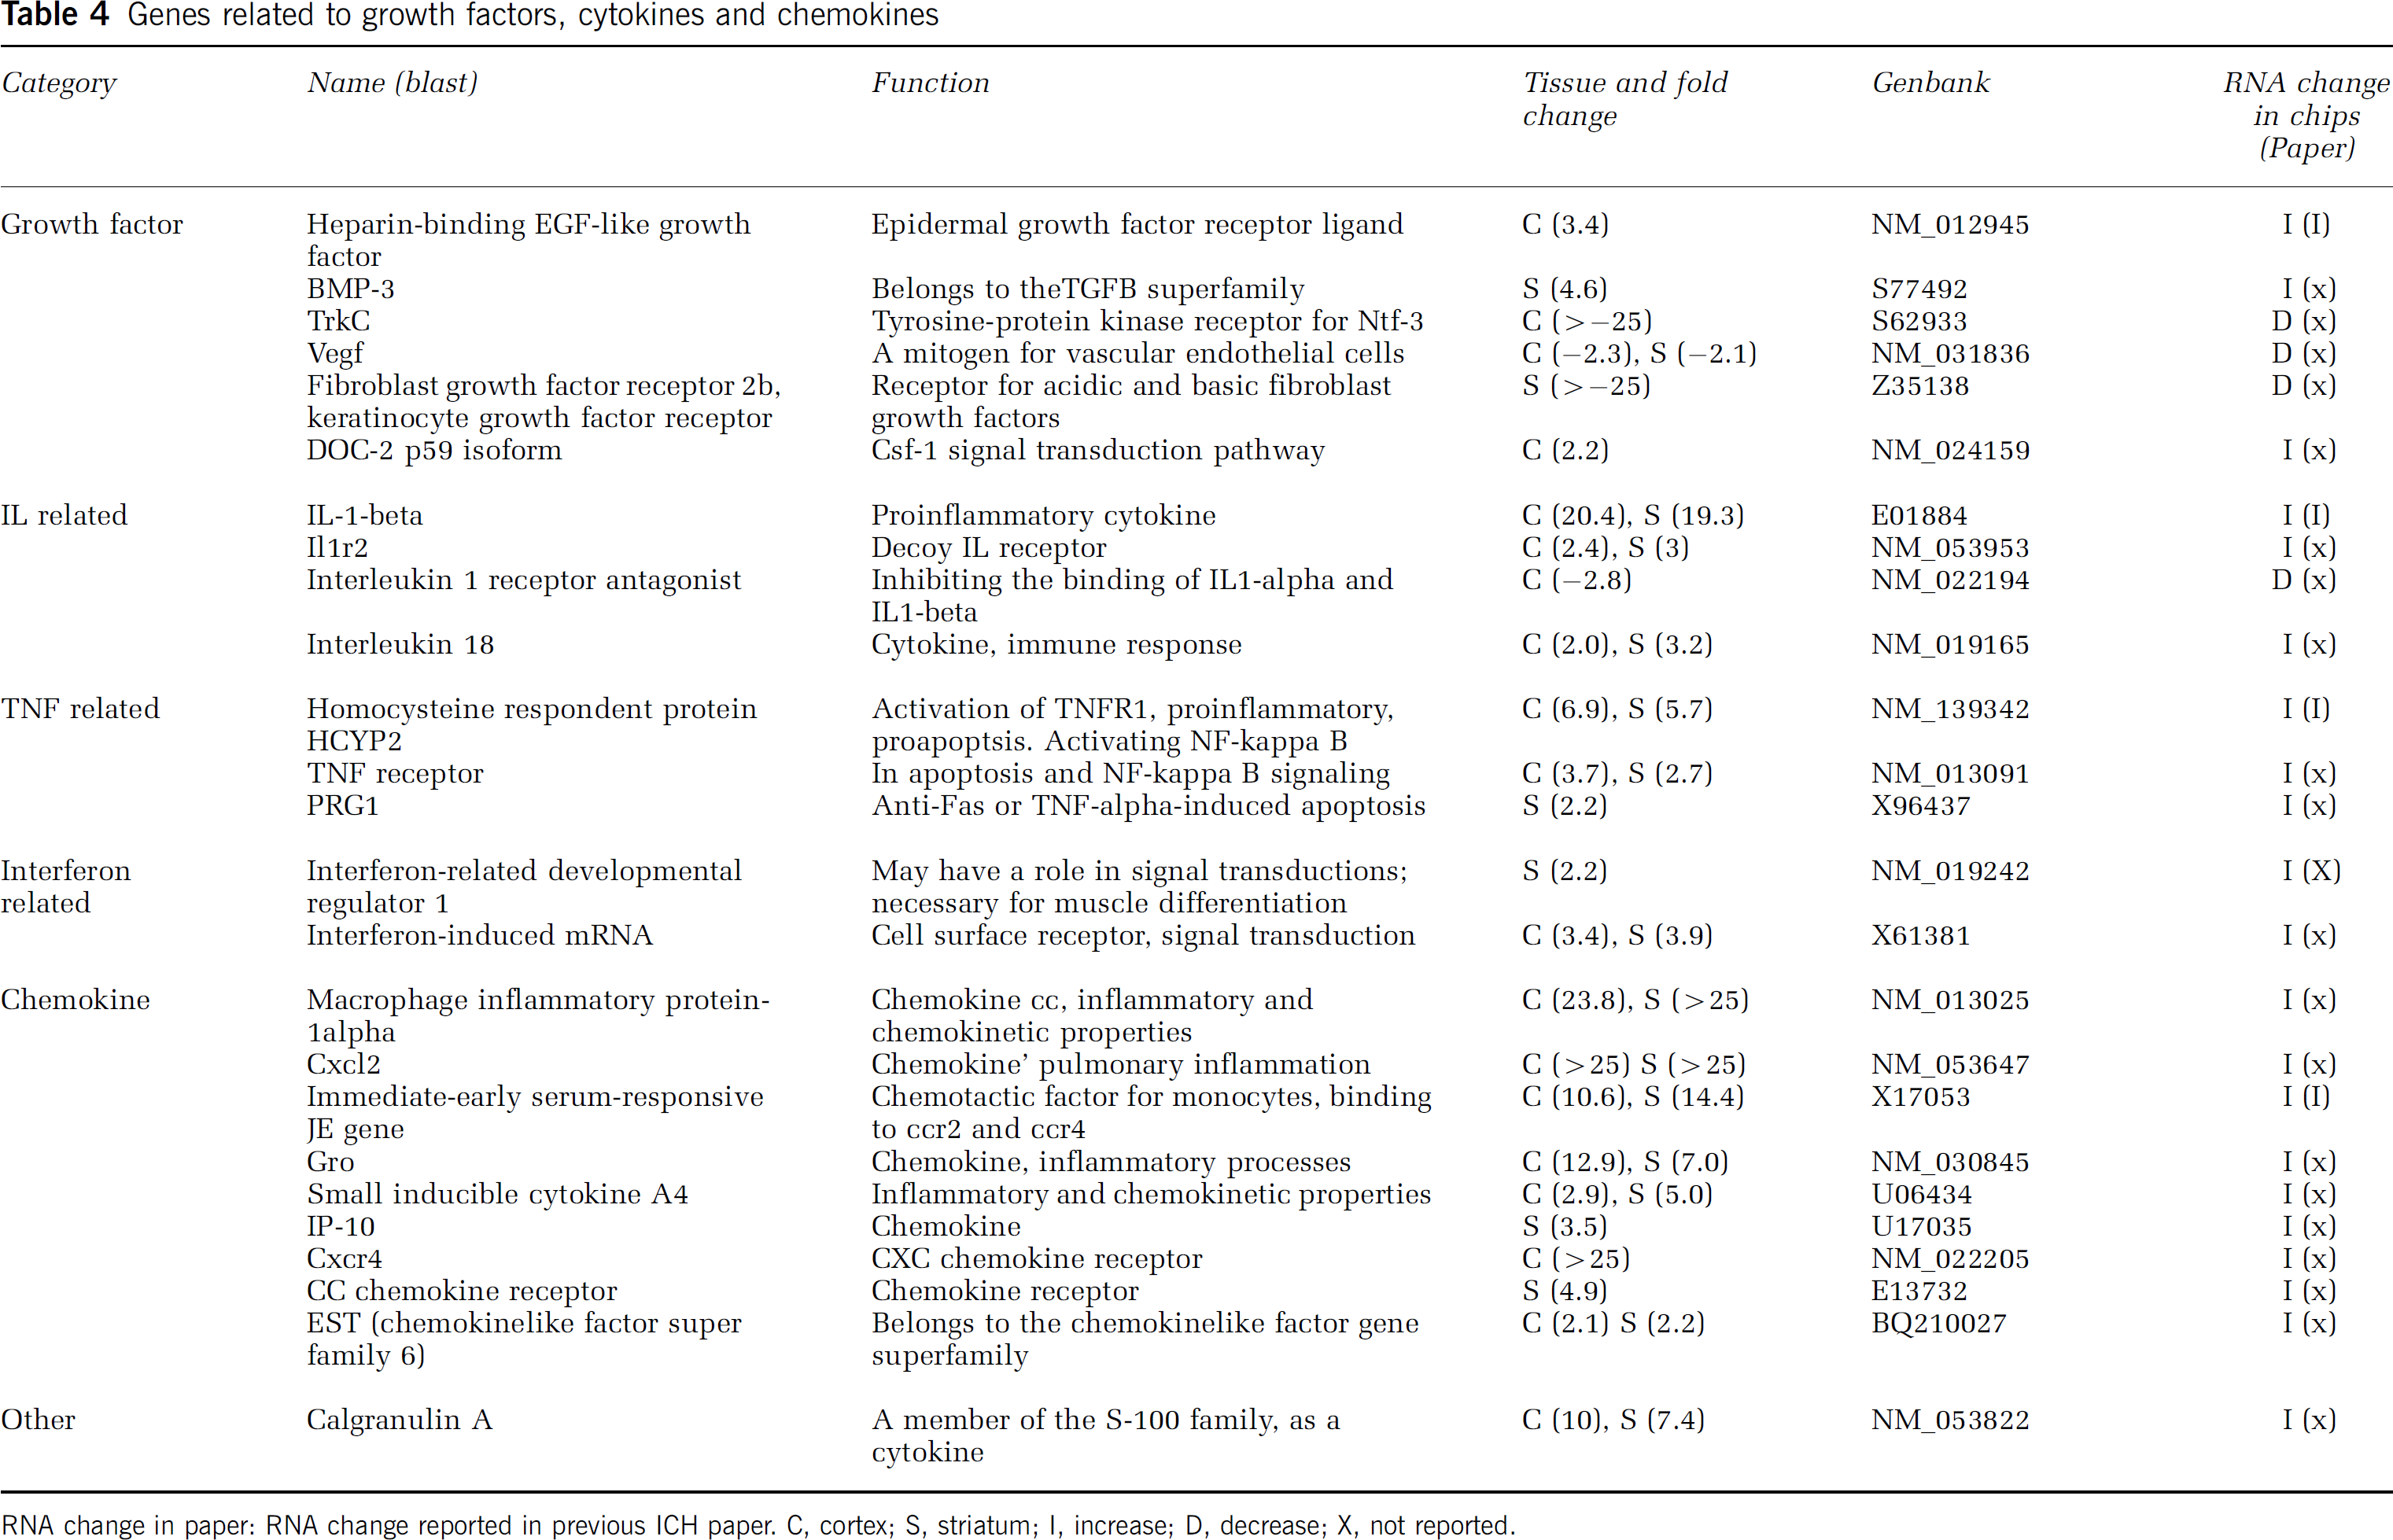
RNA change in paper: RNA change reported in previous ICH paper. C, cortex; S, striatum; I, increase; D, decrease; X, not reported.
Genes related to signal transduction, G protein and transcriptional regulation
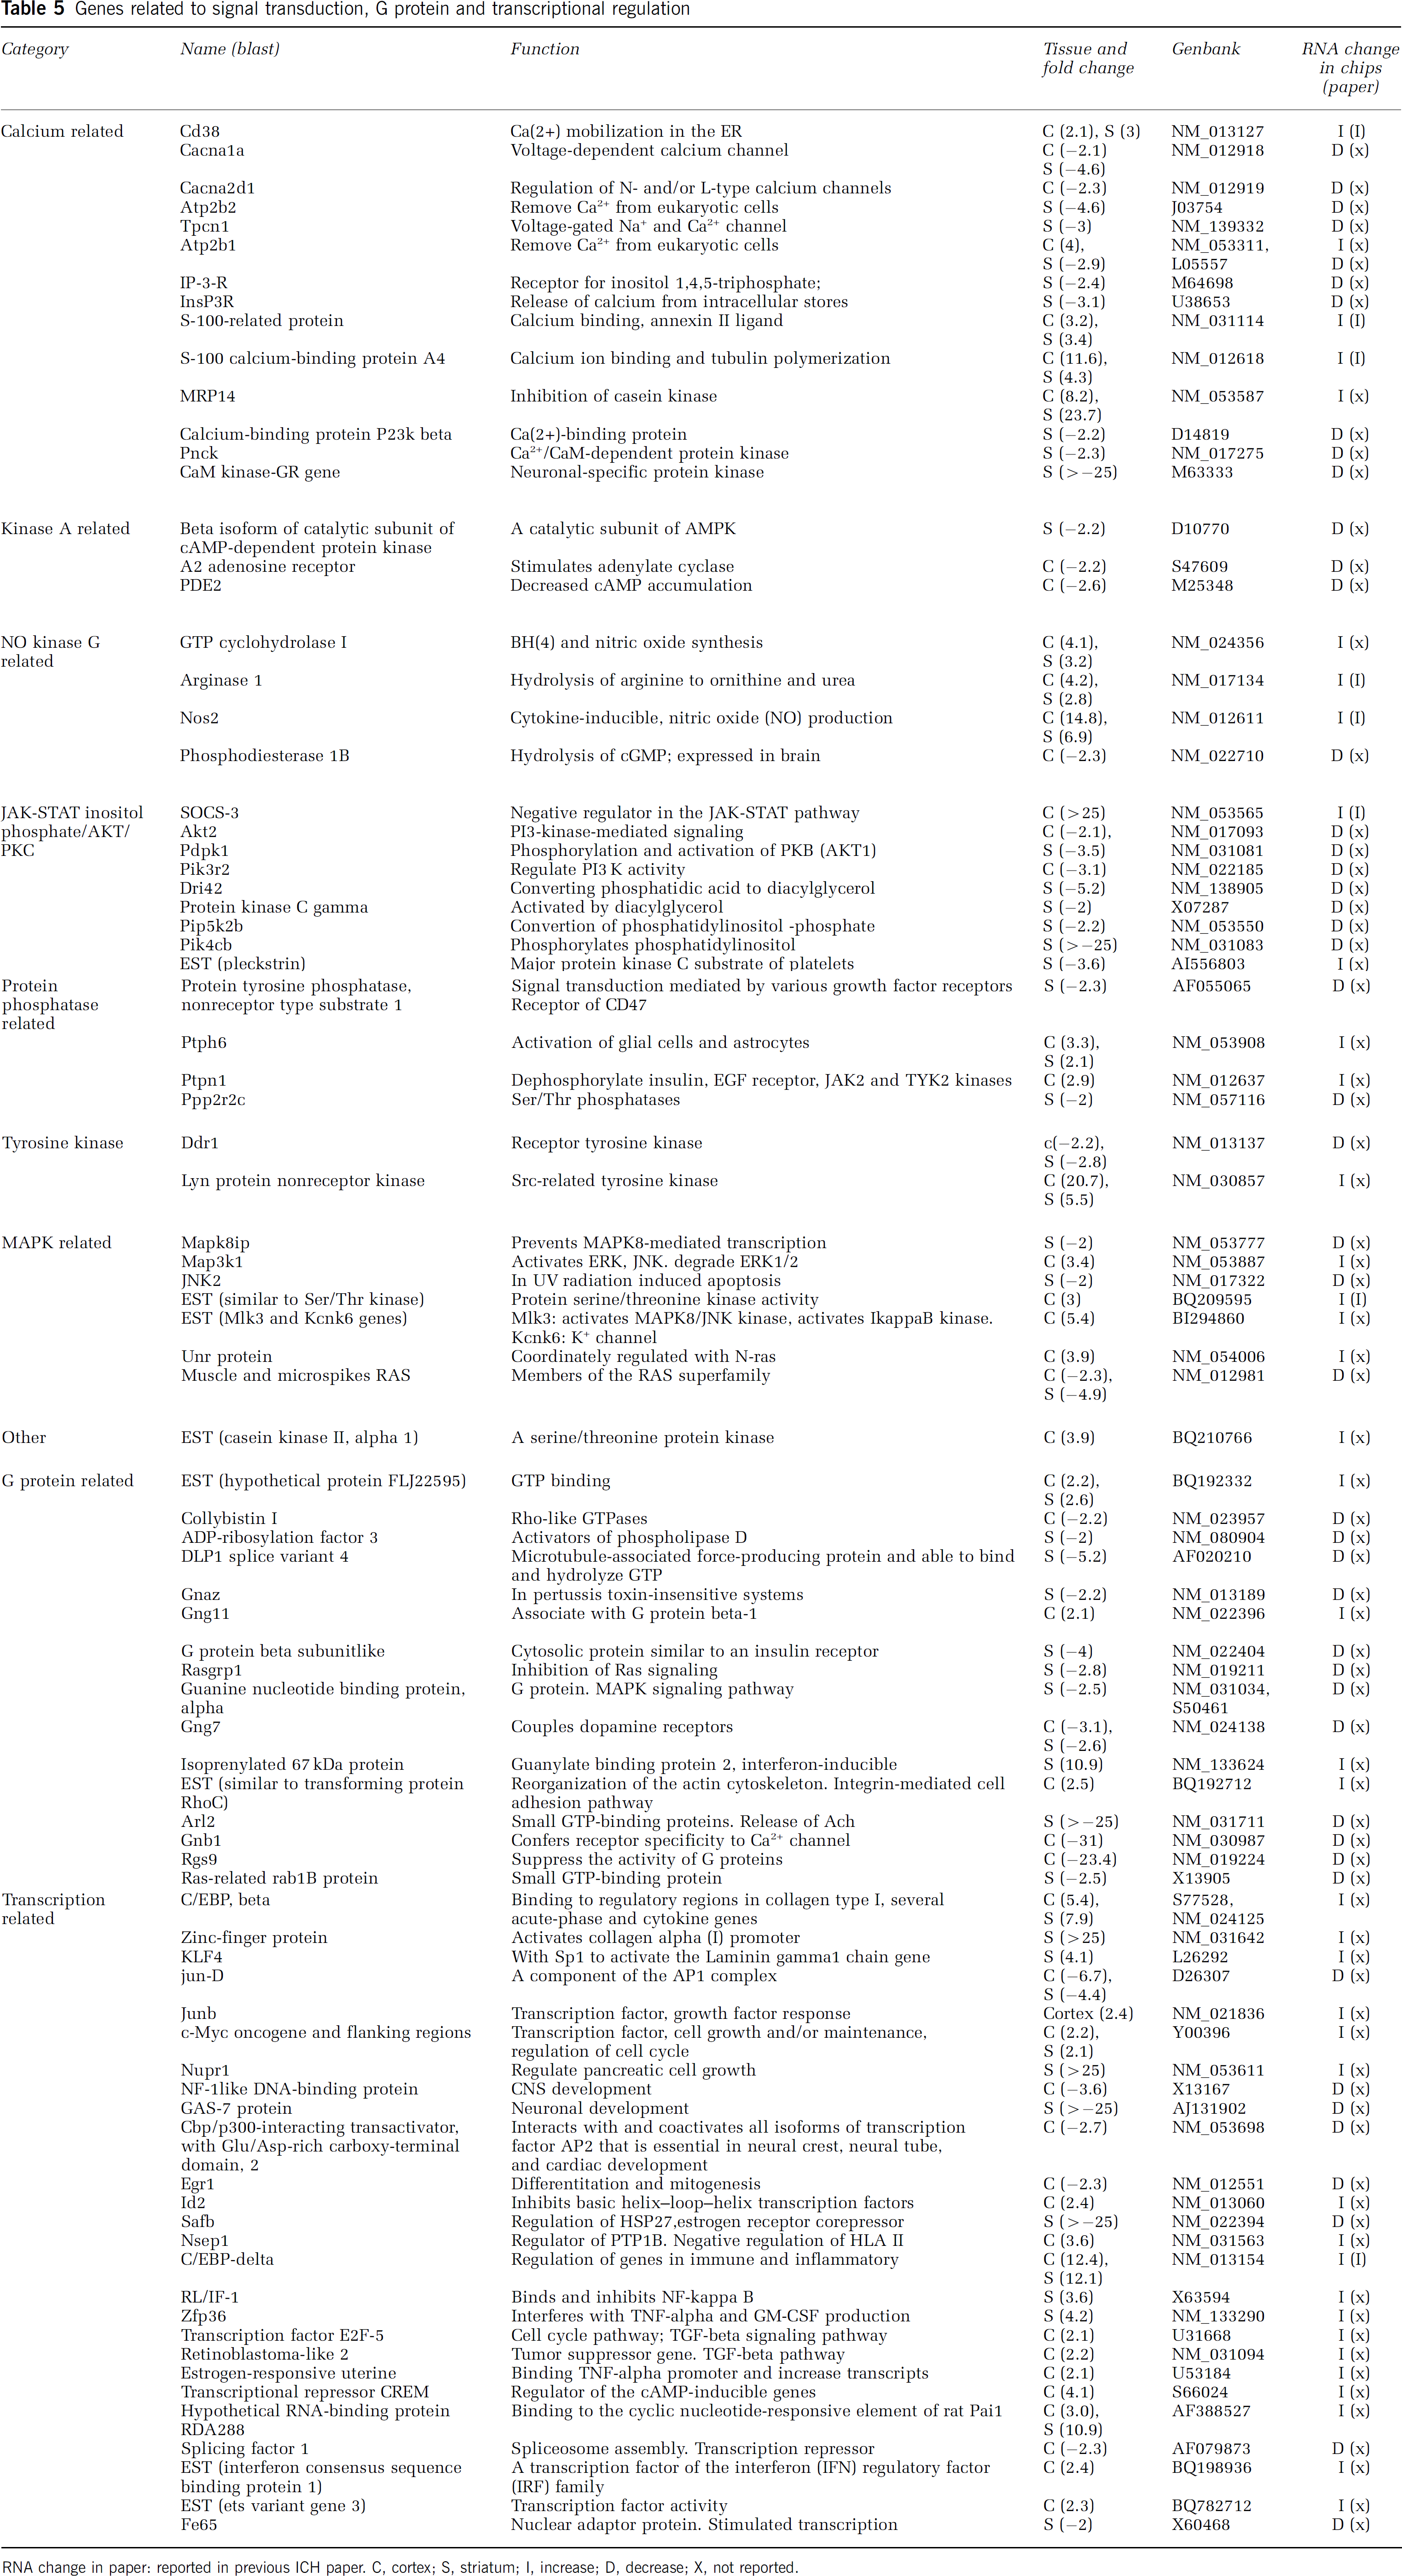
RNA change in paper: reported in previous ICH paper. C, cortex; S, striatum; I, increase; D, decrease; X, not reported.
Genes related to extracellular matrix, cytoskeleton, ion, vesicular transport, and synaptic transmission
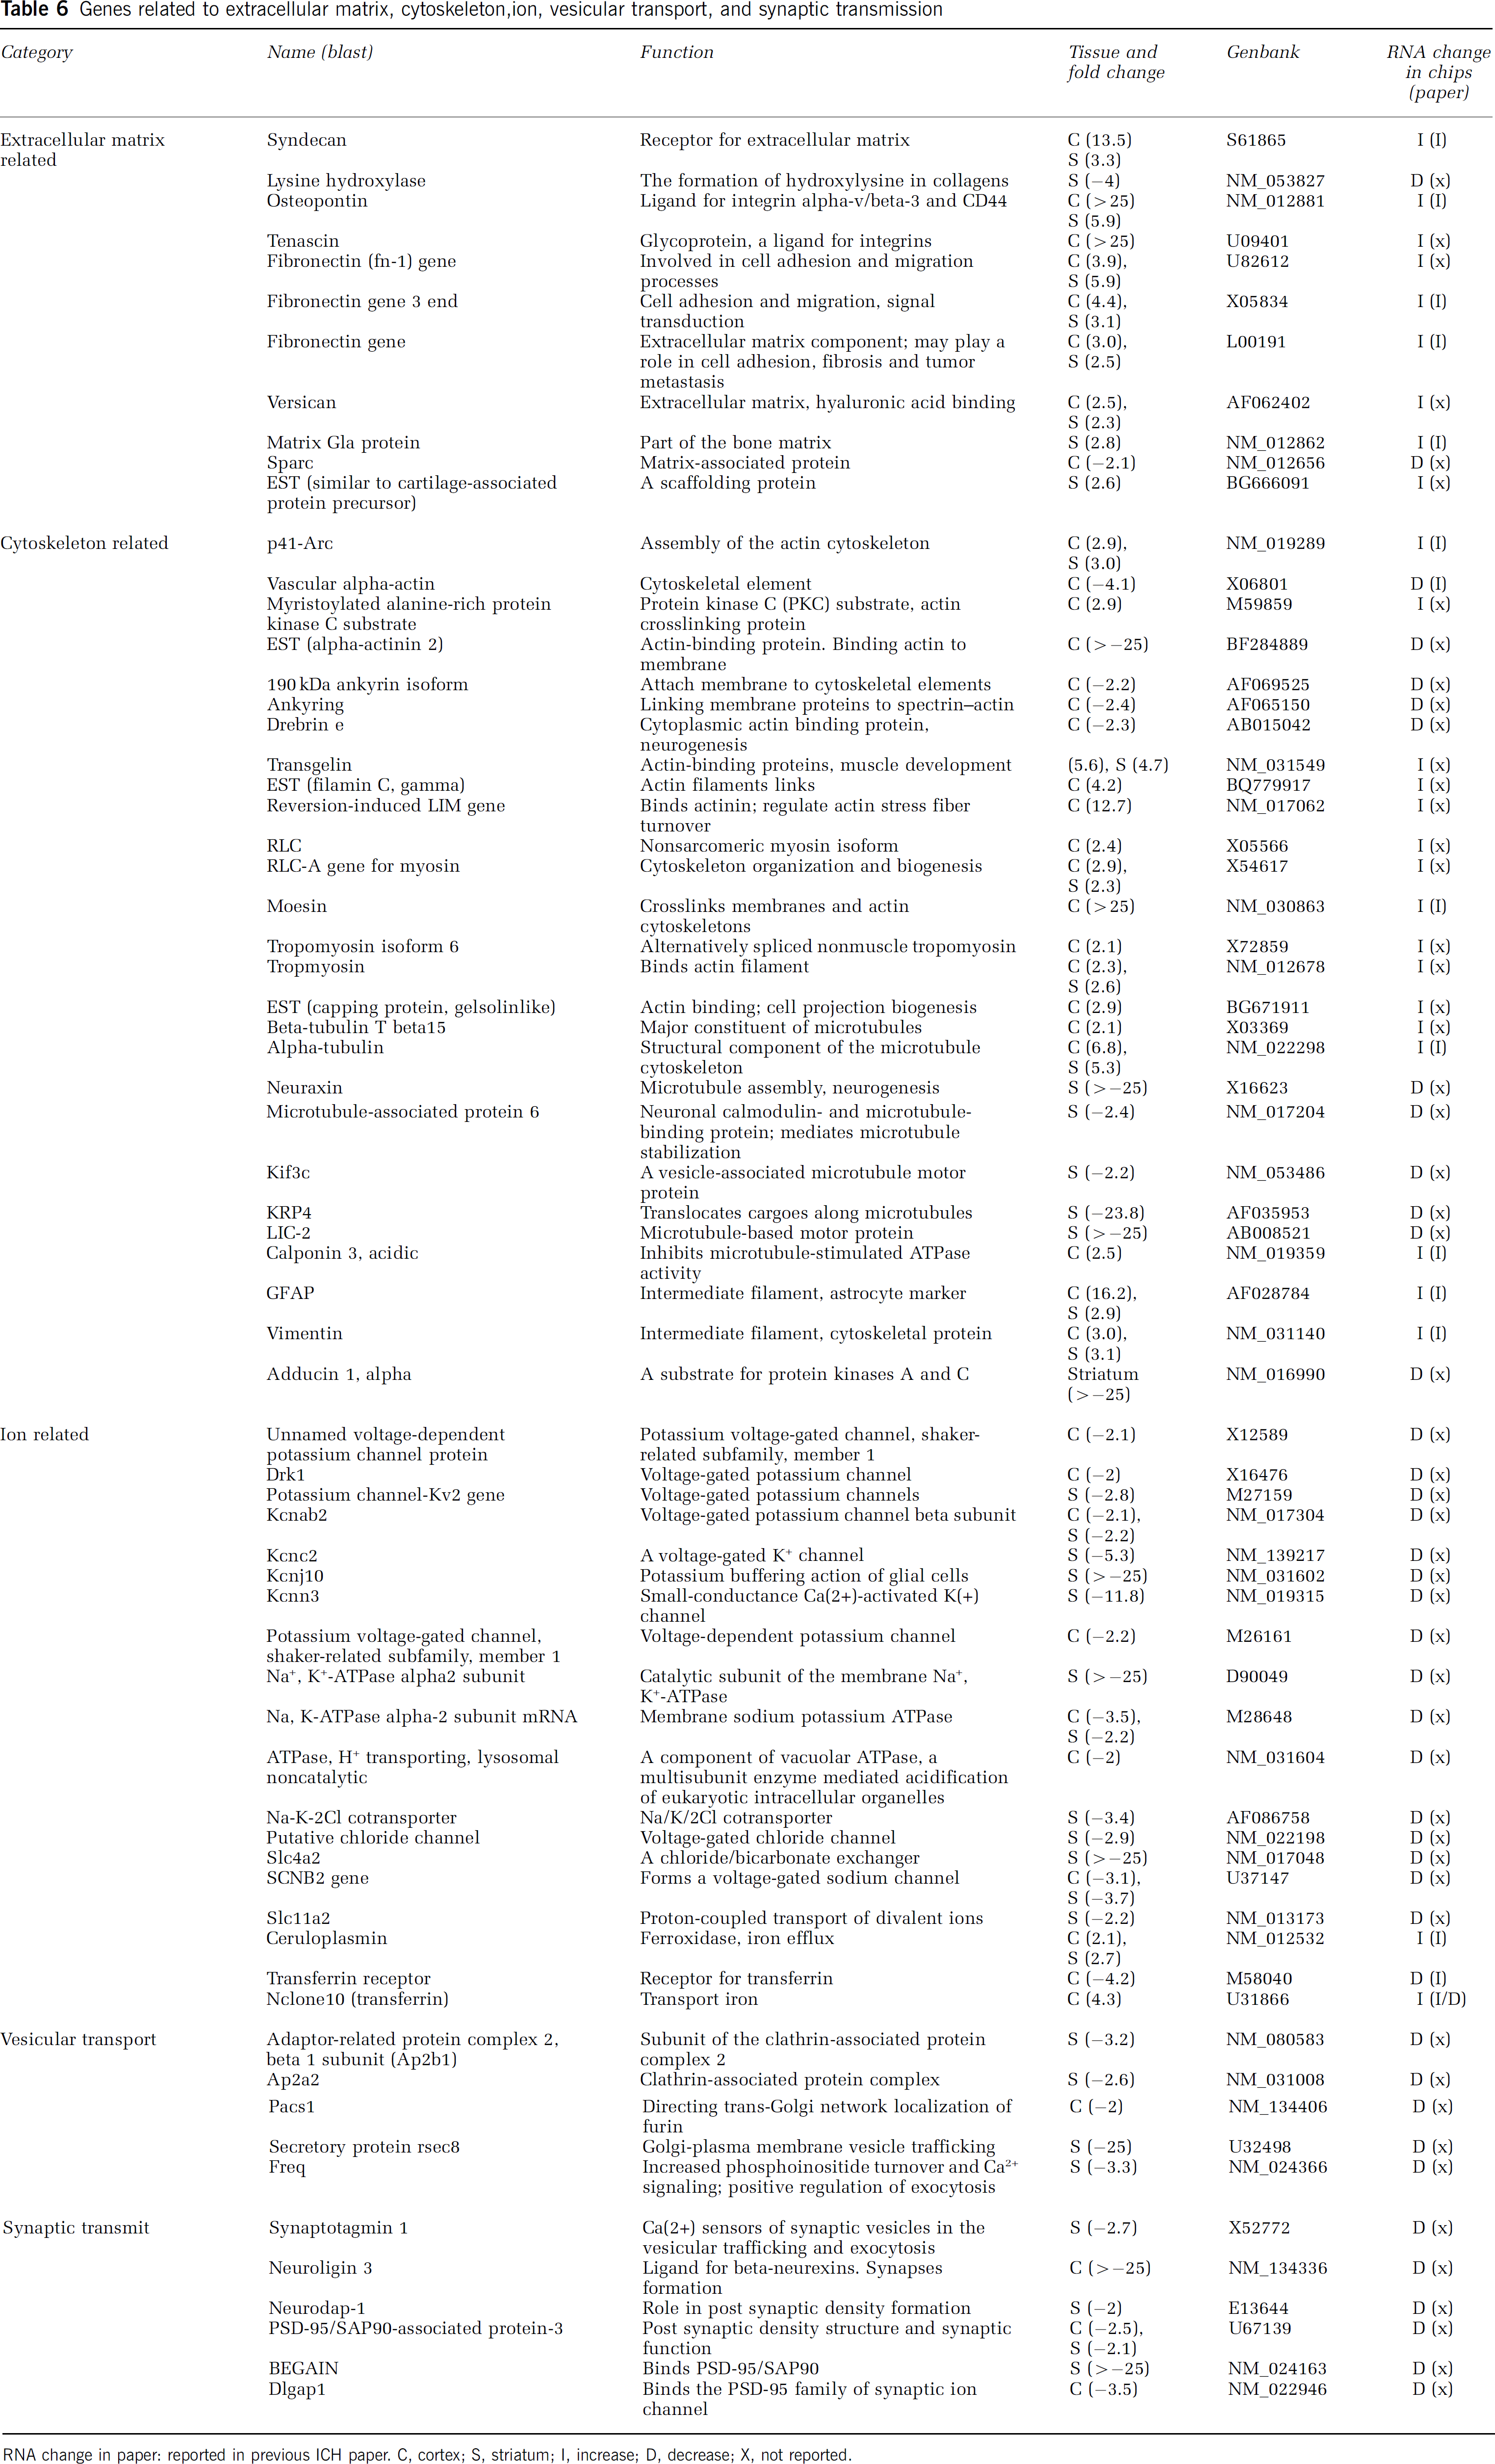
RNA change in paper: reported in previous ICH paper. C, cortex; S, striatum; I, increase; D, decrease; X, not reported.
Genes related to cell adhesion, motility and immune responses
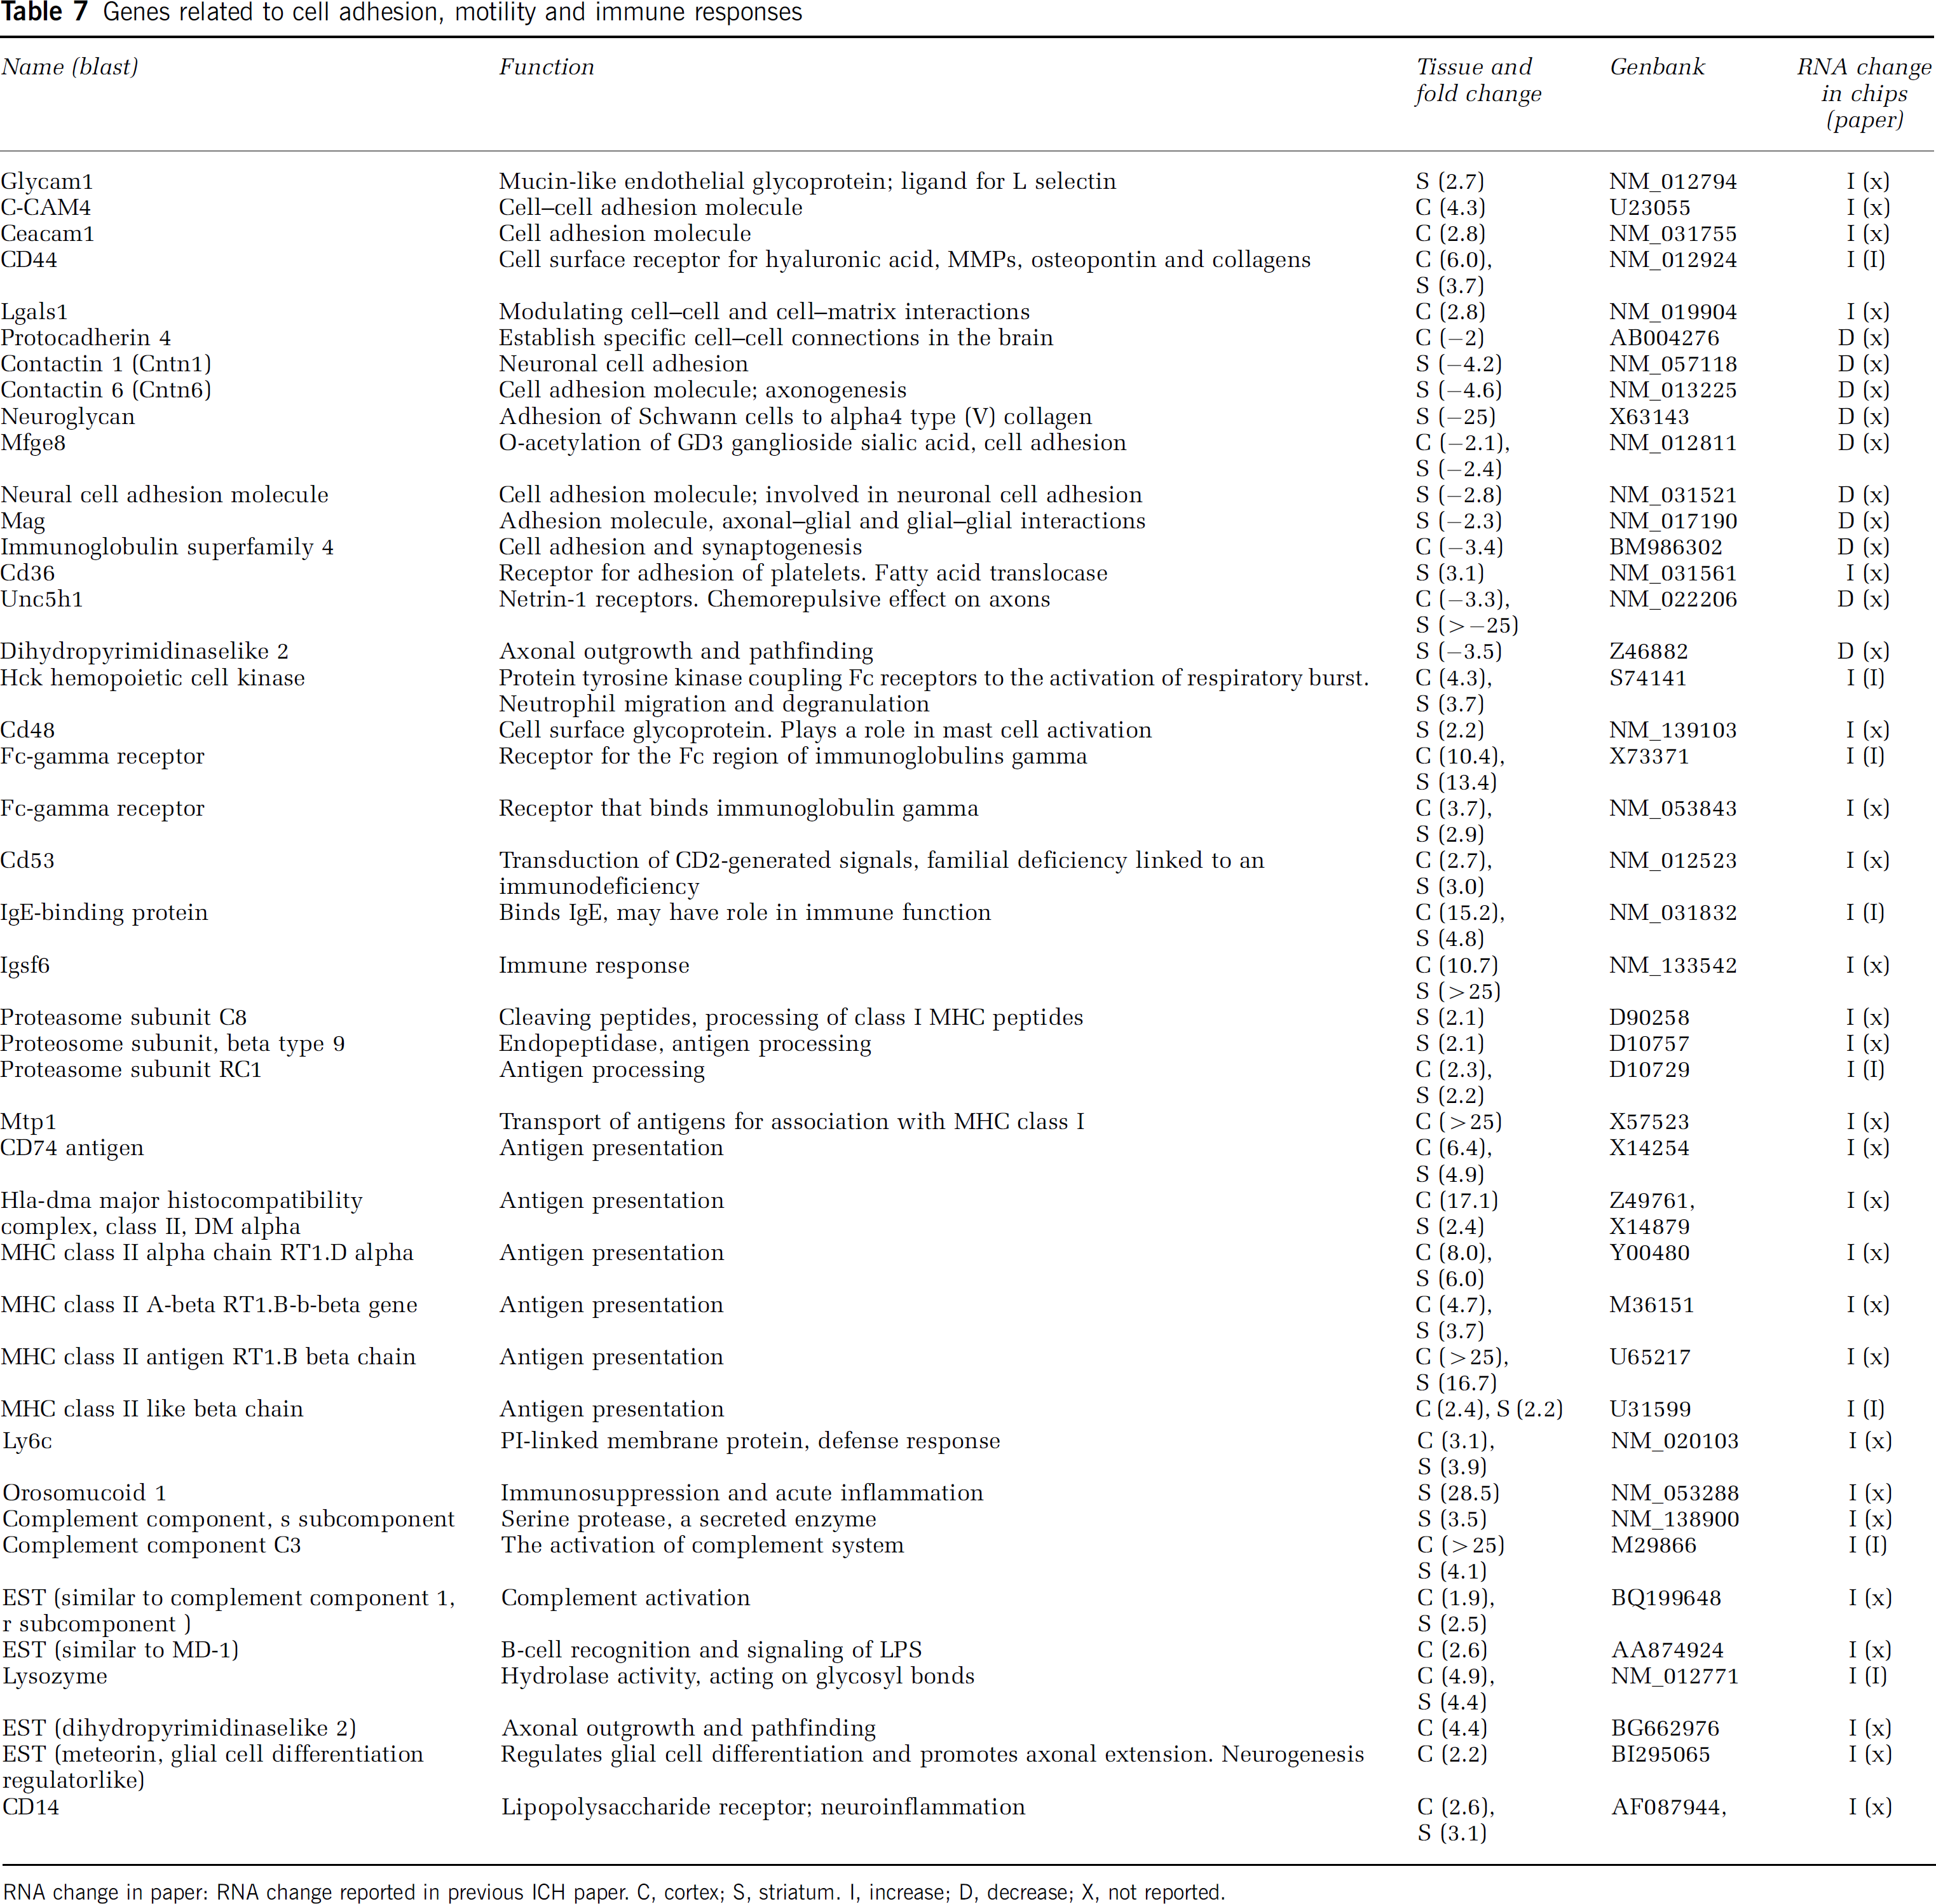
RNA change in paper: RNA change reported in previous ICH paper. C, cortex; S, striatum. I, increase; D, decrease; X, not reported.
Others and unknown ESTs
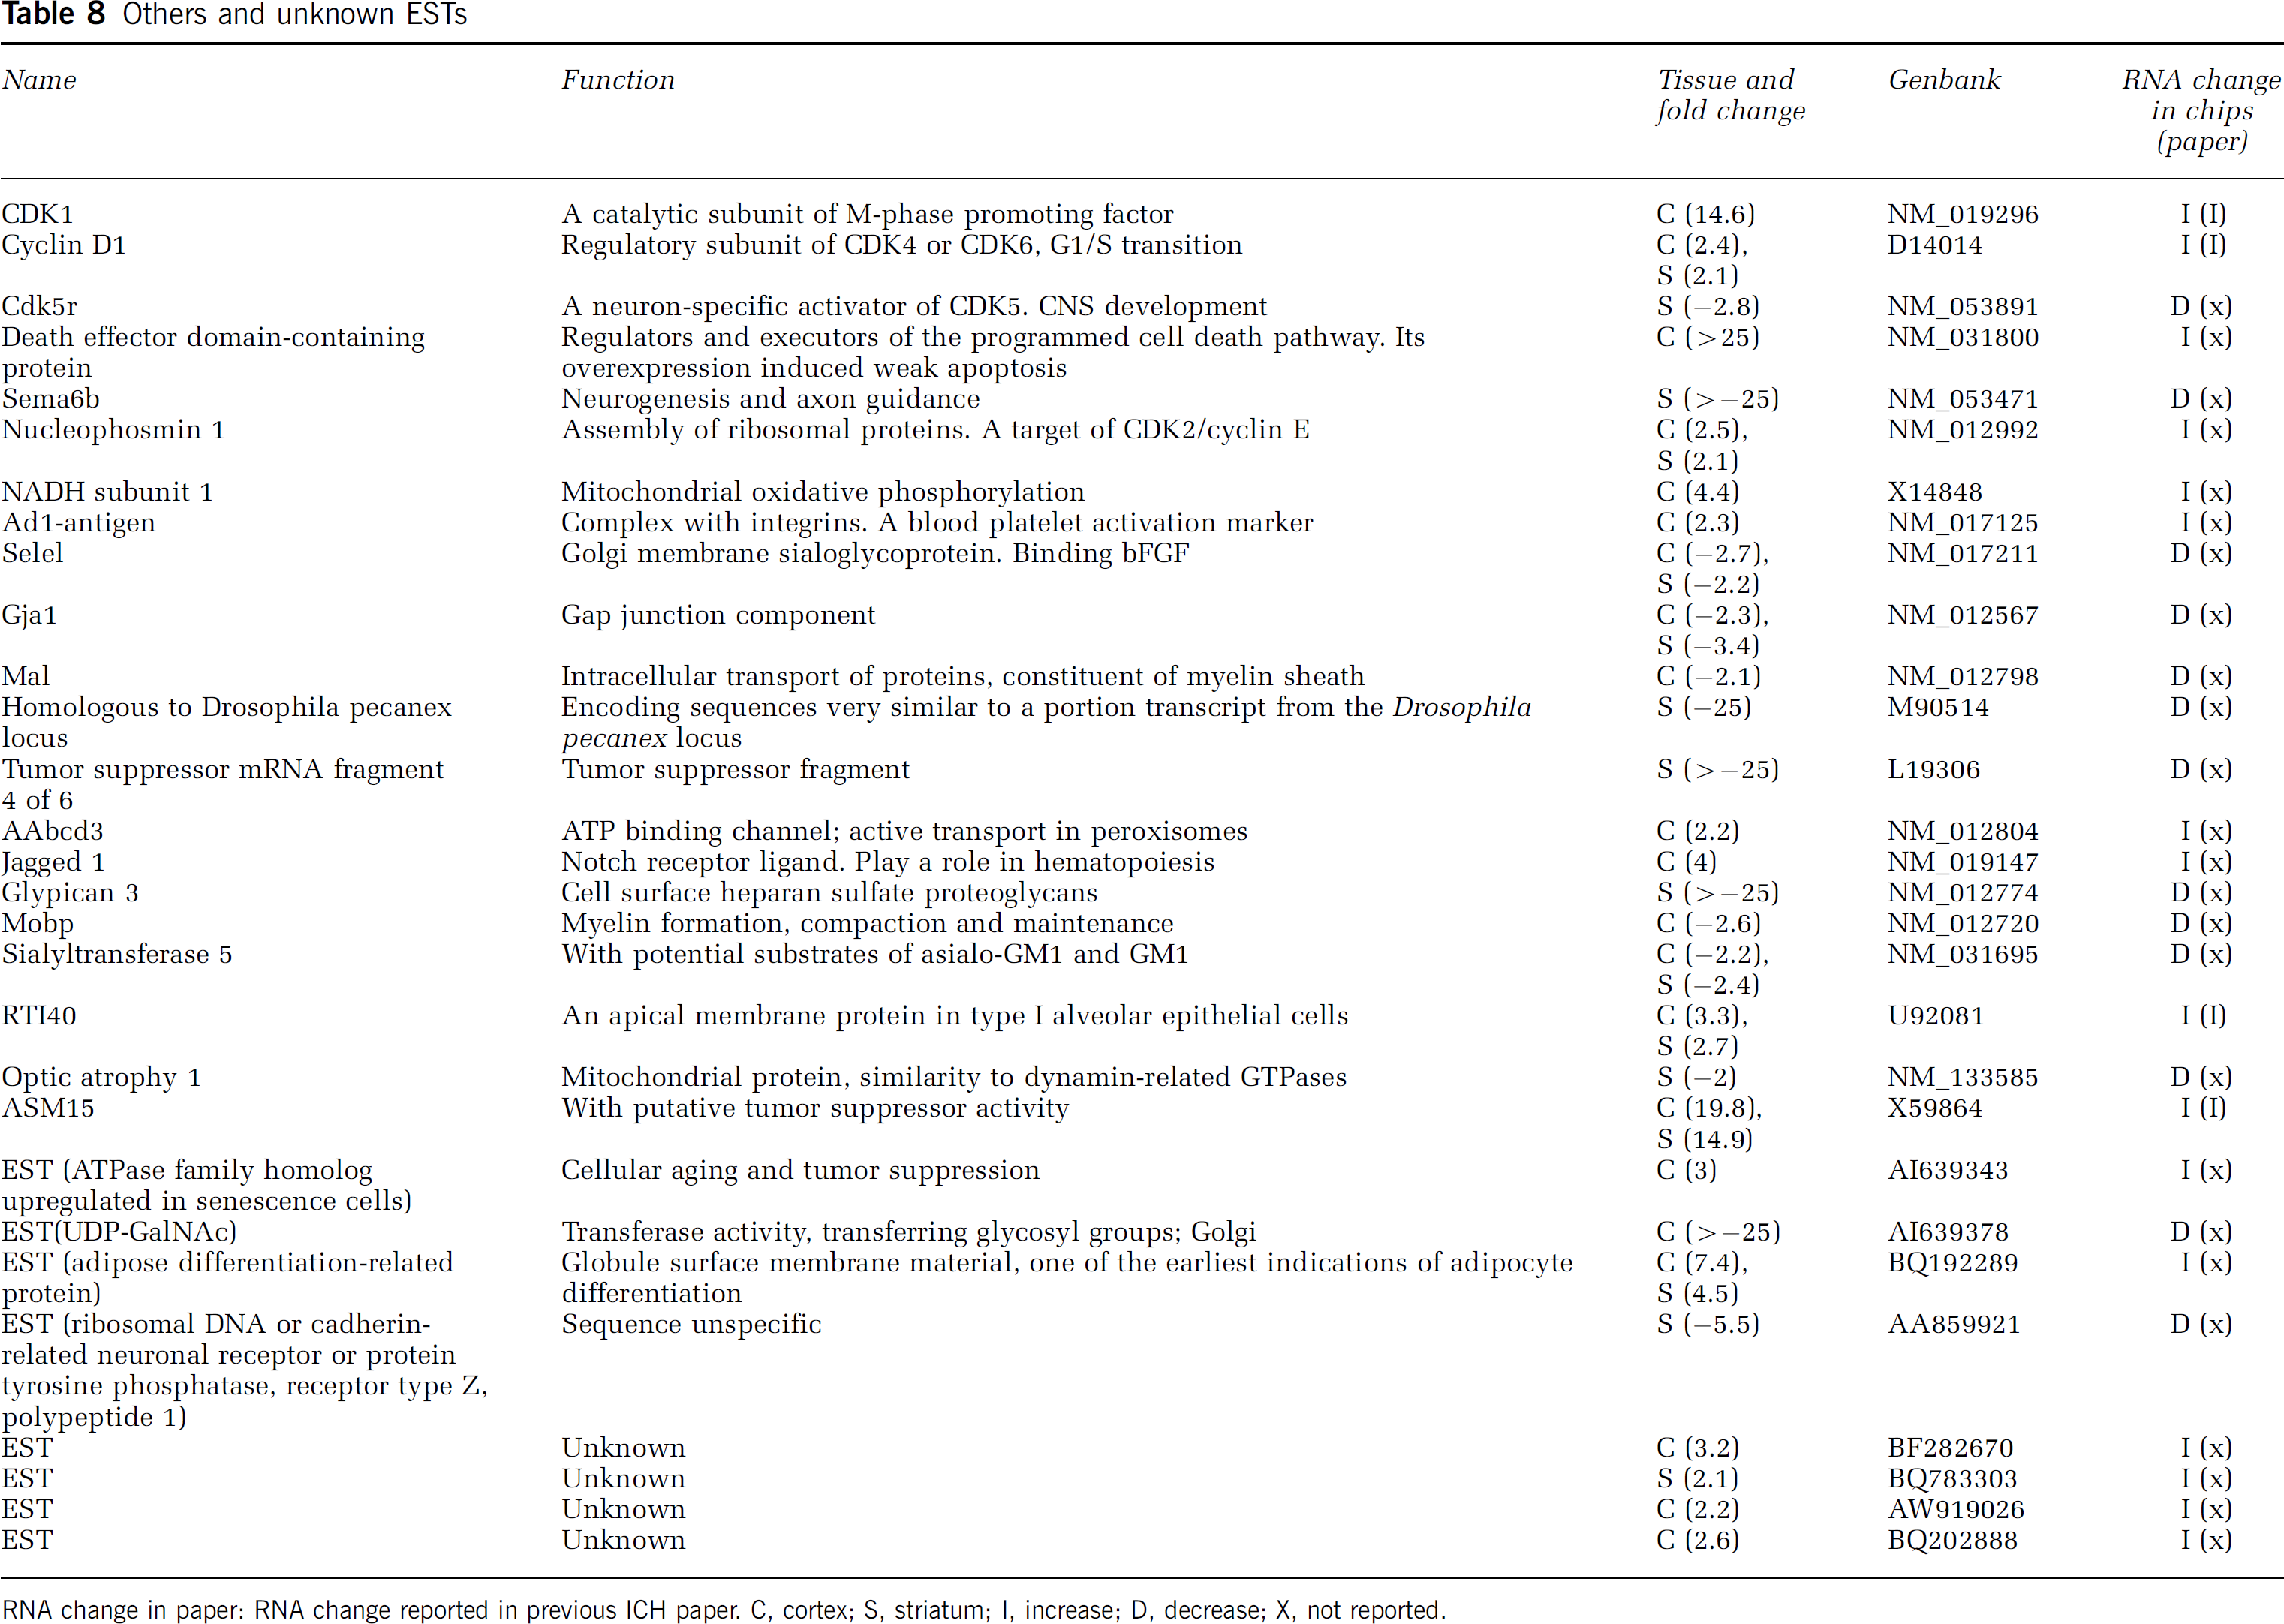
RNA change in paper: RNA change reported in previous ICH paper. C, cortex; S, striatum; I, increase; D, decrease; X, not reported.
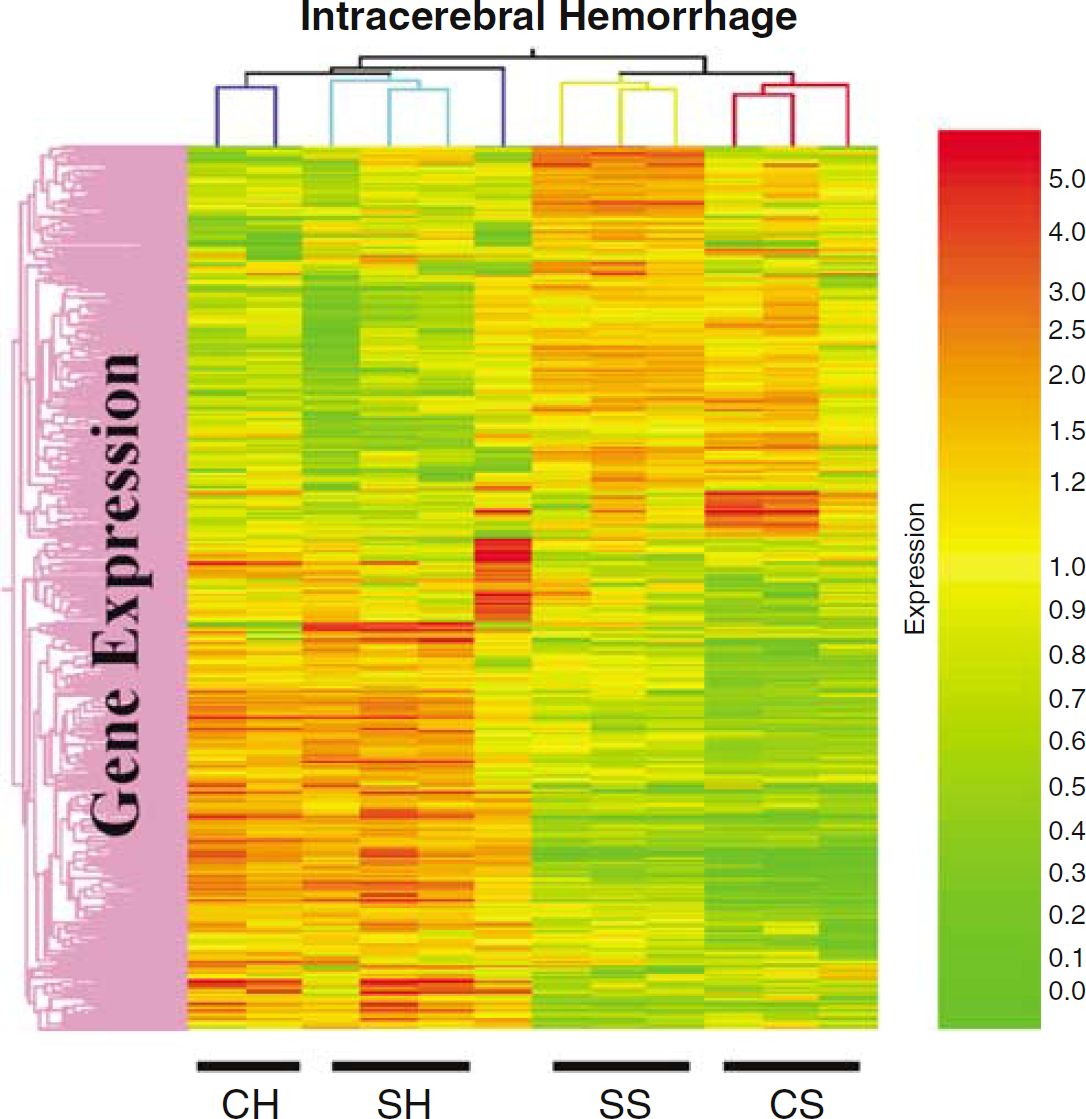
Hierarchical cluster analysis of regulated genes in brain after intracerebral hemorrhage (ICH: cortex hemorrhage (CH) and striatum hemorrhage (SH)) compared with sham (S: striatum sham (SS) and cortex sham (CS)) surgery. Red represents threefold increases of expression compared with the means, and green indicates threefold decreases of expression compared with the means. Individual brain samples are shown on the X-axis. The expression from three cortex samples (CH) and three striatal samples (SH) from three animals with ICH (blood infusions into the striatum) are shown on the left side of the cluster (CH and SH). The expression of three striatal samples (SS) and three cortex samples (CS) from three animals with sham surgery (saline infusions into the striatum) are shown on the right side of the cluster (SS and CS). Gene expression is displayed on the Y-axis. The cluster shows a group of genes that are generally decreased after hemorrhage compared with sham (upper left), and a group of genes that are generally increased after hemorrhage compared with sham (lower left).
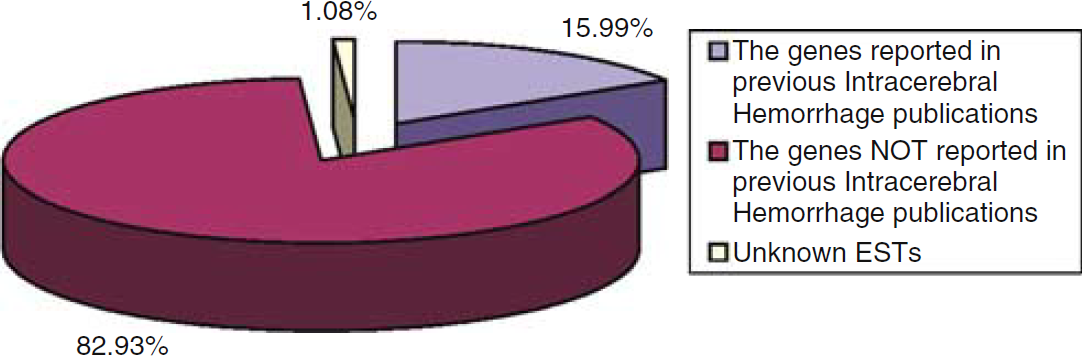
Pie chart that shows the percentages of genes regulated in the brain after intracerebral hemorrhage (ICH) in this study. The chart shows the proportion of genes reported in previous ICH studies (purple-blue), not reported in previous ICH studies (maroon) and the percentages of unknown expression sequence tags (ESTs) (yellow).
Functional Categories of Regulated Genes
After searches of Entrez Gene, OMIM, PubMed and Reference Gene Ontology, we divided the regulated genes into 15 different functional categories (Table 1). Although some categories are somewhat artificial because some genes fall into several categories, these categories help in assessing the large amount of data (Tables 1–8).
Gene groups related to metabolism, signal transduction, cell adhesion, motility, immune responses, neurotransmitters and hormones had the largest numbers of regulated transcripts (Table 1). The gene categories that showed the highest fold changes (more than fivefold) included enzymes/inhibitors, cytokines, chemokines, extracellular matrix, cytoskeletal proteins, growth factor, cell adhesion, motility, and immune response genes (Table 1). Many of the stress response, enzyme/inhibitor, and extracellular matrix-related genes had been reported previously, whereas many genes in other categories had not (Table 1).
Although most groups of genes were similarly regulated in the cortex and striatum, some were not. For example, although many metabolism and signal transduction-related genes were downregulated in the striatum, they tended to be upregulated in the cortex (Table 1). In contrast, most of the enzymes/inhibitors, cytokines, chemokines, cell adhesion, motility, immune response, and extracellular matrix-related genes were upregulated in both the striatum and cortex (Table 1). However, among neurotransmitter, hormone, G-protein, ion, vesicular transport, synaptic transmission, and growth factor-related genes, a half or more than half of the genes in these groups were downregulated in both the striatum and cortex (Table 1).
Enzymes Inhibitors, Metabolism-Related Genes
A number of enzymes and proteases were detected using microarrays including matrix metalloproteinase (MMP)-3 and gelatinase B (collagenase), tissue inhibitor of metalloproteinase (TIMP-1) (metalloproteinase inhibitor), annexin II (plasminogen receptor), and plasminogen activator inhibitor-1(PAI-1). Additional upregulated genes included MMP-14, urinary plasminogen activator (u-PA) receptor 1, caspase 1 (cysteine protease), and plasma protease C1 inhibitor (serine protease inhibitor) (Table 2).
Type II hexokinase (HK2) (rate-limiting enzyme in glycolysis) was highly upregulated in the cortex. Phosphofructokinase-M (PKF-M) (a rate-limiting enzyme in glycolysis) and brain glycogen phosphorylase (B-GP1) (rate-limiting enzyme in glycogen degradation) were downregulated in the striatum (Table 2). Several ribosomal protein genes and PHAS-I (translational negative regulation) were highly upregulated in the cortex. Subtilisinlike endoprotease (Pace4) (prohormone convertase) was downregulated in the striatum (Table 2). 3-Hydroxy-3-methylglutaryl-Coenzyme A reductase (Hmgcr), oxidosqualene lanosterolcyclase (steroid biosynthesis), and LDL-receptor (involved with cholesterol homeostasis) were downregulated in the striatum (Table 2). TBFII mRNA for polypyrimidine tract-binding protein (RNA binding, splicing, and processing), phosphodiesterase I (ENPP3) (ATPase and ATP pyrophosphatase activities), and uridine-cytidine kinase 2 (rate-limiting enzyme of the salvage pathway in pyrimidine synthesis) were highly upregulated in the cortex (Table 2). Heme oxygenase (HO-1) was upregulated in the striatum and cortex, whereas the rate-limiting step in heme biosynthesis, aminolevulinic acid synthase 1, was downregulated (Table 2).
Stress, Neurotransmitter and Hormone
Heat shock protein (Hsp)27, Hsp70, and other Hsp's were upregulated as previously reported in ICH (Gong et al, 2004; Matz et al, 1997). The DNA damage response gene GADD45, oxidative stress-related genes cytochrome b558 alpha-subunit (Cyba), glutathione S-transferase, theta 2 (Gstt2), and metallothionein were also upregulated (Table 3).
GluR-A, GluR-C (AMPA receptor subunits), glutamate receptor, ionotropic, N-methyl D-aspartate 1 (Grin 1) (subunit of NMDA-preferring ionotropic glutamate receptors), and GABA-A receptor alpha 4 subunit, beta-2, beta-3 subunit (ligand-gated chloride channel), GABA type B receptor (metabotropic GABA-B receptor) were all downregulated (Table 3). G-protein-coupled receptor kinase-interactor 1 (Git 1) (mediates beta-2-adrenergic receptor endocytosis), sulfotransferase family 1A, phenol-preferring, member 1 (Sult1a1) (catalyzes sulfate conjugation of catecholamines), cathechol-O-methyltransferase (catalyzes degradation of catecholamine transmitters), dopamine receptor 2, 5-hydroxytryptamine receptor 2C (Htr2c), and cholinergic receptor, muscarinic 1, were also downregulated. Gamma atrium natriuretic polypeptide gamma-rANP and lipocortin 1 (inhibiting phospholipase A2 and antiinflammation) were up regulated (Table 3).
Growth Factor, Cytokine, Chemokine
Most growth factors and/or their receptors were downregulated after ICH. Vascular endothelial growth factor (VEGF), fibroblast growth factor (FGF) receptor 2b, and keratinocyte growth factor receptor were downregulated. Bone morphogenic protein 3 (BMP-3) was upregulated (Table 4).
Interleukin-1-beta, macrophage inflammatory protein-1alpha, chemokine (C-X-C motif) ligand 2 (Cxcl2), immediate-early serum-responsive JE gene, gro, and calgranulin A were highly upregulated in the striatum and cortex. CC chemokine receptor was highly upregulated in the striatum. Tumor necrosis factor receptor was also upregulated in the striatum and cortex (Table 4).
Signal Transduction, G-protein-Related Genes, and Transcriptional Regulation
Calcium channel, voltage-dependent, alpha 1A subunit (Cacna1a), calcium channel, voltage-dependent, alpha2/delta subunit 1 (Cacna2d1), and inositol 1,4,5-trisphosphate receptor (IP-3-R) (IP3-dependent calcium influx) were downregulated (Table 5). Plasma membrane Ca2+ ATPase-isoform 2 (Atp2b2) and ATPase, Ca2+ transporting and plasma membrane 1 (Atp2b1) (removes Ca2+ from eukaryotic cells) were also downregulated in the striatum. S-100-related protein, S-100 calcium-binding protein A4, and intracellular calcium-binding protein (MRP14) were upregulated. Nitric oxide synthase 2 (inducible), SOCS-3 (negative regulator in the JAK-STAT pathway), and Lyn protein nonreceptor kinase (Src-related tyrosine kinase) were highly upregulated. Phosphatidylinositol 3-kinase (PI3K), regulatory subunit, polypeptide 2 (Pik3r2) (regulate PI3K activity), 3-phosphoinositide-dependent protein kinase-1 (Pdpk1) (phosphorylation and activation of Akt), and murine thymoma viral (v-Akt) oncogene homolog 2 (Akt2) were downregulated (Table 5).
G-protein genes have not been studied previously after ICH (Table 5). Highly downregulated transcripts included DLP1 splice variant 4 (microtubule-associated force-producing protein that is able to bind and hydrolyze GTP), ADP-ribosylationlike 2 (Arl2) (small GTP-binding proteins mediates Ca2+-dependent release of acetylcholine) and regulator of G-protein signaling 9 (Rgs9) (suppresses the activity of G-proteins by promoting their deactivation) (Table 5). In contrast, isoprenylated 67 kDa protein (guanylate-binding protein 2, interferon inducible) was highly upregulated in the striatum (Table 5).
FSH-regulated protein (KLF4) (works with Sp1 to activate the Laminin gamma1 chain gene), zinc-finger protein (activates transcription from the collagen alpha (I) promoter), C/EBP-beta, and C/EBP-delta (regulation of genes in immune and inflammatory) were highly upregulated. GAS-7 protein (neuronal development) and scaffold attachment factor B (Safb) (regulation of the Hsp27 transcription) were highly downregulated (Table 5).
Extracellular Matrix, Cytoskeletal
Osteopontin, a ligand of integrin and CD44, was highly expressed along with tenascin (ligand of integrins), syndecan (receptor of extracellular matrix), and fibronectin (fn-1) gene. Lysyl oxidase (protein modification of extracellular matrix) was downregulated (Table 6). Reversion-induced LIM gene (binds alpha-actinin, actin stress fiber turnover), moesin (crosslinkers between plasma membranes and actin-based cytoskeletons) and alpha-tubulin (microtubule protein) were highly upregulated. Neuraxin (microtubule assembly, neurogenesis) was highly downregulated (Table 6).
Ion, Vesicular Transport, and Synaptic Transmission
Genes related to potassium channels were down-regulated (Table 6), such as potassium voltage-gated channel, shaker-related subfamily, beta member 2 (Kcnab2); potassium voltage-gated channel, Shaw-related subfamily, member 2 (Kcnc2); Na+, K+-ATPase alpha2 subunit; and potassium inwardly rectifying channel, subfamily J, member 10 (Kcnj10) and potassium intermediate/small conductance calcium-activated channel, subfamily N, member 3 (Kcnn3). Transferrin receptor was downregulated in the cortex and ceruloplasmin (ferroxidase, iron efflux) increased in the striatum and cortex. Secretory protein rsec8 (Golgi-to-plasma membrane vesicle trafficking), neuroligin 3 (the formation and remodeling of CNS synapses) and brain-enriched guanylate kinase-associated (BEGAIN) (binds the guanylate kinase domain of PSD-95/SAP90) were also highly downregulated (Table 6).
Cell Adhesion, Motility, and Immune Response
CD44 (cell surface receptor, cell adhesion, and lymphocyte activation), Fc-gamma receptor (receptor for the Fc region of immunoglobulins gamma), MHC class II alpha chain RT1.D alpha, and MHC class II antigen RT1.B beta chain (antigen presentation), immunoglobulin superfamily, member 6 (Igsf6) (immune response), orosomucoid 1 (acute-phase plasma protein, immunosuppression, and acute inflammation), and complement component C3 (activation of complement system) were highly upregulated (Table 7). Neuroglycan (a membrane proteoglycan that mediates adhesion of Schwann cells to alpha4 type (V) collagen) and transmembrane receptor Unc5H1 (netrin-1 receptors mediating the chemorepulsive effect of netrin-1 on specific axons) were downregulated (Table 7).
Others, Unknown ESTs
CDK1 (catalytic subunit of the M-phase promoting factor), death effector domain-containing protein (regulators and executors of the programmed cell death pathway) and ASM15 (tumor suppressor activity) were markedly upregulated (Table 8). Semaphorin 6B (Sema6b) (neurogenesis and axon guidance), tumor suppressor mRNA fragment 4 of 6 (tumor suppressor fragment), and glypican 3 (cell surface heparan sulfate proteoglycans) were markedly downregulated (Table 8). There were four ESTs regulated by ICH, which did not match any gene sequence using Blast (Table 8).
Real-Time RT-PCR
Real-time RT-PCR was performed on four selected genes in the striatum and cortex at 24 h after the infusion of lysed autologous blood into the striatum (Figure 3). The genes were chosen based on their role in inflammation and cell survival. The PCR results showed good agreement with the corresponding microarray data. The real-time RT-PCR confirmed marked upregulation of IL-1-beta, and lesser upregulation of lipocortin 1 and metallothionein 1,2 (Figure 3). Decreased expression of one of the downregulated transcripts, a voltage-gated potassium channel—Kcnab2, was also confirmed (Figure 3).
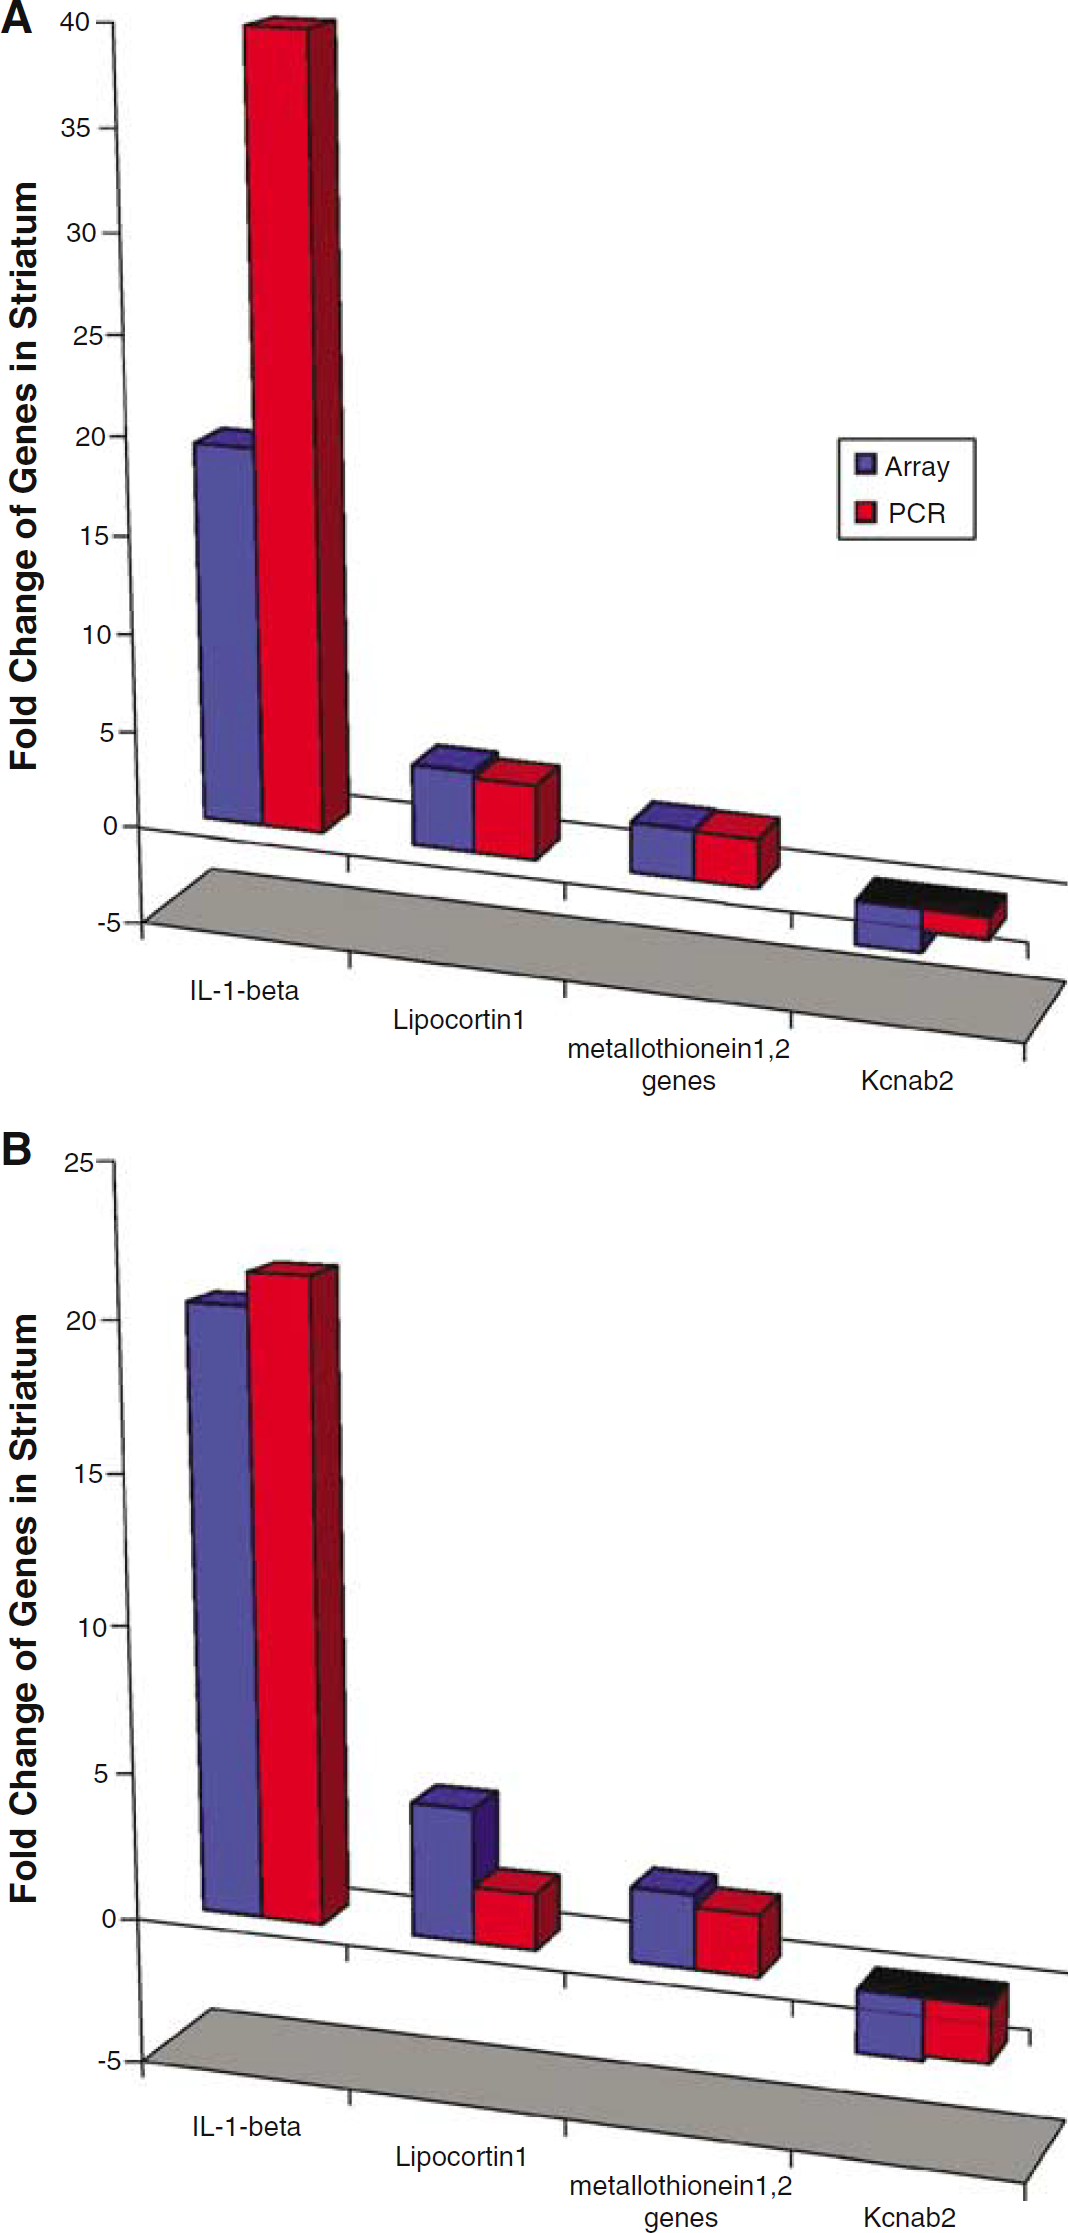
Fold changes of RNA expression for four selected genes after ICH compared with sham controls using quantitative, real-time reverse transcriptase-polymerase chain reaction (RT-PCR) as compared with the microarrays. (
Discussion
The current study focuses on ICH and the genes that are either highly regulated by ICH and/or that appear to be related to the pathophysiology of ICH. The identification, classification, and analysis of the specific genes and groups of genes should shed light on the molecular basis of injury after ICH.
Matrix metalloproteinases are a family of zinc-dependent endopeptidases that degrade all components of the extracellular matrix. Intracerebral hemorrhage increased expression of both MMP-3 and MMP-9 after ICH, confirming previous reports (Power et al, 2003). Matrix metalloproteinase-14 was also upregulated, which may contribute to the reported MMP-2 activation after ICH (Overall and Lopez-Otin, 2002). A component of the neutrophil gelatinase complex, lipocalin 2, was highly upregulated, although its role after ICH is not clear. Tissue inhibitor of metalloproteinase-1, one of the main natural inhibitors of the matrix metalloproteinases (Overall and Lopez-Otin, 2002), was also highly upregulated in the cortex and striatum after ICH. Although ICH upregulates expression of a number of the MMPs, the mechanism is uncertain. In vitro, thrombin induces endothelial cell contraction and enhances expression of MMP-2 protein (Guan et al, 2004). Thrombin is involved in clotting after ICH, and has been shown to play a major role in the early edema formation after ICH (Xi et al, 1998b, 2002b, 2003). Our genomic data also show that u-PA receptor and annexin II were upregulated by ICH. Annexin II is a plasminogen receptor and can regulate cell surface plasmin (Kwaan et al, 2004). Both u-PA and the plasmin system could contribute to MMP activation after ICH. In patients after ICH, the increases of plasma MMP-9 correlate with perihematoma edema (PHE) and the development of neurological worsening during the acute stage, and are significantly higher in patients with early growth of ICH. Tissue inhibitor of metalloproteinase-1 negatively correlated with PHE, and both MMP-9 and MMP-3 correlated with the residual scar volume at 3 months (Abilleira et al, 2003; Silva et al, 2005; Alvarez-Sabin et al, 2004). In a rat model of ICH using bacterial collagenase, the time frame in which increases of MMP-9 levels occur corresponds to ICH-related edema formation. The administration of an MMP inhibitor, BB-1101, decreased edema formation (Rosenberg and Navratil, 1997). Intracerebral hemorrhage also increased brain MMP-12 mRNA levels around a hematoma. Blocking MMP-12 with minocycline, or reducing MMP-12 levels in knockout mice, decreased glial activation and apoptosis and improved neurobehavioral outcomes after ICH (Power et al, 2003; Wells et al, 2005). The genomic data confirm induction of MMPs, and the previous literature affirms the important role of MMPs in the pathogenesis of ICH-related injury.
Although MMPs appear to be important contributors to ICH-related edema, the genomic data suggest additional mechanisms as well. The gamma atrium natriuretic polypeptide was markedly upregulated in cortex. In one experimental ischemic brain edema study in rats, the intracerebroventricular administration of atrium natriuretic polypeptide decreased brain water and sodium content (Gutkowska et al, 1997). It is possible that increased atrium natriuretic polypeptide expression after ICH could represent an endogenous antiedema response in the brain.
The expression of PFK-M, a rate-limiting enzyme in glycolysis, markedly decreased in the striatum. In contrast, expression of the HK2 gene for type II hexokinase, another rate-limiting enzyme in glycolysis, markedly increased in adjacent cortex after ICH in the current study. We recently showed that 2-deoxyglucose uptake decreased in the core of an intracerebral hematoma, whereas glucose metabolism increased in the perihematoma region (Ardizzone et al, 2004). The areas of increased glucose metabolism around the ICHs were blocked by pretreatment with the glutamate receptor antagonists MK-801 and NBQX (Ardizzone et al, 2004). Hence, the decrease of PFK in the hematoma core in the present study correlates with decreased glucose metabolism in the hematoma core in our previous study. Moreover, increased expression of hexokinase and increased glucose metabolism in perihematoma brain appears to be related to glutamate actions on glutamate receptors surrounding the ICH, which result in increased cell excitability and glucose utilization and could contribute to cell death and the pathophysiology of ICH (Ardizzone et al, 2004).
Increased HO-1 expression in the cortex and striatum is similar to that described in a previous study (Matz et al, 1997). Aminolevulinic acid synthase 1, the rate-limiting step in heme biosynthesis, decreased in the cortex. The heme oxygenases, including HO-1, metabolize heme to biliverdin and carbon monoxide and release iron. The iron is sequestered in ferritin and hemosiderin (Wagner et al, 2003). Free iron and iron oxidation increase oxidative stress (Hall et al, 2000). Ferritin and hemosiderin accumulation were accompanied by a gradient of destruction of neuronal cell bodies and dendrites in the perifocal reactive zone in a rabbit ICH model (Koeppen et al, 2004). Notably, ceruloplasmin expression (iron efflux) increased in the striatum and cortex. Transferrin receptor RNA was downregulated in the cortex. The expression of microsomal glutathione S-transferase 1 (Mgst1), Gstt2, and metallothionein-2 and metallothionein-1 genes increased. They likely represent antioxidative defense responses to the iron.
The IL-1-beta gene, Cxcl2, gro, and Nos2 genes were markedly induced in the striatum and cortex after ICH, and along with upregulated MMP-9, are all target genes of NF-kappa B (Sharp et al, 2000). Tumor necrosis factor (TNF) receptor 1a (TNFR1a) and lectin, galactose binding, soluble 1 (Lgals1) were both upregulated after ICH, and both can activate NF-kappa B (Sharp et al, 2000). These genomic data are consistent with previous studies that show NF-kappa B activation in ipsilateral striatum from 2 h to 4 days after ICH, and that NF-kappa B activation colocalized with cells containing fragmented DNA (Hickenbottom et al, 1999). Hence, activation of NF-kappa B and downstream regulation of NF-kappa B target genes could contribute to inflammation and apoptosis after ICH (Hickenbottom et al, 1999; Sharp et al, 2000).
A large number of other immune modulatory genes are also induced after ICH, probably in response to foreign blood proteins in brain. Caspase 1 and IL-18 are markedly upregulated in the cortex and striatum after ICH, caspase 1 playing a role in the activation of proinflammatory cytokine IL-1-beta (Martinon and Tschopp, 2004). Intracerebral hemorrhage also induced a number of chemokine-related genes, including macrophage inflammatory protein-1alpha, immediate-early serum-responsive JE gene, small inducible cytokine A4, chemokine receptor (Cxcr4) and CC chemokine receptor protein. Many other immune response genes were also induced by ICH: glycoprotein CD44, Hck hemopoietic cell kinase, CD48 antigen, MHC class II antigen, complement component 1, ‘s’ subcomponent and complement component C3. These data are consistent with previous studies, and help understand how inhibiting the immune system and depleting complement reduce brain edema and improve behavioral outcome afterexperimental ICH (Peeling et al, 2001; Xi et al, 2001, 2002a).
Although the role of cell death around ICH on behavioral outcomes is still under study, there is evidence for prominent apoptotic cell death and necrosis as well (Nakashima et al, 1999; Matsushita et al, 2000; Qureshi et al, 2001a, 2003; Felberg et al, 2002). The cell death around ICH has been attributed to mass effect (Nakashima et al, 1999), toxicity of hemoglobin and hemin (Levy et al, 2002), TNF-alpha increase (Mayne et al, 2001a, b), NF-kappa B activation (Hickenbottom et al, 1999), cytochrome c increase (Felberg et al, 2002), caspase activation (Matsushita et al, 2000), and MMP expression and activation (Power et al, 2003). All of these mechanisms may play a role, and many are supported by this study.
The data from this study also points to possible detrimental effects of downregulation of growth factors, growth factor receptors and prosurvival signaling pathways on decreased cell survival after ICH. Transcripts for VEGF, FGF receptor 2b, keratinocyte growth factor receptor and TrkC (receptor tyrosine kinase for neurotrophin-3) were downregulated. Signaling molecules were also downregulated, including Pik3r2 (regulate PI3K activity), Pdpk1 (phosphorylation and activation of Akt1), and Akt2. Vascular endothelial growth factor, FGF, and neurotrophins can activate the PI3K/c-Akt kinase cascade. Akt phosphorylates many apoptosis-related genes and promotes cell survival (Datta et al, 1999; Yuan and Yankner, 2000). The downregulation of growth factor-related genes and inhibition of the PI3K-Akt pathway may represent a mechanism, in addition to those mentioned above, that also contributes to cell death after ICH.
The 30-day risk of seizures in patients with ICH is approximately 8%, with most seizures occurring within the first 24 h. The seizures appear to worsen the neurological deficits (Rincon and Mayer, 2004; Qureshi et al, 2001b). The molecular mechanisms of ICH-related seizures are unclear. Our genomic data show that genes related to GABA metabolism and receptors were downregulated, which would likely decrease inhibitory functions of GABA. In addition, a large number of genes related to potassium channels were downregulated, and if this down-regulation were to act like mutations of potassium channel genes, the net result would likely be an increase in brain excitability (Elger, 2005) and presumably an increase in the risk for seizures. It is notable that several studies from Lyden and colleagues have shown that GABA agonists improve outcomes after experimental ICH (Lyden et al, 1997, 2000). The combined data suggest that GABA receptor function is decreased after ICH, and GABA receptor activation could be of benefit after ICH. Future studies will be required to confirm these changes of RNA expression at the protein level, and to begin to relate these to ICH pathophysiology.