
Abstract
Transient middle cerebral artery occlusion (MCAO) by an intraluminal thread leads to primarily subcortical infarctions with little sensorimotor impairment in the Wistar rat strain. We investigated the course of infarct development in this lesion type for 10 weeks using magnetic resonance imaging (MRI) along with histological characterization. MCAO was induced in male Wistar rats (260 to 300 g) for 60 mins. Animals received follow-up T1- and T2-weighted MRI from day 1 until week 10. Separate groups of animals were analyzed histologically after 2, 6, and 10 weeks. Histology included immunohistochemistry for neuronal and astrocytic markers as well as hematoxylin eosin and luxol fast blue-cresyl violet staining. In contrast to lesions involving the cortex, exclusively subcortical infarctions were characterized by a complete resolution of initially increased T1 and T2 relaxation times by 10 weeks. Between 2 and 10 weeks, neuronal death and gliosis as well as a dense inflammatory infiltrate were evident in these lesions, without damage to fiber tracts or development of cystic cavities. Exclusively subcortical lesions in Wistar rats are characterized by normalization of T1 and T2 relaxation times, which might, however, not be mistaken for tissue recovery. Despite this MRI normalization, selective neuronal death and gliosis develop. Although MRI at individual time points might therefore be ambiguous, the temporal profile of relaxation time changes over the chronic time period allows discrimination of the lesion development into selective neuronal death or pannecrosis.
Keywords
Introduction
A number of animal models have been developed to investigate cerebral ischemia under experimental conditions. One of the most widely applied methods is the middle cerebral artery occlusion (MCAO), performed by transiently blocking the arterial blood flow with a removable thread (Koizumi et al, 1986) or clip, or by permanently occluding the artery (e.g., by ligation or electrical cauterization of the vessel) (Hossmann, 1998). Apart from the surgical approach, development of tissue injury is also influenced by animal strain and age as well as occlusion time.
The Wistar rat strain is known to have a rich network of cerebral vascular collaterals, especially at the proximal segment of the MCA (Herz et al, 1996). Earlier studies with transient (60 mins) MCAO in our group have shown the appearance of two distinctly different lesion types on magnetic resonance imaging (MRI) in these rats: in one case the lesion is restricted to the caudoputamen (with focus on the dorsolateral striatum), in the other case it is involving both caudoputamen and cortex (Wegener et al, 2005). These lesion types led to distinctly different behavioral patterns: while animals with lesions encompassing also the cortex presented with significant loss of sensorimotor function, exclusively subcortical lesions did not cause sensorimotor deficits. The latter was not anticipated, because the dorsolateral striatum is the main striatal area receiving input from the somatosensory cortex and projecting to the substantia nigra, and has been proven an important structure for sensory and motor function in the rat (Sabol et al, 1985; Whishaw et al, 1986).
We therefore investigated whether, exclusively subcortical lesions induced by the intraluminal suture technique for 60 mins in Wistar rats represent a different kind or degree of ischemic damage, and whether this would be discernible by a specific pattern on follow-up MRI. By addressing these questions, we wanted to assess the widely accepted MRI parameters T1 and T2 for their reliability of detection and demarcation of chronic ischemic lesions. We found a lesion type-specific dissociation between relaxation time changes and histologically detected lesion, which might be of relevance for future diagnosis of ischemic lesions, and, consequently, for prediction of tissue fate.
Materials and methods
Animal Model
All experiments were performed in accordance with the National Institutes of Health animal protection guidelines and approved by the local governmental authorities. Adult male Wistar rats (n = 14) weighing 260 to 300 g were used. Body weight (BW) was recorded every other day. For MRI and surgery, animals were anesthetized using facemask inhalation of 1.5% halothane in a 2:1 N2O:O2 atmosphere. Temperature was maintained at 37°C by a feedback-controlled heating pad. Focal ischemia was induced for 60 mins by intraluminal thread occlusion as described previously (Koizumi et al, 1986). In short, a 4-0 silicone-coated filament was introduced into the common carotid artery and advanced approximately 16 to 20 mm from the carotid bifurcation, until ipsilateral laser-Doppler flowmetry (LDF) indicated a marked drop in perfusion. Animals were reanesthetized for repetitive MRI after MCAO: MRI assessment was performed at the following time points: day 1 (D1), week 1 (W1), week 2 (W2), and week 10 (W10) after MCAO. Two animals (depicted in Figure 1) received additional MRI assessment at weeks 4 and 5. Animals were grouped as follows. Group A: exclusively caudoputaminal lesions (cp) on T2-weighted (T2-w) MRI at D1 with complete MRI assessment until W10 (n = 5), followed by killing. Group B: lesions involving caudoputamen and cortex (cp+) on T2-w MRI at D1 with complete MRI assessment until W10 (n = 3), followed by killing. Group C: cp lesions on T2-w MRI at D1 with survival for 2 weeks (n = 3). Group D: cp lesions on T2-w MRI at D1 with survival for 6 weeks (n = 3). Groups A and B were also control groups for another study and received subcutaneous injections of cyclosporine A (CSA; 10 mg/kg BW) every other day, starting 14 days after MCAO. We found consistent results regarding infarct evolution in these groups as compared with groups C and D and earlier observations, and therefore did not find killing of further animals justified. Potential implications of CSA injections on our results are discussed.
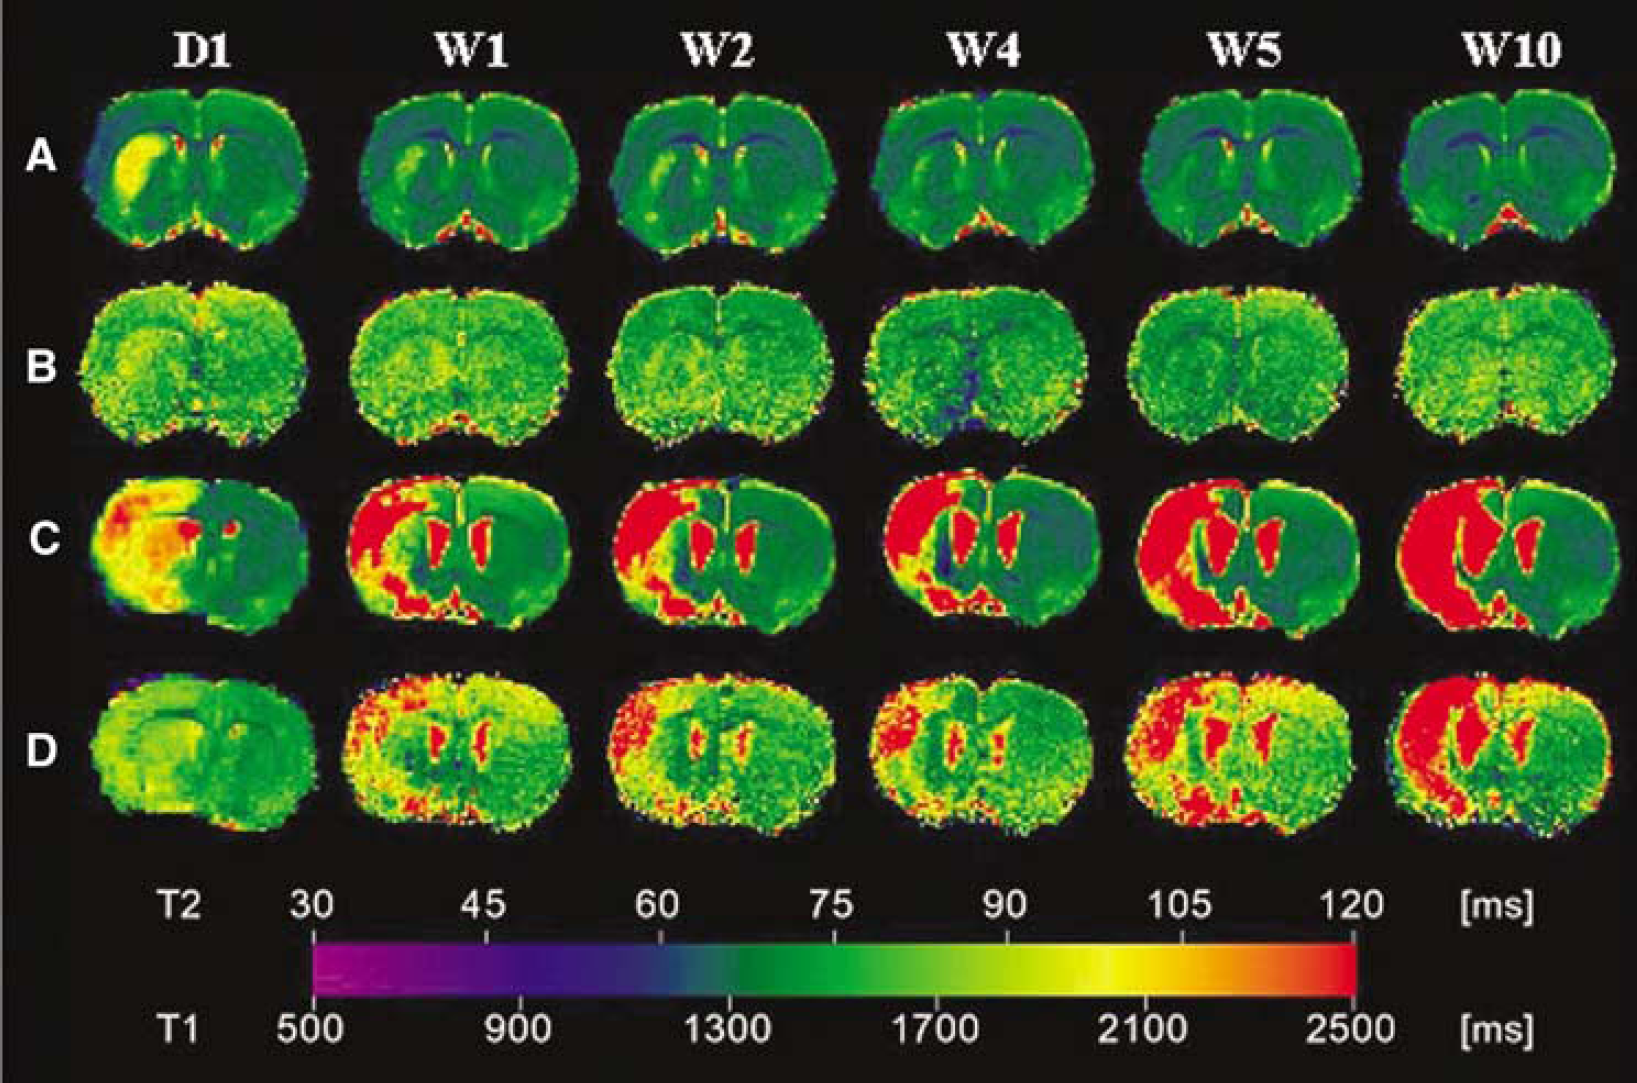
Follow-up MRI of an animal with exclusive caudoputaminal lesion (cp, panels
Magnetic Resonance Imaging (MRI)
Magnetic resonance imaging measurements were performed on a 4.7-T BioSpec animal scanner with a 30 cm bore magnet (Bruker BioSpin, Ettlingen, Germany), equipped with actively shielded gradient coils (100 mT/m; rise time >250 μs). Rf transmission was achieved with a Helmholtz coil (diameter 12 cm) and the signal was detected with a 22 mm diameter surface receiver coil, positioned above the skull of the animal. Gradient-echo fast-imaging pilot scans were used for accurate positioning of the animal's head in the magnet.
Quantitative T1 and T2 measurements were performed using a modified Carr—Purcell—Meiboom—Gill multi-slice spin-echo sequence, as described else where (Eis and Hoehn-Berlage, 1994). Basically, a train of 16 echoes (TR1/TE = 3000/12.5 ms), followed by a second train of four echoes with a short TR time (TR2/TE = 680/12.5 ms), were acquired. FOV = 4 × 4 cm2, matrix = 128 × 128, slice thickness = 1.2 mm, and interslice distance = 1.5 mm.
Image Analysis
MR images were analyzed offline using Image J (Rasband, WS, Image J, NIH, Bethesda, MD, USA). Quantitative T2 maps were calculated by fitting pixel intensities of the multislice multiecho images (16 echoes, TE = 12.5 ms) to a monoexponential decay curve, on a pixel-by-pixel basis, using self-developed routines in IDL (RSI, Boulder, CO, USA). Quantitative T1 maps were calculated using both T1-weighted (T1-w) and T2-w data sets with an extended saturation-recovery model (Eis and Hoehn-Berlage, 1994). Backextrapolation of both multiecho trains led to their respective M0 value, which was then entered into a (signal-to-noise weighted) saturation-recovery fitting procedure to obtain the T1 relaxation time value.
For analyses of regions of interest (ROIs), small rectangular ROIs were placed on quantitative T1 and T2 maps on the ipsilateral dorsolateral striatum, the overlying cortex, and homologous regions on the contralateral hemisphere. Means and standard deviations of relaxation times (T1, T2) were analyzed within the ROIs.
Histology
Rats were killed under deep halothane anesthesia by transcardial perfusion fixation with 0.1 mol/L phosphate-buffered saline (PBS), followed by 4% formalin in phosphate buffer. Brains were removed, immersed in 4% formalin in phosphate buffer overnight and transferred to 30% sucrose solution for at least 3 days.
Coronal 40-μm-thick sections were cut on a freezing microtome (Leica, Nussloch, Germany). Premounted sections were stained with hematoxylin eosin (HE) or with luxol fast blue and cresyl violet. For the latter, luxol fast blue solution was incubated over 1.5 h, washed in 95% alcohol, rinsed in deionized water, and differentiated in 0.05% lithium carbonate for 6 secs followed by 70% alcohol for 2 mins. Sections were then incubated in cresyl violet for 10 mins.
Immunohistochemistry was performed to stain for neurons and glia cells in the lesion area. Primary antibodies were diluted as follows: mouse anti-NeuN (Chemicon, Hofheim, Germany) 1:100 and guinea-pig anti-GFAP (Advanced Immunochemicals, Long Beach, USA) 1:1000. The Vectastain ABC method (Vector Labs, Burlinghame, CA, USA) and 3,3’-diaminobenzidine (DAB) were used for visualization of primary antibody binding.
Statistical Analysis
Statistical analyses were conducted using SPSS v12.0 for Windows. Laser-Doppler flowmetry values and BW were compared by independent t-test. P-values below 0.05 were considered significant.
Results
Morphological Lesion Characterization
Occlusion of the MCA for 60 mins resulted in two distinctly different lesion types, characterized by their T2-w MRI at day 1 after stroke induction (Figure 1): lesions restricted to the caudoputamen (labeled as ‘cp’ group), and lesions involving both the caudoputamen and cortex (labeled as ‘cp’+’ group).
Physiological Parameters
Body weight after MCA was reduced to a minimum of 87.4% ± 4% in cp and 71.3% ± 10% in cp+ animals, relative to preischemic control values. After 10 weeks, cp animals had regained 125% ± 8.2% and cp+ animals 132% ± 16.1% of their preischemic BW. Cortical LDF measurements directly before and after insertion of the intraluminal thread showed a decrease of the regional blood flow over the ipsilateral hemisphere to 49.1% ± 13.0% in the cp, and 45.1% ± 13.0% in the cp+ group, respectively, after thread insertion. Both, BW and LDF values were not significantly different between animals with (cp+) or without (cp) cortical infarct involvement.
Magnetic Resonance Imaging Alterations in the Affected Tissue
Cp+ group: Lesions were visible as areas of cortical and subcortical signal increase on T2-w and signal decrease on T1-w images from day 1 to the last observation time point at week 10. At 10 weeks, the infarct was sharply demarcated with a homogeneously high T2 signal, while the hyperintense region was slightly reduced in size compared with day 1. By then, ventricular enlargement and hemispheric shrinkage had occurred ipsilateral to the lesion.
Cp group: In the cp group, subcortical signal decreases were observed on T1- and signal increases on T2-w images at day 1, with focus on the dorsolateral striatum. These signal changes consecutively normalized towards week 10. At this late time, a small, residual region of increased T2 signal was found only in one animal. Changes on T1-w images were very small, and not detectable any longer at the last observation time point. No signs of tissue loss due to the infarction, such as ventricular enlargement or hemispheric shrinkage, were observed at any time point.
Absolute T1 and T2 Times in the Lesions
T1 and T2 relaxation times derived from quantitative parameter maps on the unaffected, contralateral side corresponded to previously published values for normal tissue during the whole observation period (Table 1) (Hoehn-Berlage et al, 1995; van Dorsten et al, 2002). Both groups showed higher absolute T1 and T2 times within the lesioned area on parameter maps 1 day after MCAO (Figure 1).
T1 and T2 values of ROI
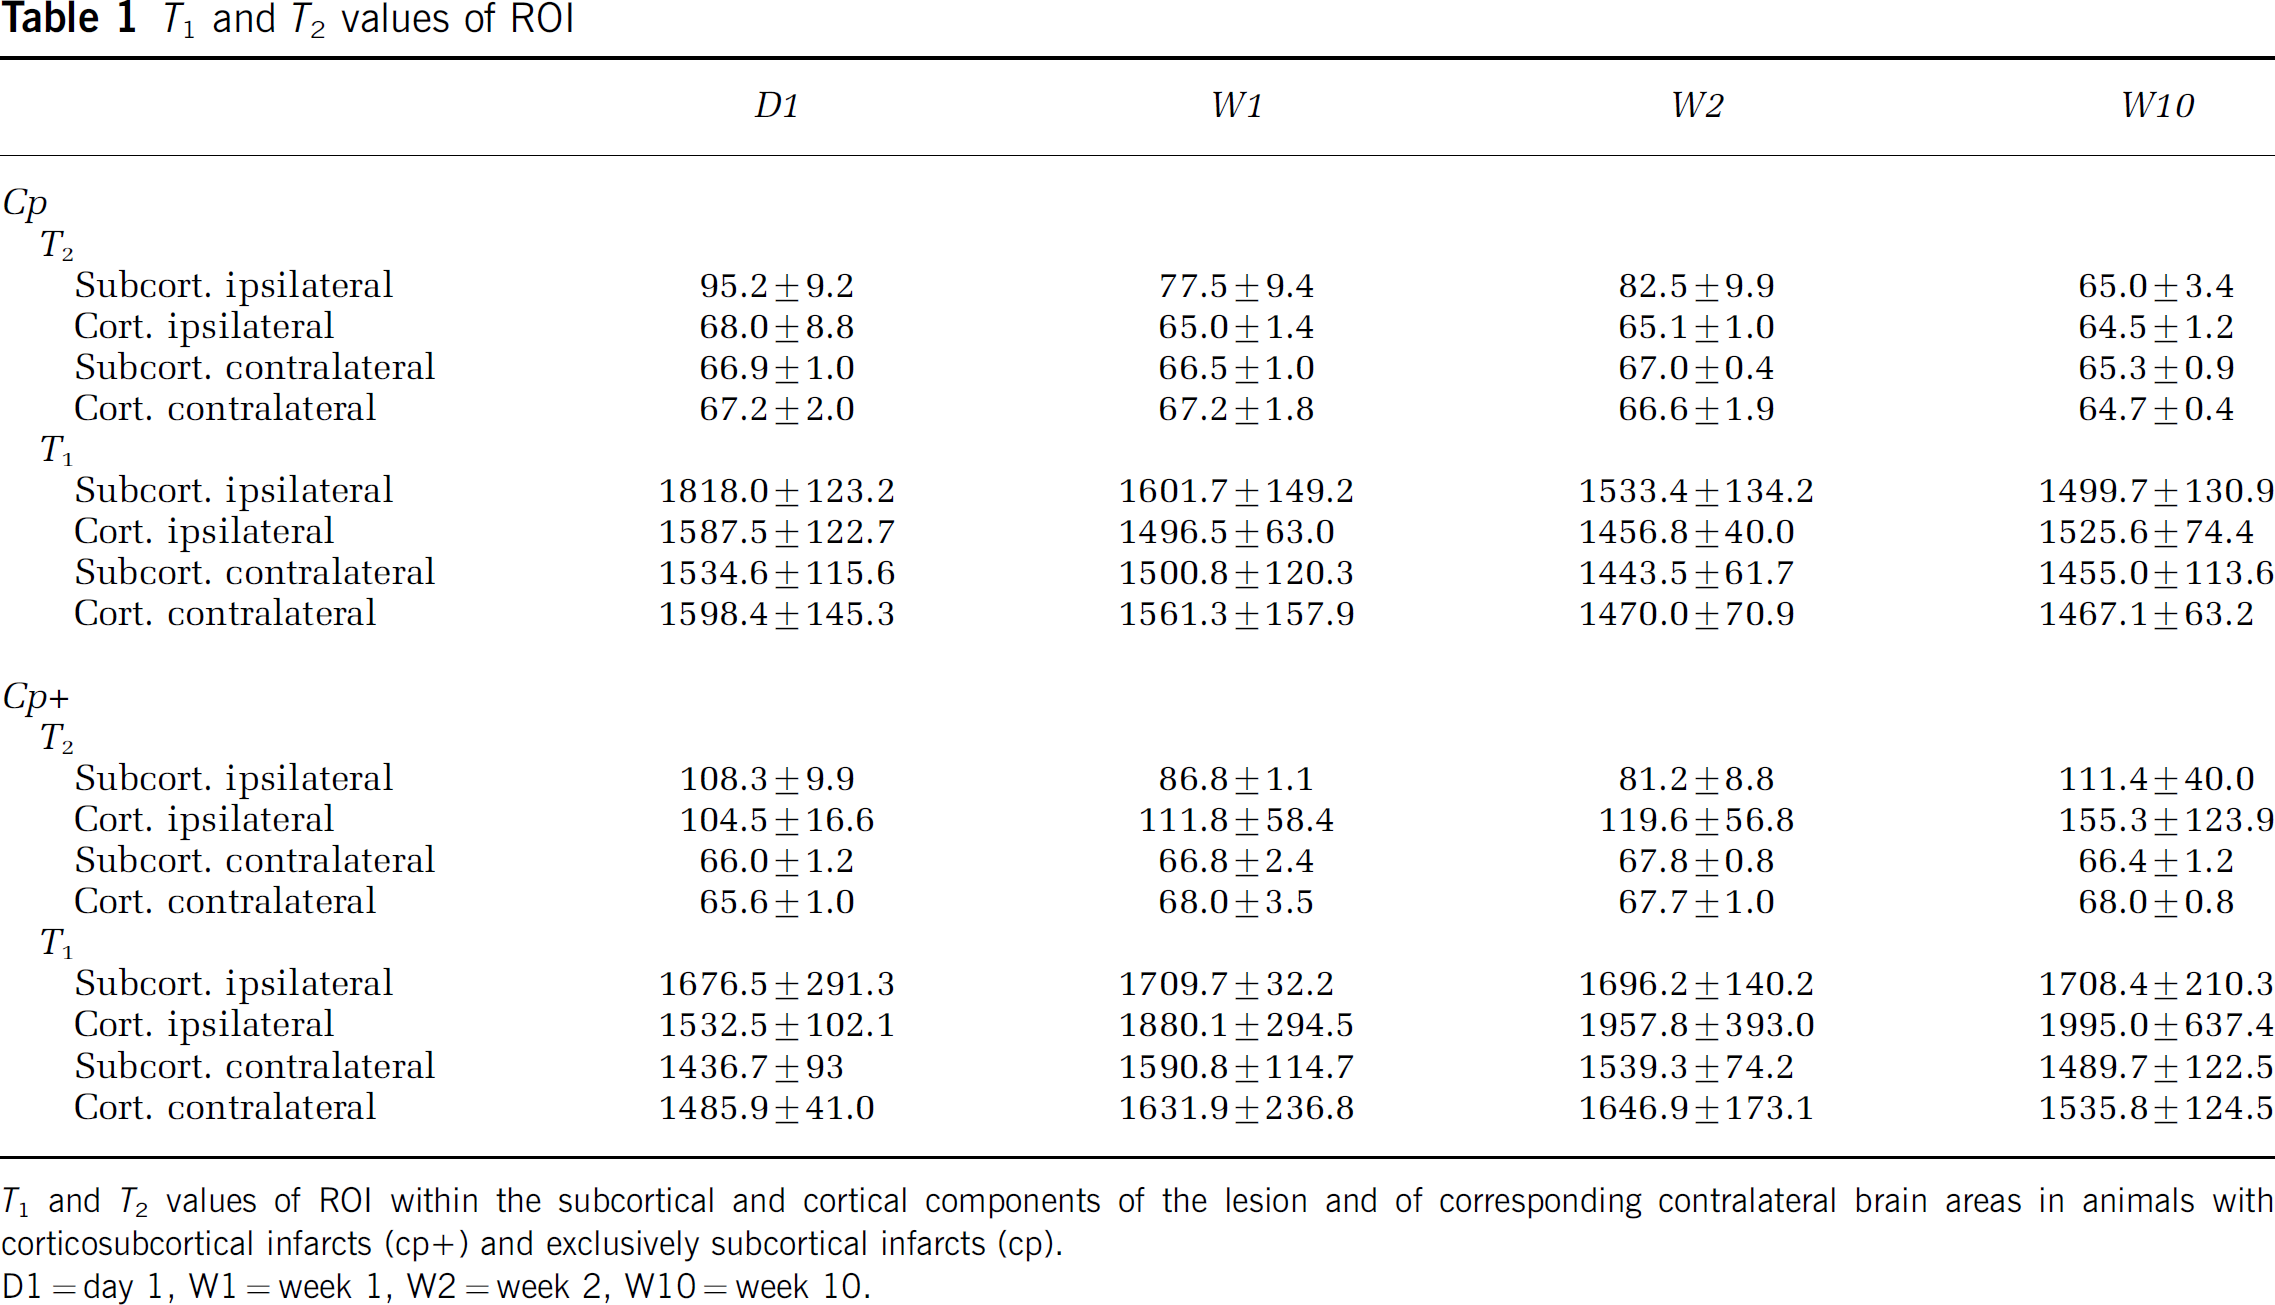
T1 and T2 values of ROI within the subcortical and cortical components of the lesion and of corresponding contralateral brain areas in animals with corticosubcortical infarcts (cp+) and exclusively subcortical infarcts (cp).
D1 = day 1, W1 = week 1, W2= = week 2, W10 = week 10.
Cp+ group (Figure 1B and Table 1): Region of interest analysis revealed that cortical T2 values had a tendency to rise from day 1 to 10 weeks after the MCAO. T2 values of the subcortical lesion area began to slightly decrease during the first 2 weeks, but then increased again towards week 10. Cortical T1 times increased between 1 and 2 weeks after MCAO and remained elevated until the final observation time point. Subcortical T1 times in cp+ animals were high from day 1 onwards, and remained elevated until week 10.
Cp group (Figure 1A and Table 1): In the cp group, the initially (at day 1) increased T1 and T2 values decreased continuously, reaching normal values at the final observation time point at 10 weeks. These values were at no time below the relaxation times of those taken from contralateral reference ROIs.
Histological Lesion Characterization
The lesioned tissue, as characterized on T2-weighted images at day 1, remained grossly intact in animals with a cp-type lesion up to our final observation time point at 10 weeks, while cystic degeneration in cp+ animals resulted in loss of most of the affected tissue.
Animals with cp lesions showed a dense, cellular infiltrate on HE-stained sections at 2, 6, and 10 weeks after MCAO (Figure 2, panels 1 to 3A, B), resembling macrophages, and microglia. We did not find a difference in size or density of the infiltrate with time. In cp+ animals, similar cell infiltrates were visualized at the border of the infarct cysts (Figure 2, panel 4A, B).
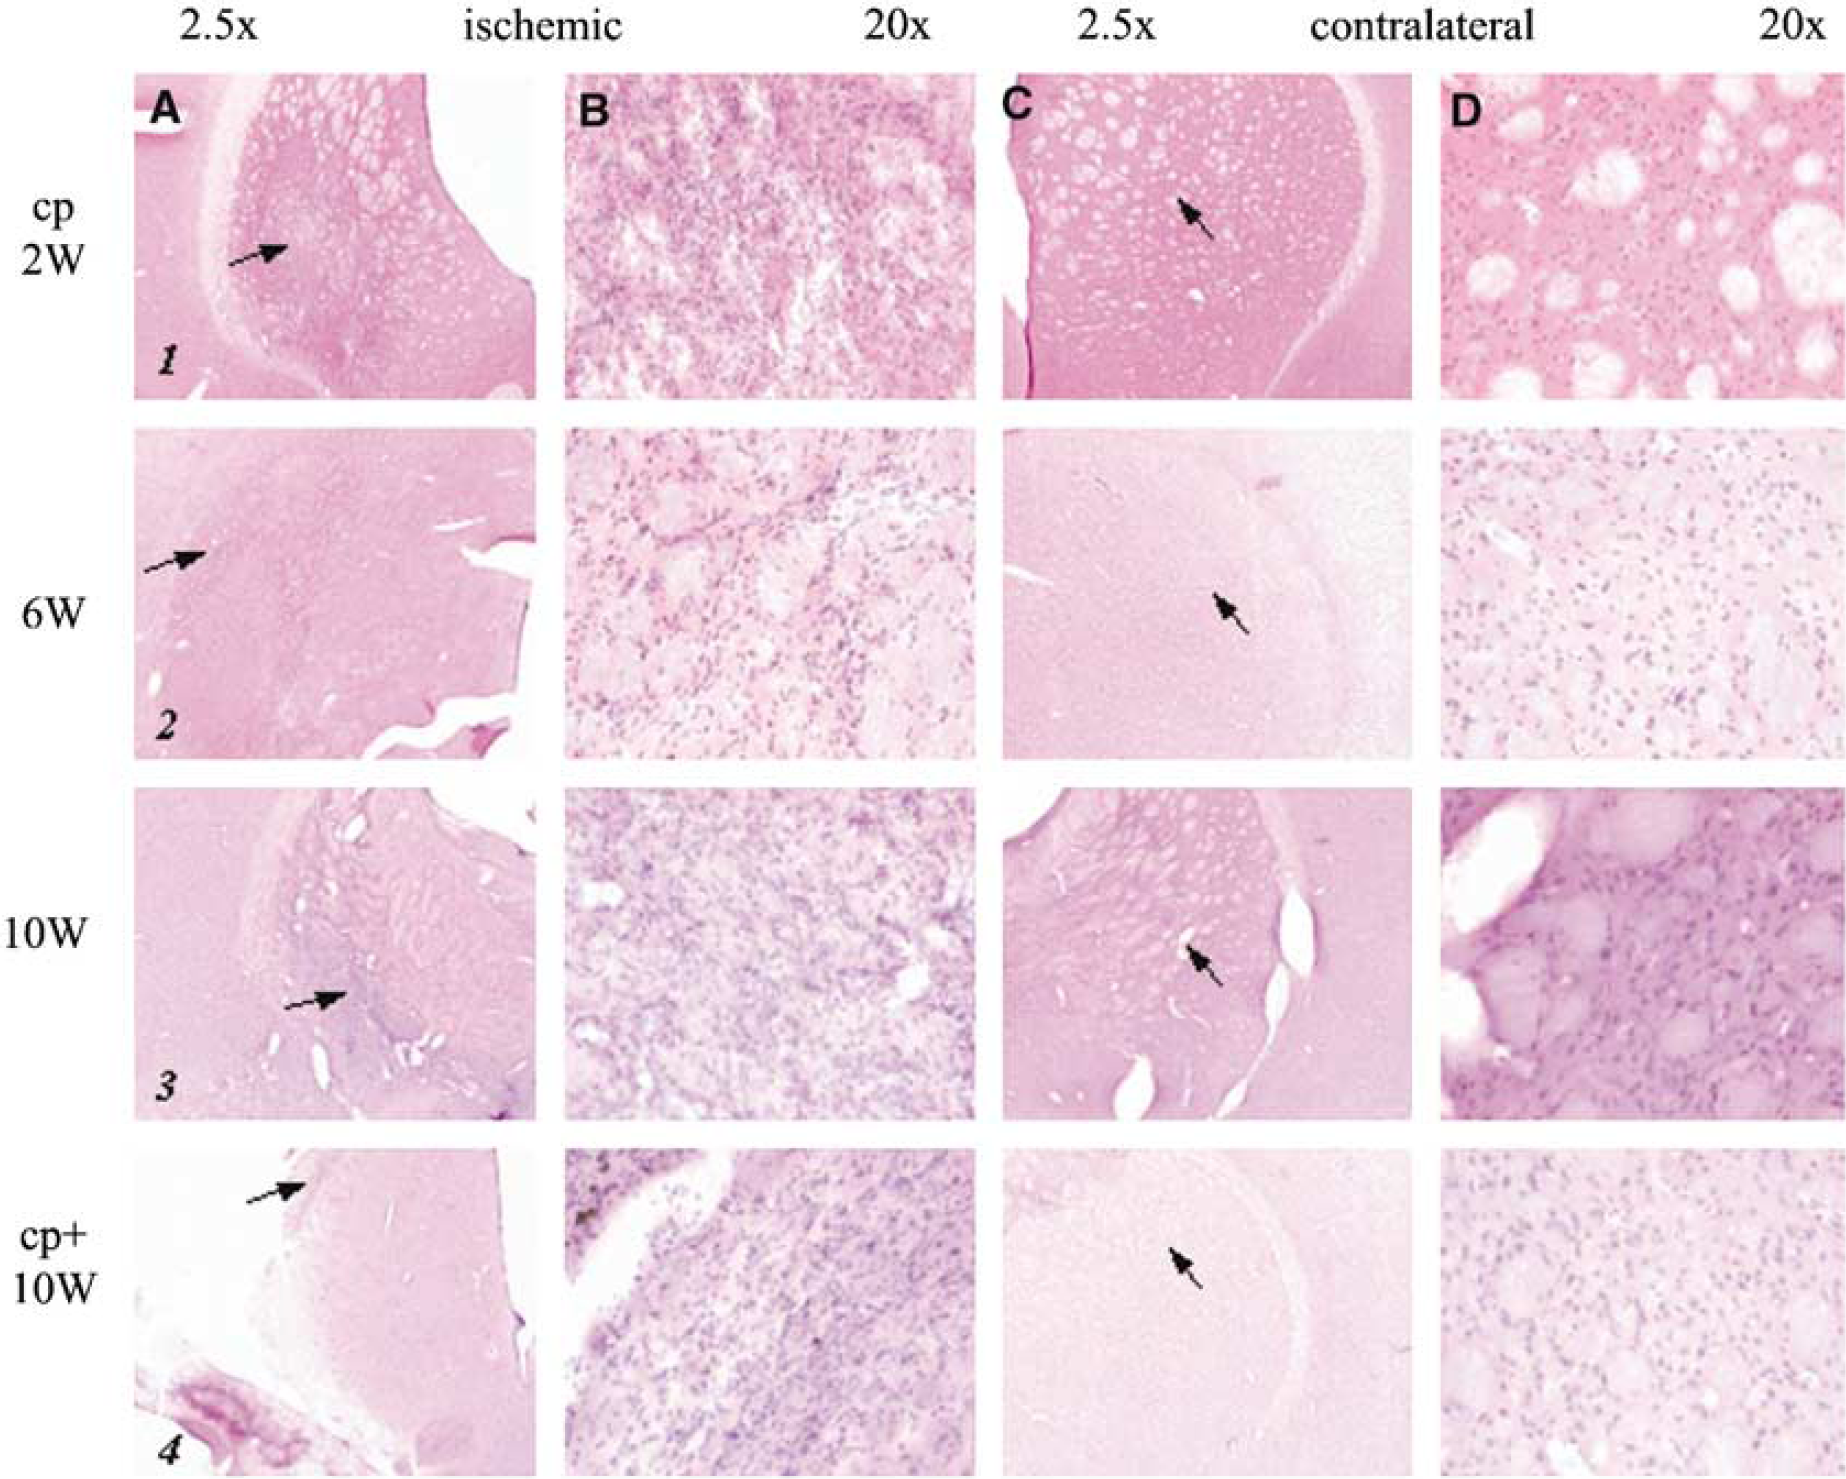
Histology: HE stain. Hematoxylin eosin-stained sections of the lesion (
Fiber tracts crossing the infarcted striatal area were not reduced in size or number in the cp group, but appeared intact as concluded from our combined luxol fast blue-cresyl violet stain (Figure 3, panels 1 to 3A, B). This was different in cp+ animals when analyzing the close proximity to the lesion after 10 weeks. There, intact myelin sheaths were not found within the area of cell accumulation (Figure 3, panel 4B, arrow).
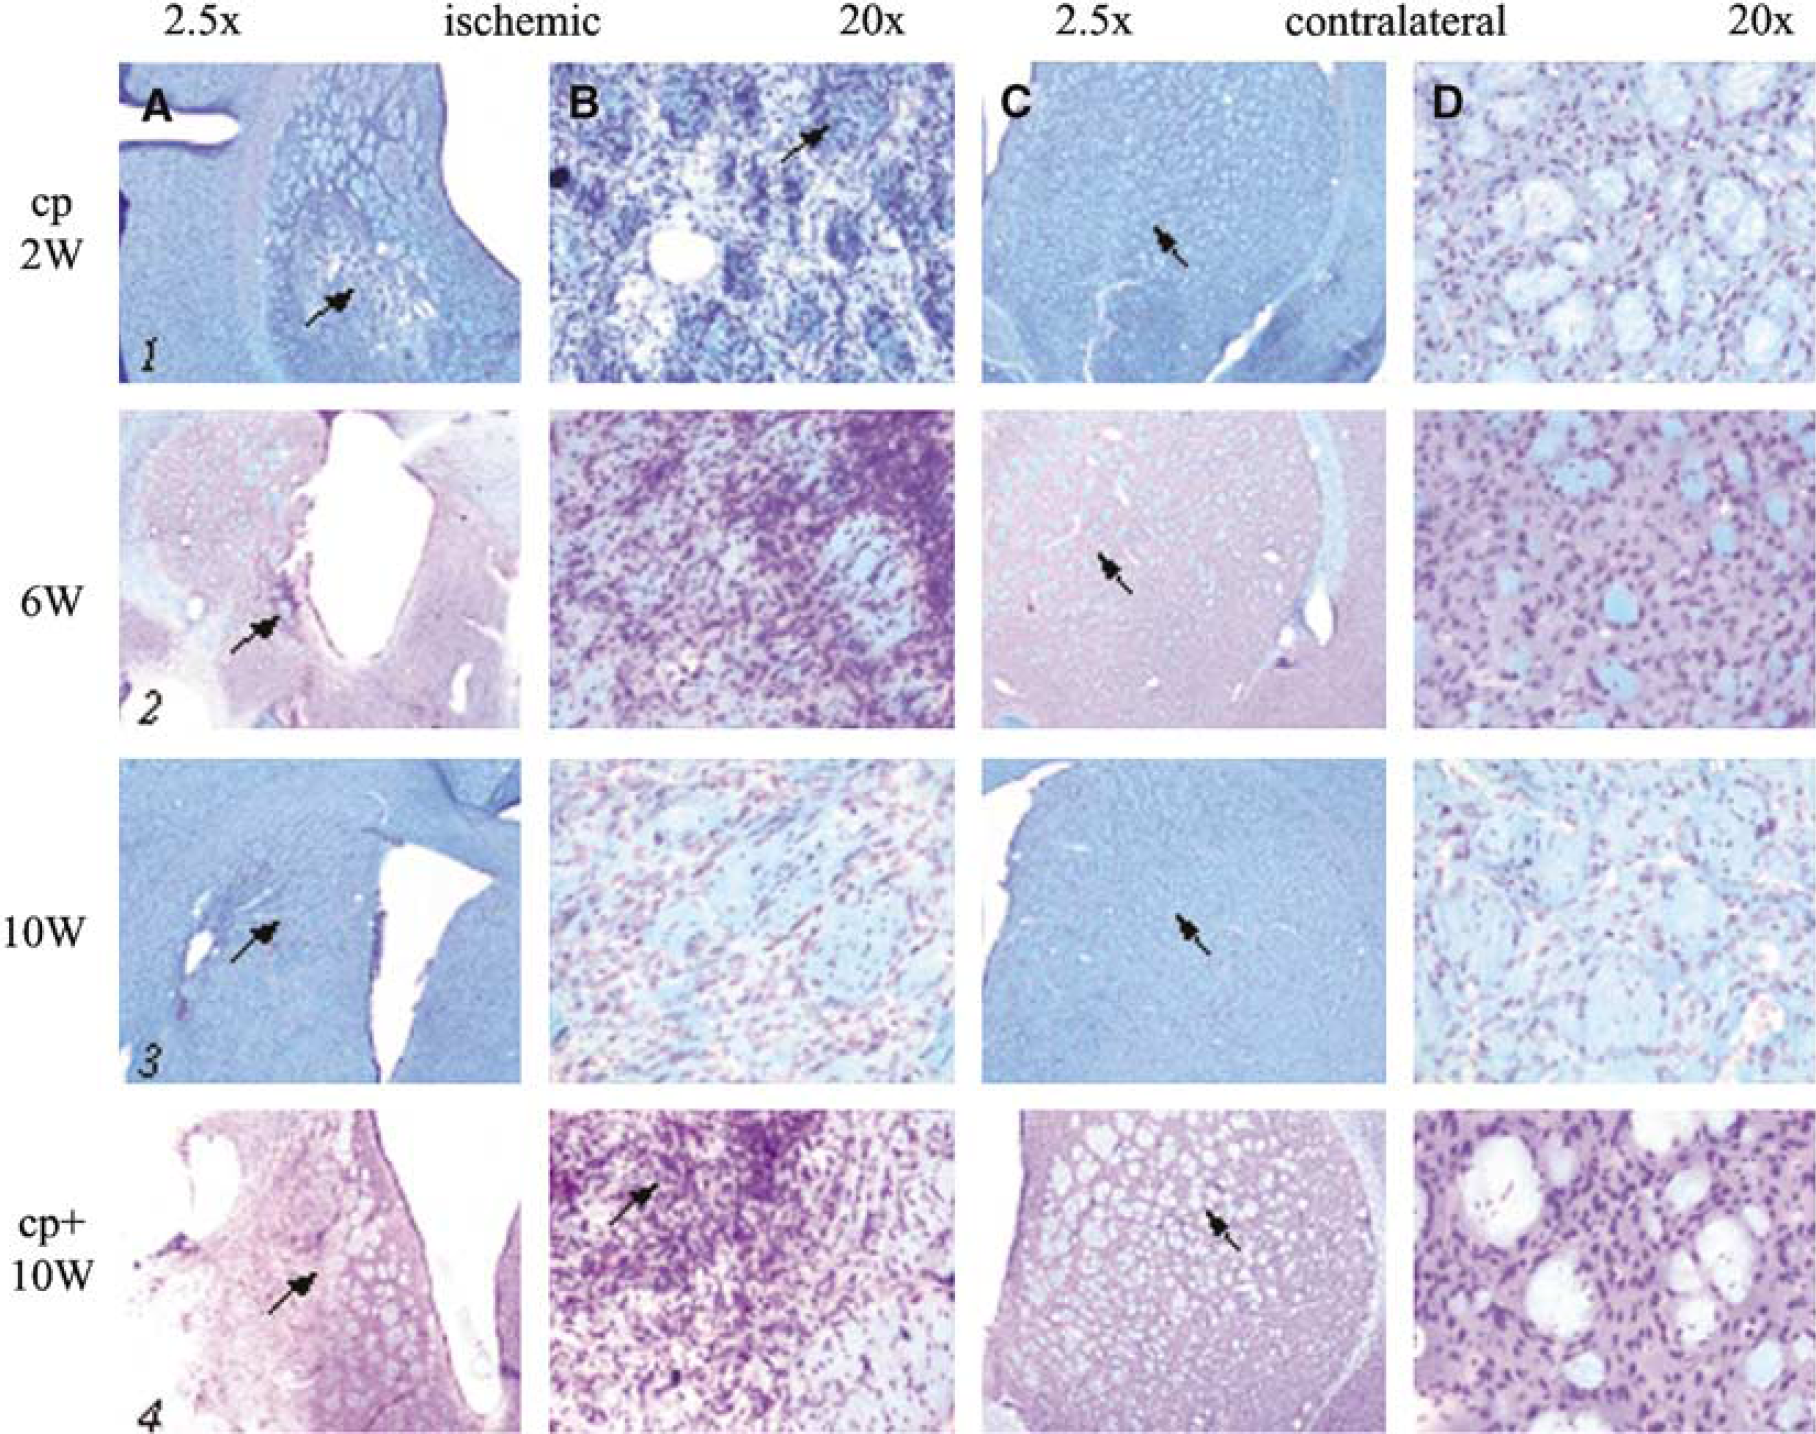
Histology: luxol fast blue-cresyl violet stain. Luxol fast blue-cresyl violet-stained sections of the lesion (
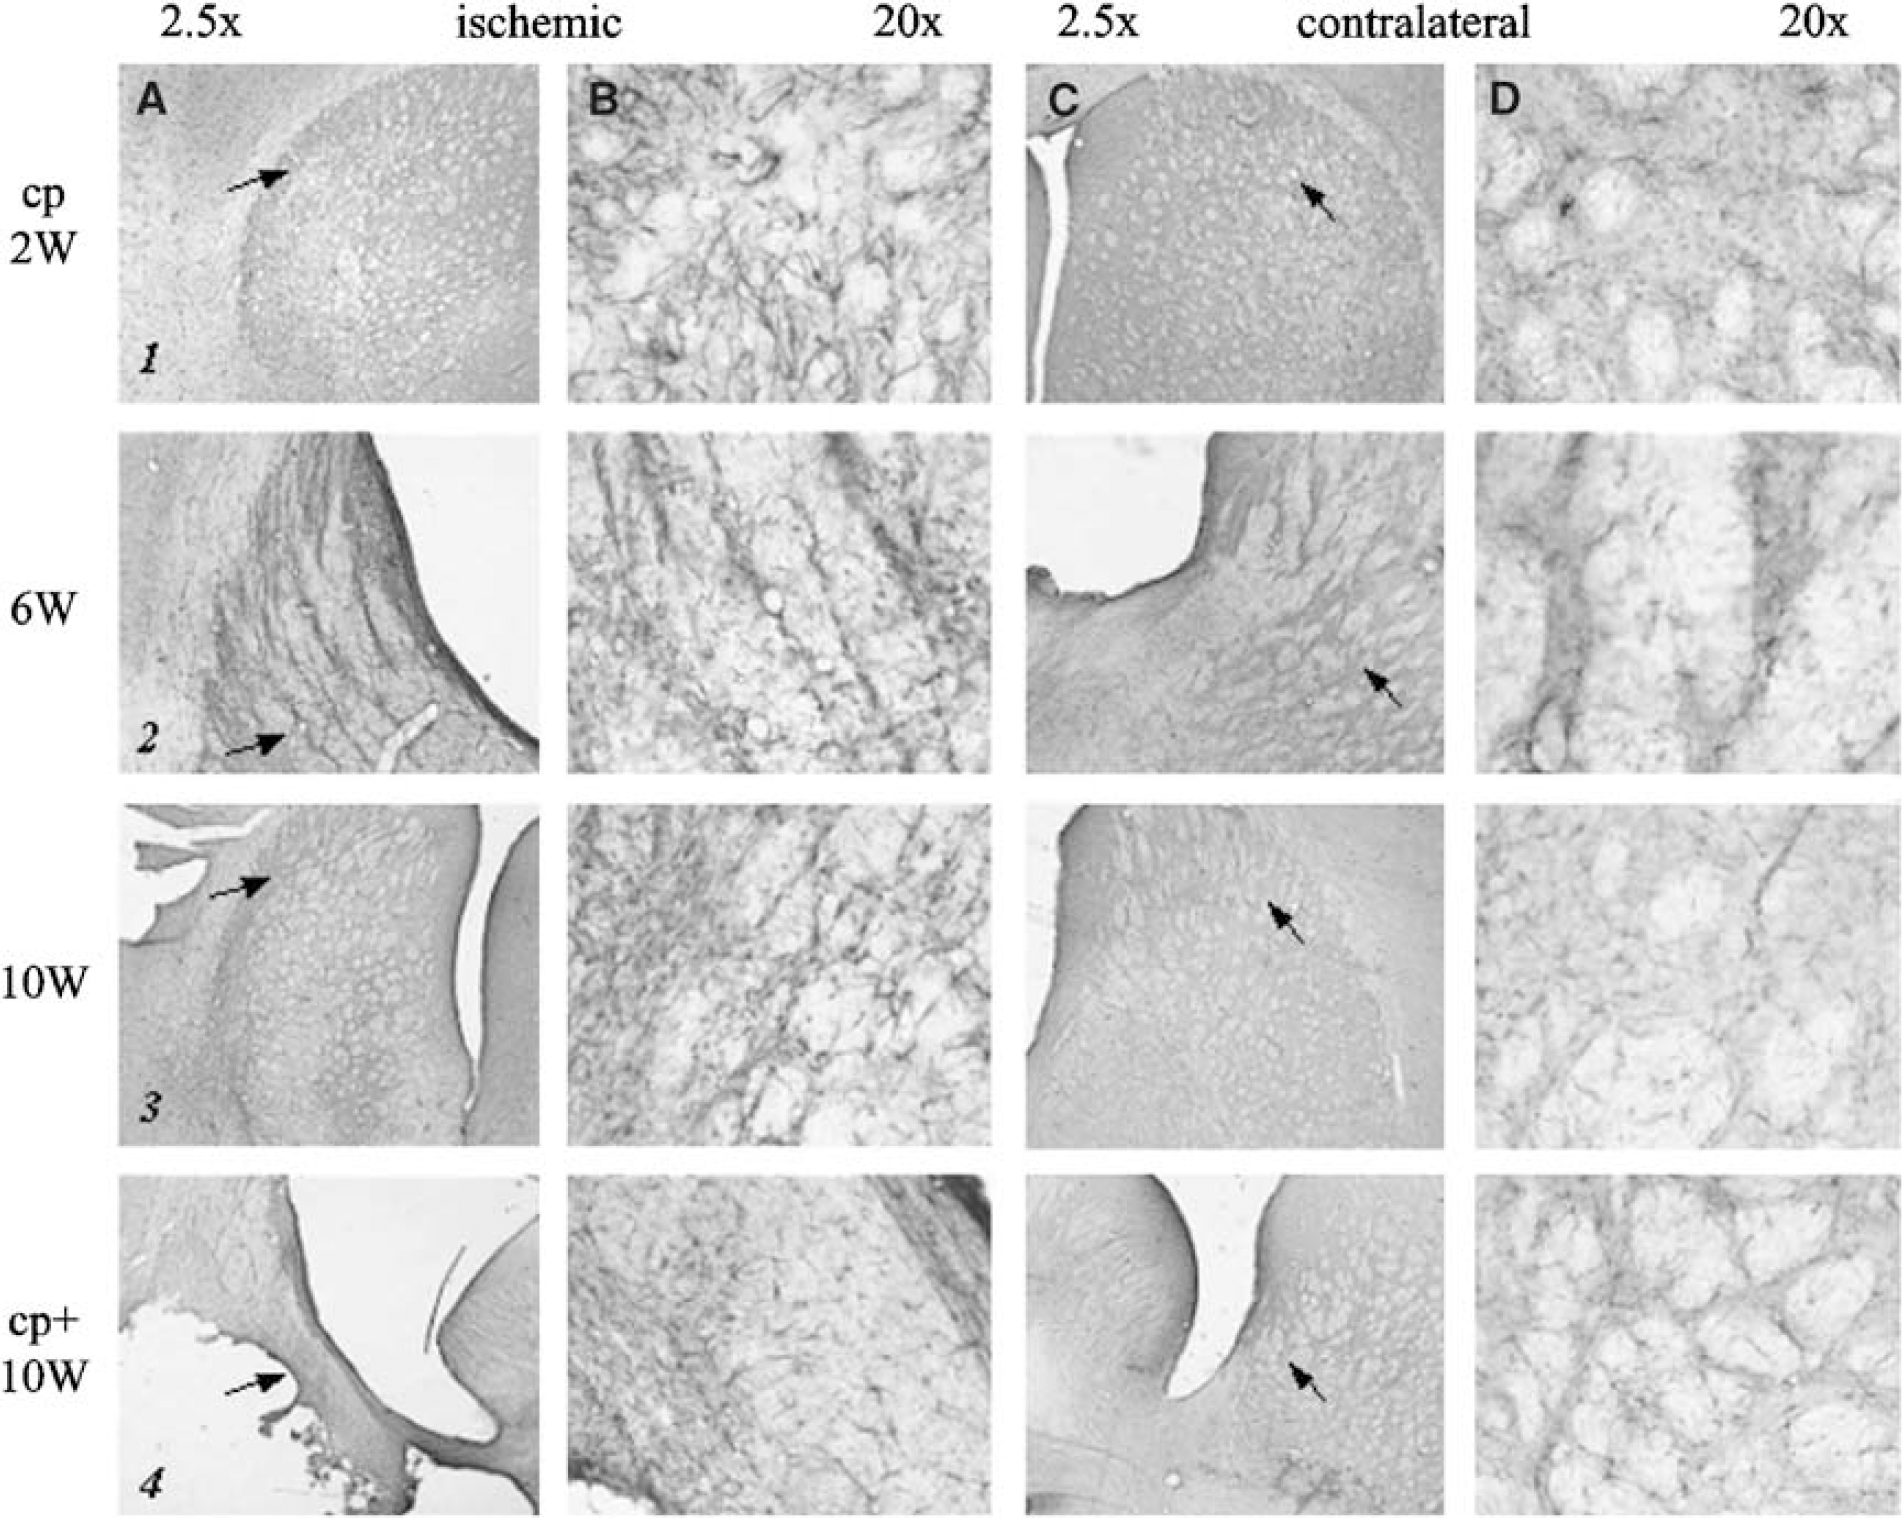
Both the caudoputaminal regions in cp animals as well as the residual, more peripheral infarct regions in cp+ animals were characterized by a profound loss of neurons (Figure 4, panels 1 to 4).

Histology: NeuN immunohistochemistry. NeuN immunohistochemistry of the lesion (
The extent of the area with neuronal death in the cp group corresponded well to the location and size of the initial deficit on T2-w MRI, and was clearly apparent already after 2 weeks (Figure 4, panel 1).
GFAP immunohistochemistry (Figure 5) showed gliosis in the infarct area of cp animals, which became slightly more pronounced after 10 weeks compared with 2 weeks (Figure 5, panels 1 to 3A, B). An increased density of GFAP-positive cells was also detectable in the infarct border of cp+ animals (Figure 5, panel 4A, B).
Histology: GFAP immunohistochemistry. GFAP immunohistochemistry of the lesion (
Discussion
The exclusively subcortical ischemic lesions described in our study were characterized by a unique MR imaging pattern. The initial relaxation time increase on T1 and T2 maps after 60 mins of MCAO rapidly diminished within 1 week and had completely resolved at 10 weeks. Importantly, this normalization of imaging findings was not paralleled by tissue recovery. Neuronal necrosis and gliosis with a pronounced inflammatory reaction were observed already 2 weeks after MCAO. However, cystic degeneration of tissue and loss of fiber tracts, a characteristic trait of cp+ animals, were not part of the histological picture in the cp group at any observation time point.
Lesion Development
In severe infarctions, necrosis develops from 6 h up to 4 days after ischemia and is further aggravated by inflammatory processes, resulting in pannecrosis (Dirnagl et al, 1999; Garcia et al, 1993; Persson et al, 1989). After approximately 1 to 2 weeks, a loose connective tissue matrix is formed along the infarct borders. The necrotic cells have completely resolved 2 weeks later, with macrophages remaining in the tissue adjacent to the infarcted area (Clark et al, 1993). If ischemia is mild, selective destruction of neurons can be observed (‘selective neuronal necrosis’) (Garcia et al, 1996).
In our investigation, cp+ lesions developed pannecrosis and cystic cavities according to this established sequence of tissue destruction. In contrast, cp lesions exhibited selective neuronal necrosis. The ischemic area was evenly covered with GFAP+ astrocytes and with an inflammatory infiltrate, while fiber tracts were spared.
Lesion Type-Dependent Relaxation Time Changes
T1 and T2 relaxation times are sensitive to an increase in free, extracellular water, such as in vasogenic edema, but might also be influenced by other factors after ischemia, such as bound water pools or the BOLD effect (Dijkhuizen and Nicolay, 2003; Horikawa et al, 1986). Increases of MR relaxation times have been shown to correlate to loss of 2,3,5-triphenyltetrazolium chloride (TTC) stain, which matches loss of metabolic cell viability in vasogenic edema, even before neuropathological signs of cell damage (Bose et al, 1988). In general, T2 has been utilized for the description of chronic ischemic lesions in animal models as well as in human stroke (Warach, 2001).
T1 and T2 have been reported to change within minutes after the onset of ischemia and reach a maximum at 24 to 48 h (Kavec et al, 2004; Kettunen et al, 2000; Makela et al, 2002). ‘Apparent’ lesion volumes as well as relaxation times decrease slightly thereafter, and stabilize or increase again slightly (when cysts are formed) over the next 2 weeks (Ishii et al, 1998; Li et al, 2000; Lin et al, 2002a, b ; Neumann-Haefelin et al, 2000; Palmer et al, 2001; van Dorsten et al, 2002; Virley et al, 2000). Even though T1-w and T2-w MRI have been shown to closely reflect the extent of irreversibly damaged tissue in the past, there is evidence that this correlation will not always hold in certain brain regions and at later time points (Knight et al, 1994; Neumann-Haefelin et al, 2000). Paramagnetic properties of inflammatory cells or blood degradation products, as well as region-specific changes in water content and breakdown of macromolecular structures with influence on relaxation times, have been discussed as possible reasons for this phenomenon (Dijkhuizen et al, 1998; Lin et al, 2002a). Our own analysis showed a time-dependent accumulation of iron-containing macrophages in the region around leaky blood vessels, which led to selective T2* sensitivity without any influence on either T1 or T2 detectable at 10 weeks after MCAO (Hoehn et al, 2004; Weber et al, 2005).
In shorter follow-up MR time series after MCAO (7 days), incomplete recovery of T1 and T2 values has been observed in some studies after transient (Neumann-Haefelin et al, 2000) and even permanent (Helpern et al, 1993; Knight et al, 1991) MCAO in rats. Knight et al (1994) described a heterogeneous response of MR relaxation times to MCAO, and noted large increases in T2 times in the dorsolateral striatum with only moderate histological damage. In this specific region, they also found that T2 times had completely normalized 1 week after MCAO. Since this tendency for normalization of relaxation times after 7 days was also reported for more severe tissue damage in those studies, discrimination between regions with later pannecrosis or selective neuronal necrosis was not possible. Based on our present data, we suggest that with longer observation times (> 2 weeks) distinct MR patterns develop for these two types of injury, as schematically depicted in Figure 6. While ischemic pannecrosis with cystic degeneration of tissue leads to a secondary increase in T1 and T2 times, selective neuronal necrosis is accompanied by complete resolution of T1 and T2 signal changes. To distinguish the tissue that has normalized on T1 and T2 but has suffered selective neuronal damage from completely unaffected tissue, T2* weighted MRI has been successfully applied in our group. Thus, cp-type lesions could be visualized as areas of signal loss in the caudatoputamen 10 weeks after MCAO (Weber et al, 2005).
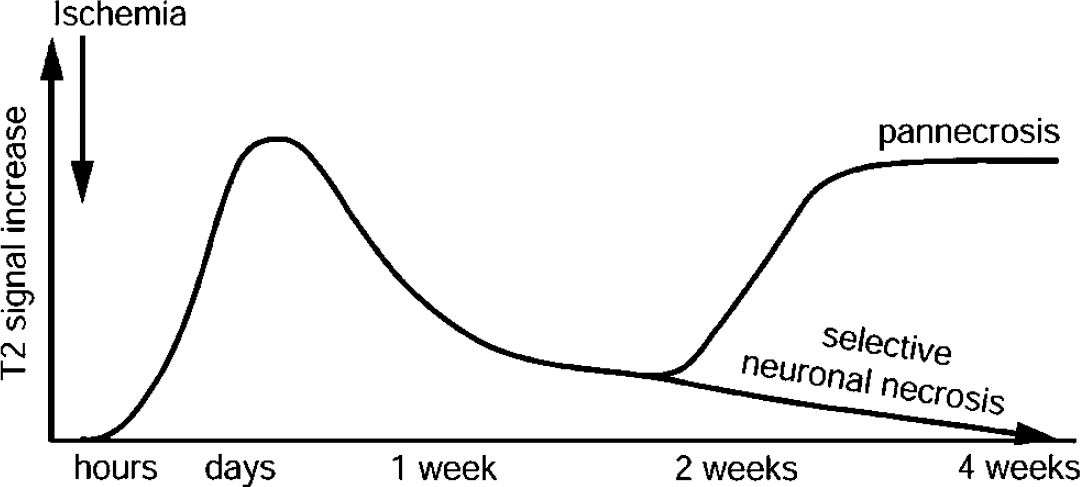
Schematic temporal profile of T2 relaxation time changes on MCAO. For the cp group, the changes resolve with time, leading to selective neuronal death, while the later re-elevated T2 values in the cp+ group reflect pannecrosis and cyst formation.
Ischemia Duration-Dependent Relaxation Time Changes
It is undisputable that T1 and T2 relaxation times are influenced by the duration of the ischemic impact. In mild transient ischemia of 30 mins and less, MRI changes have been shown to take a different course (Fujioka et al, 2003; van Lookeren Campagne et al, 1999). After a 15-mins vascular occlusion, Fujioka et al (2003) showed a delayed hyperintensity on T1-w images that was accompanied by a hypointensity on T2-w images between 5 days and 16 weeks after MCAO. These relaxation time changes were attributed to manganese accumulation in the striatum in concert with neurodegeneration and an inflammatory response that led to delayed impairment in cognitive function. Interestingly, the lesions induced by 15-min MCAO in Wistar rats in their study were also exclusively subcortical.
Others have reported a lack of any macroscopical (MRI) or histological signs of tissue damage after very short (20 mins) focal ischemia, but noted a delayed increase in T2 and neuronal loss on brain slices after periods of 30 and 45 mins in a cortical lesion model (van Lookeren Campagne et al, 1999).
Lesion Type-Dependent Relaxation Time Changes: Pathophysiological Interpretations
Even though morphologically similar to those of Fujioka et al (2003), the subcortical lesions described in our study had a different appearance on follow-up MRI. Since it involved the same brain structure, region-specific differences in lesion evolution are not a plausible explanation for this difference. Rather striking is the fact that the maximal extent of the edema, demarcated on T2-w and T1-w images, was similar in both studies, although in our model occlusion times were 60 mins instead of 15 mins in Fujioka's. Since resistance to injury should be assumed to be very similar in untreated animals of the same strain, the difference must be due to a different level of blood flow to the ischemic area during the vascular occlusion or after reperfusion. Even though LDF values suggest a similar drop in tissue perfusion during the vessel occlusion in cp and cp+ animals, slight variances in vascular anatomy or different reperfusion processes might have attenuated ischemic damage in our cp group. As mechanisms underlying normalization of T1 and T2 in the cp lesions, we suspect a fast resolution of interstitial edema with solidly intact white matter and intercellular structures despite the selective degeneration of neurons.
An influence of CSA on the outcome of the two groups of animals (cp+ and cp groups A and B) is very unlikely, because histological and MRI results were already strongly developed at 2 weeks after MCAO, the time when CSA application was only commenced. The lesion characteristics of these two groups developed in full analogy with the other groups and matched the 10-week analysis very well.
Conclusion
In conclusion, our results show that T1-w and T2-w MRI can be ‘pseudo-normal’ despite neuronal necrosis. We describe a novel pattern of long-term MRI changes after exclusively subcortical lesions in Wistar rats, caused by 60 mins of MCAO, that includes a complete resolution of initially increased T1 and T2 values without later secondary changes. Histologically, the tissue is characterized by selective neuronal necrosis, gliosis, and persistent inflammation without damage to fiber tracts passing through. This lesion type may account for a different prognosis regarding functional deficits (Wegener et al, 2005). Notably, our results point out that, when judging lesion evolution by T1-w and T2-w MRI, location of the lesion as well as late follow-up time points should be considered, as different infarct types might be distinguishable by specific neuroimaging patterns. However, availability of a temporal profile of relaxation time changes may allow the pathophysiologically important distinction between development of pannecrosis and selective neuronal death. Further studies, needed to further support the latter finding, are in progress.
Footnotes
Acknowledgements
Discussions with Professor W Neiss and Dr H Miletic concerning the histological data are gratefully acknowledged.