
Abstract
A quantitative understanding of unidirectional versus net extraction of oxygen in the brain is required because an important factor in calculating oxidative metabolism by calibrated functional magnetic resonance imaging (fMRI) as well as oxygen inhalation methods of positron emission tomography (15O2-PET) and nuclear magnetic resonance (17O2-NMR)) is the degree of oxygen efflux from the brain back into the blood. Because mechanisms of oxygen transport from blood to brain are dependent on cerebral metabolic rate of oxygen consumption (CMRO2), cerebral blood flow (CBF), and oxygen partial pressure (pO2) values in intravascular (Piv) and extravascular (Pev) compartments, we implemented multimodal measurements of these parameters into a compartmental model of oxygen transport and metabolism (i.e., hemoglobin-bound oxygen, oxygen dissolved in plasma and tissue spaces, oxygen metabolized in the mitochondria). In the α-chloralose anesthetized rat brain, we used magnetic resonance (7.0 T) and fluorescence quenching methods to measure CMRO2 (2.5 ± 1.0 μmol/g min), CBF(0.7 ± 0.2 mL/g min), Piv (74 ± 10 mm Hg), and Pev(16 ± 5 mm Hg) to estimate the degree of oxygen efflux from the brain. In the axially distributed compartmental model, oxygen molecules in blood had two possible fates: enter the tissue space or remain in the same compartment; while in tissue there were three possible fates: enter the blood or the mitochondrial space, or remain in the same compartment. The multiparametric results indicate that the probability of unmetabolized (i.e., dissolved) oxygen molecules reentering the blood from the tissue is negligible and thus its inclusion may unnecessarily complicate calculations of CMRO2 for 15O-PET, 17O-NMR, and calibrated fMRI methods.
Introduction
Measurement of oxidative metabolism has become an important measure for assessing brain function (Hyder, 2004; Mayhew, 2003). However, the wide range of methods used to estimate oxidative metabolism do not measure consumption of oxygen directly. Instead different methods measure quite different aspects of oxidative metabolism. The substrate pools of oxygen can be measured by polarographic electrodes, mass spectrometric probes, and luminescence probes. The fraction of oxygen extracted by the tissue from the blood can be estimated by 15O2 inhalation positron emission tomography (PET) method (Raichle et al, 1979). The rate of oxygen being metabolized to water can be calculated from 17O2 inhalation nuclear magnetic resonance (NMR) method (Zhu et al, 2001). The flux of the tri-carboxylic acid (TCA) cycle can be measured by NMR detection of 13C isotope turnover into metabolic pools from infused 13C-enriched glucose (Shulman et al, 2004). The relationship between blood oxygenation and oxygen extraction by the tissue is the basis of the functional magnetic resonance imaging (fMRI) method (Kida et al, 2000) and oxidative metabolism is calculated by biophysical modeling (Hyder et al, 2001).
An important factor in calculating oxidative metabolism (e.g., by calibrated fMRI, 15O-PET, 17O-NMR, Hyder et al, 2001; Raichle et al, 1979; Zhu et al, 2001) is differentiating between unidirectional extraction and net extraction of oxygen from the blood to the brain (Figure 1). If oxygen efflux (fb) from the brain to the blood is negligible, then the net influx (fn) can be assumed to be approximately equal to the unidirectional influx (fu), because fn = fu–fb (Figure 2).
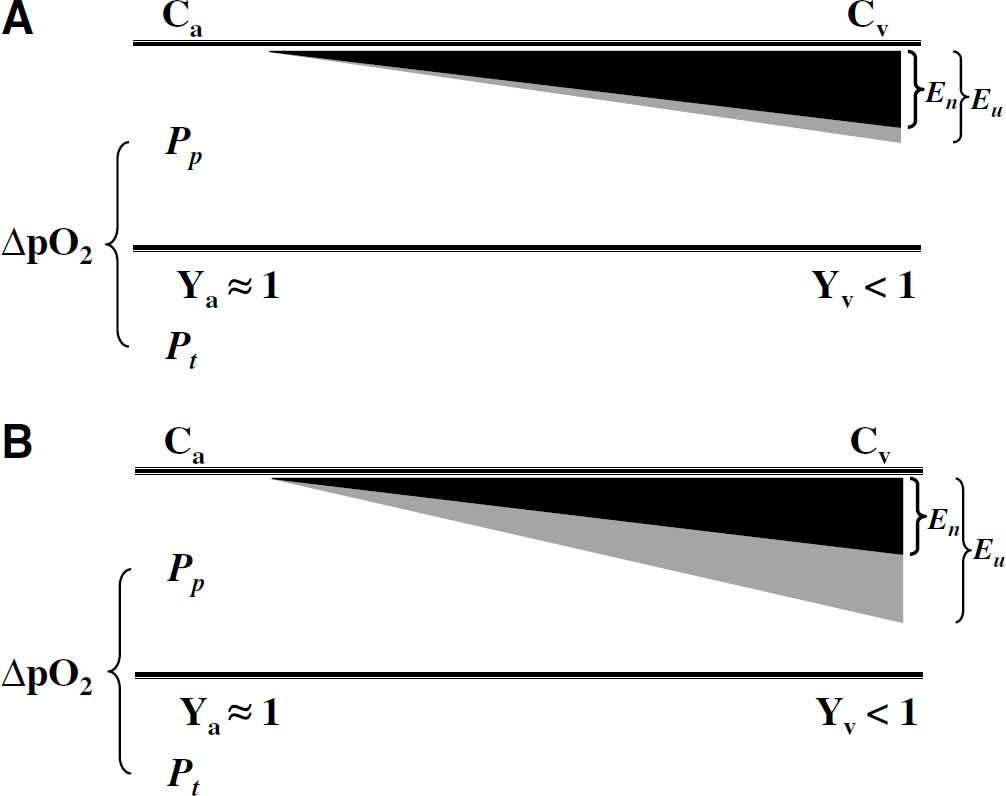
Schematic differentiating between unidirectional extraction (Eu; gray shading) and net extraction (En; black shading) of oxygen from the blood to the brain. The arterio-venous difference of blood oxygenation (Ya and Yv) in the microvascular unit reflects the amount of oxygen extracted by the tissue, as represented by the plasma-tissue pO2 gradient (ΔpO2). The difference between unidirectional (Eu) and net (En) extraction depends on the degree of oxygen back flux from the tissue. (
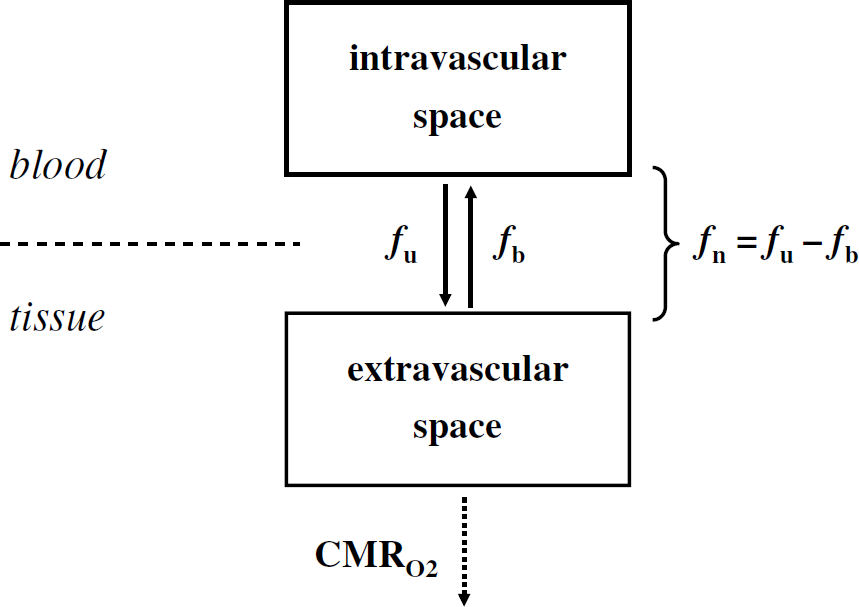
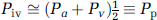
Oxygen molecules exist in intravascular and extravascular compartments before being metabolized in the mitochondria. In the intravascular compartment, oxygen molecules are bound to hemoglobin inside red blood cells or dissolved in the plasma. In the extravascular compartment, oxygen molecules are dissolved in the interstitial and tissue spaces or metabolized in the mitochondria. When there is negligible oxygen efflux (fb) from the brain to the blood, the net oxygen influx (fn) can be assumed to be approximately equal to the unidirectional oxygen influx (fu), because fn = fu–fb. The implication of small (Eu ≈ En or fb ≈ 0) or high (Eu > En or fb > 0) degree of oxygen back flux is that in the latter case there is greater potential for underestimation of calculating CMRO2 by mathematical modeling. Because experimental accuracy for methods used to calculate CMRO2 (by positron emission tomography (PET) and nuclear magnetic resonance (NMR)) ranges from 80% to 90%, it is expected that if fb > 0.2 then the calculation of CMRO2 may be impacted significantly by mathematical modeling. The 13C NMR method is the only method that is not impacted by this issue of oxygen back flux because it relies on the measurement of the tri-carboxylic acid (TCA) cycle flux.
Although the oxygen environment of neural cells has been studied with a variety of techniques (e.g., polarographic electrodes (Lubbers and Baumgärtl, 1997), mass spectrometric probes (Pinard and Seylaz, 1978), fluorescence (Mitnick and Jobsis, 1976), and phosphorescence (Vanderkooi and Wilson, 1986) quenching probes), a comprehensive understanding to distinguish between unidirectional (Eu) and net (En) extraction of oxygen by the brain tissue is still lacking (Figure 1). This is in part because measurements of oxygen partial pressure (pO2) from intravascular (Piv) and extravascular (Pev) compartments have not been quantitatively linked to measurements of oxygen consumption (CMRO2) and blood flow (CBF). Because mechanisms of oxygen transport from the blood to the brain (Buxton, 2002; Buxton and Frank, 1997; Gjedde, 2001; Hudetz, 1999; Hyder et al, 1998; Valabregue et al, 2003; Zheng et al, 2002) are dependent on these parameters (i.e., Piv, Pev, CMRO2, and CBF), the main objective of this study was to combine the multimodal measurements into a compartmental model of oxygen convection, exchange, diffusion, and metabolism to determine the degree of oxygen efflux from the brain.
Oxygen movement between intravascular and extravascular compartments is mainly driven by pO2 gradients. However, under specific circumstances oxygen movement may oppose the gradient (Kassissia et al, 1995), suggesting some oxygen back flux into the blood. Examples of such observations are: (i) pO2 in the tissue neighboring the capillaries is relatively high and it is in the same range as pO2 of capillaries (Ivanov et al, 1982); and (ii) the hemoglobin-bound oxygen concentration (or saturation) from vessels shows a fluctuating fractal pattern (Eke and Hermán, 1999). Thus, we test an important hypothesis of oxygen limitation model for the brain (Buxton, 2002), which has bearing on the degree of oxygen efflux from the brain back into the blood and this factor has important implications for calculating oxidative metabolism by PET and NMR methods. If dissolved oxygen from the brain diffuses back into blood, then oxygen can become limiting in the tissue, and therefore impede mitochondrial respiration.
Theory
The basic structure of the axially distributed model (Figure 2) consists of intravascular and extravascular compartments that exchange oxygen molecules dissolved within blood (Cb) and tissue (Ct) before consumption in the mitochondria (Cm). The movement of oxygen between these compartments can be described by a series of coupled first-order differential equations.
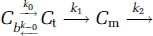
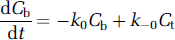
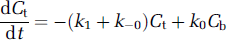
Equation (1a) illustrates the convection of oxygen molecules within blood and is dependent on the loss of oxygen molecules to tissue. Equation (1b) describes the diffusion of oxygen molecules through tissue and is dependent on the loss of oxygen molecules to the blood and mitochondria. Equation (1c) captures the metabolism of oxygen molecules in the mitochondria and is dependent on some amount of oxygen molecules dissolved in tissue. Exact solutions of these coupled differential equations require estimates of step-specific constants (kx) and initial values of different pools. This type of analysis becomes computationally more challenging when the intravascular compartment is separated further into hemoglobin-bound oxygen inside red blood cells (Ch) and dissolved oxygen molecules in the blood plasma (Cp) to account for solubility and specificity differences of oxygen in the hemoglobin and plasma, respectively (Deussen and Bassingthwaighte, 1996). Instead we used a leap-frog method (Snyman, 1982) because of apparent simplicity and minimized computational expense (Holm and Botha, 1999).
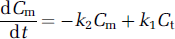
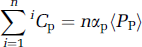
The model (Figure 3) uses anatomically appropriate structural barriers (e.g., hemoglobin-bound oxygen inside red blood cells, dissolved oxygen in blood plasma and interstitial spaces, volume difference between intravascular and extravascular spaces) and accounts for regional heterogeneity of pO2, CBF, and CMRO2. The circulation time for blood through a microvascular unit was divided into n infinitesimally small incremental steps in time (i.e., 1Cb to nCb, 1Ct to nCt, and 1Cm to nCm). While oxygen content in each compartment is different, the volumes of each compartment for the ith step are equivalent. Oxygen molecules in the blood (in the ith step) had two possible fates (in the (i + 1)th step) each with a distinct probability (Figure 3): enter the tissue space (p1) or remain in the same compartment (1 – p1). Oxygen molecules in tissue (in the ith step) had three possible fates (in the (i + 1)th step) each with a distinct probability: reenter the blood space (p2), or enter the mitochondrial space (p3), or remain in the same compartment (1 – p2 – p3). Oxygen molecules in the mitochondria (in the ith step) were assumed to be metabolized.
The model describes the path of oxygen molecules through a microvascular unit for n infinitesimally small incremental steps of circulation time. The schema shows movement of oxygen molecules bound to hemoglobin in red blood cells, oxygen molecules dissolved in blood plasma, and oxygen molecules dissolved in tissue some of which are subsequently metabolized in the mitochondria (i.e., Cb, Ct, and Cm). The blood compartment consists of hemoglobin-bound oxygen (Ch) and oxygen dissolved in plasma (Cp). The volumes of each compartment for the ith step are equivalent but the concentrations are different. Oxygen molecules in the blood had two possible fates, each with a distinct probability: enter the tissue space (p1) or remain in the same compartment (1 – p1). Oxygen molecules in the tissue had three possible fates, each with a distinct probability: reenter the blood space (p2), or enter the mitochondrial space (p3), or remain in the same compartment (1 – p2 – p3). Oxygen molecules in the mitochondria were assumed to be metabolized. Because exact values of p1 and p2 cannot be calculated without further assumptions about the microscopic aspects of the model, the relationship between p1 and p2 can be used in a quantitative manner (see Materials and methods). An implicit assumption in the model (i.e., constancy of p1, p2, and p3) is that the smaller components that comprise the microvascular unit are assumed to be identical in anatomy and function.
Because only the dissolved oxygen in the plasma can exchange between the vascular and tissue compartments, we considered the fates of hemoglobin-bound oxygen molecules in the red blood cell (Ch) and dissolved oxygen molecules in the blood plasma (Cp) for every small incremental step (Figure 3). Very small amounts of oxygen molecules may exit the vascular compartment directly from the hemoglobin compartment in red blood cells (Federspiel and Popel, 1986; Federspiel and Sarelius, 1984). The degree of oxygen influx into the tissue by this route can be considered to be negligible (Popel, 1989).
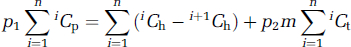
The incremental change in Cp for the (i + 1)th step depends on Cp for the ith step, Ct for the ith step, and the contribution from Ch, which occurs consistently all throughout circulation,

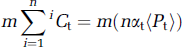
where m accounts for the difference between extravascular and intravascular compartments (see Appendix A). The incremental change in Ct for the (i + 1)th step depends on Ct and Cp for the ith step.

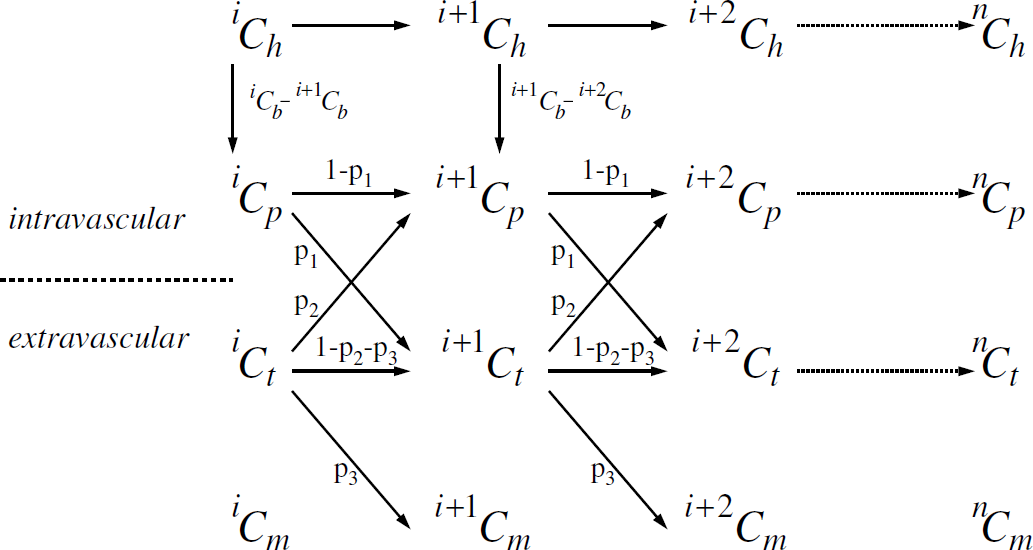
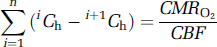
In equations (2) and (3) oxygen dissolved in the blood plasma enters the tissue with a probability of p1 and remain in the same compartment with a probability of (1 – p1), whereas oxygen molecules dissolved in the tissue reenter the intravascular compartment with a probability of p2, remain in the same compartment with a probability of (1 – p2 – p3), and enter the mitochondria with a probability of p3. Accounting for all cumulative steps for n infinitesimally small incremental steps of circulation time for the microvascular unit and then rewriting equation (2) results in
which relates the blood and tissue oxygen contents with probabilities of oxygen influx into the tissue (p1) and efflux from the tissue (p2). The terms
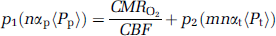
where the terms 〈Pp〉 and 〈Pt〉 are closely related to the averaged values of Piv and Pev, respectively (see Materials and methods), and αp and αt are solubility coefficients for oxygen in plasma and tissue spaces, respectively (see Materials and methods). The other term
By substitution, equation (4) can be altered into an expression that reflects dependence of parameters (Piv, Pev, CMRO2, and CBF) on the probabilities p1 and p2 (see equation (6)).
Arterio-venous difference of substances can be analytically described by linear or nonlinear variations in space and/or time (Popel, 1989). In equation (5c), the arterio-venous oxygen difference assumes the following: (i) oxygen freely diffuses out of the capillary; (ii) there is minimal diffusion in the axial direction and therefore can be ignored; and (iii) oxygen consumption within a microvasclar unit is assumed to be spatially uniform (Mintun et al, 2001). If the value of n is high, then the assumption of linear arterio-venous oxygen difference is not specifically necessary. For example, for n ≥ 700, the difference between the values of a linear and an exponential representation (for arterio-venous oxygen difference) is less than 0.05%. However, n cannot be extremely high, because n deals with the time constant of oxygen unloading from the red blood cell. Assuming ∼1 sec mean transit time in the microcirculation (Crumrine and LaManna, 1991) and ∼1 ms oxygen unloading time (Kagawa and Mochizuki, 1982), the value of n would be ∼1,000. Because the amount of oxygen influx (into the tissue) varies spatially, the probability is constant all throughout transit but the oxygen extraction is spatially varying (within the microvascular unit).
Materials and methods
Animal Preparation
All procedures were approved by the Yale Animal Care and Use Committee. Male Sprague—Dawley rats (160 to 230 g; Charles River; Wilmington, MA, USA) were anesthetized with 1% to 2% halothane in a 70:30 mixture of N2O and O2 for surgical preparations. Intraperitoneal lines were used for anesthetic and paralyzing agents. The tracheotomized rats were mechanically ventilated with 0.7% to 1.0% halothane and paralyzed with intraperitoneal injections of D-tubocurarine chloride (0.25 mg/kg per 0.5 h). A femoral arterial cannule was inserted for continuous blood pressure monitoring and periodic sampling of systemic blood gases (pCO2 and pO2) and pH. The scalp was retracted and removed to reveal the skull. After these surgical procedures, halothane anesthesia was discontinued and anesthesia was maintained with α-chloralose (46 ± 4 mg/kg h).
For pO2 measurements (n = 16), the rat was placed in a stereotaxic frame (David Kopf Instruments, Tujunga, CA, USA), which sat on a vibration-free table inside a Faraday cage. A temperature-controlled water blanket was placed around the rat torso to maintain body temperature (∼37°C) throughout the experiments. Concurrently removed anaerobic samples (∼50 μL) of venous (Pv) and arterial (Pa) blood were used for estimating Piv (see below). The skull over the midline was thinned to the dura and a catheter (secured with tissue glue and dental dam) was inserted into the sagittal sinus for Pv measurements. Blood removed from the cannulated femoral artery provided the Pa measurements. The Piv value was then used in combination with the measured pO2 in the tissue (Pt•) for estimating Pev (see below). The skull over the somatosensory cortex was thinned to the dura and a calibrated fluorescence quenching probe (Ø = 250 μm; Oxylite, Oxford Optronix, Oxford, UK) was inserted (4.4 mm lateral, 1.0 mm anterior, with respect to the bregma) using stereotaxic holders (Plastic One, Roanoke, VA, USA). The region of interest (ROI) spanned cortical layers III and IV. Signs of edema and bleeding around the probe were used as an indicator for excluding the results from analysis. The recording phase began after 30 mins of recovery from the time of probe insertion. The rodent's head was insulated with multiple layers of cotton swabs to minimize heat loss from the exposed skull.
For NMR measurements (n = 3), the skull was cleaned of all tissues and a layer of Saran Wrap was placed over the exposed wound. A femoral vein was cannulated for intravenous infusion of [1,6-13C]glucose (99 atom %; Cambridge Isotopes, Andover, MA, USA). The rat was placed in a home-built rodent holder, which allowed the bregma to be positioned at the center of the radio frequency (RF) coil and the head to be fixed with bite-bars in a stereotaxic design. The head was tightly fixed with foam cushions on either side of the head to minimize motion and the torso was covered with a temperature-controlled water blanket to maintain the continuously measured body temperature (∼37°C) throughout the experiments. For each rat, the CBF data were obtained before the CMRO2 data (see below). A similar ROI as in the optical measurements (see above) was interrogated in the CBF and CMRO2 maps.
Measurements of Piv and Pev
To relate pO2 measurements to CMRO2 and CBF, we substitute equation (5) into equation (4),
where 〈Pp〉 and 〈Pt〉 are closely related to 〈Piv〉 and 〈Pev〉, respectively (see below), αp and αt are 0.03mLO2/mLtissueatm and 0.09mLO2/mLtissue atm, respectively (see Appendix D). Piv is related to the arterio-venous difference of the microvascular unit (see Appendix E). Because pressure in plasma space is the same as that in the intravascular compartment, a measurement of Pp is given by
Both Pa and Pv were measured from blood samples removed from femoral artery and sagittal sinus and analyzed with a blood gas analyzer (ABL3, Radiometer, Copenhagen, Denmark).
The measured pO2 in the ROI (Pt•) depends on pO2 values in the intravascular (Piv), extravascular (Pev), and mitochondrial (Pm) compartments

where fiv, fev, and fm are the volume fractions of the three respective compartments and the sum of which is equal to 1. Typical values of fiv, fev, and fm are known to be around 0.02, 0.77, and 0.21, respectively (Jesmin et al, 2003; Nicholson and Sykova, 1998). If the microvascular unit was modeled to include venules, then fiv would increase (to approxiamtely ∼0.05) and fev would decrease (to ∼0.74). By definition of Pt in equation (6) is equal to Pev (see Theory). Thus Pt was determined by

where the value of Piv was determined from equation (7a), the value of Pm was assumed to range between 0.1 and 10 mm Hg (Clark and Clark, 1985; Clark et al, 1987; Gayeski et al, 1987), and averaged value of Pt• was measured with a luminescence probe sensitive to oxygen quenching (Oxylite). The pO2 value was determined from fluorescence lifetime variations of ruthenium (II) chloride (Young et al, 1996), which was immobilized at the probe tip with a semipermeable membrane. The emission and luminescence wavelengths were 485 and 600 nm, respectively.
Measurements of CBF and CMRO2
All NMR data were acquired on a 7.0 T AVANCE (Bruker Instruments, Billerica, MA, USA) horizontal-bore spectrometer, equipped with actively shielded shim/gradient coils (18 G/cm) operating at 300.6 and 75.5 MHz for 1H and 13C, respectively, for all magnetic resonance imaging (MRI) and spectroscopy (MRS) experiments. The RF probe consisted of one 13C and two 1H coils. Localized static field homogeneity was optimized before data acquisition.
Details of the NMR pulse sequences for CMRO2 and CBF mapping have been described (Hyder et al, 1999, 2000a). The CMRO2 and CBF data were acquired in imaging grids of 16 × 16 and 32 × 32 with voxels of 1.25 × 1.25 × 5.00 and 0.63 × 0.63 × 1.00 mm, respectively, using spectroscopic imaging (Hyder et al, 2003) and sequentially sampled echo planar imaging (Hyder et al, 1995).
Absolute CBF maps were imaged by using magnetically labeled arterial blood water, which acts as an endogenous perfusion tracer (Detre et al, 1992), the kinetics of which can be determined by changes in the longitudinal relaxation time of tissue water (T1) obtained by inversion recovery methods (Hyder et al, 2000a, b ). One type of T1 map, obtained by global inversion recovery, is basically insensitive to perfusion because both blood and tissue water pools are inverted nonpreferentially. Another type of T1 map, obtained with a more localized (or sliced) inversion (or saturation) of spins (T1app), makes the contrast more sensitive to perfusion because arterial blood water is selectively inverted (or saturated). The loss of the tracer from the blood, inferred from comparison of ‘unlabeled’ and ‘labeled’ T1 maps, is related to perfusion (Schwarzbauer et al, 1996). Absolute CBF maps were obtained by combination of slice selective (‘labeled’ T1 map) and global (‘unlabeled’ T1 map) inversion recovery weighted MRI sequence with multiple inversion recovery points (200 to 2,200 ms).
13C-MRS has a unique capability of measuring the abundant excitatory and inhibitory neurotransmitters, their cycling through astroglial glutamine, and the associated pathways of energy production in vivo because estimates of these fluxes are derived from intravenous infusion of a substrate enriched with the nonradioactive, stable 13C isotope (Rothman et al, 1999). Metabolism of a 13C-enriched substrate (e.g., glucose, acetate, or β-hydroxy butyrate) results in time-dependent appearance of the 13C-label in metabolite pools, thereby allowing flux quantification in absolute units under steady-state conditions. Because brain glutamate is predominantly neuronal, this large pool ‘traps' 13C-label entering the TCA cycle because of exchange with α-ketoglutarate. Infused glucose-C1,C6 labels the C4 carbon in glutamate in the first turn of the neuronal TCA cycle, and C3 plus C2 carbons in the following turn. Thus 13C-turnover time courses of glutamate-C4 can be converted into a measure of TCA cycle flux (VTCA) in neurons. Absolute values of CMRO2 can then be calculated form the measured VTCA using a stoichiometric relationship (Shulman et al, 2004). Time courses of 13C-turnover of glutamate-C4 (and glutamine-C4) as well as subsequent 13C labeling positions were obtained by indirect 13C-MRS (i.e., detection of 13C with sensitivity of 1H (Pfeuffer et al, 1999; Henry et al, 2000; de Graaf et al, 2003)). Then the spectroscopic imaging data (Hyder et al, 2003) were fitted to a metabolic model where flow of 13C-label through pathways was expressed with mass and isotope balance equations (Mason et al, 1992; Gruetter et al, 2001; Patel et al, 2004).
Results
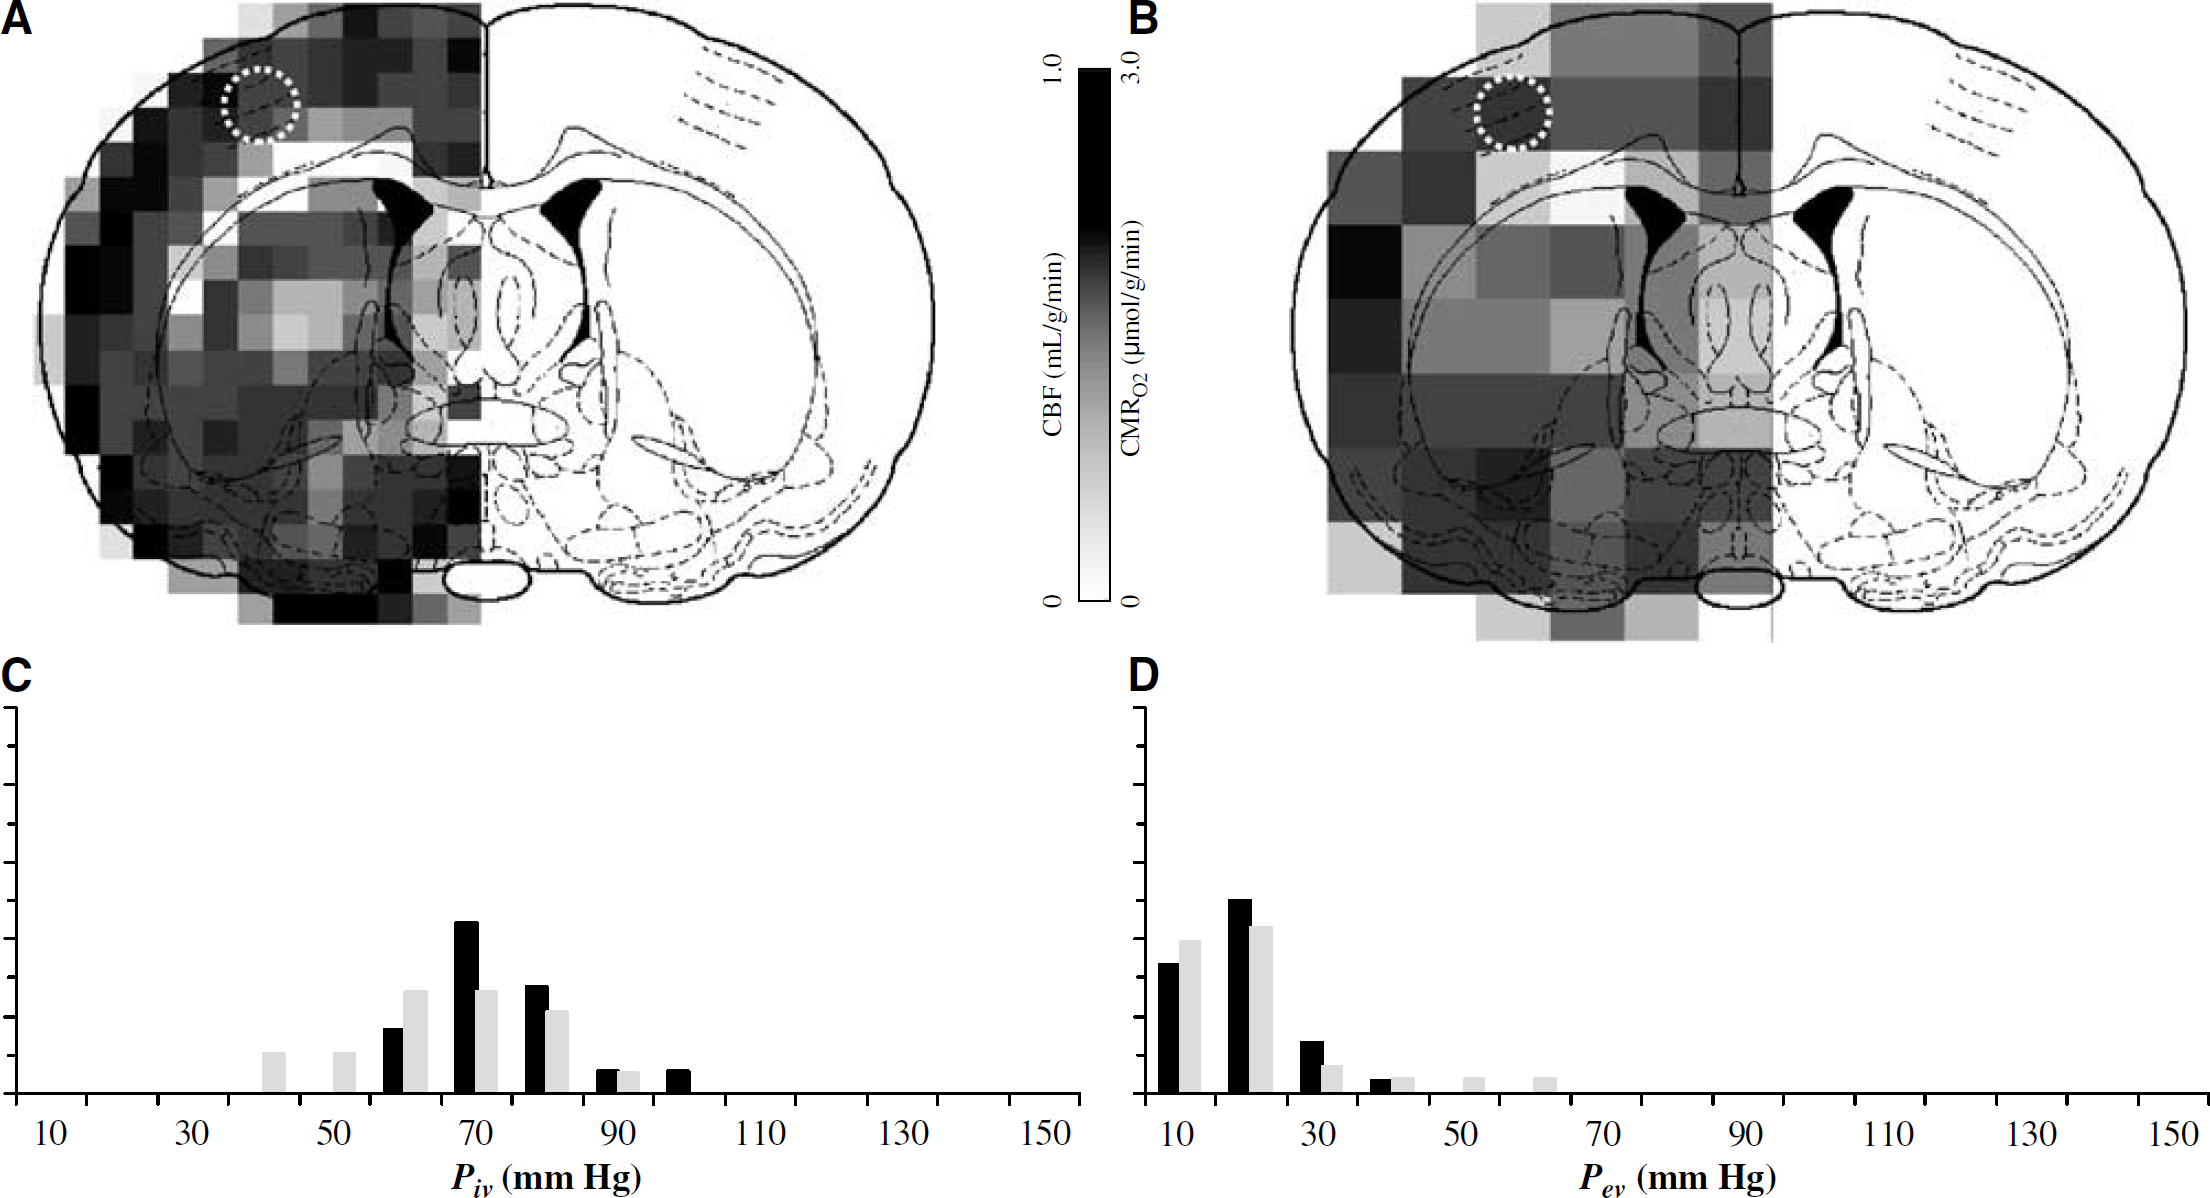
Figures 4A and 4B are examples of CBF and CMRO2 data, respectively, obtained from an α-chloralose anesthetized rat. The averaged values of CMRO2 and CBF in the ROI (1 and 8 voxels, respectively) were 2.5 ± 1.0 μmol/g min and 0.7 ± 0.2 mL/g min, respectively. CBF and CMRO2 in gray matter are usually higher than in white matter (Hyder et al, 2001, 2003).
The average of all measured values of Pa and Pv were 97 ± 10 and 50 ± 10 mm Hg, respectively, which corresponded to blood oxygenation values of 0.96 ± 0.05 and 0.67 ± 0.04, respectively. These Pa and Pv values corresponded to an averaged value for Piv (or Pp) of 74 ± 10 mm Hg using equation (7a). Similarly, the average of all measured values of Pt• was 15 ± 5 mm Hg which corresponded to an averaged value for Pev (or Pt) of 16 ± 5 mm Hg using equation (7b), where the value of Pm ranged from 0.1 and 10 mm Hg. The distributions of Piv and Pev are shown in Figures 4C and 4D, respectively (black bars only).
Multiparametric data of (
Figure 5 shows the dependence of the p2/p1 ratio as a function of p1, when CBF (Figure 5A), CMRO2 (Figure 5B), Piv (Figure 5C), and Pev (Figure 5D) have been altered by 50% from the respective mean value in each case. The reaching of the plateau for the p2/p1 ratio suggests that intermediate or high values of p1 have little influence. Because the p2/p1 ratio is significantly less than 0.1, the probability of unmetabolized (i.e., dissolved) oxygen molecules reentering the blood from the tissue is negligible, which agrees with our preliminary conclusion (see Introduction and Figures 1 and 2).
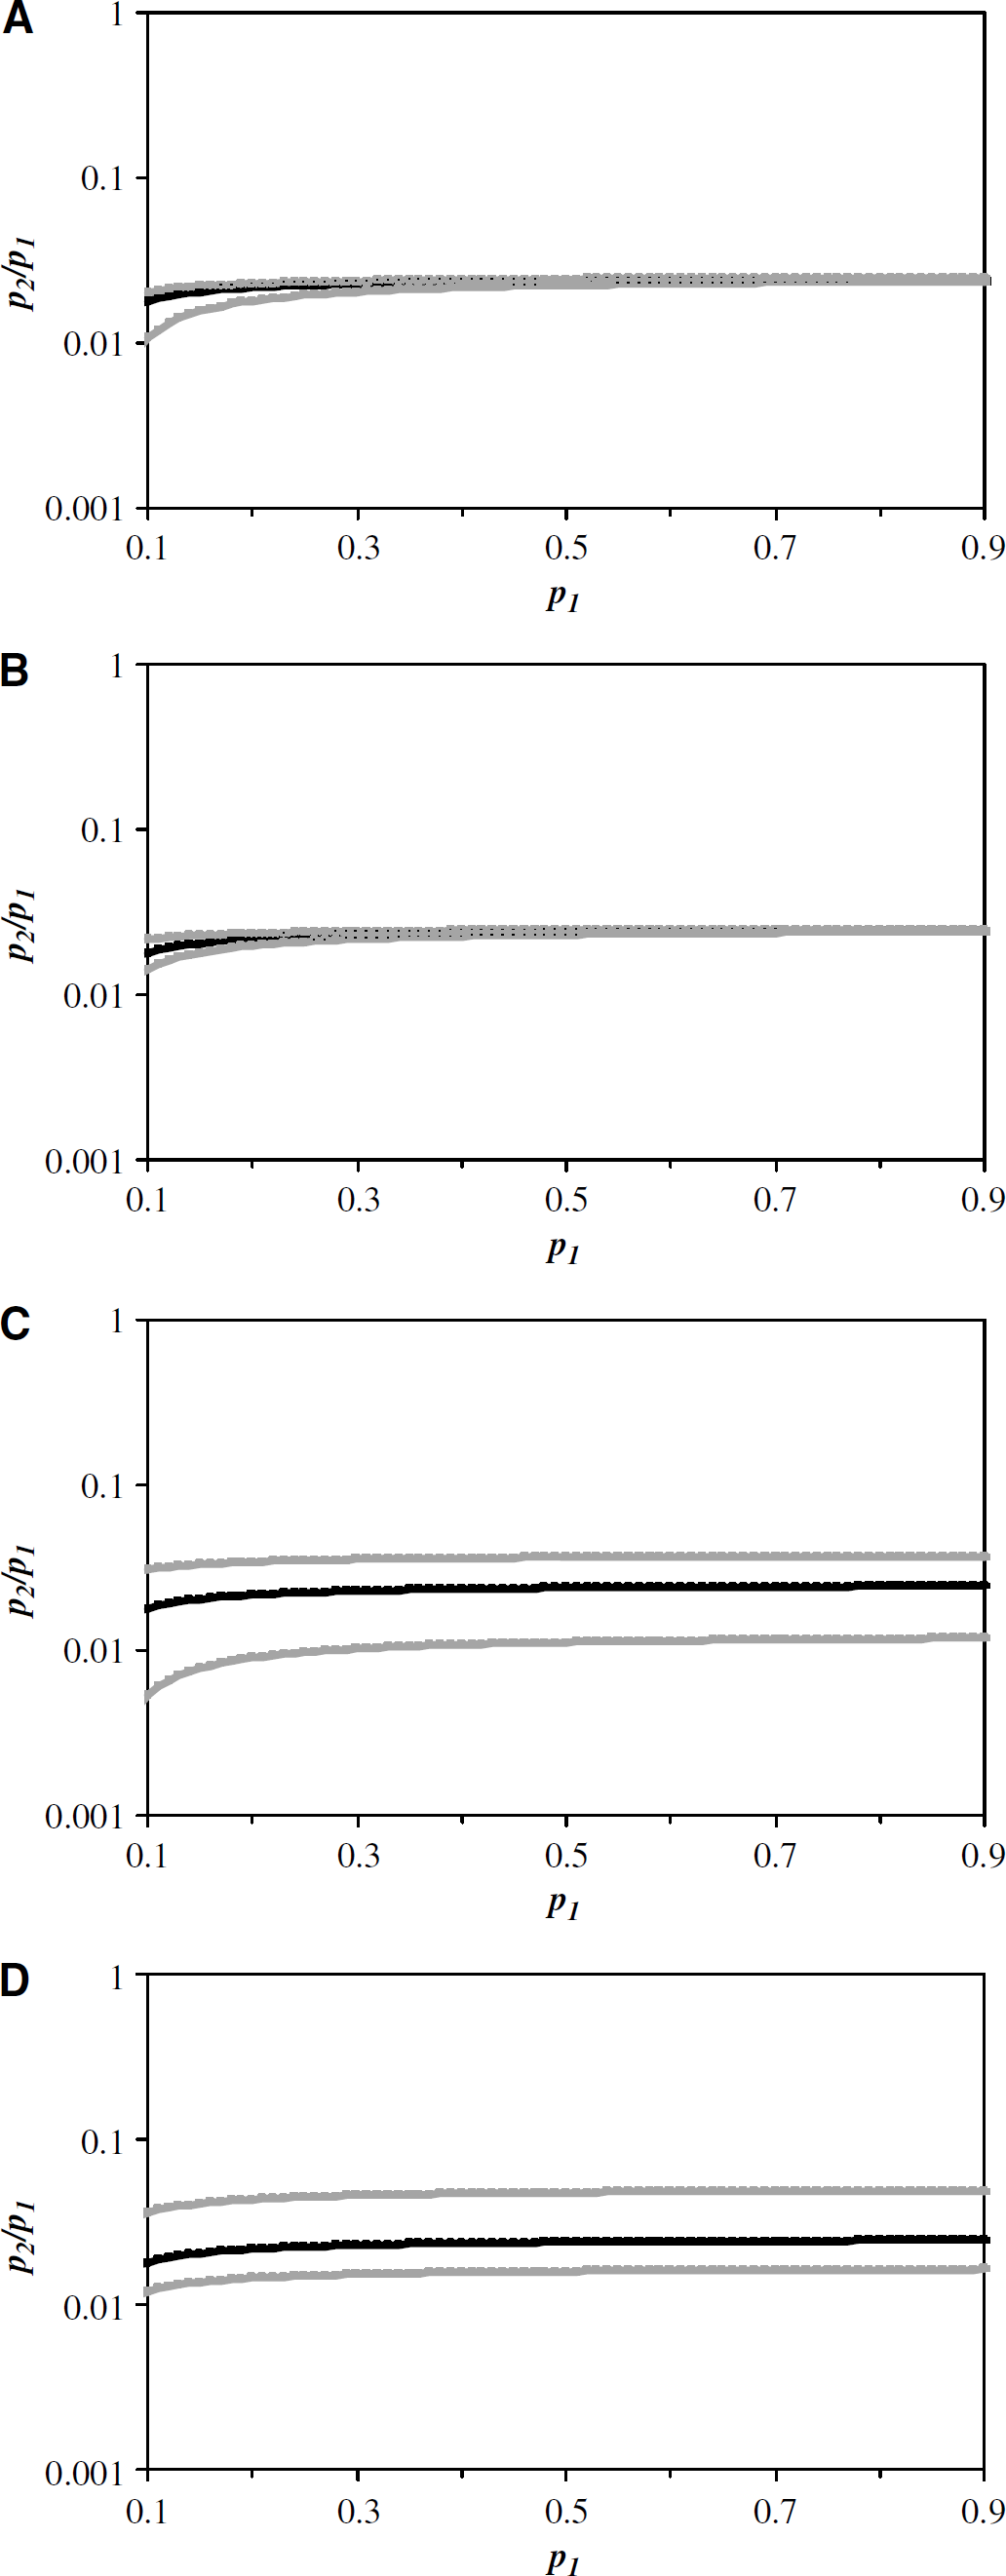
Relationship between the probabilities of oxygen influx into (p1) and efflux from (p2) tissue space (equation (6)) established from the averaged values of CBF, CMRO2, Piv, and Pev from α-chloralose anesthetized rats. The dependence of the p2/p1 ratio as a function of p1 when (
Discussion
The measured values of Piv, Pev, CMRO2, and CBF (Figure 4) were used to determine the relationship between the probabilities of oxygen influx into (p1) and efflux from (p2) tissue space (Figure 5). The p2/p1 ratio was very small, which suggests that the probability of unmetabolized (i.e., dissolved) oxygen molecules reentering the blood from the tissue is quite insignificant. Large errors in the measured value of each parameter had very little effect on the simulated curves of p2/p1 versus p1 (see Results). However, we discuss pitfalls of model predictions that may arise as a consequence of measurement inaccuracies and assumptions.
Because we have previously shown that methodological errors associated with CMRO2 (Shulman et al, 2004) and CBF (Kida et al, 2000) are quite small, it is quite unlikely that the NMR measurement inaccuracies will contribute significantly to the predictions of the model. However, errors associated with the pO2 measurements need to be evaluated.
Uncertainties in the measurement of Pv may affect (equation (7a)) the distribution of Piv because the sagittal sinus collects the drainage from several areas of the brain. Thus, the Piv distribution (Figure 4C) may be slightly reflective of the brain anatomy rather than the regional measurements of CMRO2 map (Figure 4A), CBF map (Figure 4B), and Pev distribution (Figure 4D). However, the arterial and sagittal sinus pO2 values measured in the current study (97 ± 10 and 50 ± 10 mm Hg, respectively) are in good agreement with prior polarogarphic measurements from arterioles (86 ± 10 mm Hg) and venules (44 ± 5 mm Hg) from a similar ROI in the anesthetized rat (Vovenko, 1999). The ‘microscopic’ pO2 from small blood vessels, measured with small-tipped polarogarphic probes, are not significantly different from ‘macroscopic’ pO2 measurements of Pa and Pv using blood gas analysis, suggesting that blood oxygenation is quite homogenous throughout the brain. Therefore Piv values estimated using equation (7a) with these two approaches are likely to be slightly different from each other as shown in Figure 4C (74 ± 10 mm Hg (black) versus 65 ± 10 mm Hg (gray) for current and prior studies, respectively).
An assumption that Pp and Piv were similar was necessary for equation (6). Because the largest and smallest of pO2 gradients estimated between red blood cells and plasma are approximately 6.4 mm Hg (Mochizuki, 1966) and 0.2 mm Hg (Lawson and Forster, 1967), respectively, the assumption that Piv is approximately equal to Pp is probably valid. However, this approximation may not be valid under anemic conditions because cell-plasma pO2 gradients become significant (Homer et al, 1981). But large changes in Piv (or Pp) have very little impact on the p2/p1 ratio (see Figure 5C). Similarly, change in oxygen solubility coefficient of plasma (αp) has a small impact (equation (6)) on the p2/p1 ratio (e.g., value of αp increased by a factor of 5 raises the p2/p1 to plateau at 0.10 ± 0.03).
The Pev values were estimated (equation (7b)) using measured Pt• and in conjunction with an assumed range for Pm. While the Pt• measurements were made by an optical method, the Pm value was assumed to range between 0.1 and 10 mm Hg. Although pO2 measurements using the fluorescence quenching probes (∼250 μm) have slightly different errors (Nwaigwe et al, 2000) in comparison to pO2 measurements with polarographic probes (∼5 μm) because the latter design can be made selective for any specific compartment, the measured pO2 values with both methods are in good agreement (Braun et al, 2001). The measured pO2 values with one technique are usually within 10% of the measured values with the other technique, most likely because Pm is low and the blood volume fraction (fiv) is small (equation (7b)). While specific volume fractions have been assumed for the intravascular (fiv), extravascular (fev), and mitochondrial (fm) compartments, complete exclusion of either the mitochondrial or intravascular compartment has very little impact on the final calculated Pev (or Pt) value (equation (7b)).
The Pev values estimated using equation (7c) with optical or polarographic probes are only slightly different from each other as shown in Figure 4D (16 ± 5 mm Hg (black) versus 15 ± 8 mm Hg (gray) for current and prior studies, respectively). Thus, the Pev (or Pt) distributions from the current study are in very good agreement with prior measurements from the rodent cortex using polarographic methods (Lübbers and Baumgärtl, 1997; Vovenko, 1999). Although the Pm value was allowed to vary by two orders magnitude, it impacted the final calculated Pev value by less than 10%. Studies of pO2 gradients in and around mitochondria (Clark and Clark, 1985; Clark et al, 1987; Gayeski et al, 1987) suggest that mitochondrial-cellular pO2 gradients can be ignored for mathematical modeling of oxygen transport. Thus, a higher Pm value is more favored typically in the brain, which leads to even smaller p2/p1 ratio (see Figure 5D). Similarly, change in the oxygen solubility coefficient of tissue (αt) or the extravascular-intravascular volume ratio (m) has a small impact (equation (6)) on the p2/p1 ratio (e.g., values of αt or m decreased by a factor of 5 raises the p2/p1 to plateau at 0.10 ± 0.04). In addition, it has been shown (Eke et al, 1981) that the product of αt and the apparent diffusion coefficient of oxygen (Krogh, 1919) in the brain is considerably stable even under conditions of sustained cerebral ischemia.
In the model (Figure 3), the incremental back flux of oxygen has been assumed to exist mainly between the tissue and plasma spaces. There are three main arguments for the specificity of back flux between these two compartments, and not others. Dissolved oxygen molecules in the extracellular spaces (of blood and tissue compartments) are more readily exchangeable because the substrate molecules are not likely to be bound to macromolecules in either compartment (Crone, 1984; Popel, 1989). Loss of oxygen molecules from hemoglobin inside the red blood cells, at the right ambient conditions, is a very spontaneous process (Adair, 1925; Roughton, 1932) where the reverse is not at all thermodynamically favored. The mitochondria behave like oxygen sinks (Beard and Bassingthwaighte, 2000, 2001) where metabolized and unmetabolized (i.e., dissolved) pools of oxygen molecules are in exchange (see Theory) causing the equilibrium to vary regionally based on demand (Walley, 1996).
In the model (Figure 3), the parameter n deals with the time constant of oxygen unloading from the red blood cell. The oxygen unloading lifetime from fully saturated (arterial) to less saturated (venous) blood has been calculated to be on the order of tens of milliseconds (Clark et al, 1985; Kagawa and Mochizuki, 1982; Makhijani et al, 1990). Therefore, incremental steps of oxygen unloading within a microvascular unit may be at least on the order of 1 ms, but perhaps the unloading of oxygen for very small incremental steps during transit may likely be even shorter. Because typical blood circulation times of the microvascular unit are on the order of 1 to 2 secs (Cobb and Talbott, 1927; Crumrine and LaManna, 1991; Eke et al, 1979; Meier and Zierler, 1954), the total number of incremental oxygen unloading steps (for an entire transit time) may range from several hundred to a few thousand. However, the impact of changing the parameter n over this range has minimal impact on the simulated results as shown in Figure 5.
The discussions above show that the probability of unmetabolized (i.e., dissolved) oxygen molecules reentering the blood from the tissue is negligible (i.e., p2/p1 ≪ 0.1) and this conclusion holds for a range of physiologic conditions and may be applicable to other noncortical regions. This inference is supported by other studies (see below).
The degree of oxygen back flux from the tissue has been measured by tracer dilution curves (Grieb et al, 1985; Kassissia et al, 1995). The studies used two tracers: a tracer that permeates across the blood—brain barrier and a tracer that does not. In both studies, 18O-oxygen molecules bound to hemoglobin in erythrocytes were used to depict tissue extraction, whereas 51Cr-labeled erythrocytes that remained in the circulation were used as a reference. In both studies, the 18O and 51Cr curves peaked almost at the same time, but in no case did the 18O curve significantly lag behind the 51Cr curve. Thus, the degree of oxygen back flux from the blood into the tissue was concluded to be negligible ‘… the return of tracer oxygen from the extravascular space to the vascular space is small … tracer oxygen outflow curves were invariably below and almost parallel to labeled red blood cell curves … suggesting that there is only a small portion of the tracer returning from the brain tissue to plasma …‘ (Kassissia et al, 1995). However, these tracer results do have the potential of being misinterpreted.
While the endothelial lining of capillaries acts as a barrier for many substrates, the barrier is more permeable to lipophilic substances. A hydrophilic substance may enter the brain through passive diffusion (Chinard, 2000). Similarly, a lipophilic substance like oxygen can influx into the tissue via passive diffusion (Krogh, 1919; Popel, 1989). While passive diffusion of oxygen efflux into the blood against very large chemical gradients is not feasible thermodynamically, this mechanism has been proposed to take part in the normal physiologic function of the brain (Buxton, 2002). If oxygen from the brain diffuses back into the blood, then tissue oxygen can become limiting, and mitochondrial respiration may be impeded. The current observations are contrary to this claim.
An important concern about the issues raised in this study is whether the relationship between p1 and p2 will be valid under other situations, for example, functional activation. Quantitative measurements of CMRO2 and CBF in the rat brain show a pseudolinear relationship (Hyder et al, 2000a), where the CMRO2/CBF ratio changes slightly over a wide range of activity (Hyder et al, 2001). Because changes in pO2 are small during functional challenges (Ances et al, 2001a, b ), it is expected that the relationship between p1 and p2 will be approximately similar with different activity levels. However the exact relationship between p1 and p2 can be determined from multiparametric measurements during stimulation.
Conclusion
In this study, we made multiparametric measurements of Piv, Pev, CMRO2, and CBF, and constructed a model specifically focusing on oxygen back flux from the brain to the blood. We found that oxygen efflux from the tissue can be neglected under most circumstances, thus simplifying calculation of CMRO2 by 15O-PET, 17O-NMR, and calibrated fMRI. The results suggest that oxygen transport across the blood—brain barrier is an efficient process where most of the oxygen molecules that leave the blood compartment are indeed metabolized.
Footnotes
Acknowledgements
The authors thank engineers (Terry Nixon, Peter Brown, Scott McIntyre) of the Magnetic Resonance Research Center at Yale for technical support and Drs Andras Eke, Remco Renken, Robin A de Graaf, Kevin L Behar, and Douglas L Rothman for helpful discussions. FH thanks Arman Hyder for inspiration and PH thanks the Hungarian Research Foundation (OTKA-T34122) for travel support.