
Abstract
Ability to image cerebral metabolic rate of oxygen (CMRO2) is essential for studying the fundamental role of oxidative metabolism in brain function and disease. We have demonstrated recently that three-dimensional (3D) CMRO2 images can be obtained in the rat brain during a 2-min 17O2 inhalation using the 17O MR spectroscopic imaging (MRSI) approach at high field. The feasibility for establishing a completely noninvasive approach for imaging CMRO2 has also been demonstrated. In this study, we further explored the feasibility of 17O MRSI approach for performing repeated CMRO2 measurements within a short period of time and evaluated the reproducibility of the repeated measurements. Subsequently, we applied the 17O MRSI approach to measure CMRO2 and cerebral blood flow (CBF) values at two brain temperatures in the α-chloralose anesthetized rat brain at 9.4 T. Finally, we tested the validity of simplified model for noninvasively determining CMRO2 in normothermic and hypothermic rat brain. The results show (i) an excellent reproducibility among repeated measurements of 3D CMRO2 images under the same physiologic condition; (ii) a 44% decrease of CMRO2 across the rat brain at mild hypothermic (32°C) condition as compared with normothermic (37°C) condition; and (iii) a close correlation between CMRO2 and CBF within a relatively wide physiologic range. This study demonstrates the capability of 17O MRSI approach for noninvasively imaging CMRO2 and its changes caused by physiologic perturbation. This approach, thus, should provide a promising neuroimaging modality for studying oxidative metabolism and bioenergetics associated with brain functions and diseases.
Introduction
The cerebral metabolic rate of oxygen utilization (CMRO2) is tightly associated with brain physiology and pathology (Siesjo, 1978). Determination of CMRO2 is important for understanding the essential role of oxidative metabolism in brain function and brain diseases. The most straightforward nuclear magnetic resonance (NMR) method for directly measuring CMRO2 is the use of 17O NMR technique to determine the dynamic change of metabolic H217O, which is formed in mitochondria through oxygen metabolism of inhaled 17O2 (Arai et al, 1990; Fiat and Kang, 1992; Mateescu and Fercu, 1994; Mateescu et al, 1991; Pekar et al, 1991; Zhu et al, 2002). However, the major challenges of 17O NMR technique are its low intrinsic NMR sensitivity because of the low gyromagnetic ratio of 17O spins and relatively small change in the metabolic H217O concentration generated during an 17O2 inhalation. Recently, we have demonstrated a substantial sensitivity gain for detecting 17O NMR signal at high/ultrahigh magnetic field (Zhu et al, 2001). This crucial sensitivity improvement at higher field can be attributed to the field-independent relaxivity of the 17O spins in H217O, which leads to a significant sensitivity gain according to a quadratic power relation with the magnetic field strength (Zhu et al, 2001, 2005). This gain makes it possible to use the in vivo 17O MR spectroscopic imaging (MRSI) approach for obtaining a three-dimensional (3D) CMRO2 image in a rat brain at 9.4 T during a 2-mins 17O2 inhalation (Chen et al, 2004; Zhu et al, 2002, 2005). Moreover, the feasibility for establishing a completely noninvasive 17O MRSI approach for imaging CMRO2 in vivo and the validity of the simplified approach for quantifying CMRO2 have been demonstrated in the rat brain anesthetized with α-chloralose (Zhang et al, 2004).
One potential and important merit of the 17O MRSI approach is its ability allowing repeated CMRO2 measurements during the same experimental session. Because in the brain tissue, the metabolic H217O generated during a brief 17O2 inhalation can be washed out quickly and reach a new steady-state concentration within approximately 10 mins after the ceasing of 17O2 inhalation (Zhu et al, 2002). This characteristic allows subsequent measurements of CMRO2, which are particularly valuable for studies aiming at CMRO2 changes induced by physiologic or pathologic perturbations. However, to fully realize this advantage, the reproducibility of the repeated CMRO2 measurements has to be assessed and validated. Therefore, the first part of this paper was to evaluate the reproducibility of in vivo 17O MRSI approach for repeated 3D CMRO2 measurements in the rat brain under the same physiologic condition.
It is well documented that the basal CMRO2 is sensitive to the brain temperature (see (Erecinska et al, 2003; Siesjo, 1978) and the references cited therein). However, most studies reported in the literature were based on the global CMRO2 measurements of entire brain using the Kety—Schmidt method (Kety and Schmidt, 1948a, b ), which was lack of spatial information regarding regional CMRO2 variation inside the brain. In the second part of this study, we investigated the feasibility of using 3D 17O MRSI at 9.4 T for imaging and quantifying absolute CMRO2 values in the rat brain at normal brain temperature (37°C) (i.e., normothermia) and mild hypothermia (32°C) conditions. We also compared CMRO2 calculation results based on two different models: a completed model requiring both invasive and noninvasive measurements (Zhu et al, 2002), and a simplified model requiring only one noninvasive measurement of dynamic concentration change of metabolic H217O in the brain tissue during a 2-min 17O2 inhalation (Zhang et al, 2004). This comparison was performed under both normothermia and hypothermia conditions.
Finally, the measured CMRO2 results in this study were correlated with the cerebral blood flow (CBF) results, which were experimentally determined via bolus injection of H217O tracer into the brain through the internal carotid artery (Zhu et al, 2001). These data were obtained from α-chloralose anesthetized rat brains under a wide range of physiologic conditions including both normothermia and hypothermia.
Materials and methods
All NMR experiments were conducted on a 9.4 T horizontal animal magnet (Magnex Scientific, Abingdon, UK) interfaced to a Varian INOVA console (Palo Alto, CA, USA). A multinuclear surface-coil probe consisting of a butterfly-shape 1H coil (400 MHz) and an oval-shape 17O coil (~1 cm × 2 cm, 54.25 MHz) was used for acquiring anatomic 1H images and in vivo 17O MRSI data, respectively. Scout images were acquired using a turbo fast low-angle shot (TurboFLASH) imaging sequence with the following acquisition parameters: repetition time (TR) = 8 msecs; echo time (TE) = 4 msecs, field of view (FOV) = 3 cm × 3 cm, and image matrix size = 128 × 128. The spatial localization of 17O MRSI was achieved by using the 3D Fourier series window approach (Hendrich et al, 1994; Zhu et al, 2001). All animal surgical procedures and experimental protocols were approved by the Institutional Animal Care and Use Committee of the University of Minnesota.
Reproducibility Study
Five male Sprague—Dawley rats (body weight: 234 ± 23 g) were used for studying the reproducibility of two repeated CMRO2 measurements in the same rat and experimental session. The rats were anesthetized with ~ 2% (v/v) isoflurane in a mixture of O2 and N2O gases (2:3) during surgery. After oral intubations, femoral artery and vein were catheterized for physiologic monitoring and/or blood sampling and chemical administration. Four of the five rats also underwent a surgical procedure for CBF measurements via a bolus injection of H217O directly into the brain through the internal carotid artery (see surgical details in Zhu et al, 2001). After surgery, anesthesia was switched to α-chloralose by a bolus injection (40 mg/kg) and following continuous infusion (~ 20 mg/kg/h) of α-chloralose solution. Blood gases were sampled for monitoring physiologic conditions (pH = 7.39 ± 0.05, pCO2 = 38 ± 6 mm Hg, pO2 = 148 ± 13 mm Hg, n = 5). The arterial blood pressure (110 ± 13 mm Hg) and heart rate (410 ± 25/min) were also monitored during the experiment. The rectal temperature of the rats was maintained at ~ 37°C by using a heated circulating water blanket.
For 17O2 inhalation experiments, the 17O-labeled O2 gas (68.3% enrichment, ISOTEC) was mixed with N2O gas (~ 2:3) and stored in a cylindrical gas reservoir. The 3D 17O MRSI acquisitions were performed with the normal gas mixture with nonlabeled O2 gas first; these natural abundance 3D 17O MRS images were used as references for quantifying metabolic H217O concentrations in the rat brain during and after 17O2 inhalation (Zhu et al, 2002). Then the respiration gas was quickly switched to the 17O2-labeled gas mixture while the continuous 17O MRSI acquisitions were not interfered. After ~ 2 min of 17O2 inhalation, the gas line was switched back to the normal gas mixture, and the 3D 17O MRSI acquisitions were continued for ~ 15 mins after the ceasing of 17O2 inhalation. The second 17O2 inhalation and CMRO2 measurement were performed in the same fashion within ~ 30 to 60 min after the completion of the first 17O2 inhalation. The CBF measurement was performed after the second 17O2 inhalation experiment via a bolus injection of H217O tracer (~0.05 to 0.1 mL, 50% enrichment, ISOTEC) into the brain via an internal carotid artery. The physiologic conditions of the animal during these measurements were kept as close as possible.
The acquisition time for each 3D 17O-MRSI data set was 11.5 secs with following parameters: TE = 0.4 msecs; TR = 12 msecs (≈ 3 times of the longitudinal relaxation time of 17O water (Zhu et al, 2001)); FOV = 2.8 × 2.8 × 2.4 cm3; 9 × 9 × 5 phase encodes; voxel size = 105 μL; radio frequency (RF) (hard) pulse length = 50 μs and spectral width = 15 kHz. A 17 × 17 × 9 matrix of free induced delays (FIDs) was generated from the original 9 × 9 × 5 phase encode data for each 3D 17O MRS image. The FIDs were zero-filled, and a 100-Hz line broadening was used before fast Fourier transformation for signal to noise ratio (SNR) enhancement. The 17O NMR signals from each voxel were quantified by measuring the H217O resonance peak intensities, which were then converted to absolute H217O concentrations using the natural abundance H217O NMR signal from the same voxel as an internal reference. The H217O concentration was used to calculate CMRO2 for the 17O2 inhalation experiments and/or calculate CBF for the H217O bolus experiments. The CBF values were quantified from the H217O signal decay rate after a bolus injection of H217O tracer (Zhu et al, 2001).
Normothermia and Hypothermia Comparison Study
Five male Sprague—Dawley rats (body weight: 283 ± 25 g) were used for this study. The general surgical procedures were the same as described in the previous section. In addition, three of the five rats underwent a surgical preparation for the CBF measurement; and two of these three rats were also implanted a vascular 17O RF coil, tuned at the 17O Larmar frequency and wrapped around the intact carotid artery, allowing simultaneous measurement of arterial input function of H217O (Ca(t)) and the brain H217O (Cb(t)) signal with two 17O RF coil configuration and two receiver channels (Zhang et al, 2003; Zhu et al, 2002). The physiologic conditions of the rats, including arterial blood pressure, heart rate, inspired and expired gases were recorded throughout the experiment. Blood gases were sampled at different periods of the study. The rat brain temperatures under normothermic and hypothermic conditions were also monitored via a temperature sensor (PhysiTemp Instrument), which was inserted into the inner ear of the rats without poking through the membrane. After surgical preparation and animal settled inside the magnet, the anesthesia was switched to α-chloralose (initial bolus of 40 mg/kg followed by continuous infusion with infusion rate of ~ 25 mg/kg/h). The normothermic and hypothermic conditions were controlled via a rectal temperature probe and a circulating water blanket with heated or refrigerated water.
Under stable normothermic condition (37°C), a short 17O2 gas (72.1% or 89.9% enrichment) inhalation (~ 2 min) was performed on each rat, followed by a CBF measurement via bolus injection of H217O tracer (~ 0.05 mL, 50% enrichment) if it was applicable. After these measurements, the water pump for the circulating water blanket were switched to refrigerant mode and allowing the animal temperature to gradually decrease. When the body temperature of the rat reached the desired mild hypothermic (32°C) condition, the water pump was switched back to the heating mode to maintain the temperature at 32°C. This cooling process took approximately one and half hours. When the animal reached a stable hypothermic condition, second 17O2 inhalation experiment was performed on each rat. Therefore, the averaged time interval between the two CMRO2 measurements for this study was longer than 2 h.
The parameters for acquiring 3D 17O MRSI data were varied slightly among the rats in this group but were kept same for each rat. The acquisition time for each image was 10 to 12 secs with TR of 10 to 12 msecs and TE of 0.35 to 0.4 msecs. The voxel size was ~50 to 100 μL with FOV of 2.2 × 2.2 × 1.8 cm3 to 2.8 × 2.8 × 2.4 cm3 and phase encodes of 9 × 9 × 5. A 50-μs RF hard pulse and 30 kHz spectral width were used for data acquisition, and a 17 × 17 × 9 matrix of FIDs was generated from the original 9 × 9 ×5 phase encode data for each 3D 17O image. General data process and quantification procedures were the same as described above. The time courses of the metabolic H217O generated in each 17O MRSI voxel were used to determine the CMRO2 values and create 3D CMRO2 images.
Comparison of Complete Model and Simplified Model for CMRO2 Calculation
The dynamic change in the cerebral H217O concentration during an 17O2 inhalation is determined by three parallel processes: (i) cerebral oxygen utilization for generating the metabolic H217O in the brain tissue, (ii) blood perfusion resulting in H217O washout from the brain, and (iii) blood flow recirculation bringing the metabolically generated H217O in the entire living body into the brain. The mass balance of the 17O-labeled H217O concentration in the brain tissue during the period of 17O2 gas inhalation can be derived as (Kety and Schmidt, 1948a; Zhang et al, 2004; Zhu et al, 2002)
where Ca(t), Cb(t) and Cv(t) are the H217O concentrations in excess of the natural abundance H217O concentration level in the arterial blood, brain tissue and venous blood, respectively, as a function of 17O2 inhalation time (t, unit = min); α is the 17O-enrichment fraction of inhaled 17O2 gas; λ is the brain/blood partition coefficient. Two unit conversion factors, f1 = 1.266 and f2 = 1.05, are used to achieve consistency of units among all variables used in Eq. (1). The correction factor m was used to account for the fact that water is not completely freely diffusible across the brain—blood barrier. The constant n was a correction factor that accounts for another type of restriction on the permeability specifically for the metabolically generated H217O inside the mitochondria and it can be determined experimentally (Zhu et al, 2005, 2002). In general, Ca(t) is linearly proportional to the inhalation time and can be expressed as Ca(t) = At, in which A is a constant (Zhu et al, 2005, 2002). Solving the linear differential equation of Eq. (1) led to the following equation:

Therefore, the CMRO2 value at each data point measured at different inhalation time can be calculated using the experimental data of CBF, A, n, Cb(t), and other known constants (f1, f2, m, α, and λ) according to Eq. (2). This quantification approach according to Eq. (2) is defined as a complete model, which accounts for all required parameters for precisely determining CMRO2 (Zhang et al, 2004; Zhu et al, 2005, 2002). However, this approach requires both invasive measurements (e.g., CBF, A and n measurements) and the noninvasive measurement of Cb(t).
In contrast, the invasive measurements could be eliminated by using the simplified model based on the Taylor's and Polynomial Theorems (Zhang et al, 2004). Briefly, the Cb(t) time course can be expressed by a polynomial expansion

In this expansion, the first-order coefficient of a1 can be used to calculate CMRO2 using the following equation:
where α and f1 are known constants. Thus, using the simplified model, only the experimental data of Cb(t) measured by in vivo 17O MRSI approach is needed and it can be fitted to the polynomial function given by Eq. (3) to calculate a1, and ultimately CMRO2 according to Eq. (4). In this study, the polynomial function was approximated by a linear function for a short 17O2 inhalation time (Zhang et al, 2004).
For the rats performed with multiple measurements of Ca(t), Cb(t), and CBF, both complete model and simplified model (linear fitting) were used for calculating and comparing CMRO2 values at both normothermia and hypothermia conditions. The difference of CMRO2 obtained at these two conditions reflects the change of CMRO2 induced by temperature change. The CMRO2 values calculated with completed model and/or simplified model from the same experimental data reflected the accuracy of the simplified model for quantifying CMRO2 at normal brain temperature and mild hypothermia conditions.
Data and results are reported as means ± standard deviation (s.d.).
Results
In vivo 3D 17O MRSI of Rat Brain
Figure 1 demonstrates an example of 3D 17O MRS images (~ 11 secs data acquisition and 75 μL voxel size) of natural abundance H217O and corresponding 1H anatomic images from a representative rat brain acquired at 9.4 T. Five adjacent coronal slices covering the 17O RF coil-sensitive region of the rat brain are shown for both 17O and 1H images. The relative 17O RF coil size and position (cross-section) on each slice are depicted in the anatomic images. The nonuniform spatial distributions of 17O NMR signal in the 17O MRSI data are because of the inhomogeneous RF field (B1) given by the 17O surface coil used in the study. Nevertheless, excellent SNR of 17O signal is evident, especially for the central image voxels.
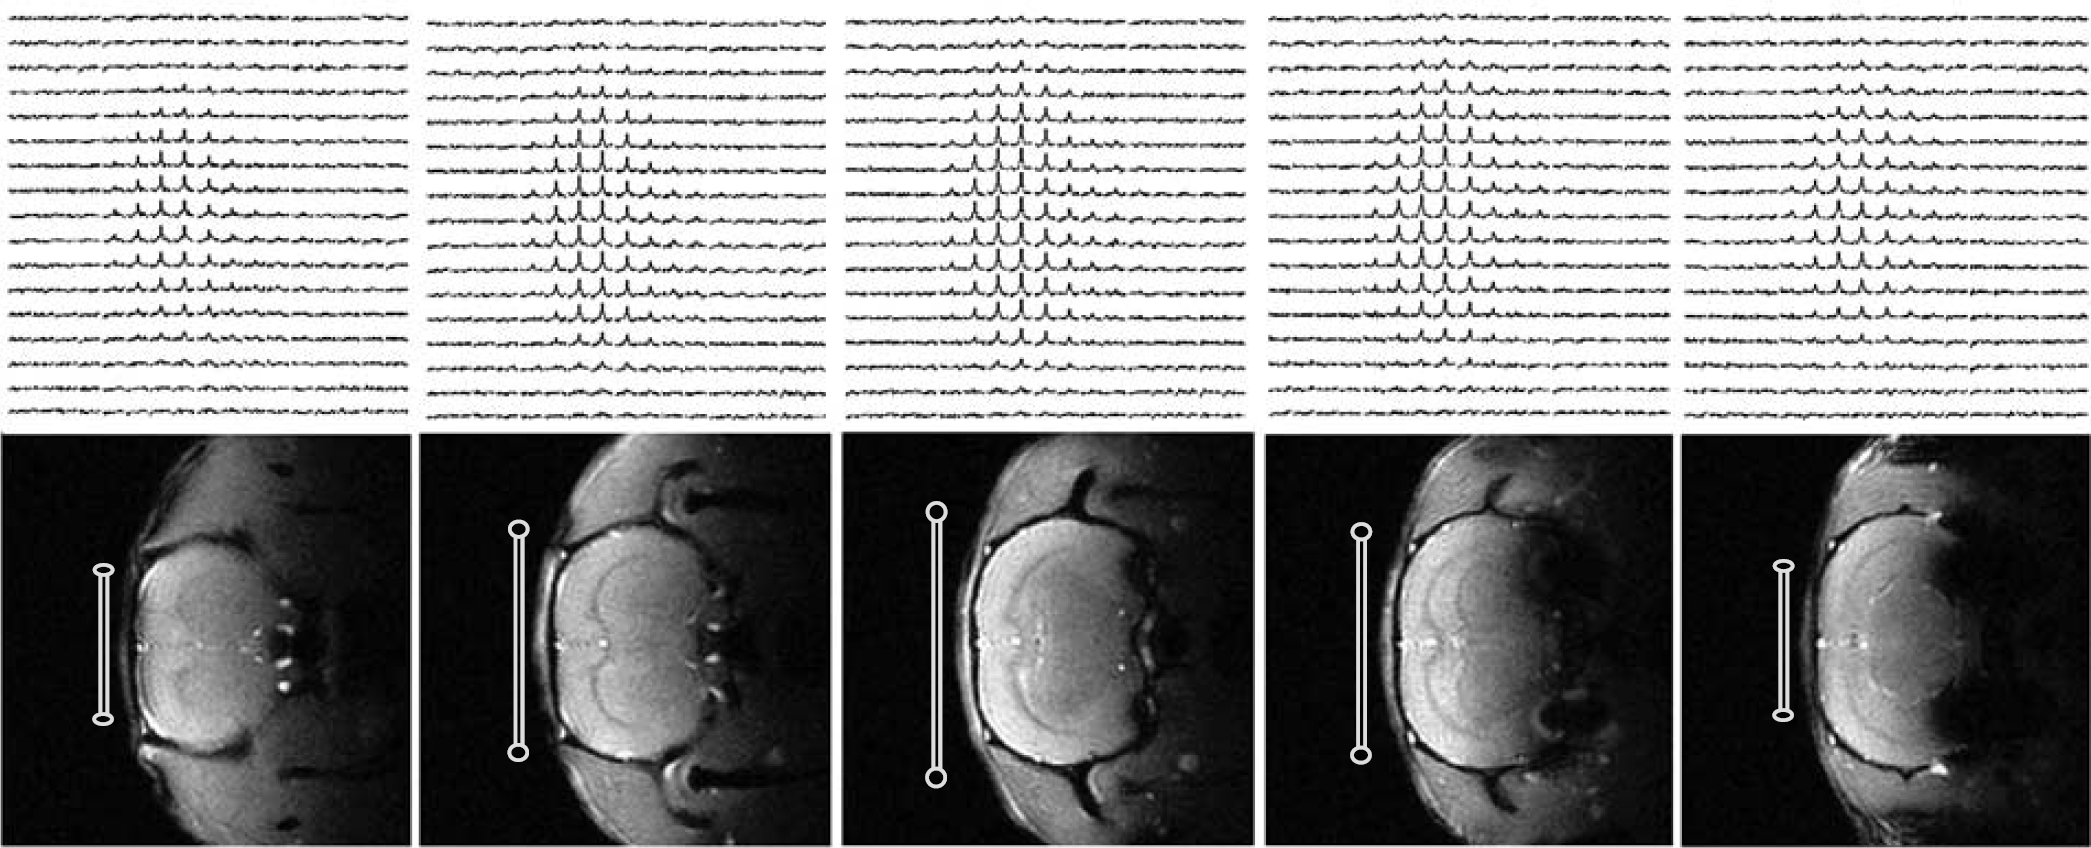
3D 17O MRSIs of natural abundance H217O (top row) and corresponding 1H anatomic images (bottom row) of rat brain at 9.4 T. The 17O RF surface coil positions and cross-sections are indicated in the images. The parameters for acquiring these 3D 17O MRSI data were: FOV = 2.5 × 2.5 × 2.2 cm3; voxel size = 75 μL; acquisition time = 11 secs.
Reproducibility Study of Repeated CMRO2 Measurements
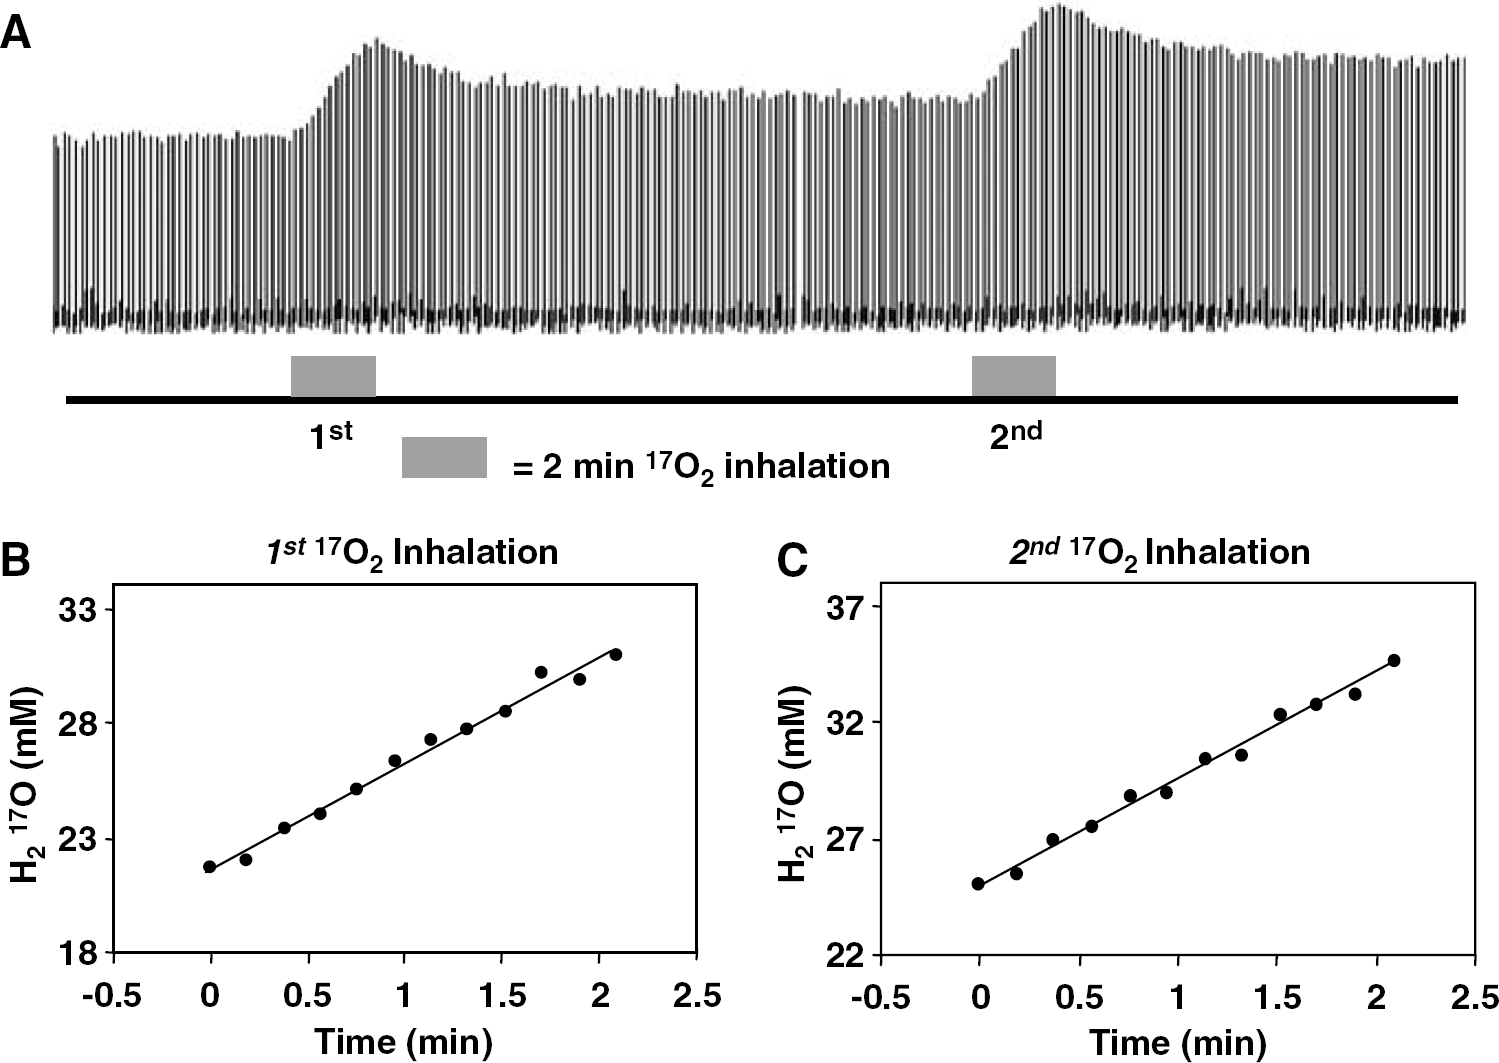
Figure 2A shows the stacked plots of H217O spectra from a central voxel of 3D 17O MRS images acquired before, during, and after two consecutive 2-min 17O2 inhalations from a representative rat brain. The excellent sensitivity of 17O signal and the stability of magnetic resonance imaging scanner are clearly demonstrated in this figure, which are important for detecting the dynamic change of the metabolic H217O content in the rat brain during and after 17O2 inhalation. Figure 2B and Figure 2C are the linear fittings of the H217O concentration change in the same voxel during first and second 17O2 inhalations, which were used for calculating CMRO2 (Zhang et al, 2004; Zhu et al, 2002, 2005). The CMRO2 values in this particular voxel were almost identical between the first and second measurements (2.65 and 2.63 μmol/g/min) under the same physiologic condition.
(
Figure 3 provides a voxel-by-voxel-based comparison of two CMRO2 measurements in a representative rat brain under the same physiologic condition. Total 305 voxels located in the 17O RF coil-sensitive regions (similar as shown in Figure 1) were used for the comparison. The ratios of the first measured CMRO2 to the second measured CMRO2 for each voxel were calculated. The linear correlation coefficient (R) between the first and second CMRO2 measurements shown in Figure 3 was 0.77. The averaged CMRO2 ratio between these two measurements from all analyzed voxels was closed to unity (1.02 ± 0.09) for this rat.
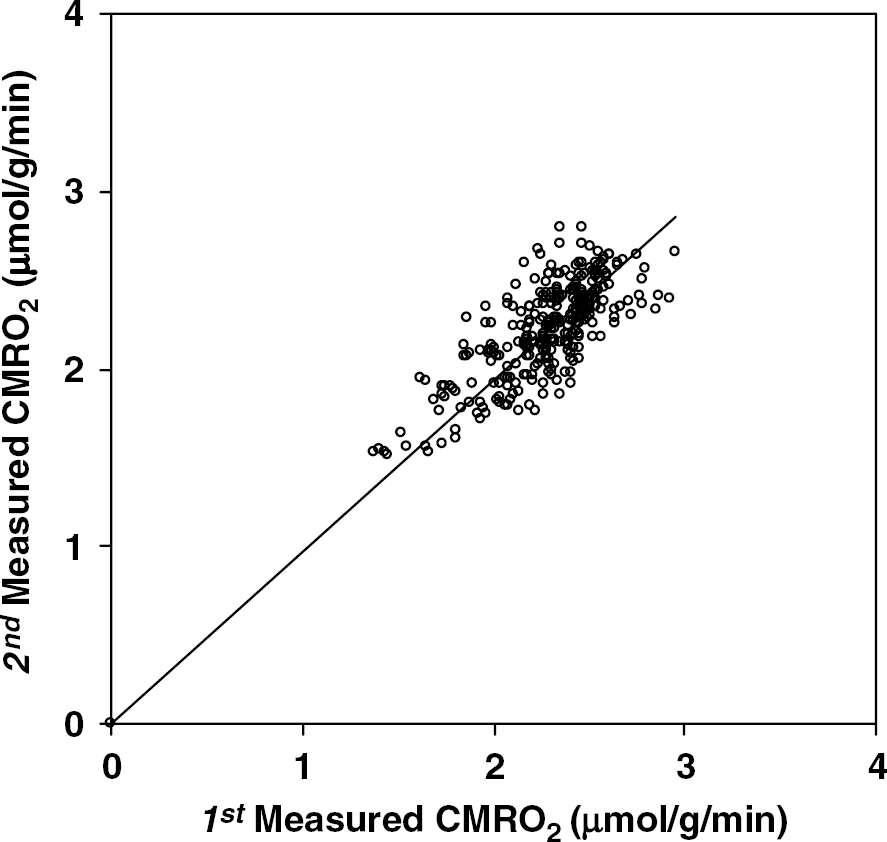
A voxel-by-voxel-based comparison of two consecutive 3D CMRO2 measurements in a representative rat brain. CMRO2 ratio (1st/2nd) = 1.02 ± 0.09 and correlation coefficient = 0.77 (total voxel number = 305).
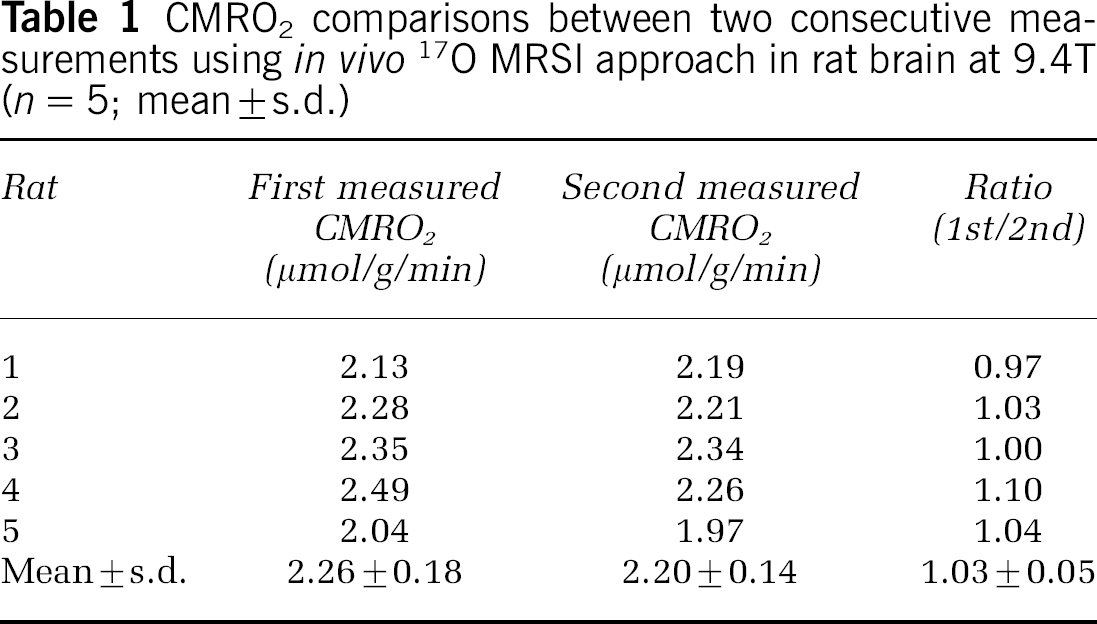
The same data analysis method was applied for each of the five rats that underwent reproducibility study. The results are summarized in Table 1. The mean ± s.d. values of the first and second measured CMRO2 values of these five rats were 2.26 ± 0.18 and 2.20 ± 0.14 μmol/gmin, respectively; and the CMRO2 ratio (1st/2nd) was 1.03 ± 0.05 (n = 5) with an average voxel number of 290 ± 38 (n = 5) per rat used for analysis. In four of the five rats, the differences between two CMRO2 measurements were well within a 5% margin, and the difference was ~ 10% for the other rat. Paired t-test show that P ≥ 0.25 (n = 5), indicating that the first and second measured CMRO2 values are statistically identical.
CMRO2 comparisons between two consecutive measurements using in vivo 17O MRSI approach in rat brain at 9.4T (n = 5; mean ± s.d.)
CMRO2 Measurements at Normothermia and Hypothermia Conditions
Physiological parameters of the rats under normothermia (37°C) and mild hypothermia (32°C) conditions are summarized in Table 2. While the blood gas data (pH, pCO2, and pO2) were similar for the rats at two brain temperatures, the mean arterial blood pressure and the heart rate of the animal decreased significantly under the hypothermia condition.
Physiological data of rats at normothermia and hypothermia condition (n = 5; mean ± s.d.)
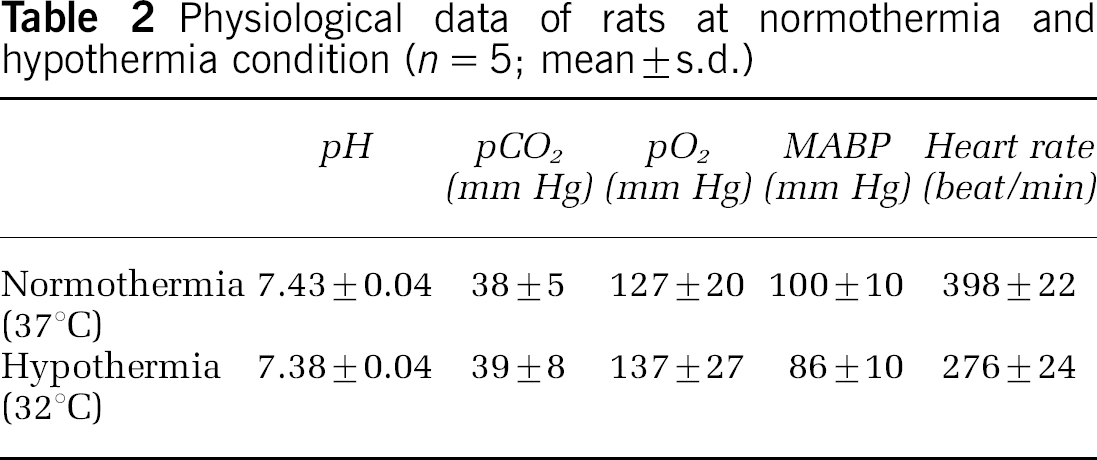
Figure 4 illustrates the cerebral concentration changes of metabolic H217O in a single voxel taken from the 3D 17O MRS images as a function of inhalation time during the first 17O2 inhalation at 37°C and second 17O2 inhalation at 32°C, respectively. The accumulation rate of metabolic H217O during an 17O2 inhalation was significantly decreased under the hypothermia condition. The linear fittings to the two time courses of Cb(t) from the same voxel indicate a dramatic CMRO2 change (1.9 μmol/g/min at 37°C versus 1.1 μmol/g/min at 32°C).
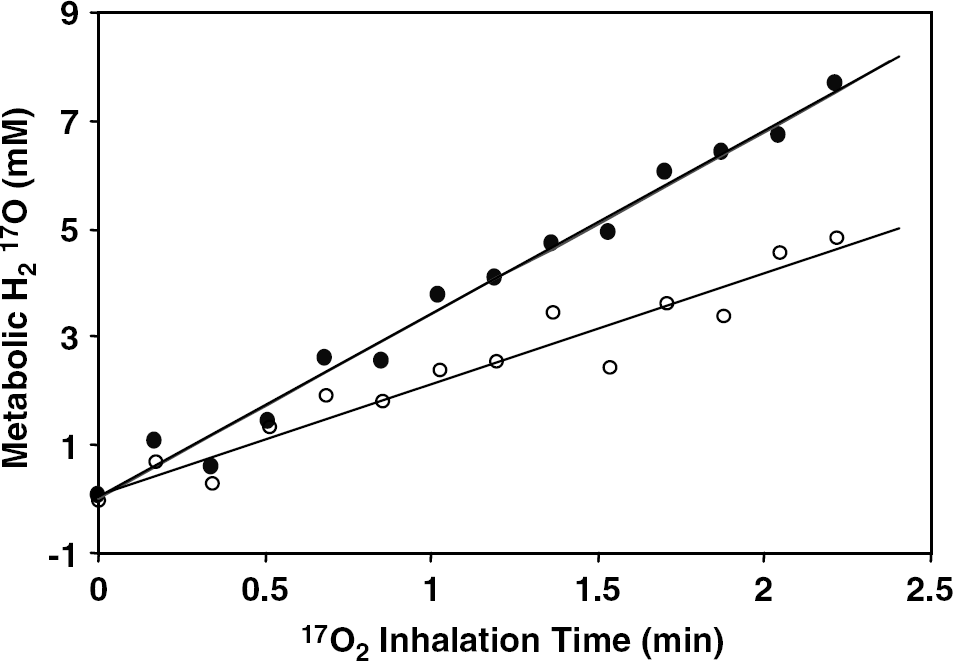
Dynamic changes of metabolic H217O concentration during 17O2 inhalation from a representative voxel (~ 105 μL, similar location as in Figure 2) in the rat brain at normal temperature (37°C, full circles) and during mild hypothermia (32°C, open circles). The linear fitting of the data was used for calculating CMRO2 values at two temperatures (= 1.9 μmol/g/min at 37°C and 1.1 μmol/g/min at 32°C).
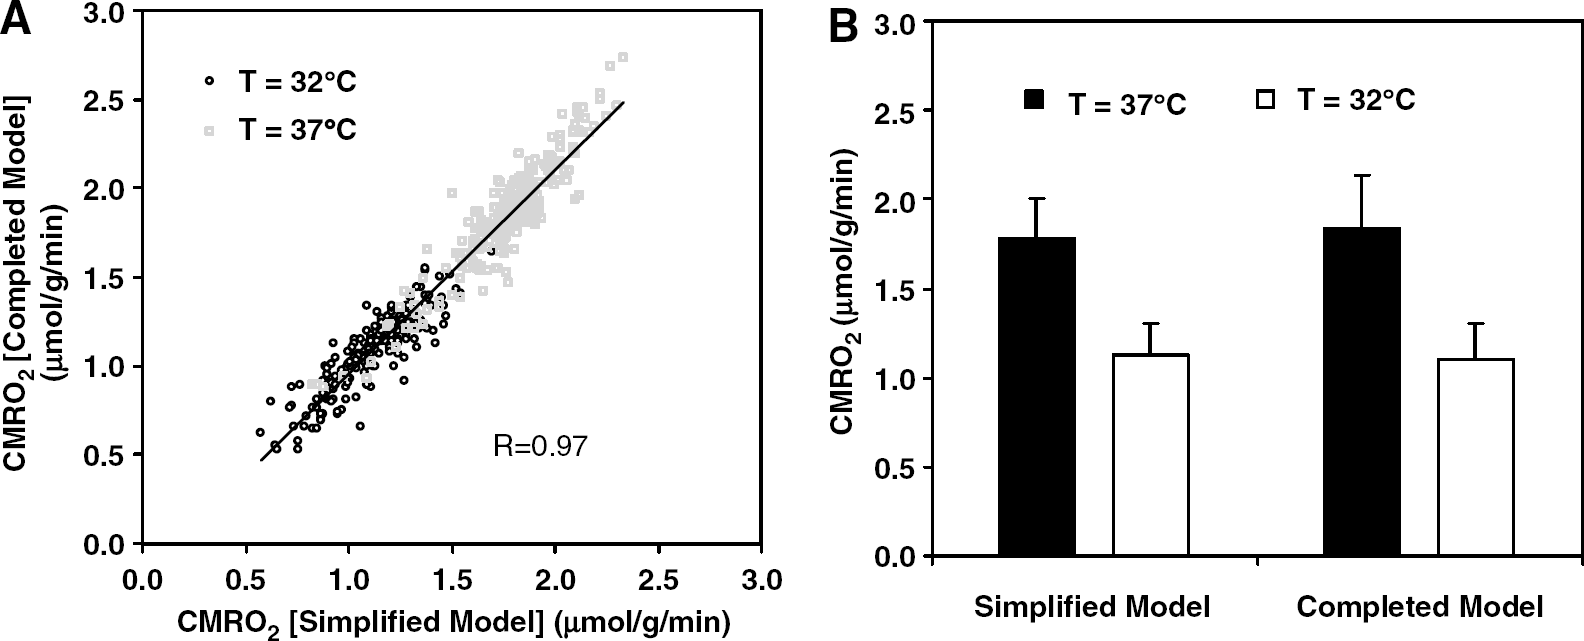
We have demonstrated previously that under normal physiologic condition, CMRO2 calculations based on the complete model, which requires invasive procedures and rigorous measurements of Cb(t), Ca(t), CBF, and n in the same animal, are in good agreement with the CMRO2 calculation based on the simplified model which requires only one noninvasive measurement of Cb(t) (Zhang et al, 2004; Zhu et al, 2005). In this study, we performed similar measurements in the rat at normal temperature as well as under mild hypothermia to test whether the validity of the simplified model still holds in a wider physiologic range. Figure 5 shows the results of such a study in a representative rat brain in which all parameters involved in the CMRO2 calculation according to the complete model were measured explicitly (Zhang et al, 2004). The CMRO2 values calculated with the complete model and simplified model for each individual 17O MRSI voxels of the rat brain at 37°C and 32°C are presented in Figure 5A. The consistency and tight correlation (R = 0.97) between calculated CMRO2 values using these two models are clearly evident for both normothermia and hypothermia conditions. The averaged CMRO2 values of this rat at two different brain temperatures determined with both models are demonstrated in Figure 5B (complete model: CMRO2 = 1.84 ± 0.29 μmol/g/min at 37°C versus CMRO2 = 1.10 ± 0.20 μmol/g/min at 32°C; simplified model: CMRO2 = 1.77 ± 0.23 μmol/g/min at 37°C versus CMRO2 = 1.13 ± 0.17 μmol/g/min at 32°C). These CMRO2 values obtained with two models are in excellent agreement at both temperatures without statistic difference. This result reveals that the simplified model based on linear fitting provides a good approximation for the true CMRO2 values determined by the complete model, and this is valid not only under normal physiologic condition but also in the mild hypothermic rat brain. Using this simplified model, we could obtain 3D CMRO2 maps of the rat brain in a completely noninvasive way. Figure 6 illustrates an example showing three representative slices of 3D CMRO2 maps from a rat brain under normothermia (Figure 6A) and hypothermia (Figure 6C) conditions, as well as the corresponding anatomic images (Figure 6B). These images clearly displayed significant reduction of CMRO2 across the entire brain induced by decreasing brain temperature several degrees. The reduction of the CMRO2 during hypothermia is consistently observed in other four rats studied. Figure 7 summarizes the CMRO2 values calculated with the simplified model in the rat brains at normothermia (37°C, CMRO2 = 1.84 ± 0.09 μmol/g/min) and hypothermia (32°C, CMRO2 = 1.02 ± 0.09 μmol/g/min) conditions (n = 5). The averaged voxel number used for calculating CMRO2 for each rat was 249 ± 17 (37°C) and 243 ± 16 (32°C).
(
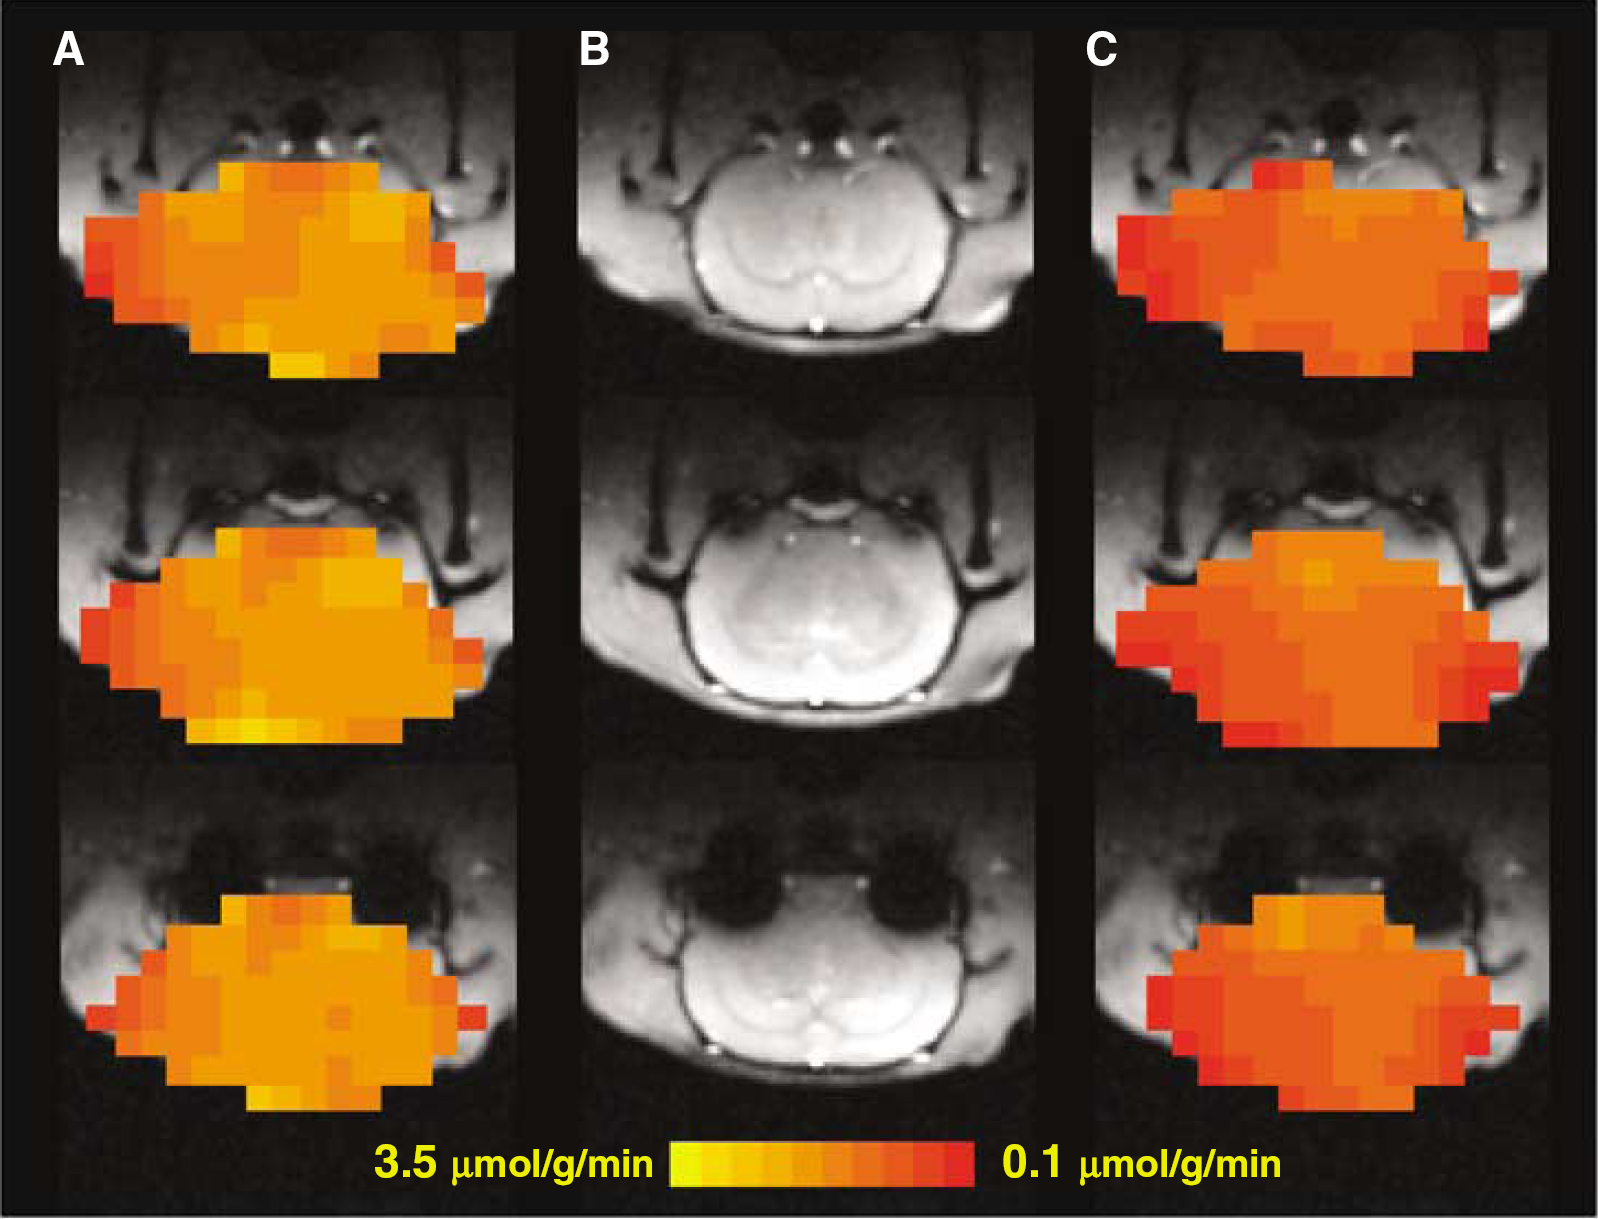
Three-dimensional CMRO2 maps of a representative rat brain at (
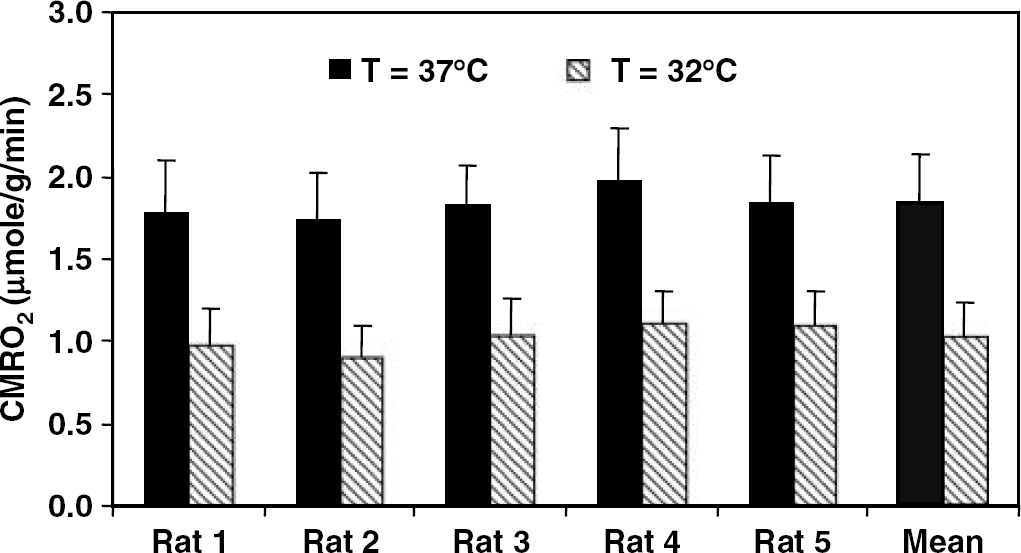
Measured CMRO2 values of individual rat calculated with the simplified model at normothermia (37°C) and hypothermia (32°C) conditions. The right bars show the means and s.d.'s of measured CMRO2 values (n = 5) at normothermia and hypothermia conditions.
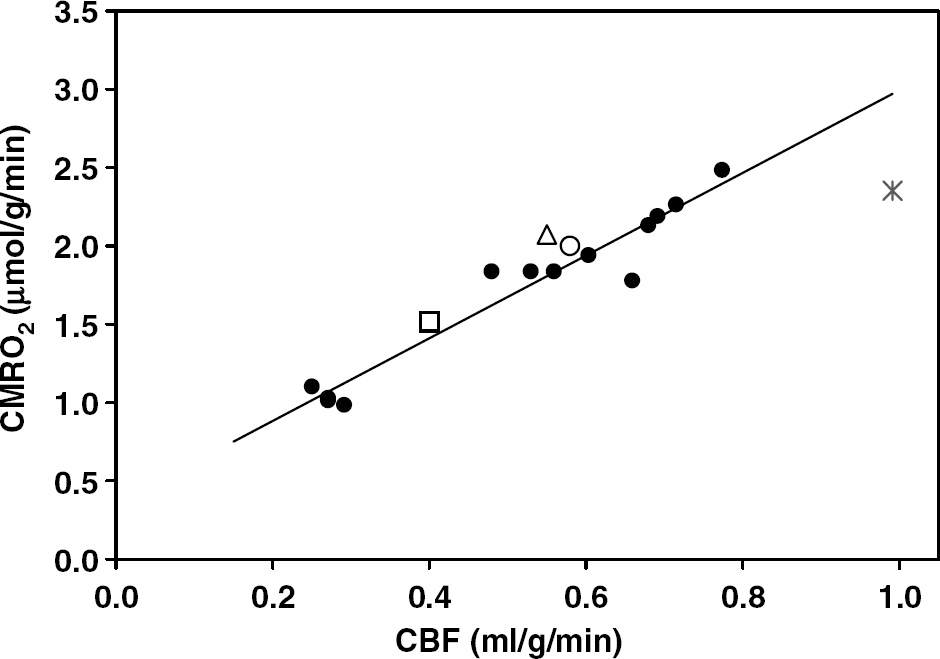
Correlation of CBF and CMRO2 values in the rat brains anesthetized with α-chloralose at brain temperature range of 32°C to 37°C (•). The linear correlation coefficient (R) was 0.97. The open symbols depicted CBF and CMRO2 data from literature in α-chloralose-anesthetized rat brain measured either directly with micro positron emission tomography ((Δ); Yee et al, 2005, 2006), or indirectly with 13C NMR technique ((□); Hyder et al, 2000), or autoradiography ((○) (Nakao et al, 2001) and (*) (Cholet et al, 1997)) techniques.
Correlation Between CMRO2 and CBF
In addition to mapping CMRO2 in the rat brain, the 17O MRSI approach was used to determine absolute CBF in a subgroup of rats in both reproducibility study (CBF = 0.72 ± 0.07 mL/g/min (n = 4)) and normothermia/hypothermia comparison study (CBF = 0.56 ± 0.14 (37°C) and 0.27 ± 0.13 (32°C) mL/g/min (n = 3)). Because the physiologic conditions of these rats covered a relatively wide range, it would be interesting to examine the relation between the CMRO2 and CBF among these rats. Figure 8 summarizes the absolute values of CMRO2 versus CBF in the α-chloralose-anesthetized rat brains. It shows a strong correlation between CBF and CMRO2 in the rat brain at temperature ranging from 32°C to 37°C with a linear correlation coefficient of R = 0.97. This tight correlation was observed in the rat brains with the averaged CBF values ranging from 0.2 to 0.8 mL/g/min and averaged CMRO2 values ranging from 1.0 to 2.5 μmol/g/min, which were experimentally determined in our study. In addition to our results, we also included in this figure the CBF versus CMRO2 data from the literature reports of rat brains under similar α-chloralose anesthesia. These literature data, particularly CMRO2 values, were obtained either directly (e.g. measure CMRO2 with micro positron emission tomography (Yee et al, 2006)) or indirectly (e.g. measure oxidative glucose consumption rate (CMRglc, total) with 13C MRS (Hyder et al, 2000) or total glucose consumption rate (CMRglc, total) with autoradiography (Cholet et al, 1997; Nakao et al, 2001)) with various independent technical modalities and they agreed well with our results.
Discussion and conclusion
The superior 17O NMR sensitivity available at ultrahigh field makes it possible for detecting and imaging small dynamic changes of metabolic H217O during a brief inhalation of 17O2, and ultimately, for imaging CMRO2 in three dimensions in the rat brain (Zhu et al, 2001, 2002). In this study, we further extended our investigation to address one important aspect of 17O MRSI approach, that is, the reproducibility of CMRO2 measurements.
Our results show that in the rat brain, especially for those voxels with high SNR as illustrated in Figure 2, the reproducibility of two consecutive CMRO2 measurements is extreamly high. When considering all the voxels located in the 17O RF coil-sensitive region as shown in Figure 1, the majority of the voxels present highly reproducible CMRO2 values when voxel-by-voxel-based analysis was performed. This is evident from the ratio between two repeated CMRO2 measurements, which is closed to unity in most of the voxels inside the rat brain. Because these repeated measurements were performed in the animal under stable physiologic condition without any perturbation, therefore, we conclude that the in vivo 17O MRSI approach for repeated CMRO2 measurements should provide consistent and reproducible outcomes. This capability is essential for studying the oxidative metabolism changes related to perturbations in physiology and brain function, in which at least two measurements are required under control and perturbation (or activation) conditions.
The feasibility of 3D 17O MRS imaging for determining CMRO2 changes because of physiologic perturbation was examined in the rat brain at normal brain temperature and under hypothermia condition. Our results show that in the same rat brain anesthetized with α-chloralose, a significant decrease of CMRO2 was observed across the entire brain when the brain temperature decreased from 37°C to 32°C. The measured CMRO2 ratio between normothermia and hypothermia conditions was 1.80 ± 0.10 (n = 5). This value is similar to the CMRO2 reduction observed in the thiopental-anesthetized rat brain when the brain temperature decreased from 38°C to 34°C (Nemoto et al, 1996) and/or calculated from depressed tricarboxylic acid cycle activity in the halothane-anesthetized rat brain when temperature decreased from 37°C to 31°C (Kaibara et al, 1999). If assuming a linear relationship between CMRO2 and temperature (Hagerdal et al, 1975), we could estimate the Q10 factor from our data resulting in Q10 ≈ 2.2 for the rat brain anesthetized with α-chloralose. This Q10 factor of CMRO2 is in good agreement with the literature reports where global CMRO2 measurements based on the Kety—Schmidt method were conducted (Hagerdal et al, 1975; Klementavicius et al, 1996; Michenfelder and Milde, 1991; Michenfelder and Theye, 1968; Nemoto et al, 1996). The actual relation between CMRO2 and brain temperature as well as their spatial dependence should be obtainable using the 3D 17O MRS imaging approach; however, this topic is beyond the scope of this study.
In our previous work, we had demonstrated the feasibility to establish a completely noninvasive 17O NMR approach for imaging CMRO2 in the rat brain under normal physiology condition (Zhang et al, 2004). In an effort of extending the applicability of this noninvasive CMRO2 imaging approach to various physiologic conditions and/or in different species, we evaluated the validity of this method in the normothermic and hypothermic rat brains. Our results have clearly demonstrated that the CMRO2 calculation based on the simplified model (i.e. linear fitting) and using only noninvasively determined brain metabolic H217O concentration could provide a close approximation of the true CMRO2 values in the rat brain under both normothermic and mild hypothermic conditions. Therefore, the promising results from our previous as well as current studies conducted at ultrahigh field (i.e. 9.4T) provide crucial evidence supporting the notion that noninvasive 3D 17O MRS imaging of CMRO2 is not only feasible but also reliable, at least in the rat brain under a wide range of physiologic conditions.
There are only few methods that are able to determine absolute CBF and CMRO2 values in a living brain without killing animal. Among them, the Kety—Schmidt method (Kety and Schmidt, 1948b) can provide global CMRO2 and CBF information and has led to much of our knowledge about the circulation and metabolism in animal and human brain under a variety of physiologic or pathologic conditions. This method is considered as the most robust and reliable way to determine CMRO2 and CBF values without information of their spatial distributions (see (Siesjo, 1978) and references therein). The positron emission tomography approach has been widely applied for imaging CMRO2 and CBF in humans (Mintun et al, 1984; Ter-Pogossian et al, 1970) by using radioactive 15O2 gas and H215O and C15O tracers. Positron emission tomography can provide information regarding the distribution of the CBF and CMRO2 values with limited spatial resolution and hence mainly applied for human brain studies. The NMR method capable of directly determining absolute CMRO2 and CBF values in the animal brain would be the 17O MRS approach alone (Pekar et al, 1991; Zhu et al, 2002, 2005) or in combination with other MR technique for CBF measurements (e.g. Arai et al, 1998; Pekar et al, 1995; Tailor et al, 2003). At ultrahigh fields such as 9.4 T, we were able to obtain 3D CMRO2 and CBF images of the rat brain with ~ 50 to 105 μL vexel size as demonstrated in this study. Furthermore, by comparing the CMRO2 and CBF values obtained from each rat brain at varied physiologic conditions, we were able to extrapolate the relation between CMRO2 and CBF in the α-chloralose anesthetized rat brain. Our data indicate that CMRO2 and CBF obey an approximate linear relationship (correlation coefficient: R = 0.97) within the physiologic conditions we studied. When comparing our results with the literature data of CMRO2 and CBF in the α-chloralose anesthetized rat brains obtained with different technique modalities, we found that although they gave a range of CBF and CMRO2 values in different studies with various anesthesia level and physiologic condition, these literature data points, however, are coincident with our data and, more importantly, they obey the same correlation relation between CMRO2 and CBF (see Figure 8). Our results also suggest that the reduction of CBF is comparable with that of CMRO2 when the brain temperature of the animal decreases from 37°C to 32°C; that means, the coupling between the blood perfusion and oxidative metabolism is not significantly altered in the mild hypothermic rat brain under moderate anesthesia of α-chloralose.
In conclusion, the developed in vivo 17O MRSI approach at ultrahigh fields is capable of repeated 3D CMRO2 imaging within the same experimental session; it can provide reproducible CMRO2 values in the rat brain under the same physiologic condition and can readily determine and distinguish the CMRO2 changes induced by varying the physiologic states of the animal. The simplified analysis method for calculating CMRO2 based solely on the noninvasively measured brain metabolic H217O concentration is valid under normal and mild hypothermia condition. Therefore, the same 17O MRSI approach should be useful for studying other physiologic perturbations such as hypoxia and ischemia, as well as brain activation and brain diseases.
Footnotes
Acknowledgements
We thank Run-Xia Tian for the assistance in animal preparation, John Strupp for the assistance in data analysis.