
Abstract
Understanding cerebral energy metabolism in neurons and astrocytes is necessary for the interpretation of functional brain imaging data. It has been suggested that astrocytes can provide lactate as an energy fuel to neurons, a process referred to as astrocyte—neuron lactate shuttle (ANLS). Some authors challenged this hypothesis, defending the classical view that glucose is the major energy substrate of neurons, at rest as well as in response to a stimulation. To test the ANLS hypothesis from a theoretical point of view, we developed a mathematical model of compartmentalized energy metabolism between neurons and astrocytes, adopting hypotheses highly unfavorable to ANLS. Simulation results can be divided between two groups, depending on the relative neuron versus astrocyte stimulation. If this ratio is low, ANLS is observed during all the stimulus and poststimulus periods (continuous ANLS), but a high ratio induces ANLS only at the beginning of the stimulus and during the poststimulus period (triphasic behavior). Finally, our results show that current experimental data on lactate kinetics are compatible with the ANLS hypothesis, and that it is essential to assess the neuronal and astrocytic NADH/NAD+ ratio changes to test the ANLS hypothesis.
Introduction
Understanding the coupling between brain activity and energy metabolism is recognized as essential to the interpretation of functional brain imaging data, especially functional magnetic resonance imaging (fMRI), Magnetic Resonance Spectroscopy (MRS), and positron emission tomography (PET) (Raichle and Edvinsson, 2002). Although a great deal of experimental facts has been accumulated on this subject, bringing them together within a unified, quantitative framework remains particularly difficult. In the last decade, Pellerin and Magistretti (1994) proposed an integrated view of the relationship between brain activity and astrocytic and neuronal metabolism, stating that: (i) during neural activity, glutamate, after being released by presynaptic glutamatergic neurons, is taken up by astrocytes together with sodium ions, converted to glutamine within the astrocytes, and then exported towards neurons; (ii) in astrocytes, both glutamine synthesis and restoration of sodium concentration via the Napump need ATP, which can be supplied, at least in part, by astrocytic glycolysis, which in turn leads to lactate formation; (iii) a part of astrocytic lactate is released in the extracellular space, some of which is taken up by neurons, converted to pyruvate and eventually oxidized by neuronal mitochondria. This latter hypothesis, according to which lactate produced by astrocytes can be a fuel for neurons, is referred to as the astrocyte—neuron lactate shuttle (ANLS) hypothesis. The ANLS hypothesis is based on a series of studies, showing notably that: (i) in cultured astrocytes, glutamate uptake is correlated to glucose utilization and lactate production (Pellerin and Magistretti, 1994); (ii) when primary neuronal cultures are in the presence of both lactate and glucose, they preferentially consume lactate as their oxidative substrate (Bouzier-Sore et al, 2003); (iii) in ex vivo preparations of rat vagus nerve, Schwann cells take up the major part of labelled deoxyglucose, while the majority of energy consumption likely occurs in axons (Véga et al, 2003). Recently, Itoh et al (2003) studied the effect of dichloroacetate, which increases pyruvate dehydrogenase activity, on the glucose and lactate metabolism of neurons and glia in vitro, and glucose consumption in rat in vivo. Their data support the hypothesis of lactate trafficking between astrocytes and neurons, although compartmentalization might be neither obligatory nor complete. Furthermore, we can note that a similar mechanism of lactate transfer has been proposed to occur in the retina, from glial cells to photoreceptors (Poitry-Yamate et al, 1995).
However, the ANLS hypothesis has been challenged by several authors, who defend the classical view that glucose is the major energy substrate of neurons, at rest as well as in response to a stimulation (for reviews, see Dienel and Cruz, 2003; Chih and Roberts, 2003). Some in vitro studies showed that glucose oxidation, and possibly glutamate oxidation, can fuel glutamate uptake by cultured astrocytes. Moreover, it was argued that during neural stimulation, thermodynamic conditions are unfavorable to lactate dehydrogenase (LDH) reaction towards pyruvate in neurons, because of the lag of extracellular lactate increase, and neuron NADH and pyruvate enhancement (Chih and Roberts, 2003). Gjedde et al (2002) put forward another point of view, based on a meta-analysis of in vivo data, by distinguishing between two kinds of neural activation: simple somatosensory or visual stimuli with little information content, resulting in a relatively large increase in astrocytic lactate production, while oxygen consumption rate (CMRO2) is only moderately increased (‘stand-by’ or ‘white’ response); complex somatosensory stimuli or motor activity, distinguished by a large increase in CMRO2 (‘full’ or ‘red’ response). According to their hypothesis, (i) in the normally resting brain (‘baseline’), lactate is essentially produced by astrocytes, while neurons sustain no net import of lactate. Then, (ii) during a ‘white’, glycolytic response, lactate production by astrocytes is markedly enhanced due to presynaptic activity, and extracellular lactate is washed out by the cerebral blood flow (CBF) increase, rather than consumed by neurons so that no significant ANLS takes place; (iii) in the case of a ‘red’, oxidative response, glucose and oxygen consumption by neurons is greatly increased, but the increases in lactate production by astrocytes and washout by CBF are comparable to those present in the ‘white’ response, so that still no ANLS occurs.
Of special interest in this debate are proton MRS data, which, by monitoring the time evolution of tissue lactate concentration, can give indirect insights into the ANLS hypothesis. On the one hand, significant increases in tissue lactate were reported during prolonged stimulations of the human visual cortex by Prichard et al (1991), Sappey-Marinier et al (1992), and Frahm et al (1996), whose results have been interpreted by Frahm and colleagues as consistent with the ANLS hypothesis. However, an early lactate decrease was recently found by Mangia et al (2003), which was interpreted by these authors as an argument against the ANLS hypothesis, since the ANLS model would imply an early lactate overproduction.
Hence, current views on the relationship between glial and neuronal energy metabolism are highly controversial. In this paper, we present a mathematical model of the compartmentalization of energy metabolism between neurons and astrocytes, designed to explore the conditions that may favor, or not, the ANLS. We previously developed a model of the coupling between brain activation, energy metabolism, and hemodynamics, which was applied to the interpretation of fMRI and MRS data (Aubert and Costalat, 2002). Here, we modify this model, distinguishing between neuronal, glial, extracellular, and vascular compartments, and test various hypotheses, especially on astrocytic versus neuronal stimulation terms. By varying the model parameters, we find essentially two sorts of time evolution. First, when astrocytes are significantly stimulated, but neuron stimulation is not at its higher level, ANLS can occur during a prolonged activation, as well as during the poststimulus period. Second, when neuron stimulation is higher, we observe a triphasic behavior, namely ANLS occurs preferably at the beginning of the stimulation and during the poststimulus. Interpretation of these simulations must take into account not only lactate kinetics, but also the astrocytic and neuronal redox states, namely the NADH/NAD+ ratios. Of particular importance is the fact that simulations always display ANLS, at least for some time intervals, while we adopt hypotheses that are unfavorable to ANLS, especially we assume that no ANLS occurs at resting steady state and the regulation of mitochondrial activity is the same in both neurons and astrocytes. Finally, we show that our results can, to some extent, reconciliate the ANLS hypothesis with both the ‘classical’ view and the hypothesis of ‘white’ and ‘red’ responses, and account for in vivo and in vitro data on lactate and NADH/NAD+ kinetics.
Description of the Model
A detailed description of the model can be found in the Appendix. In this section, we will briefly describe (i) tissue compartmentalization, (ii) brain energy metabolism in response to a stimulation, (iii) lactate, glucose and oxygen exchanges between compartments, and (iv) hemodynamics. Volumes, areas, and blood flow values are expressed per unit tissue volume. Brain tissue is assumed to be compartmentalized between neurons (typical volume fraction Vn = 0.45), astrocytes or glial cells (Vg = 0.25), extracellular (interstitial) space (Ve = 0.2), capillaries (Vcap = 0.0055), and veins (Vv = 0.0237 at steady state) (Figure 1). Reaction rates v are expressed in millimoles per second per unit neuronal, glial, or capillary volume, respectively. The indices n and g refer to the neuronal and glial (astrocytic) compartments, respectively, while index x = n,g stands either for n or g index. Sometimes we will use index T for tissue, including all the aforementioned compartments. The subscript ‘0’ is used to refer to the reference, baseline steady-state. Italicized symbols of ions or molecules indicate their concentrations. Neuronal and astrocytic metabolisms are described on the basis of our previous, homogeneous model of brain tissue metabolism (Aubert and Costalat, 2002).
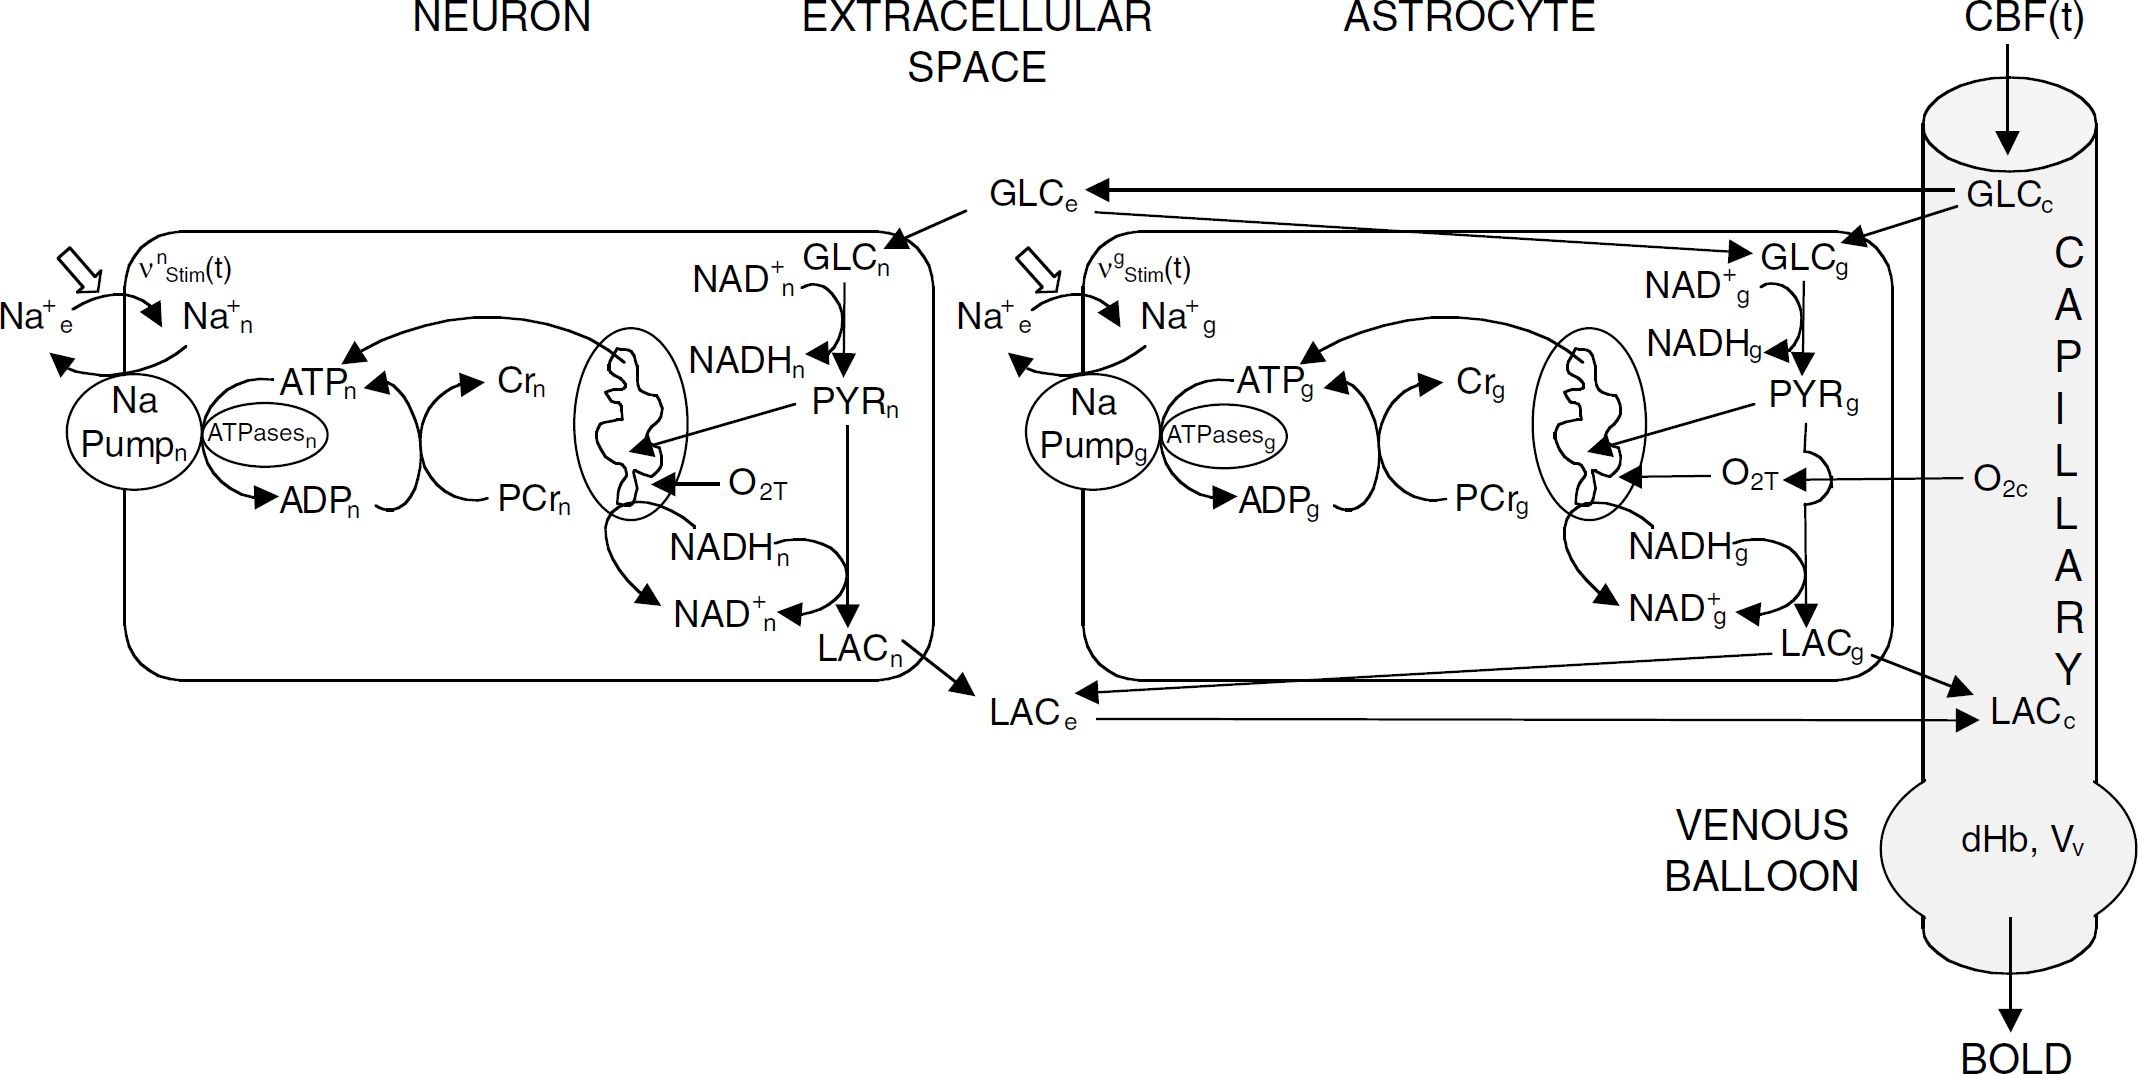
Diagram illustrating the compartmentalized energy metabolism between neurons and astrocytes. We distinguish between neuronal, glial (astrocytic), extracellular (interstitial), and vascular compartments. Each cell compartment contains all corresponding elements of the homogeneous model (Aubert and Costalat, 2002). Extracellular space is the place of exchanges between neurons and astrocytes. Note the potential importance of NADH which may play a role in ANLS, since it is produced by glycolysis and consumed by both LDH-catalyzed reaction and mitochondria. Arrows show the conventional orientation of the reactions, which can differ from real ones, for example, neurons may either produce or consume lactate.
A stimulation results in an increase in sodium inflow both in neurons (VnStim(t)), because of action potentials and postsynaptic potentials, and in astrocytes (vgStim(t)), because of, for instance, glutamate sodium cotransport (Pellerin and Magistretti, 1994). Based on the time course of local field potentials recorded simultaneously with fMRI by Logothetis et al (2001), each stimulation term is time-varying during a sustained activation, due, for instance, to neuronal habituation. This is described by the equation:
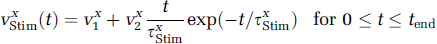
In other words, the stimulation term is the sum of a constant Vx1 and an ‘alpha’ function. Thus, the sodium inflow greatly increases at stimulation onset, reaches a maximum value, namely v x 1 + e−1v x 2, at t = τ x Stim, and then decreases toward a plateau value, namely v x 1. In both cell types, the resulting increase in sodium concentration stimulates the Napump, which converts ATP to ADP and thus triggers ATP regeneration through three main processes (Figure 1): (i) phosphocreatine buffering, namely phosphocreatine reacts with ADP to produce ATP and creatine, (ii) glycolysis that converts intracellular glucose (GLC x ) into intracellular pyruvate (PYR x ) and lactate (LAC x ), and (iii) mitochondrial activity that consumes intracellular oxygen (O2x), and PYR x , which will fuel the tricarboxylic acid cycle.
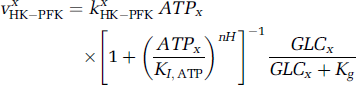
The model of glycolysis is a modified form of the model of Heinrich and Schuster (1996), as previously described (Aubert and Costalat, 2002; Aubert et al, 2001). Thus, the model describes the time evolution of intracellular glucose (GLC x ), glyceraldehyde-3-phosphate (GAP x ), phosphoenolpyruvate (PEP x ), pyruvate (PYR x ), and reduced form of nicotinamide adenine dinucleotide (NADH x ) concentrations. The main key step in glycolysis is catalyzed by the hexokinase—phosphofructokinase system (HK—PFK system), whose sensitivity to ATP x concentration is a key mechanism of glycolysis control. The formula for HK—PFK rate proposed by Heinrich and Schuster (1996) is multiplied by a term that accounts for the GLC x effect according to classical Michaelis—Menten kinetics (Gjedde, 1997; Aubert et al, 2001):
We took into account the variations of the NADH x /NAD+ x ratio through the reactions catalyzed by phosphoglycerate kinase (v x PGK) and lactate dehydrogenase (v x LDH), and mitochondrial activity (v x Mito) (Figure 1). We thus assume that the v x Mito term, which describes pyruvate uptake and subsequent catabolism by the mitochondria, also determines the rate of the electron shuttles (e.g., the glycerol 3-phosphate shuttle). Astrocytic and neuronal LDH-catalyzed reactions can proceed in either orientation, depending on NADH, NAD+, lactate and pyruvate concentrations. Mitochondrial respiration is assumed to be regulated by pyruvate, intracellular oxygen and ADP according to Michaelis—Menten-like equations (Gjedde, 1997; Kemp, 2000):
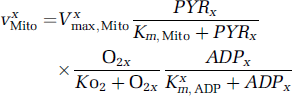
Thus in the present model, the extra pyruvate consumed by neuronal mitochondria during a stimulation can be issued either from neuronal glycolysis (classical view) or from lactate produced by astrocyte glycolysis, via the extracellular lactate (ANLS hypothesis). We shall adopt an hypothesis which is unfavorable to ANLS, namely that the regulation of the mitochondrial activity is the same in both neurons and astrocytes, so that K n m,ADP = Kgm,ADP.
The lactate and glucose exchanges between compartments are described by applying the classical symmetric Michaelis—Menten equations for facilitated transport (Lund-Andersen, 1979; Cremer, 1979). For example, the lactate exchange from glia (g) towards extracellular space (e), expressed per unit cellular (glial) volume, can be written as
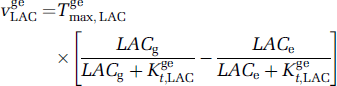
where Tgemax,LAC is the maximum rate of lactate transport between glia and the extracellular space, and Kget,LAC is the apparent Michaelis constant for this transport. Similar equations are used for each saturable transport of lactate or glucose. Exchanges of oxygen, glucose, and lactate through the blood—brain barrier, as well as transport of these substances by blood, are modelized as previously described (Aubert and Costalat, 2002), based on a simplified model proposed by Vafaee and Gjedde (2000). For instance, the time evolution of extracellular and capillary lactate (Figure 1) are, respectively, given by the following balance equations:
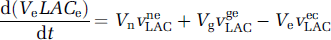
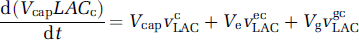
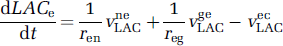
where VneLAC, VgeLAC, VecLAC, VgcLAC are the saturable transports rates, expressed per unit volume of the origin compartment, as in Equation (4). These equations can be rewritten using the definitions ren = Ve/Vn, reg = Ve/Vg, rce = Vcap/Ve, rcg = Vcap/Vg, as
The VcLAC term describes the blood flow contribution to lactate changes, namely:
where LACa is arterial lactate concentration, and CBF(t) = Fin(t) is the cerebral blood flow through the capillaries, which is given by an input function, based on the model of Buxton et al (1998) and magnetic resonance data (Buxton et al, 1998; Krüger et al, 1999):
while Fin(t) varies linearly for 0 tt1 (up ramp of the trapezoidal function) and tendttend + t1 (down ramp), tend being the stimulus duration, F0 the blood flow value at rest, and αF the CBF increase fraction.
Results
Generalities
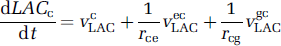
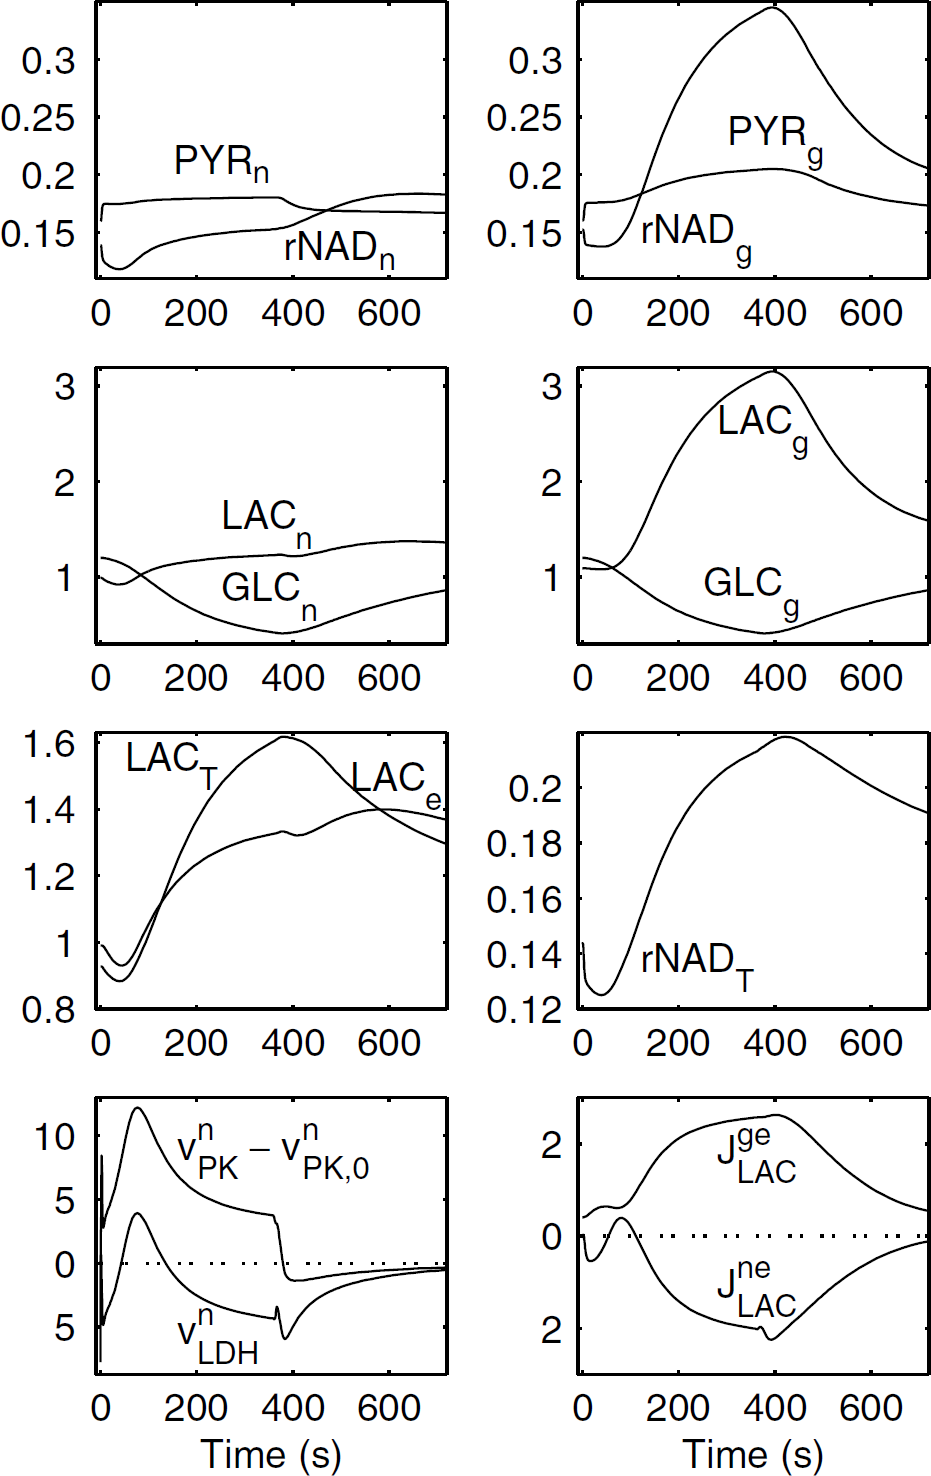
Before describing the time course of the different flows, we set forth a few conventions. First, VgeLAC>0 and VneLAC>0 correspond to the outflow of lactate from the astrocytes and from the neurons, respectively, expressed per unit cell volume, while JgeLAC = VgvgeLAC and JneLAC = VnvneLAC are expressed per unit tissue volume. Second, VnLDH>0 means that neuronal pyruvate is converted to lactate. Conversely, VnLDH<0 means that neuronal pyruvate is, in part, fuelled by lactate. Third, our working definition of ANLS assumes that at a given time JgeLAC>0 and JneLAC<0. The model was used to simulate sustained activations, typically consisting of a 360-sec stimulation period followed by a control period of the same duration, which allows comparison to results presented in a previous paper using our ‘homogeneous’ model (Aubert and Costalat, 2002), and to experimental results, especially those obtained in human primary visual cortex using MRS (Prichard et al, 1991; Sappey-Marinier et al, 1992; Frahm et al, 1996). For the two types of cells, a sustained stimulation causes an inflow of Na+ into the cytoplasm, which induces, through the Na-pump activity, a drop in phosphocreatine concentration, while ATP concentration only slightly decreases, which preserves cellular homeostasis (Gjedde, 1997). The decrease in ATP concentration induces an increase in ADP concentration, which in turn stimulates pyruvate uptake by mitochondria. Pyruvate is provided by glycolysis, but it can be either produced or consumed by the LDH-catalyzed reaction depending on the cell redox state (NADH/NAD+ ratio) and the lactate exchanges between neurons and astrocytes via the extracellular space. Although we varied the parameter values over a wide range, we essentially observed two kinds of behavior for the astrocyte—neuron lactate trafficking, depending mostly on the stimulation parameters: (i) when both astrocytes and neurons were stimulated at a significant level but neuron stimulation is relatively moderate, below a given threshold, we observed ANLS during all the stimulation and control periods: this situation will be referred to as continuous ANLS (Figure 2); (ii) if neuronal stimulation is further enhanced while astrocytic stimulation remains unchanged, ANLS is observed at the beginning of the stimulation period, followed by a phase where neurons produce lactate instead of consuming it; eventually, ANLS occurs again at the end of the stimulation period and during the poststimulus, control period. This situation will be referred to as triphasic behavior (Figure 3).
Dynamics of the main variables of the model in the case of a relatively high astrocyte/neuron extra energy consumption. This case is referred to as ‘continuous ANLS’. Parameters for VnStim and VgStim are τnStim = τgStim = 2 secs, tend = 360 secs, Vn1 = 0.41 mmol/L/sec, Vn2 = 14.4 mmol/L/sec, Vg1 = 0.16 mmol/L/sec, Vg2 = 15.7 mmol/L/sec. Parameters for CBF are F0 = 0.012/sec, t1 = 5 sec, αF = 0.7. Parameters for mitochondrial respiration are Vnmax,Mito = 0.021 mmol/L/sec, Vgmax,Mito = 0.005 mmol/L/sec, while Km,Mito =0.05 mmol/L, KO2 = 0.001 mmol/L, Knm,ADP = Kgm,ADP = 0.005 mmol/L, which results in respective baseline mitochondrial activities VnMito,0 = 0.0208 mmol/L/sec and VgMito,0 = 0.005 mmol/L/sec. Indices x = n,g,e,T refer to neurons, glia (astrocytes), extracellular (interstitial) space, and tissue, respectively. Index ‘0’ refers to the steady state. LACx, GLCx, PYRx are lactate, glucose, and pyruvate concentrations, rNADx = NADHx/NAD+ x ./VnPK and VnLDH are the rates of pyruvate kinase and lactate dehydrogenase-catalyzed reactions, respectively. JgeLAC and JneLAC are the outflows of lactate from astrocytes and neurons towards the extracellular space. The concentrations of metabolites are expressed in mmol/L, the fluxes in μmol/L/sec in the figures. Rates denoted by v are expressed per unit neuronal or astrocytic volume, while rates denoted by J are expressed per unit tissue volume. Note in this case, ΔCBF/CBF = 0.7, ΔCMRGLC,T/CMRGLC,T = 0.6, where CMRGLC,T is the tissue glucose consumption. The relative variation of lactate efflux through the blood—brain barrier is ΔJBBBLAC/JBBBLAC = 0.34. The relative variation of tissue oxygen consumption is ΔCMRO2T/CMRO2T = 0.39.
Dynamics of the main variables of the model in the case of a sustained activation. This case is referred to as ‘triphasic behavior’. Neuronal stimulation is slightly enhanced by comparison to Figure 2: Vn1 = 0.43 mmol/L/sec and Vn2 = 15.2 mmol/L/sec. All other parameters are the same as in Figure 2. Here, ΔCBF/CBF = 0.7, ΔCMRGLC,T/CMRGLC,T = 0.72, ΔJBBBLAC/JBBBLAC = 0.45, ΔCMRO2T/CMRO2T = 0.40.
First Type of Behavior: Continuous Astrocyte—Neuron Lactate Shuttle
This behavior is exemplified in Figure 2. In this case, we can assume that astrocytes and presynaptic neurons are significantly stimulated, but the stimulation of postsynaptic neurons remains relatively low, which would correspond to a ‘white (glycolytic) response’ (Gjedde et al, 2002), due to simple somatosensory or visual stimuli with little information content. The model shows a continuous outflow of lactate from the astrocytes (JgeLAC>0) together with a continuous inflow of lactate into the neurons (JneLAC<0). We also have VnLDH<0, which means that neuronal lactate is converted to pyruvate. Moreover, comparison of VnLDH and VnPK—VnPK,0 (the change in the rate of the pyruvate kinase-catalyzed reaction relatively to its baseline value) shows that both LDH and glycolysis enhancement contribute to extra pyruvate supply in neurons. Of particular interest are the time evolutions of lactate and pyruvate concentrations and cell redox states (NADH/NAD+ ratios). In astrocytes, we observe at the beginning of the stimulation (t<100 secs) a moderate decrease in the NADH/NAD+ ratio, together with a moderate increase in pyruvate concentration, which results in a quasi-constancy of astrocytic lactate level. For t> 100 secs, glial pyruvate further increases, while a great increase in NADH/NAD+ occurs, resulting in a marked astrocytic lactate increase. In strong contrast with astroglia, neurons undergo a prolonged oxidation, which, although pyruvate moderately increases, favors the transformation of neuronal lactate into pyruvate (VnLDH<0). Furthermore, this explains the decrease in neuronal lactate which is observed during the stimulation period, thus favoring lactate inflow into the neurons. Extracellular lactate time evolution is characterized by a moderate initial dip, followed by a large increase with a peak at 560 secs: this temporal behavior can be explained if we consider that (i) at the beginning of the stimulation, neuronal lactate tends to decrease while astrocytic lactate is not yet increased, so that neurons extract lactate from the extracellular milieu; (ii) later on, the large increase in glial lactate results in an increase in extracellular lactate, which partly diffuses towards neurons, where lactate concentration is decreased from t = 0 to t = 316 secs. If astrocytes are stimulated while neurons are not, namely if we set VnStim(t) = 0 during all the stimulations, while all other parameter values are the same as in Figure 2, we observe that the amplitude of lactate uptake by neurons (JneLAC) is reduced by 54% (data not shown). This indicates that lactate uptake in the case of Figure 2, where both astrocytes and neurons are stimulated, is not only due to the increase in extracellular lactate but also due to the metabolic demand in neurons. The time evolution of tissue lactate also displays an initial dip followed by an increase with a peak at t = 400 secs. These findings can be compared with lactate time evolution assessed either using 1H MRS in humans (Prichard et al, 1991; Sappey-Marinier et al, 1992; Frahm et al, 1996), or measuring extracellular lactate concentration in animals (Fellows et al, 1993; Fray et al, 1996; Hu and Wilson, 1997; Demestre et al, 1997). An initial decrease in tissue lactate after a brief visual stimulation was observed by Mangia et al (2003) using 1H MRS. Moreover, an initial dip of extracellular lactate concentration, followed by a larger increase, was documented by Hu and Wilson (1997) in the rat hippocampus. To determine the origin of this initial dip, we artificially clamped the lactate efflux from extracellular space toward the capillary (VecLAC) to its baseline value (data not shown). The amplitude of the extracellular lactate dip was reduced by less than 1%, which indicates that the initial dip is mostly due to lactate uptake by neurons. In addition, the amplitude of the tissue lactate peak is quite consistent with the 1H MRS data of Prichard et al (1991), Sappey-Marinier et al (1992), and Frahm et al (1996). It can be noted that in these data the tissue lactate peak occurs earlier than in Figure 2, for instance at t = 150 secs in the data of Frahm et al (1996). However, extracellular lactate peaks occurring as late as t = 7 to 10 mins for a 5-min tail pinch were reported in the rat hippocampus and striatum by Fellows et al (1993) and Fray et al (1996). Glucose concentration decreases in astrocytes and neurons are comparable to the data of Frahm et al (1996). Finally, the tissue NADH/NAD+ ratio displays a typical time evolution: during the stimulation, an initial dip (oxidation) is followed by a reduction phase; a further reduction phase occurs during the beginning of the poststimulus, followed by return to the baseline.
Second Type of Behavior: Triphasic Behavior
An example of this behavior is shown in Figure 3. The only parameter change with respect to Figure 2 consists in a moderate increase of the neuronal stimulation term, not affecting glia activation. For instance, this could be achieved by a decrease in inhibitory activity, while the glutamate cycle at excitatory synapses is not affected. This hypothesis is consistent with a recent study, which shows that GABA uptake in astrocytes is not associated with significant energy metabolism increase in these cells (Chatton et al, 2003). Although JgeLAC>0 during all the simulation, which means that astrocytes produce lactate, the curve for JneLAC is more complex, showing three distinct phases, (I) from t = 0 to t = 55 secs, neurons consume lactate, so that an ANLS is present; (II) from t = 55 to t = 110 secs, neurons produce lactate; (III) from t = 110 secs, namely during the last part of the stimulation period, and the control period, neurons consume lactate, so that ANLS is present again. A similar triphasic behavior is observed for VnLDH, that is, (I) from t = 0 to t = 43 secs, production of pyruvate, (II) from t = 43 to t = 135 secs, production of lactate, and (III) from t = 135 secs, production of pyruvate again. The temporal evolution of glial pyruvate, lactate, NADH/NAD+ ratio, and glucose is quite similar to that noted in Figure 2. By contrast, the oxidation phase in neurons is shortened, ending at t = 125 secs, and followed by a reduction phase. Furthermore, neuronal pyruvate increases, but only slightly more than in Figure 2 (113% of the baseline value at t = 360 secs in Figure 3, instead of 110% in Figure 2), and neuronal lactate increases again as soon as t = 75 secs. The mechanisms occurring during the three phases can be summarized in the following way. At the beginning of the stimulation (phase I), ANLS occurs by means of mechanisms analogous to those described for the first type of behavior. During phase II, a much larger increase in neuronal glycolysis, because of the increase in neuron stimulation, results in an increase in pyruvate and NADH production. Hence, neuronal pyruvate is converted to lactate, which contributes to extracellular lactate accumulation. During the last part of the stimulation (beginning of phase III) neuronal glycolysis is less markedly increased (see VnPK—VnPK,0) as a consequence of the neuronal stimulation pattern (equation (1)). Thus, while neuronal NADH/NAD+ and lactate only slightly increase, extracellular lactate continues to increase, as a consequence of astrocytic lactate production. These factors contribute to ANLS and conversion of neuronal lactate to pyruvate. Finally, during the control period, neuronal glycolysis further decreases, while lactate extracellular concentration is still high, which results in a persistent ANLS. If we artificially block lactate exchanges between neurons and the extracellular space (JneLAC = 0) during the third phase (data not shown), we observe that (i) mitochondrial activity in neuron is only very slightly decreased, (ii) lactate concentration in the extracellular space is strongly increased (peak of 2.59 mmol/L instead of 1.4 mmol/L), (iii) lactate concentration in glia is also increased (peak of 4 mmol/L instead of 3.15 mmol/L), and (iv) neuronal lactate and NADH concentrations dramatically decrease (nearly zero for t>655 secs). Thus, if we block lactate exchanges during the third phase, neurons can supply ATP using glucose and their lactate pool, but this finally results in a pathological situation with a major cytoplasmic oxidation, which is not realistic. Finally, it is interesting to note that in the case of triphasic behavior, extracellular and tissue lactate peaks are significantly higher than in the case of continuous ANLS, as a result of increased lactate production by neurons occurring in aerobic conditions. For similar reasons, the NADH/NAD+ ratio for tissue is higher in the case of triphasic behavior.
Model Robustness
Altering the model parameters, although modifying metabolite kinetics, did not preclude the fact that astrocyte—neuron interactions always belonged to one of the aforementioned two kinds of behavior. For instance, constant stimulations always resulted either in continuous ANLS or in triphasic behavior (data not shown). We especially focused on the lactate time course, since it can be measured using 1H MRS. An example of results obtained assuming a fairly moderate astrocyte stimulation, while neuron stimulation is quite high, is given in Figure 4: a triphasic behavior is still observed. In this situation, we assume that presynaptic activity is moderately increased relatively to its baseline value, while postsynaptic activity is greatly enhanced. Strong activation in neurons (compare VnStim versus VgStim and Nan versus Nag, the resulting neuronal and astrocytic sodium concentrations) causes a large increase in ATP consumption in neurons, because of Na-pump (compare CMRATPn versus CMRATPg), resulting in a higher increase fraction of oxygen consumption for neurons (rCMRO2n versus rCMRO2g). However, the strong neuronal stimulation results in an aerobic neuronal lactate production (compare Figures 4 and 3), which causes an early neuronal lactate peak at t = 135 secs and a marked release of lactate by neurons from t = 25 to t = 340 secs. The energy metabolism of astrocytes is slightly increased (see the time evolution of Na+g and CMRATPg), and astrocytes take up lactate from t = 50 to t = 280 secs. An ANLS, however, is still observed during the poststimulus. This sequence of events results in an early peak of tissue lactate at t = 160 secs, which is consistent with MRS experimental data (Frahm et al, 1996). We recall that, using our ‘homogeneous model’, we only observed late tissue lactate peaks (near the end of the stimulation), unless we introduce the hypothetical action of a second messenger on mitochondrial respiration (Aubert and Costalat, 2002). Hence, the present model suggests that the early lactate peak observed during a sustained stimulation of the primary visual cortex using MRS (Prichard et al, 1991; Sappey-Marinier et al, 1992; Frahm et al, 1996) could be because of, at least in part, energy metabolism compartmentalization. Furthermore, one can note that in Figure 4, the NADH/NAD+ ratio is markedly increased in neurons and greater than that in astrocytes during the ‘second phase’; however, neurons are still more oxidized than astrocytes at the beginning of the stimulation and during the ‘third phase’, which emphasizes once more the crucial importance of the relative redox states of neurons and astrocytes on lactate exchanges between these cells.
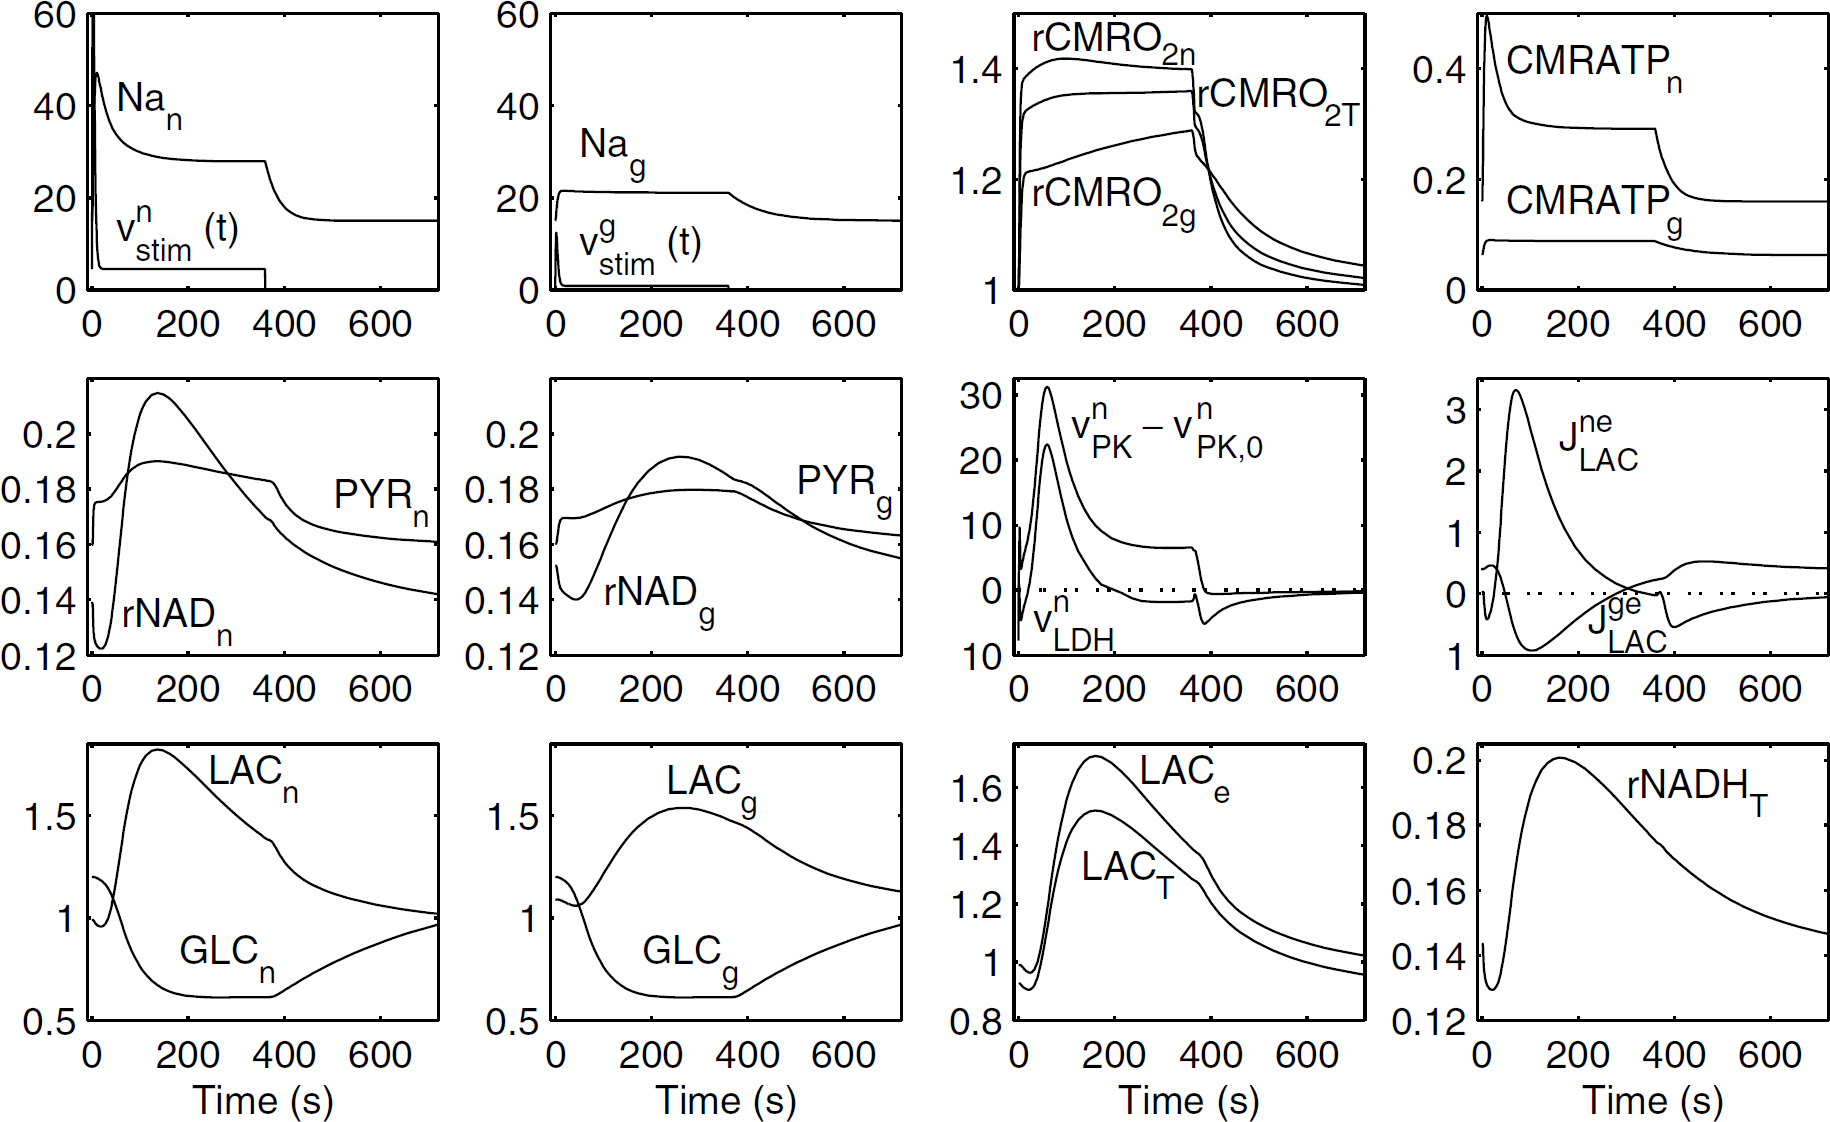
Dynamics of the main variables of the model when astrocytic stimulation is diminished and neuronal stimulation is further enhanced. Parameters for the stimulation terms, VnStim and VgStim, are the same as in Figure 2, except that Vn1 = 0.45 mmol/L/sec, Vn2 = 18.4 mmol/L/sec, Vg1 = 0.09 mmol/L/sec, and Vg2 = 3.1 mmol/L/sec. All other parameters are the same as in Figure 2. As in Figure 3, the model shows a triphasic behavior. Note the early pike both in tissue and extracellular lactate concentrations. Nan and Nag are the sodium neuronal and astrocytic concentrations. rCMRO2x = CMRO2,x/CMRO2,x0 is the increase fraction of oxygen consumption for neurons (n), astrocytes (g), and tissue (T). Similarly, CMRATPx is the ATP consumption, due to Na-pump, in neurons (n) or astrocytes (g), in mmol/L/sec. Here, ΔCBF/CBF = 0.7, ΔCMRGLC,T/CMRGLC,T = 1.23, ΔJBBBLAC/JBBBLAC = 0.34, ΔCMRO2T/CMRO2T = 0.36. Note that in Figure 4, the tissue oxygen consumption increase is lower than in Figures 2 and 3: this apparent paradox is solely because of the very low glial stimulation.
Discussion
In this study, we develop a mathematical model of the compartmentalization of the brain energy metabolism between astrocytes and neurons, to test the ANLS hypothesis from a theoretical point of view. Of course, neither the present model nor any other theoretical model can decide between the controversial views put forward by various authors, since only unambiguous experiments can close the debate. However, mathematical modeling can be a tool to give a coherent and quantitative framework for the discussion, to suggest possible physiological mechanisms and to help plan future experiments. We first adopted a working definition of ANLS (see the Results section), according to which ANLS is said to occur when, at a given time, lactate is both released by astrocytes and taken up by neurons. This definition of ANLS does not require any stoichiometrical relation between glucose uptake and lactate production by astrocytes, also it neither excludes concomitant glucose uptake by neurons and subsequent glycolysis, at rest as well as during a stimulation. However, our definition is relatively close to, albeit slightly more restrictive, than that adopted by Pellerin and Magistretti (2003), since these latter authors do not exclude a possible temporal delay between lactate production by astrocytes and lactate consumption by neurons. Nevertheless, this definition of ANLS significantly differs from that adopted by Chih and Roberts (2003), in which ‘neural activity increases anaerobic glycolysis in astrocytes without enhancing the neuronal glycolytic pathway’.
On the basis of our previously described ‘homogeneous’ model (Aubert and Costalat, 2002), we developed a ‘compartmentalized’ model including, beside blood vessels, three compartments: astrocytes, neurons, and extracellular space. Each of the ‘cellular’ compartments, namely astrocytes and neurons, contain all the biochemical machinery (ATPases, PCr buffer, glycolysis, and mitochondrial activity) already present in our homogeneous model. On this basis, we chose basic assumptions which can be viewed as highly unfavorable to ANLS. First, we assumed that at the baseline, resting state, neurons neither produce nor consume lactate, so that no ANLS is present at rest. This hypothesis is based on a recent meta-analysis of in vivo data by Gjedde et al (2002) and it seemed important to test whether ANLS could occur during a stimulation, while not at rest. Second, most variable and parameter values were chosen to be the same for neurons and astrocytes. Especially, we assumed that the Km of mitochondrial respiration for ADP is the same in neurons and astrocytes. The only fundamental difference was that we assumed a moderate lactate efflux from astrocytes at rest, with a decrease in astrocytic maximal mitochondrial activity, and we assumed that this lactate efflux is balanced by lactate flux through the blood—brain barrier (as suggested by Gjedde et al (2002), see Figure 2 in their paper). These hypotheses resulted in a slightly higher NADH/NAD+ ratio in astrocytes at rest. Finally, it can be noted that in our model both astrocytes and neurons can take up glucose as well as lactate, and convert them to pyruvate, as was described by Itoh et al (2003).
One of the main results of this paper is that, although we adopted hypotheses unfavorable to ANLS, especially that no ANLS occurs at resting state and the regulation of mitochondrial activity is the same in both neurons and astrocytes, we do observe it in almost all simulations, at least at the beginning of the stimulation and during the poststimulus. ANLS occurs concomitantly with an increase in neuronal glycolysis, so that the model strongly suggests that the classical view and ANLS hypothesis can be reconciliated to some extent. Furthermore, our results indicate that ANLS may dramatically depend on the relative magnitudes of neuronal and astrocytic stimulations. More precisely, all our simulations could be divided into two types. In the first type, when astrocytes and neurons are significantly stimulated, but neuronal stimulation remains relatively moderate, ANLS is observed during all the stimulation and control periods (continuous ANLS, Figure 2). In the second type, if neuron stimulation is further enhanced while astrocytic stimulation remains the same, ANLS is observed at the beginning of the stimulation, during the poststimulus period and, possibly, at the end of the stimulation (triphasic behavior, Figure 3). It is interesting to note that the transition from one behavior to the other is rather stiff, resulting in a kind of threshold for stimulation (compare stimulation parameters in Figures 2 and 3). These two kinds of behavior could be compared with the respective ‘white’ and ‘red’ responses of neural tissue put forward by Gjedde et al (2002), on the basis of PET and fMRI data. According to our results, the concept of Gjedde and colleagues is compatible with ANLS hypothesis; furthermore, the time evolution of ANLS during a sustained activation could be correlated to the kind of stimulation, resulting either in a ‘white’ or ‘red’ response.
Furthermore, our model suggests mechanisms by which ANLS could take place during a stimulation and the poststimulus period, and emphasizes the role of the astrocytic and neuronal redox state. At the beginning of the stimulation, both astrocytic and neuronal pyruvate concentrations are slightly increased while the NADH/NAD+ ratio is decreased, but because of the higher Vmax for mitochondrial activity in neurons this latter reduction is more pronounced in neurons than in astrocytes, resulting in a larger decrease in lactate in neurons than in astrocytes, and thus in ANLS. This initial situation is observed even when the choice of model parameters is fairly unfavorable to ANLS, as in Figures 3 and 4. When stimulation is continued, results show a large reduction of astrocyte intracellular milieu, and occurrence of ANLS appears to depend on the degree of stimulation of neurons: a relatively low level of neuronal stimulation is associated with a neuronal oxidation (continuous ANLS, Figure 2), while a higher level of neuronal stimulation results in neuronal reduction, which impedes ANLS (triphasic behavior, Figures 3 and 4). Finally, during the poststimulus period, and possibly before the end of the stimulation, the increases in glial lactate and NADH/NAD+ ratio overcome neuronal modifications and impose ANLS.
It is interesting to note that the simulated evolution of extracellular lactate always displays an initial dip, followed by a larger increase with a peak, which is consistent with extracellular lactate monitoring in animal (Hu and Wilson, 1997). Direct comparison of model predictions for NADH/NAD+ ratio to experimental data is more complex, since the question of the origin (cytoplasmic versus mitochondrial) of the NADH signal is subject to debate. While some authors consider that the NADH signal investigates the cytoplasm (Brauser et al, 1970; Lipton 1973), others attribute this response to mitochondrial NADH (Jöbsis et al, 1971; Mayevsky and Chance, 1975). It is interesting to note that most recent studies show a biphasic behavior (NADH dip followed by NADH overshoot) of measured redox state (e.g., Dóra et al, 1984, Shuttleworth et al, 2003). Furthermore, very recent experimental data support one of the main predictions of the model. Kasischke et al (2004) developed two-photon fluorescence imaging of NADH in slices, and their measurements can distinguish between the contributions of astrocytes on the one hand, and dendrites on the other hand. They found that the origin of the NADH dip is predominantly dendritic, while the overshoot has mostly an astrocytic origin. Moreover, Kasischke and colleagues state that the location of the dip regions is consistent with the interpretation that these are neuronal mitochondria, while the overshoot regions colocalized with astrocytes and their processes. Thus, these data confirm our model prediction that astrocytes undergo a significant reduction, with only a little contribution, if any, to NADH initial dip. Finally, the experimentally observed oxidation in dendrites mitochondria, at the beginning of the stimulation, is consistent with the oxidation of neuron cytoplasm predicted by the model, but this question deserves further investigation, especially regarding the possible difference in NADH kinetics between various cellular locations.
From another point of view, our model emphasizes that great care must be taken to interpret tissue lactate kinetics, as obtained e.g. by means of 1H MRS, in the context of the debate regarding ANLS. First, an increased lactate concentration can be due to lactate release by astrocytes (see Figure 2), astrocytes or neurons (Figure 3) or, at some time, neurons alone (Figure 4). Second, in some simulations, a very high neuronal stimulus resulted, some time after the stimulation onset, in a neuronal production of lactate accompanied by a lactate uptake by astrocytes (Figure 4). In this case, the neuronal production of lactate occurs in a context of enhanced mitochondrial activity, a situation which is well documented in other tissues (Kemper et al, 2001). Lactate uptake by astrocytes is linked to the direct passage of lactate from astrocytes to capillaries, which could take place locally through a reduced interstitial space. However, even in this case, ANLS occurs both at the very beginning of the stimulation and during the poststimulus. Third, and most importantly, an initial decrease in tissue lactate, as was recently described using 1H MRS by Mangia et al (2003), can in no way be viewed as a definite argument against ANLS: in our model, an initial dip of lactate consistently accompanies ANLS at the beginning of the stimulation.
Several other factors, which for sake of simplicity were not included in the model, could contribute to modulate metabolite kinetics. For instance, changes in pH gradients during activation would alter lactate transport through MCTs, but pH modifications in human brain remain difficult to assess (Sappey-Marinier et al, 1992). Neural activation results in various pH responses according to the involved compartment. In the extracellular (interstial) fluid, a pH increase is followed by an acidosis, but predominant early acidification can also be observed (Chesler, 2003). In neurons, NMDA application induces an initial alkalinization followed by an acidification (Zhan et al, 1997). In astrocytes, an alkalinization was sometimes reported, but some authors observed an acidification in response to the application of excitatory amino acids, such as glutamate. Although it is difficult to conclude because experimental results are somewhat contradictory, it is interesting to note that a biphasic evolution of neuronal pH (Zhan et al, 1997) would favor an initial consumption of lactate by neurons followed by lactate production as shown in Figures 3 and 4. Moreover, taking into account detailed LDH kinetic properties, and LDH-1 and LDH-5 distribution between neurons and astrocytes, would a priori alter LDH-catalyzed reaction rates. It is likely that the quasi-equilibrium, or rapid equilibrium, hypothesis holds for the reaction catalyzed by LDH in the brain (Gjedde, 1997). If the LDH-catalyzed reaction was strictly at equilibrium, the (NADH.PYR)/(LAC.NAD+) ratio would not depend on the LDH subtype, LDH-1 or LDH-5 (Heinrich and Schuster, 1996, chapter 4, p 123). If we take into account the fact that the LDH-catalyzed reaction is not, strictly speaking, at equilibrium, then specific kinetic properties of LDH subtypes can play a role. However, the kinetical property which is most unfavorable to ANLS, namely the inhibition of neuronal LDH-1 by pyruvate in neurons, is unlikely to play a great role if, as is shown in Figures 2 and 3, neuronal pyruvate is only slightly increased: based on the kinetic studies of Kaplan and Everse, it can be estimated that the resulting LDH inhibition would not exceed 10–20% (Kaplan and Everse, 1972). Furthermore, the LDH-catalyzed reaction depends on pH, for instance, an initial alkalinization in neurons as described by Zhan et al (1997) would favor transformation of lactate to pyruvate, while the subsequent acidification would favor the inverse direction of the LDH-catalyzed reaction, which would reinforce the variations of the LDH rate in Figures 3 and 4. Finally, the model does not include the subcellular compartmentalization of energy metabolism between cytoplasm and mitochondria, especially the lactate shuttle between the cytosol and the mitochondria, mediated by the mitochondrial monocarboxylic transporter, mMCT (Gjedde and Marrett, 2001).
Conclusion
The results obtained using our model suggest that the ANLS hypothesis and the classical view of brain energy metabolism can, to some extent, be reconciliated together and linked to Gjedde's hypothesis on ‘white’ and ‘red’ responses. Furthermore, our results show that current experimental data on lactate kinetics in vivo are compatible with the ANLS hypothesis, and that it is essential to assess neuronal and astrocytic NADH/NAD+ ratio changes to test the ANLS hypothesis.
Footnotes
Acknowledgements
We thank Marie-Paule Aubert for technical support. This work was supported by the Ligue Nationale Contre le Cancer, the Fondation pour la Recherche Médicale, and the Action Concertée Incitative ‘Neurosciences Intégratives et Computationelles’ (French Ministry of Research). We are also indebted to Dr Robert Shannon for showing us the way.
Appendix
The model is designed to describe, in response to a stimulation, neuronal and astrocytic energy metabolism changes together with glucose, lactate, and oxygen supply because of blood flow and exchanges through the blood—brain barrier. Moreover, the model describes the exchanges of glucose and lactate between the extracellular space, neurons, and astrocytes. The model is based on our previous, noncompartmentalized (‘homogeneous’) model, and a detailed derivation of the equations can be found in Aubert et al (2001), Aubert and Costalat (2002), and Valabrègue et al (2003). In the sequel, we will list (i) balance equations, (ii) rate equations, and (iii) parameter values.