
Abstract
Cerebral blood flow (CBF) and rate of oxygen metabolism (CMRO2) may be quantified using positron emission tomography (PET) with 15O-tracers, but the conventional three-step technique requires a relatively long study period, attributed to the need for separate acquisition for each of 15O2, H215O, and C15O tracers, which makes the multiple measurements at different physiologic conditions difficult. In this study, we present a novel, faster technique that provides a pixel-by-pixel calculation of CBF and CMRO2 from a single PET acquisition with a sequential administration of 15O2 and H215O. Experiments were performed on six anesthetized monkeys to validate this technique. The global CBF, oxygen extraction fraction (OEF), and CMRO2 obtained by the present technique at rest were not significantly different from those obtained with three-step method. The global OEF (gOEF) also agreed with that determined by simultaneous arterio-sinus blood sampling (gOEFA–V) for a physiologically wide range when changing the arterial PaCO2 (gOEF = 1.03gOEFA–V +0.01, P<0.001). The regional values, as well as the image quality were identical between the present technique and three-step method for CBF, OEF, and CMRO2. In addition, a simulation study showed that error sensitivity of the present technique to delay or dispersion of the input function, and the error in the partition coefficient was equivalent to that observed for three-step method. Error sensitivity to cerebral blood volume (CBV) was also identical to that in the three-step and reasonably small, suggesting that a single CBV assessment is sufficient for repeated measures of CBF/CMRO2. These results show that this fast technique has an ability for accurate assessment of CBF/CMRO2 and also allows multiple assessment at different physiologic conditions.
Introduction
Positron emission tomography (PET) allows the quantitative measurement of regional cerebral blood flow (CBF) and the rate of oxygen metabolism (CMRO2), which has enabled us to understand the pathophysiologic basis of cerebrovascular disorders. These measurements are achieved using a protocol involving separate PET scans, one after the administration of each of three distinct 15O-labeled radioactive tracers: H25O or C15O2 for CBF, 15O2 for CMRO2, and C15O for cerebral blood volume (CBV) (Frackowiak et al, 1980a, b ; Mintun et al, 1984; Lammertsma and Jones, 1983). However, the complex nature of this procedure and its relatively long protocol often limit its applicability and also makes it difficult to perform at different physiologic conditions.
Quantitative images of CBF and CMRO2 created with PET are calculated based on a single-tissue compartment model of oxygen and water kinetics (Frackowiak et al, 1980a, b ; Mintun et al, 1984; Lammertsma and Jones, 1983). The steady-state method (Subramanyam et al, 1978; Lammertsma et al, 1982; Correia et al, 1985; Okazawa et al, 2001a, b ) has been used in a number of studies in which quantitative images are estimated from data acquired while in the steady state reached during continuous inhalation of C15O2 and 15O2. This method can be used using a simple procedure and mathematical formula, but still has several limitations. A prolonged data-acquisition period (approximately 1 h) is required, and the procedure is sensitive to error sources such as statistical noise and tissue heterogeneity (Lammertsma et al, 1982; Correia et al, 1985). An additional drawback is the relatively high level of radiation exposure required to reach the steady state.
An alternative autoradiographic method (ARG) using only short administration times for each of the three tracers (three-step ARG) has been developed (Mintun et al, 1984) and subsequently simplified and optimized (Iida et al, 1993; Sadato et al, 1993; Hatazawa et al, 1995; Shidahara et al, 2002; Hattori et al, 2004). Cerebral blood flow images can be obtained by an H215O autoradiographic method, using a PET counts-versus-CBF nomogram, which follows a simple look-up table procedure (Raichle et al, 1983; Herscovitch et al, 1983; Kanno et al, 1987); the quantitative accuracy of these images is improved when input delay and dispersion are corrected (Iida et al, 1986, 1988). Rate of oxygen metabolism and the oxygen extraction fraction (OEF) can be estimated using data acquired during 15O2 inhalation, but must be corrected for clearance of radioactivity associated with CBF (Mintun et al, 1984), CBV, and the level of recirculating radioactive water (Iida et al, 1993). Although the total time required for three-step ARG is less than that of the steady-state method, it still requires at least half an hour, with a large part of this period spent waiting for radioactive decay between PET scans (more than 10 mins).
There have been other attempts to obtain CBF and CMRO2 images more rapidly (Huang et al, 1986; Holden et al, 1988; Meyer et al, 1987; Ohta et al, 1992; Ho and Feng, 1999). Mathematical refinement has allowed images to be generated from data from a single scan alone on a bolus inhalation of 15O2. The quality of the image suffers, however, from statistical noise because of the lack of predictability of the multiple parameters of CBF, CMRO2, and the arterial vascular compartment (V0) and the limited acquisition time (Meyer et al, 1987; Ohta et al, 1992). Therefore, this technique has not been generally applied in clinical settings, but has been used primarily for research purposes (Fujita et al, 1999; Vafaee and Gjedde, 2000; Okazawa et al, 2001a, b ; Mintun et al, 2002).
In this study, we have developed a novel, rapid PET technique called the dual-tracer ARG method (DARG) that involves a single session of PET scan during which two tracers of 15O2 and H215O are sequentially administered. This approach can shorten the total study period for the CBF and CMRO2 measurement as compared with the three-step ARG, while maintaining the image quality and quantitative accuracy. A new formulation was derived so that the residual radioactivity of the first tracer is accounted for in the subsequent portion of the dynamic PET scan. We have then tested feasibility of this technique in an experiment on six anesthetized monkeys. A set of simulation was also performed to evaluate error sensitivity to possible error sources.
Materials and methods
Theory
The DARG protocol consists of a single dynamic PET scan conducted during the sequential administration of H215O and 15O2 in a short time interval. To calculate values of CBF, OEF, and CMRO2 from these data, a new mathematical formula was derived based on a previously described single-tissue compartment model (Mintun et al, 1984). The formula was redesigned to be applicable to data obtained after the administration of tracers in either order (H215O injection followed by 15O2 inhalation (H215O–15O2) or 15O2 inhalation followed by H215O injection (15O2–H152O)). Schematic time courses of blood and tissue radioactivity during DARG are shown in Figure 1. Based on the single-tissue compartment model, the total radioactivity in the tissue, Ci(t) in Bq/mL, after 15O2 or H215O administration can be expressed as
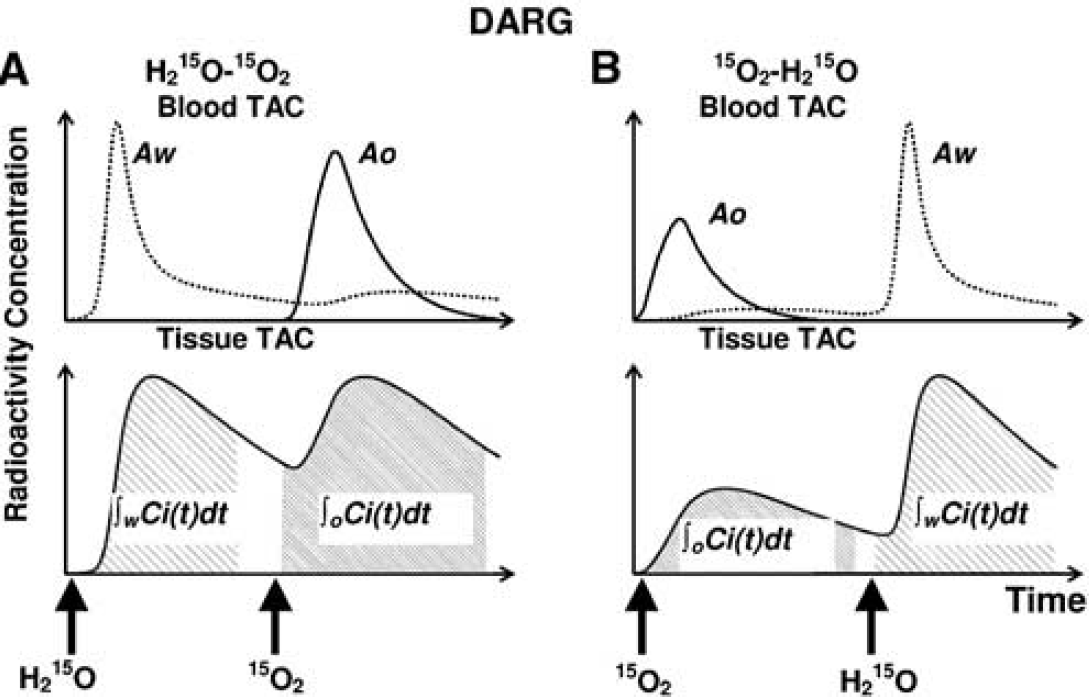
Schematic TACs of arterial blood and tissue for the sequential administration of dual tracers in DARG: (
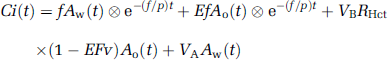
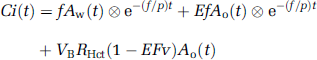
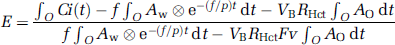
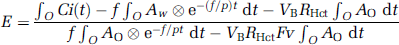
where Ao(t) and Aw(t) denote the arterial input function for oxygen and water in Bq/mL, f is CBF in mL 100/g min, E is the OEF, p is the blood/brain partition coefficient for water in mL/g, VB or VA is the total or arterial part of cerebral blood volume, respectively, RHct is the small-to-large vessel hematocrit ratio, FV is the effective venous fraction, and ⊗ indicates the convolution integral. Note that equation (1) describes the kinetics of radioactivity and is valid after the administration of either 15O or H215O or after the administration of both. The first term on the right-hand side describes the amount of water entering the tissue, including both administrated and recirculating water. The second represents the amount of oxygen that enters the tissue and is immediately metabolized to water. The third and the fourth terms express the radioactivity of 15O2 and H215O in blood vessels, respectively. In the present study, we assumed that the last term is negligibly small compared with the radioactivity in tissue according to the previous study (Iida et al, 2000). Then, we have
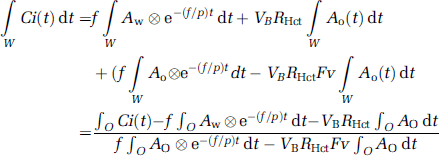
To produce pixel-by-pixel functional maps using a lookup table procedure, the formula was rearranged as follows. Equation (2) was integrated for the periods of H215O (∫wdt) and 15O2 administration (∫oOdt):
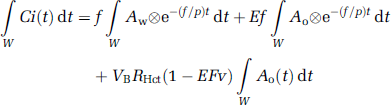
In these equations, ∫wCi(t)dt and ∫oCi(t)dt correspond to acquired PET data summed after H215O and 15O2 administration, respectively (Figure 1). Note that the radioactivity of the first tracer remaining during data acquisition for the second tracer is already modeled in each equation. In the case of 15O2–H215O, the amount of residual radioactivity from 15O2 in data obtained during the H2O segment (equation (3)) is expressed in the second and third terms on the right-hand side. Likewise, for H215O–15O2, the residual amount of H215O found in the data for the O2 segment (equation (4)) is represented by the first term on the right-hand side. Equation (4) can be rewritten as follows:
Substituting equation (5) into equation (3), we obtain
Using equation (6), f can be estimated using a look-up table procedure based on the observed PET data (∫wCi(t)dt and ∫oCi(t)dt, VB) and the blood input functions (Ao and Aw), as long as fixed values are assumed for P, FV, and RHct. Next, E can be calculated using equation(5). Rate of oxygen metabolism is then calculated from the estimated f and E, and the measured arterial oxygen content.
Positron Emission Tomography Experiments in an Animal System
We measured CBF and CMRO2 using PET in six normal monkeys (Macaca fascicularis; body weight = 5 kg) under stable anesthesia. The PET protocol for this study was designed to validate the global values of CBF (gCBF), CMRO2 (gCMRO2), and OEF (gOEF) generated using DARG by comparing them to those obtained using three-step ARG and the gOEF value measured by simultaneous arterial and cerebral sinus (A–V) blood sampling (gOEFA–V). In all six animals, we performed three-step ARG, two sets of DARG (H215O–15O2 and 15O2–H215O), and A–V sampling during normocapnia (Figure 2). In three of the six animals, A–V sampling and DARG with 15O2–H215O were performed simultaneously not only during normocapnia (PaCO2≅40 mm Hg) but also while PaCO2 was graded (by changing the respiratory rate) at different three levels: hypocapnia (PaCO2<33 mm Hg), mild hypercapnia (45 <PaCO2 <50 mm Hg), and deep hypercapnia (PaCO2>50 mm Hg). Animals were maintained and handled in accordance with the guidelines for animal research outlined in Human Care and Use of Laboratory Animals (Rockville, National Institute of Health/Office for Protection from Research Risks, 1996). The study protocol was approved by Subcomittee for Laboratory Animal Welfare, National Cardiovascular Center.
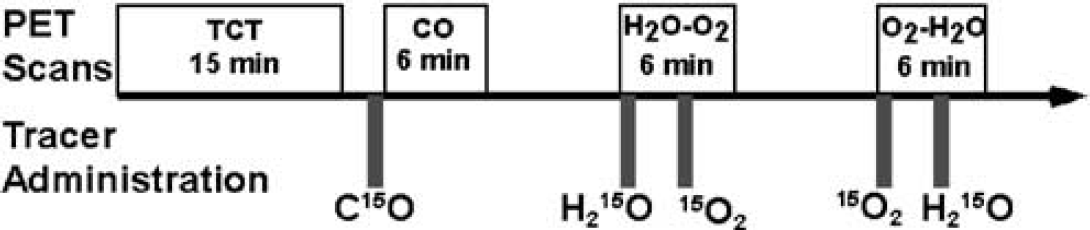
Animal study protocol. After a 15-min transmission scan (TCT), a 6-min emission scan was performed after a 30-sec inhalation of C15O. Next, two 6-min dynamic scans with the sequential administration of H215O and 15O2, with 3-min interval, were performed. The order of two tracers was alternated between the first (H215O–15O2) and the second (15O2–H215O) scans across subjects.
Anaesthesia was induced with ketamine (10 mg/kg, intramuscularly) and maintained by intravenous propofol (4 mg/kg h) and vecuronium (0.05/mg kg h) during the experiment. Animals were intubated and their respiration was controlled by an anaesthetic ventilator (Cato; Drager, Germany) providing a gas mixture of 24% O2 and 76% N2. A catheter was inserted into the femoral artery for blood sampling and into the anterior tibial vein for injection of H215O and anaesthetic agents. Arterial blood pressure, heart rate, and endotidal CO2 levels were continuously monitored throughout the procedure. Arterial blood gas analysis was performed to measure the O2 content and the PaCO2 level. To assist in data analysis, all animals underwent 3D T1-weighted magnetic resonance imaging (MRI) (IR-FSPGR, TR = 9.4 ms, TE = 2.1 ms, TI = 600 ms) using a 3 T MRI scanner (Signa LX VAH/I, GE, Milwaukee, USA) in advance of the PET study.
Positron emission tomography acquisition was performed in 2D mode using a PET scanner (ECAT HR, Siemens-CTI, Knoxville, USA). After a 900-sec transmission scan with a rotating 68Ge–68Ga rod source, the dynamic scan began after the inhalation of C15O. After 10 mins of radioactivity decay, 15O2 (2200 MBq) and then H215O (370 MBq) were administered in sequence, each for a 3-min interval during a 6-min dynamic PET scan (H215O–15O2) consisting of 63 frames of gradually increasing individual durations (24 × 5, 6 × 10, 30 × 5, and 3 × 10 secs). We intended to increase the number of 5-sec frames during the second tracer-appearance period, because of possible delay of the tracer administration attributed to the synthesizer and/or injector. After 10 mins, a scan for 15O2–H215O was performed using the same dynamic data acquisition protocol. The order of 15O2–H215O or H215O–15O2 was randomized across subjects. The 15O2 was inhaled for 20 secs in a slow bolus supplied via a polyethylene tube connected to the ventilator, and the H215O was injected over a period of 30 secs via the anterior tibial vein, accompanied by an additional bolus of saline for flushing. For the three animals that received variations in PaCO2, at least 30 mins were allotted to reach a steady-state PaCO2, after which 15O2–H15O DARG was performed.
To obtain an arterial time–activity curve, arterial blood was withdrawn continuously from the femoral artery through a catheter (0.6-mm inner diameter) using a syringe pump (Harvard Apparatus, model 55–2309) with a withdraw speed of 0.45 mL/min, and the whole-blood radioactivity concentration was measured using a GSO input function monitor system (Kudomi et al, 2003). We also measured the radioactivity concentration in plasma to estimate the 15O-labeled water concentration produced as a metabolite of 15O2, for which 0.2 mL of blood was centrifuged after manual sampling at eight time points: 30, 50, 70, 90, 110, 130, 160, and 190 secs after 15O2 inhalation. The radioactivity for plasma and whole blood was measured by a well counter (NaI(Tl) scintillation counter, Aloka, Japan) cross-calibrated to the PET scan, and expressed as Bq/mL.
Arterial–Sinus Blood Sampling
We performed arterial–sinus blood sampling to obtain a global OEF (gOEFA–V) based on the Kety–Schmidt method (Kety and Schmidt, 1948). The sinus blood was sampled through a 3F catheter, which was introduced via the femoral vein to the cerebral sinus using a high-resolution digital X-ray imaging system (GE Medical System, USA). To avoid mixing with venous blood draining from extracranial tissues, the tip of the catheter was carefully placed at the angle of the cerebral sigmoid and transverse sinuses, and its position was confirmed at the conclusion of each PET protocol. We sampled 0.2 mL of arterial and sinus blood simultaneously during each DARG PET scan and measured their oxygen content (CaO2 and CvO2, respectively). The gOEFA–V was calculated as follows:

Data Processing
Corrections for dead time, the radioactive decay, and normalization of detectors were performed using the sinogram-based method described previously (Shidahara et al, 2002). Part of the corrected sinogram for the H215O–15O2 or 15O2–H215O scan was summed for each period of labeled water (120 secs from the start time of water injection, or effectively 90 secs after the rise time of the tissue TAC), and oxygen intake (180 secs from the start time of oxygen inhalation). The summed images were corrected for attenuation using transmission data, and were reconstructed using the filtered-back-projection method with a 4-mm Gaussian filter. A reconstructed image consisted of a 128 × 128 × 47 matrix with a pixel size of 1.1 × 1.1 × 3.38 mm. In addition, dynamic sinograms for the H215O–15O2 and 15O2–H215O scans were reconstructed with same conditions as above and used for a nonlinear least-squares fitting (NLF) analysis.
To correct for the delay between the brain and blood TACs, the whole brain TAC was obtained from the corrected dynamic sinograms (Shidahara et al, 2002). The delay was estimated based on a method previously described (Iida et al, 1988). Briefly, three parameters, K1, k2, and delay (Δt), were determined using whole brain and blood TACs around the period of H215O injection with an NLF procedure (Iida et al, 1988; Shidahara et al, 2002). The dispersion time constant was fixed at 3 secs (Shidahara et al, 2002).
To compute CBF, OEF, and CMRO2 as described above, it is necessary to obtain separated 15O2 and H215O input functions (Ao and Aw) from the measured arterial TAC, because the arterial blood TAC measured during the second phase of the scan reflects not only the radioactivity of the second tracer but also the residual activity of the first. For the H215O–15O2 protocol, we first estimated the TAC for the residual radioactivity from the first tracer (H215O) administration remaining during the second period by extrapolating the arterial TAC of the first phase by a model of input function (Kudomi et al, 2002). We then subtracted it from the measured total arterial TAC in the second phase to obtain a TAC for the second tracer. Second, the metabolic product (recirculating water) following 15O2 administration was estimated using the plasma radioactivity measured during the phase of >15O2 and a fitting procedure described previously (Huang et al, 1991; Iida et al, 1993). Next, it was added to the extrapolated residual H215O TAC to obtain a TAC for H215O (Aw), and also subtracted from the second TAC to obtain a pure TAC for 15O2 (Ao). For the 15O2–H215O protocol, we first obtained the TAC for recirculating water during the first phase of 15O2 administration as described above, and then separated the arterial TAC into pure TACs for 15O2 (Ao) and for H215O (Aw) during the first phase. Second, we estimated the TAC for the residual radioactivity of 15O2 during the second phase by extrapolating the estimated arterial 15O2 TAC from the first phase as described above, and then obtained Ao and Aw. The preliminary validation of this procedure is described elsewhere (Kudomi et al, 2002).
The C15O sinogram data summed over 240 secs beginning at 120 secs after C15O inhalation, and reconstructed. The CBV images were then generated from the C15O images using the blood radioactivity concentration averaged over the scan period, with an assumption of a peripheral-to-central hematocrit ratio (RHct) of 0.85 (Phelps et al, 1979), a blood density of 1.06 g/mL, and a brain-tissue density of 1.04 g/mL (Lammertsma et al, 1987).
A set of CBF, OEF, and CMRO2 images were calculated according to the DARG technique, using a set of integrated images (∫Ci(t)dt and ∫oCi(t)dt), a CBV image (VB), and TACs for H215O(Aw) and 15O2 (Ao) based on the formula described above, assuming P = 0.8 mL/g (Iida et al, 1991) and FV = 0.835 (Mintun et al, 1984). Corresponding images were also calculated according to the three-step ARG using a procedure previously described (Shidahara et al, 2002). Briefly, the CBF image was calculated using the reconstructed image for H215O, the initial part of the H215O–15O2 scan (0 to 120 secs, ∫wCi(t)dt), and the corresponding arterial TAC using a look-up-table procedure. Similarly, the OEF and CMRO2 images were calculated using the 15O2 part of the 15O2–H215O scan (0 to 180 secs, int;oCi(t)dt), with corrections for recirculating water and the CBV compartment. Because C15O PET was performed only once for each animal, the resulting CBV image was used to calculate all DARG and three-step ARG images acquired during normocapnia and variable PaCO2 conditions.
Data Analysis
To assess the consistency of the calculated physiologic values, we obtained and analyzed the global and regional brain values separately. Magnetic resonance imaging images were de-skulled and coregistered to the CBF PET image by a rigid body transformation using statistic parametric mapping software (SPM 99, Wellcome Department of Neurology, London, UK). A region of interest (ROI) for the whole brain was drawn in every slice on the coregistered MRI images, using the GpetView (http://homepage2.nifty.com/peco/gpetview/gpetview.html) software, and transferred to all PET images obtained by three-step ARG and DARG (H215O–15O2 and 15O2–H215O) to determine gCBF, gOEF, and gCMRO2. We compared each variable between DARG and three-step ARG, and the gOEF value was compared with that of gOEFA–V2; all data are presented as means+s.d. The paired t-test was applied to evaluate differences between methods, and P<0.05 was considered statistically significant. We plotted gOEF from DARG and gOEFA–V acquired during varied PaCO2 against each other and performed regression analysis.
Regional values for CBF and CMRO2 were obtained in 24 circular ROIs of 5-mm in diameter: two in frontal, images are also presented at the upper left three in temporal, two in parietal, two in occipital cortical regions, and three in subcortical regions; data were recorded for each hemisphere. Although a great attention has been made in selecting small ROIs, the partial volume effect may not be minimized attributed to the small size of the brain in monkeys (approximately 50 mm in size). Regression analysis was performed comparing the values of CBF and CMRO2 between three-step ARG and either DARG sequence. To test the validity of using a fixed p in the DARG protocol, regional CBF, OEF, and CMRO2 values were also calculated using the NLF technique. Using a Gaussian–Newton algorithm, three parameters of f, E, and p were fitted to equation (2) using arterial input functions for H2O and O2, as determined previously. The CBV was fixed at each ROI using the C15O scan value, and all other parameters were fixed at the same values as described above. Tissue TACs for each region were extracted by averaging four TACs in frontal regions, six in temporal regions, four in parietal regions, four in occipital cortical regions, and six in subcortical ROI; those ROIs were projected to the dynamic PET images for H2O–O2 and O2H2O. In each region, CBF, OEF, and CMRO2 values were computed by NLF and DARG and compared using a paired t-test. All data are presented as means+s.d., and P<0.05 was considered statistically significant.
Error Analyses in Simulation
Error propagation was analyzed for four factors: delay and dispersion in arterial TAC, blood/tissue partition coefficient (P), and cerebral blood volume (VB). It is known that the measured arterial TAC is delayed and more dispersed relative to the true input TAC in the brain because of the time it takes for blood to traverse the peripheral artery and catheter tube before reaching the detector (Iida et al, 1986, 1988, 1989, 2000; Lammertsma et al, 1990). Calculation of CBF using ARG PET always uses a fixed partition coefficient throughout the whole brain (ranging 0.8 to 0.9 mL/g) and does not evaluate it regionally (Herscovitch and Raichle, 1985; Iida et al, 1989, 1991; Shidahara et al, 2002). An error in CBV measured by the PET scan may also introduce errors in calculating the cerebral oxygen consumption (Mintun et al, 1984; Lammertsma et al, 1987).
Typical arterial input functions for water (Aw) and oxygen (Ao) were obtained from one monkey in this study and used after simulation as the true arterial TACs. Using these arterial TACs and equation (2), tissue TACs for water and oxygen were created using known values for normal brain tissue (CBF = 50 mL 100/g min, OEF = 0.4, CBV = 0.04 mL/g, P = 0.8 mL/g, Fv = 0.835, and RHct = 0.85). These TACs were used as true tissue TACs for three-step ARG. True tissue TACs for DARG were created by adding two tissue TACs for each tracer with a time lag of 3 mins, simulating the interval of administration. To simulate the error propagation resulting from errors in estimated delay time and dispersion time constants, the error in delay time or dispersion time was varied from −4 to 4 secs, where a positive error represents an overcorrection of delay time or dispersion time constant, and a negative error represents undercorrection, as described previously (Iida et al, 2000). Values for CBF, OEF, and CMRO2 were calculated based on three-step ARG and DARG. To shift the dispersion time constants, the true arterial TAC was convoluted or deconvoluted with a simple exponential (Iida et al, 1986; Kanno et al, 1987). For simulating the error in the values of p and VB, the value of p was varied from 0.7 to 0.9 mL/g, and that of VB from 0.02 to 0.06 mL/g; in each situation, tissue TACs were created and CBF, OEF, and CMRO2 values were calculated using these TACs, assuming P = 0.8 mL/g and VB = 0.04 mL/g. Errors in these calculated values are presented as percentage differences from the normal values for each DARG and three-step ARG. In DARG, both orders of tracer administration were simulated.
Results
Animal Experiments
Figure 3 shows an example of measured and estimated blood TACs (Ao and Aw) and whole brain TAC in one 15O2–H215O DARG PET experiment. In this experiment, 15O2 (2,200 MBq) and H215O (370 MBq) were sequentially administrated in that order. As shown in this figure, the present method for extracting Aw and Ao TACs from measurements of arterial blood TAC accurately predicted the time course of the whole brain TAC.
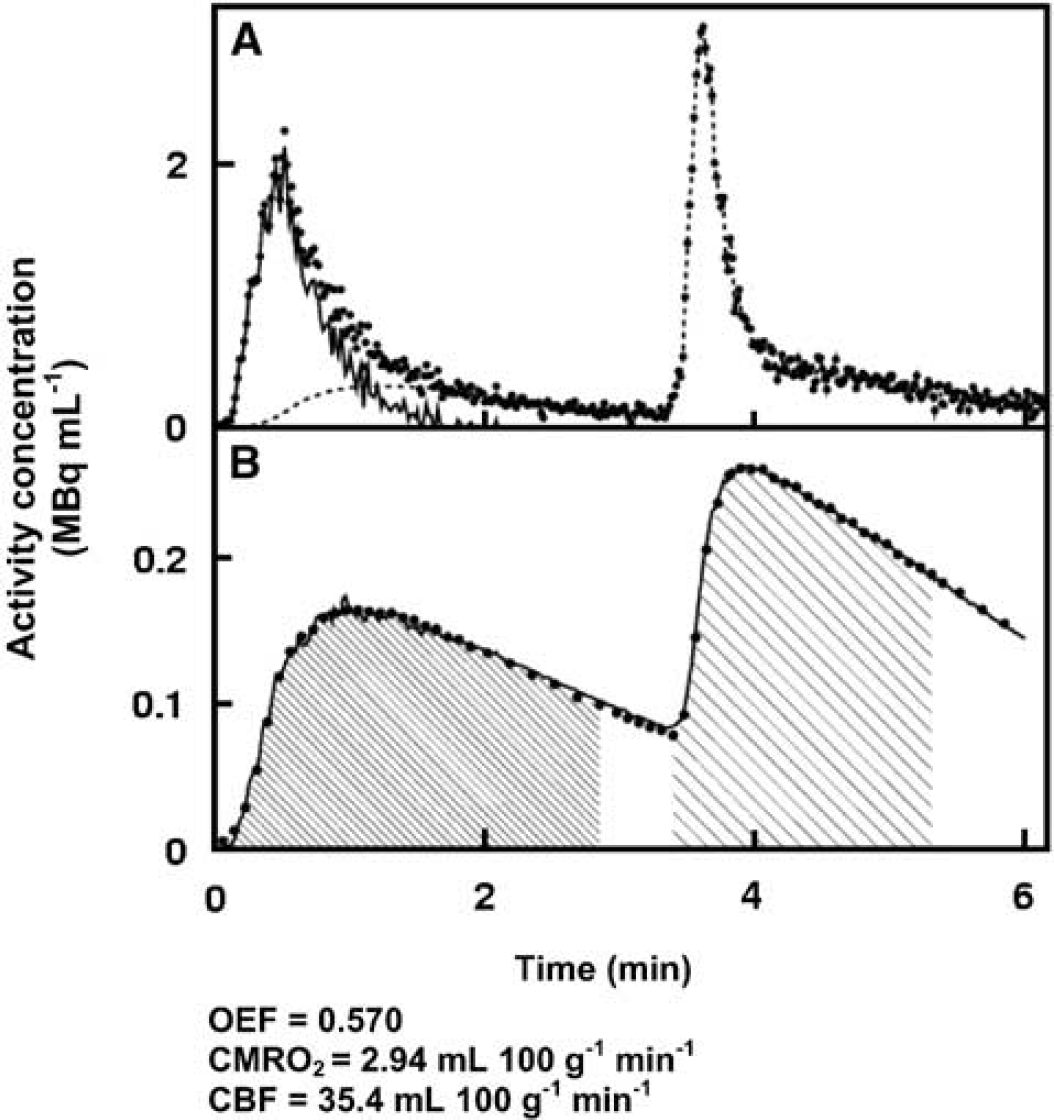
Example of blood and tissue TACs from DARG, in which administration of 15O2 (2,200 MBq) was followed by H215O (370 MBq) with an interval of 3 mins during a 6-min PET scan. (
In Table 1, quantitative values of gCBF, gCMRO2, and gOEF for whole brain are summarized. The paired t-test did not show any significant differences in any variable between three-step ARG and either DARG sequence order (H215O–15O2 or 15O2–H215O) (P>0.05, n = 6). Also, there were no significant differences in gOEF between either of the PET methods or the A–V method (P>0.05, n = 6). For the measurements obtained during normocapnia, the PaCO2, PaO2, SaO2, and hemoglobin values were 38.9+1.4 mm Hg, 119+12 mm Hg, 97.3%+1.2%, and 13.6+1.0 g/dL, respectively; all of these are considered within the normal range.
Global values of CBF (gCBF), OEF (gOEF), and CMRO2 (gCMRO2) calculated by three-step ARG and DARG, and gOEF calculated by arterial-venous difference of oxygen contents
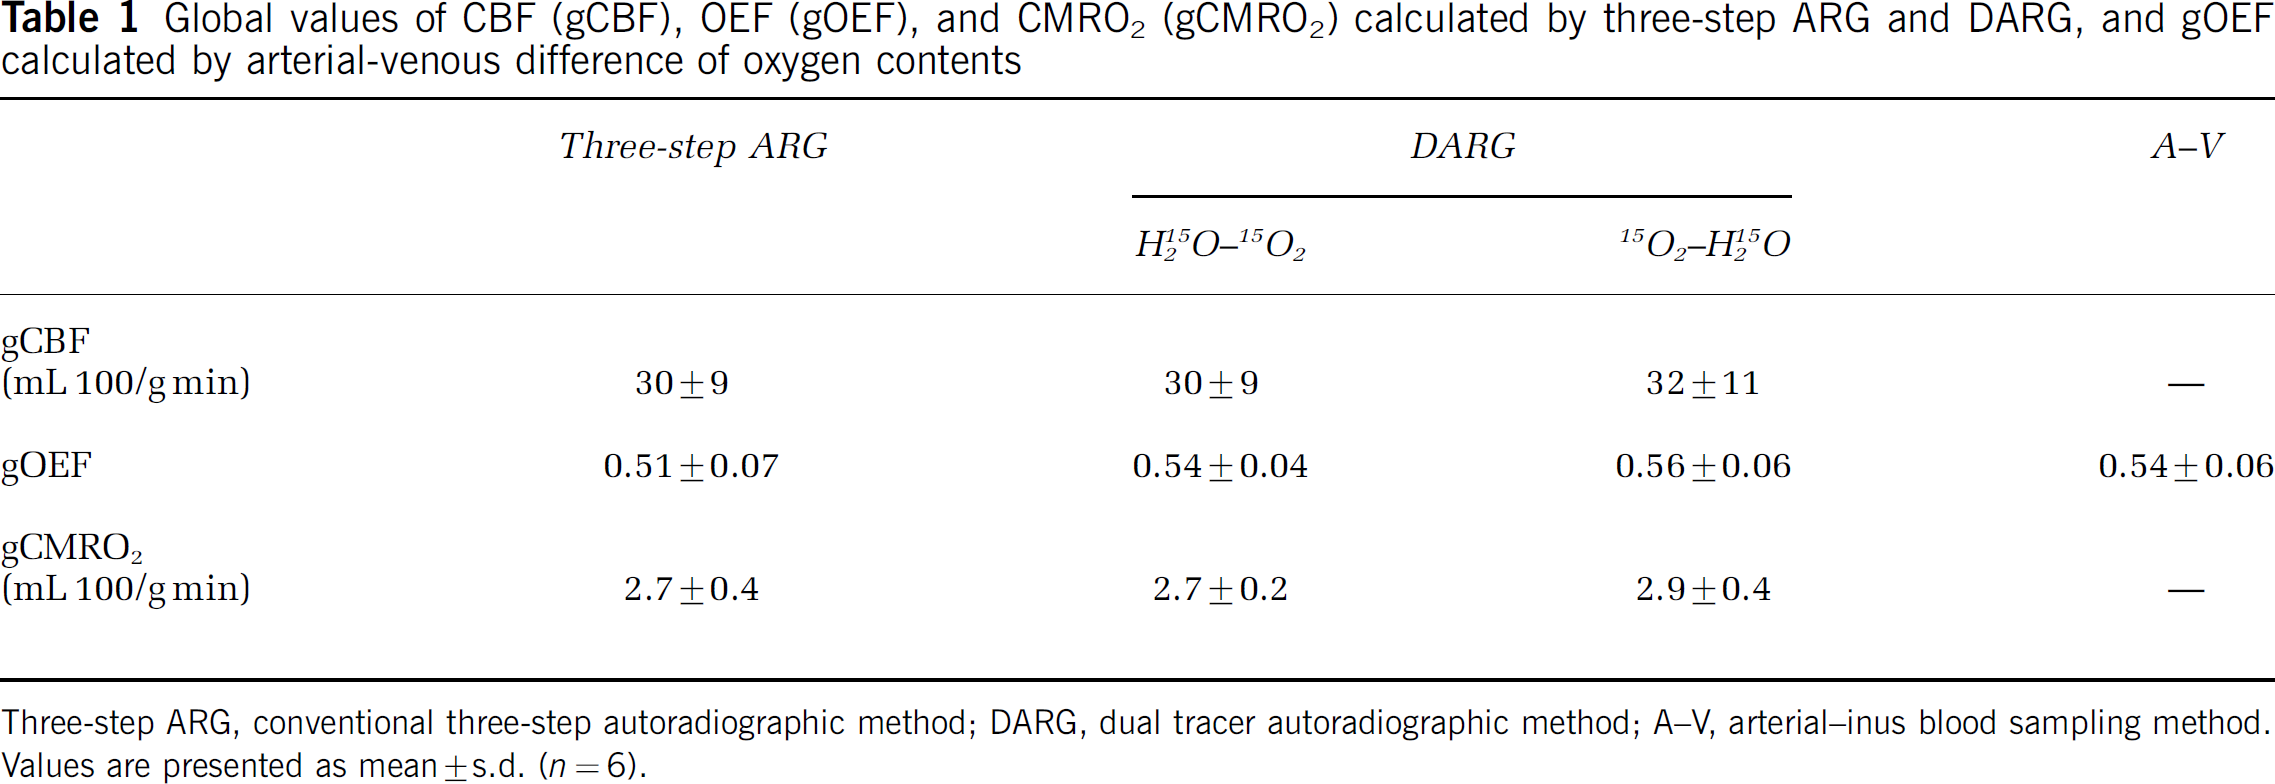
Three-step ARG, conventional three-step autoradiographic method; DARG, dual tracer autoradiographic method; A–V, arterial–inus blood sampling method. Values are presented as mean±s.d. (n = 6).
Figure 4 shows the DARG-derived gOEF values plotted against gOEFA–V values, all obtained during PaCO2 variation. The best-fit regression line can be expressed as gOEF = 1.03gOEFA–V–0.01 (r = 0.963, P<0.001, n = 12). The intercept is not significantly different from zero (P>0.05), and the slope of the line is close to unity. During these measurements, PaCO2 values ranged from 28 to 57 mm Hg.
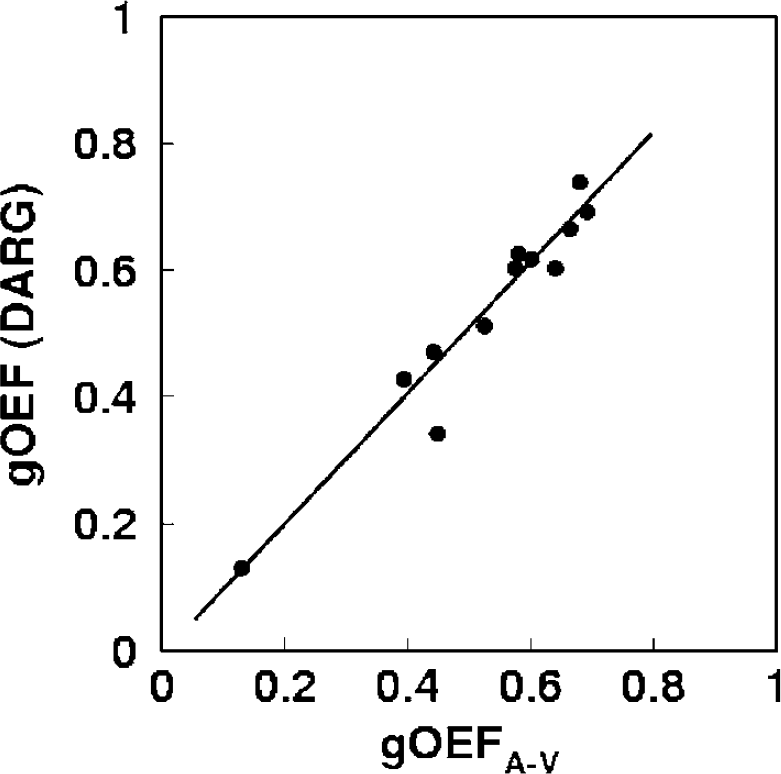
Plots of OEF measured by the arterio-sinus difference (gOEFA-V) and DARG (gOEF-DARG). The regression analysis exhibited a significant positive correlation with a slope close to unity (r = 0.963, P<0.001, n (the number of observations) = 12). DARG was performed with an administration order of 15O–H215O. DARG, dual tracer autoradiographic method; OEF, oxygen extraction fraction.
The relationships of the regional ROI values between three-step ARG and DARG (H215O–15O2 and 15O2–H215O) are shown in Figure 5. The obtained regression lines for CBF were CBF (DARG (H2O–O2)) = CBF (three-step) + 0.00 mL 100/g/min (r = 1) and CBF (DARG (O2–H2O)) = 1.03 CBF (three-step) + 0.75 mL 100/g/min (r = 0.88). For CMRO2, the regression lines were CMRO2 (DARG (H2O–O2)) = 0.97 CMRO2 (three-step) + 0.00 mL 100/g/min (r = 0.91) and CMRO2 (DARG (O2–H2O)) = 1.09 CMRO2 (three-step)–0.11 mL 100/g/min (r = 0.93), and showed that the values of slope were not significantly different from the unity.
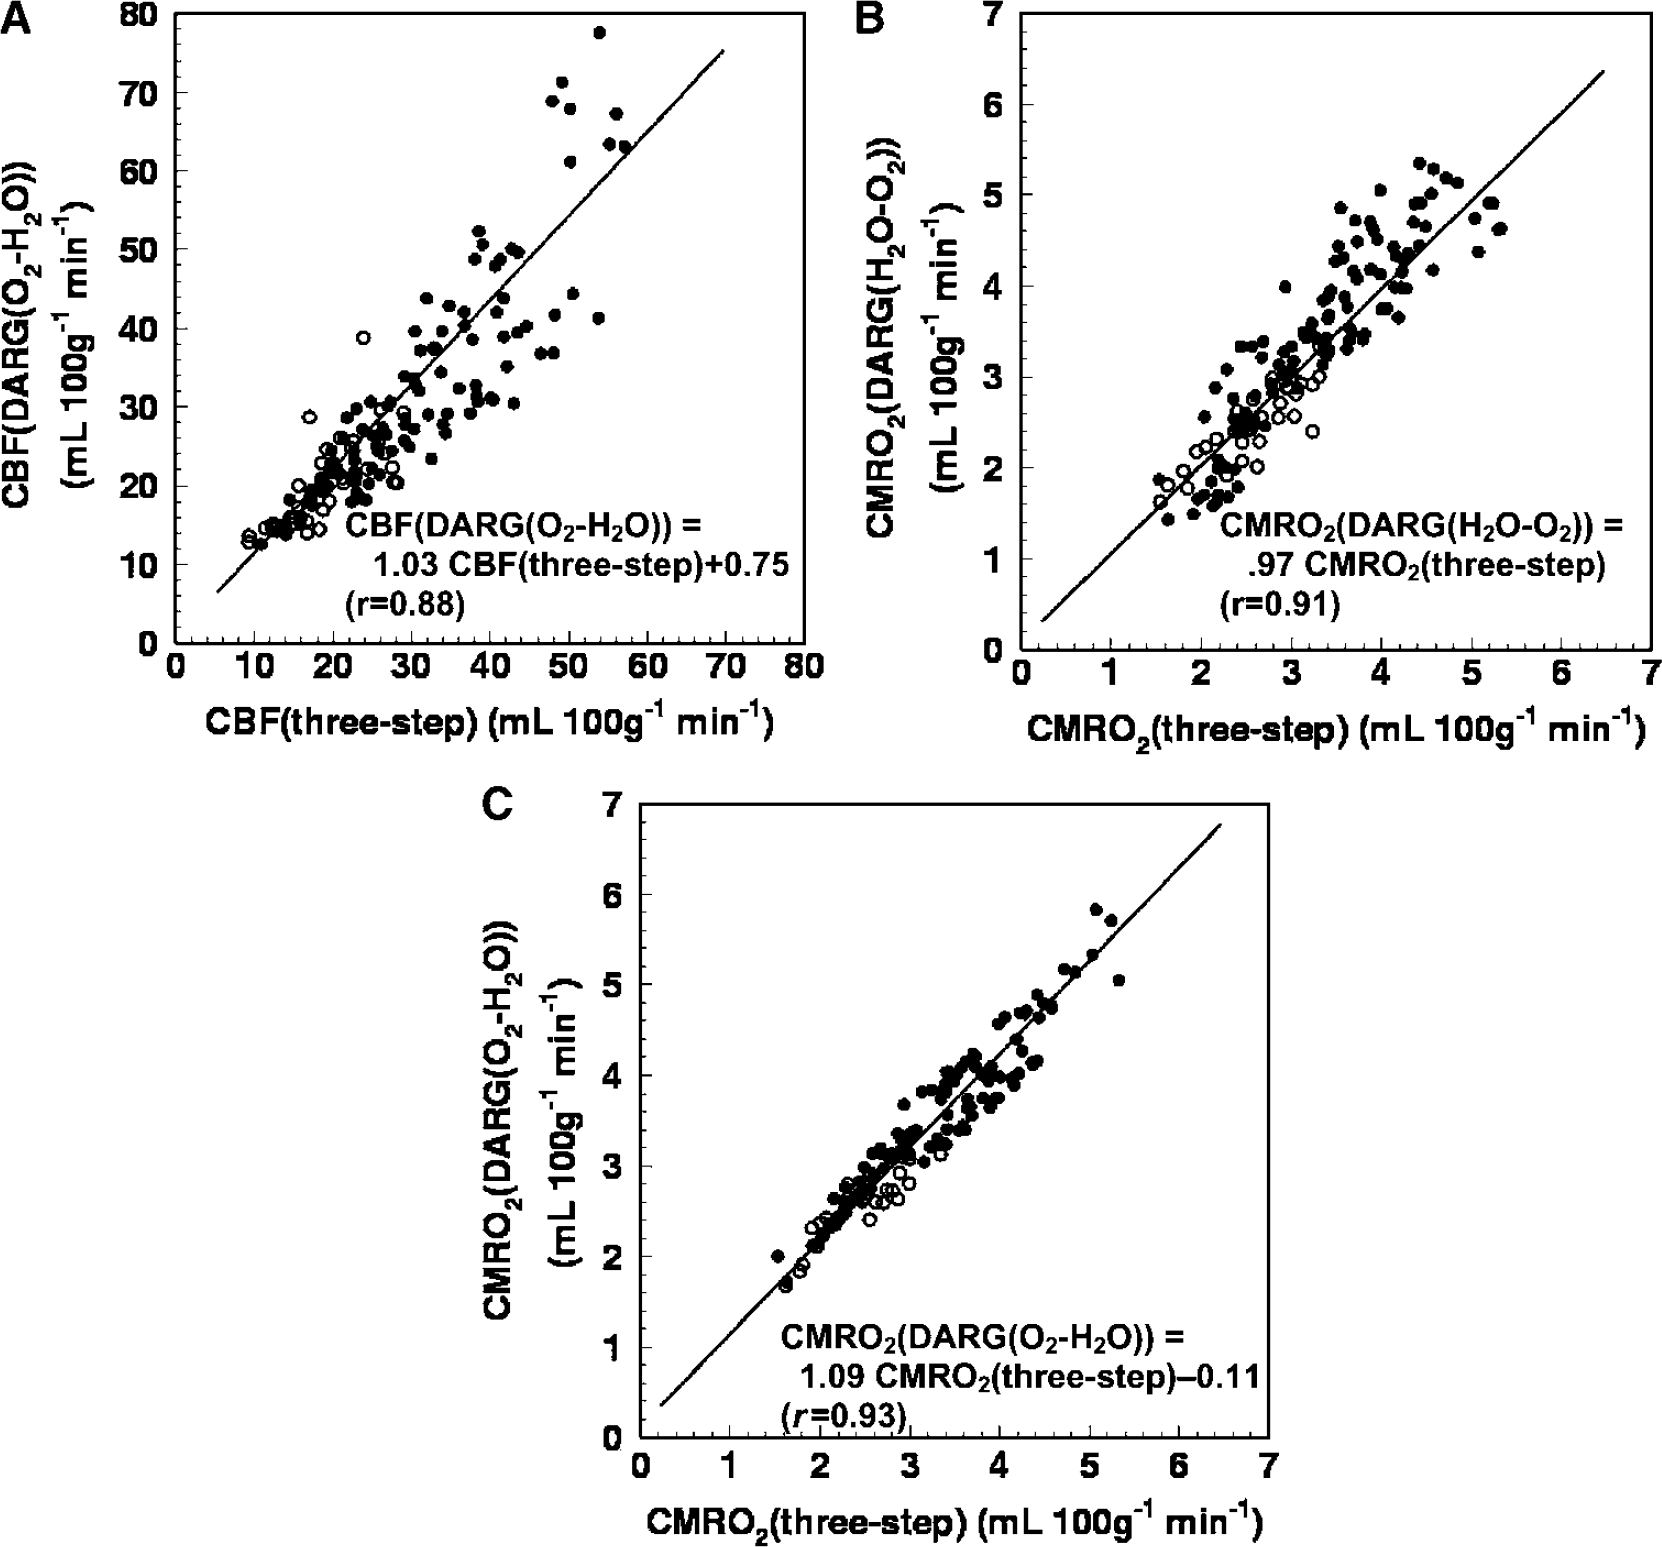
Relationships of the regional ROI values of (
In Table 2, values of CBF, OEF, and CMRO2 in regional ROI computed by DARG and NLF are listed for each data set for both 15O2–H215O and H215O–15O2. In every region, for both data sets, the obtained CBF, OEF, and CMRO2 values did not differ significantly between NLF and DARG (paired t-test, P>0.05). In each region, the estimated value of p for NLF was not different from the assumed value of 0.8 (one sample t-test, P>0.05); however, two-way analysis of variance with ‘region’ and ‘subject’ as factors showed a statistically significant effect of ‘region’ on p (F4, 30 = 5.27, P = 0.029). Its mean was the smallest in the subcortex (0.69 to 0.70 mL/g). Considering that subcortical ROI size involves not only white matter but also subcortical gray matter and ventricles, this result supports a previous notion that tissue mixtures cause an underestimation of p (Iida et al, 1989). Therefore, these results suggest that using a fixed p value seems not to cause significant bias in CBF, OEF, and CMRO2.
Regional values in DARG and NLF
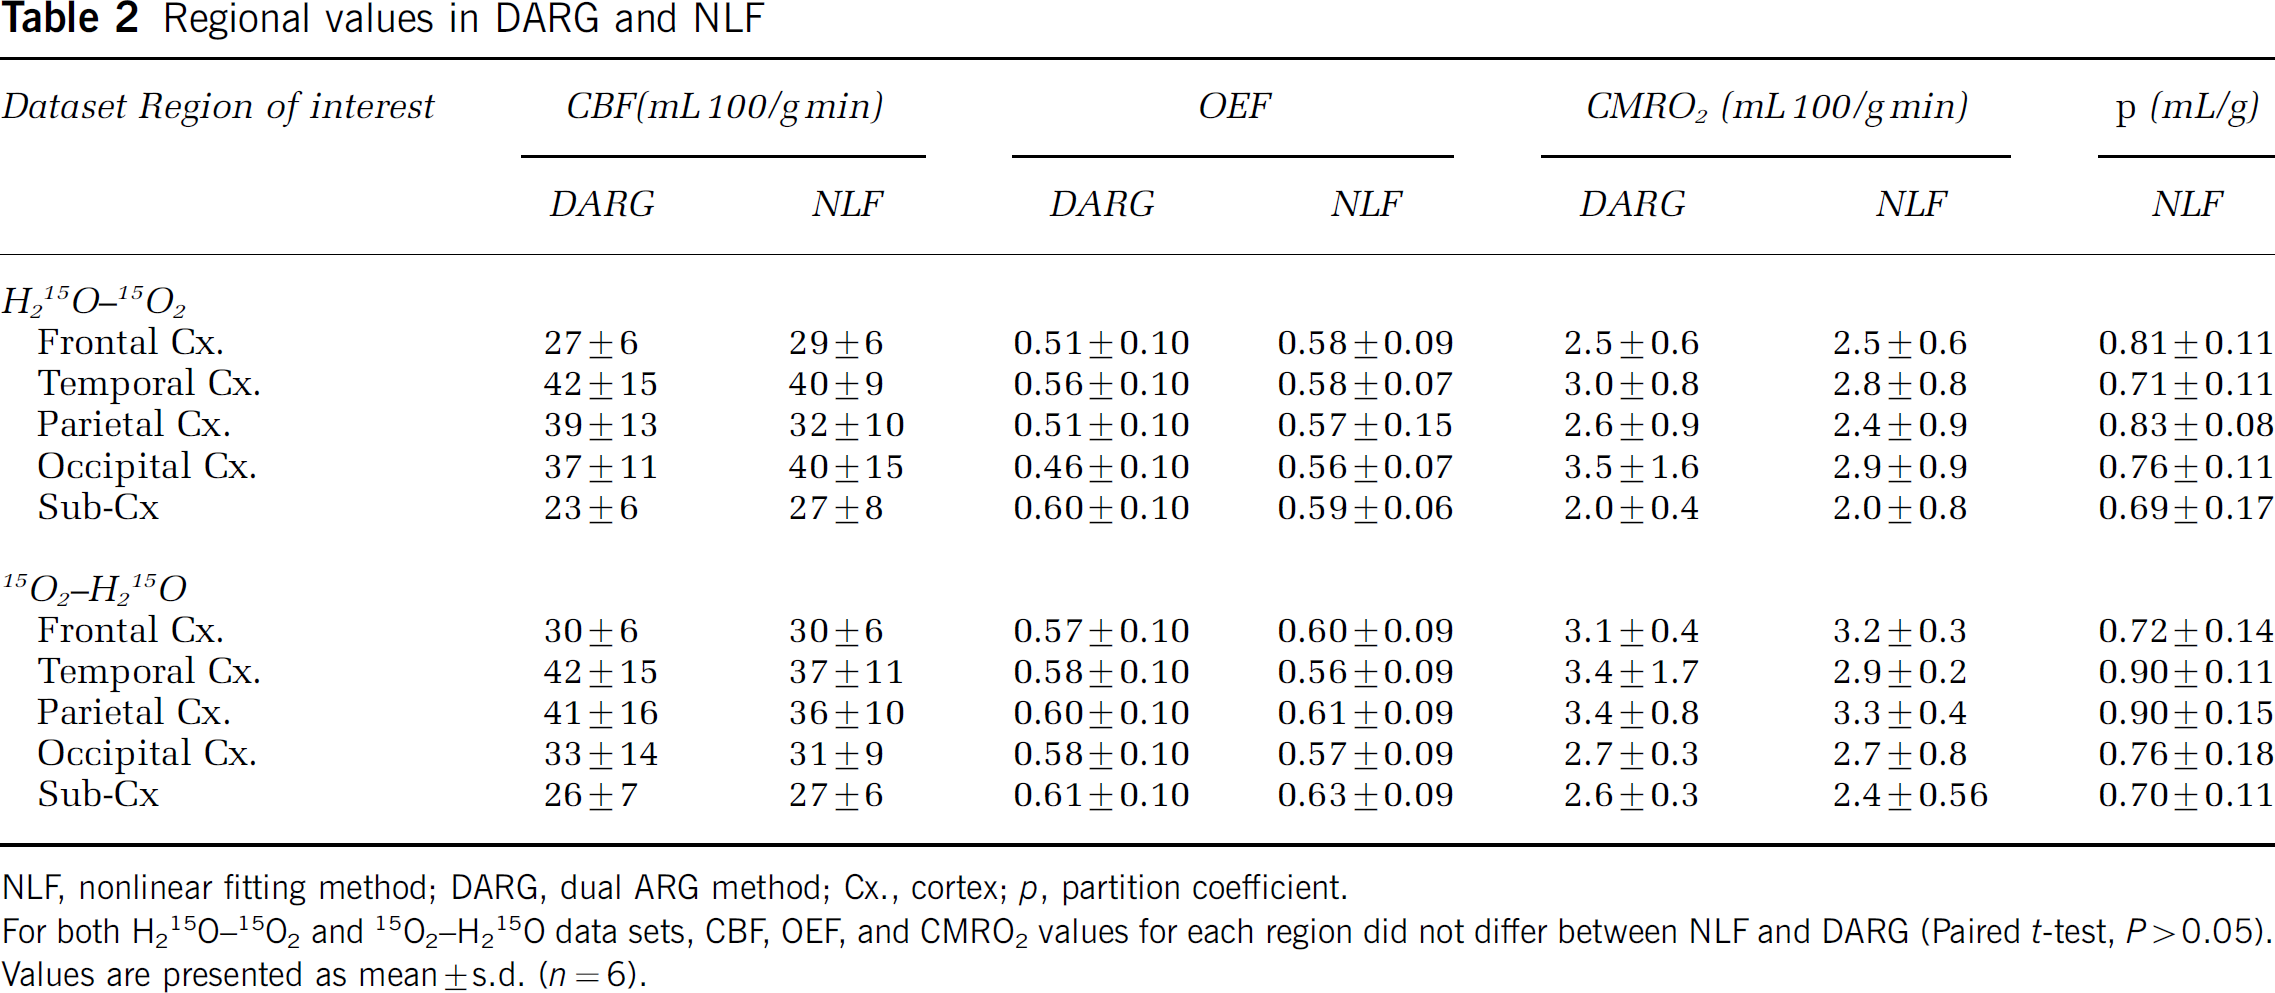
NLF, nonlinear fitting method; DARG, dual ARG method; Cx., cortex; p, partition coefficient.
For both H215O–15O2 and 15O2–H215O data sets, CBF, OEF, and CMRO2 values for each region did not differ between NLF and DARG (Paired t-test, P>0.05). Values are presented as mean+s.d. (n = 6).
Figure 6 provides a representative set of CBF, OEF, and CMRO2 images generated by DARG and three-step ARG. The functional images generated from DARG were of comparable quality to those obtained using three-step ARG.
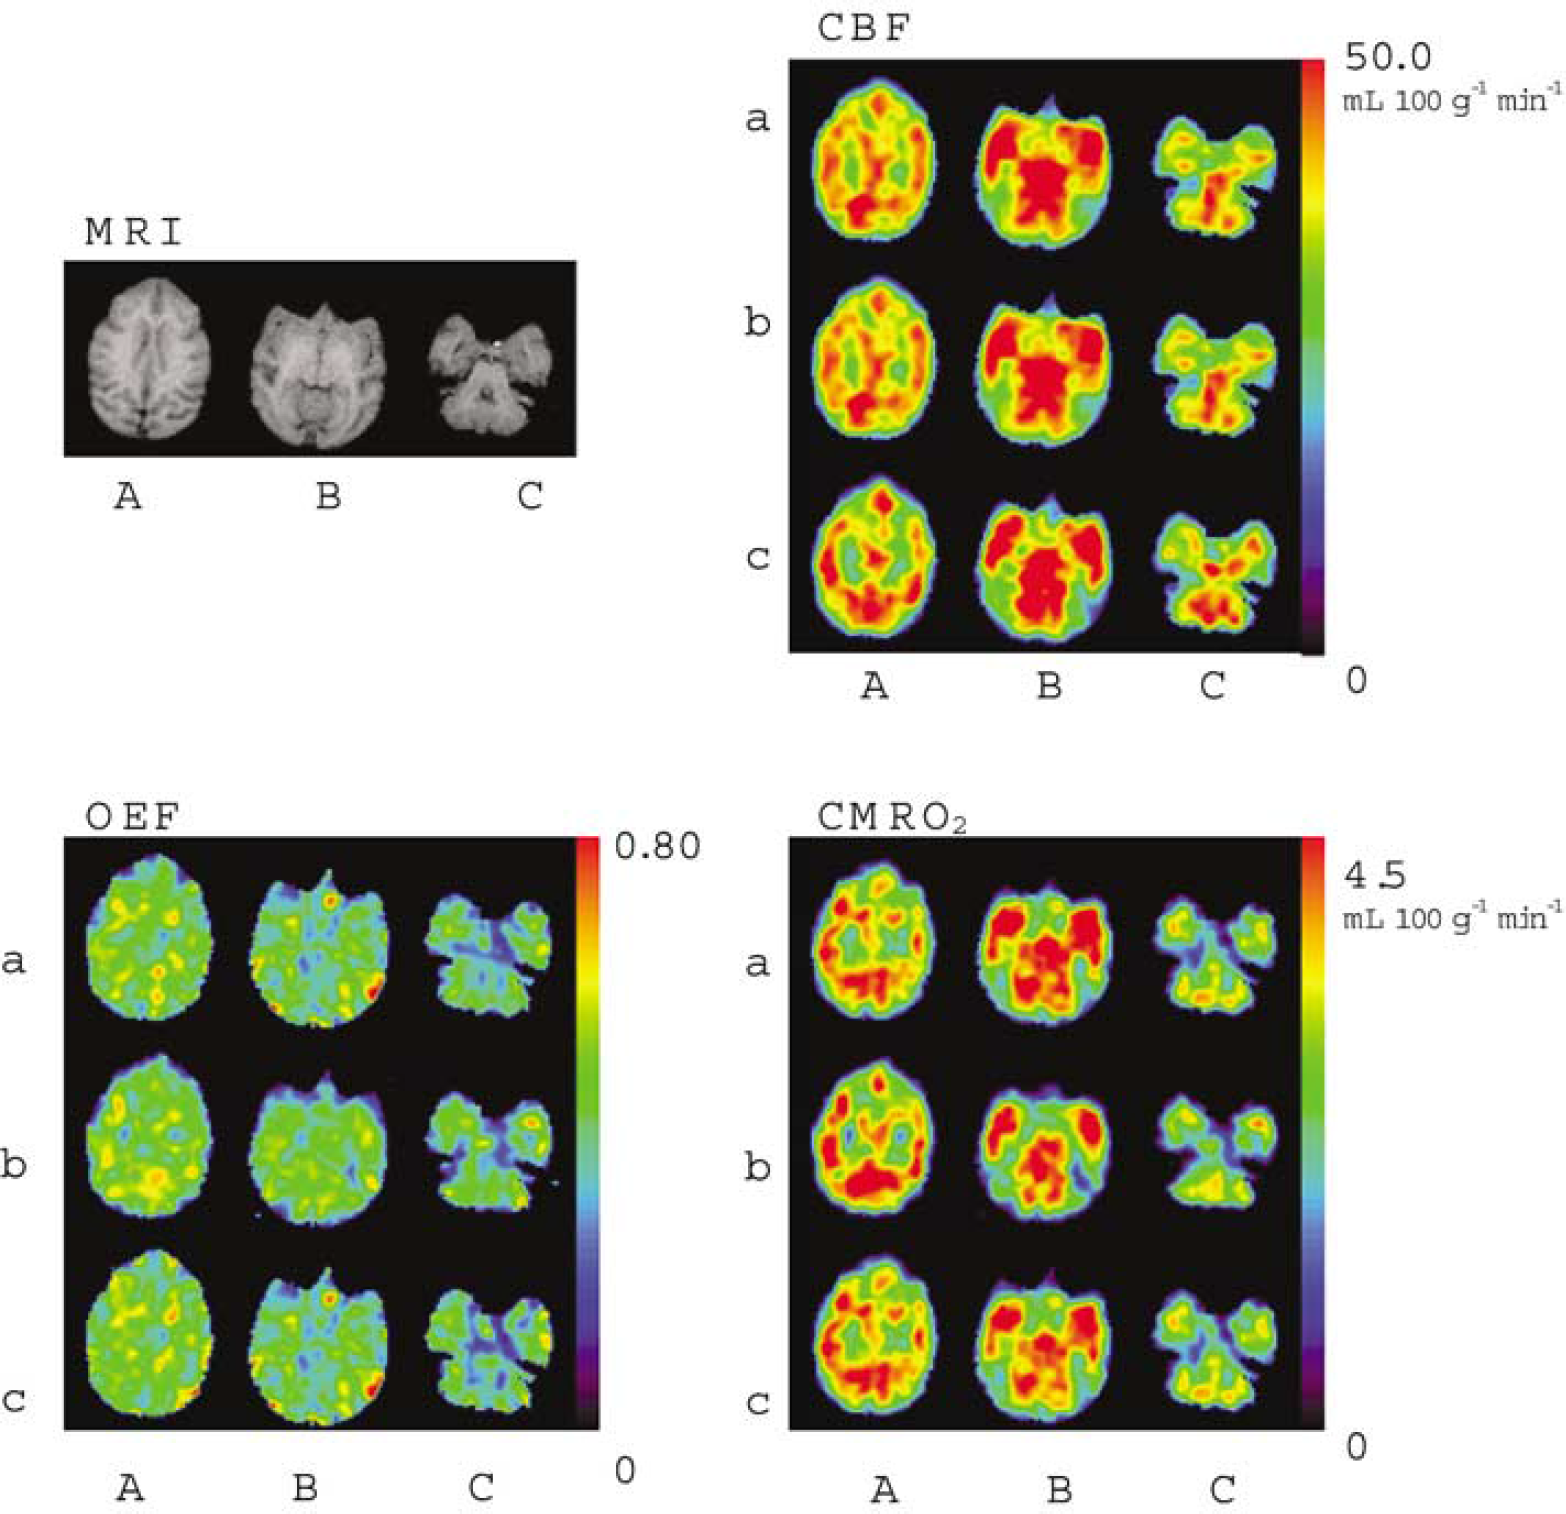
Functional images from one monkey obtained by (a) three-step ARG, (b) DARG H215O–15O2, and (C) DARG 15O2–H215O. Images were axially sectioned at the level of the (A) lateral ventricle, (B) thalamus, and (C) cerebellum. Coregistered T1-weighted MRI
Error Analysis
Effects of delay correction errors: (Figure 7): For CBF, the error sensitivity of the DARG-H215O–15O2 protocol was the same as that in three-step ARG, whereas the error sensitivity of the DARG-15O2–H215O protocol was smaller by 20%. For OEF, the error sensitivity in DARG-H215O–15O2 was increased two-fold, while that in DARG-15O2–H215O was suppressed by 50%. For CMRO2, the error sensitivity in DARG-H215O–15O2 was suppressed by 40%, whereas that in 15O2–H215O was almost equal to the value for three-step ARG. For example, when the error in the measured delay was 2 secs, errors in DARG were at most 5%, 3%, and 3% in CBF, OEF, and CMRO2, respectively. Considering that the error estimation of delay would be up to 2 secs in the present procedure (Kanno et al, 1987; Shidahara et al, 2002), these results indicate that the error sensitivity to delay associated with DARG did not greatly exceed that from three-step ARG.
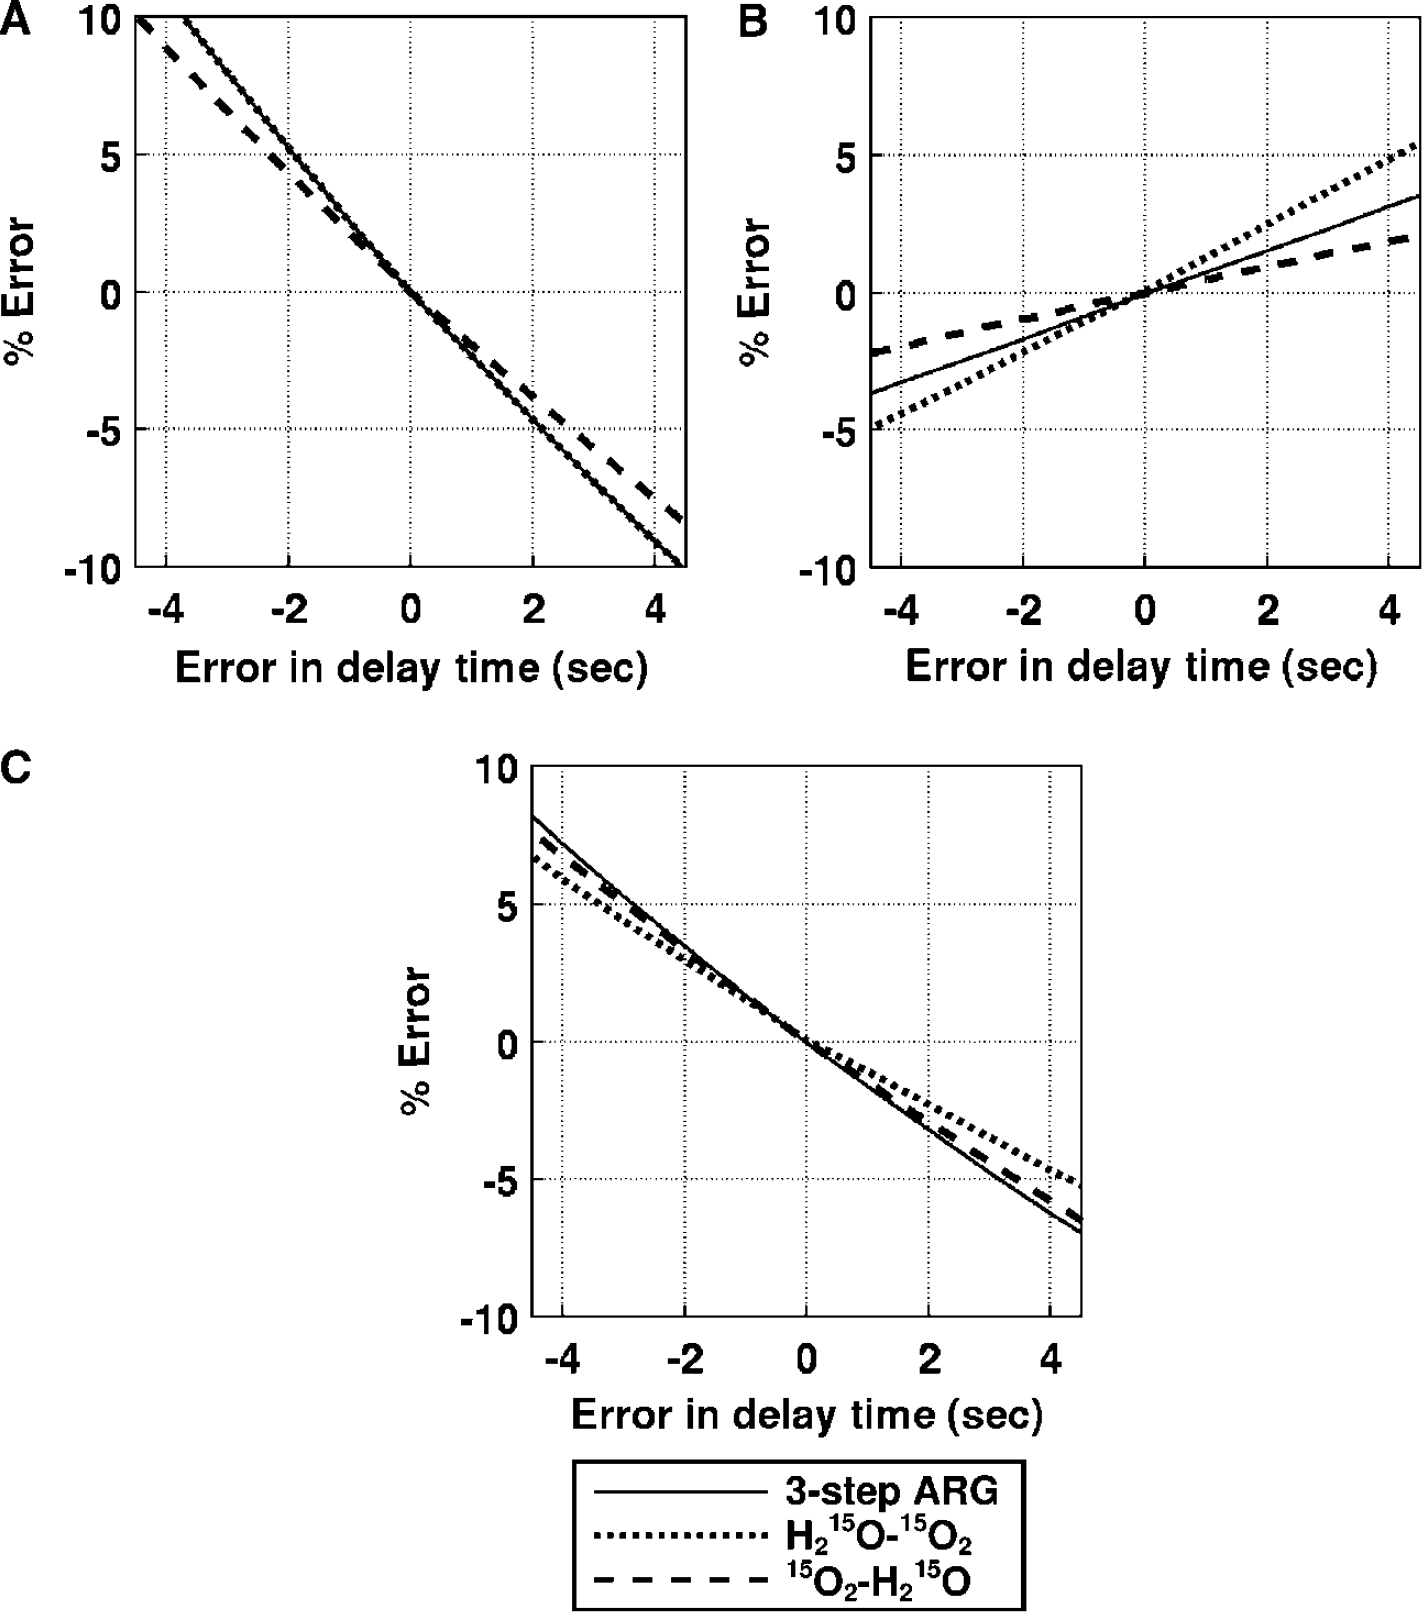
Error propagation from the error in input delay time to the functional parameters: (
Effects of dispersion correction errors (Figure 8): For CBF, the error sensitivity in DARG H215O–15O2 was similar to that associated with three-step ARG; in contrast, that in 15O2–H215O was suppressed by 20%. For OEF, the error sensitivity in H215O–15O2 was increased two-fold, while that in 15O2–H215O was decreased by 50%. For CMRO2, the error sensitivity in DARG H215O–15O2 was suppressed by 20%, but that in 15O2–H215O was nearly equal to that of three-step ARG. The magnitude of errors introduced in CBF, OEF, and CMRO2 were less than 5% for all estimation procedures even if there was 2 secs of error in estimating the time constant of dispersion (Iida et al, 1986). These results also indicate that the error sensitivity to dispersion in DARG does not significantly exceed that associated with three-step ARG.
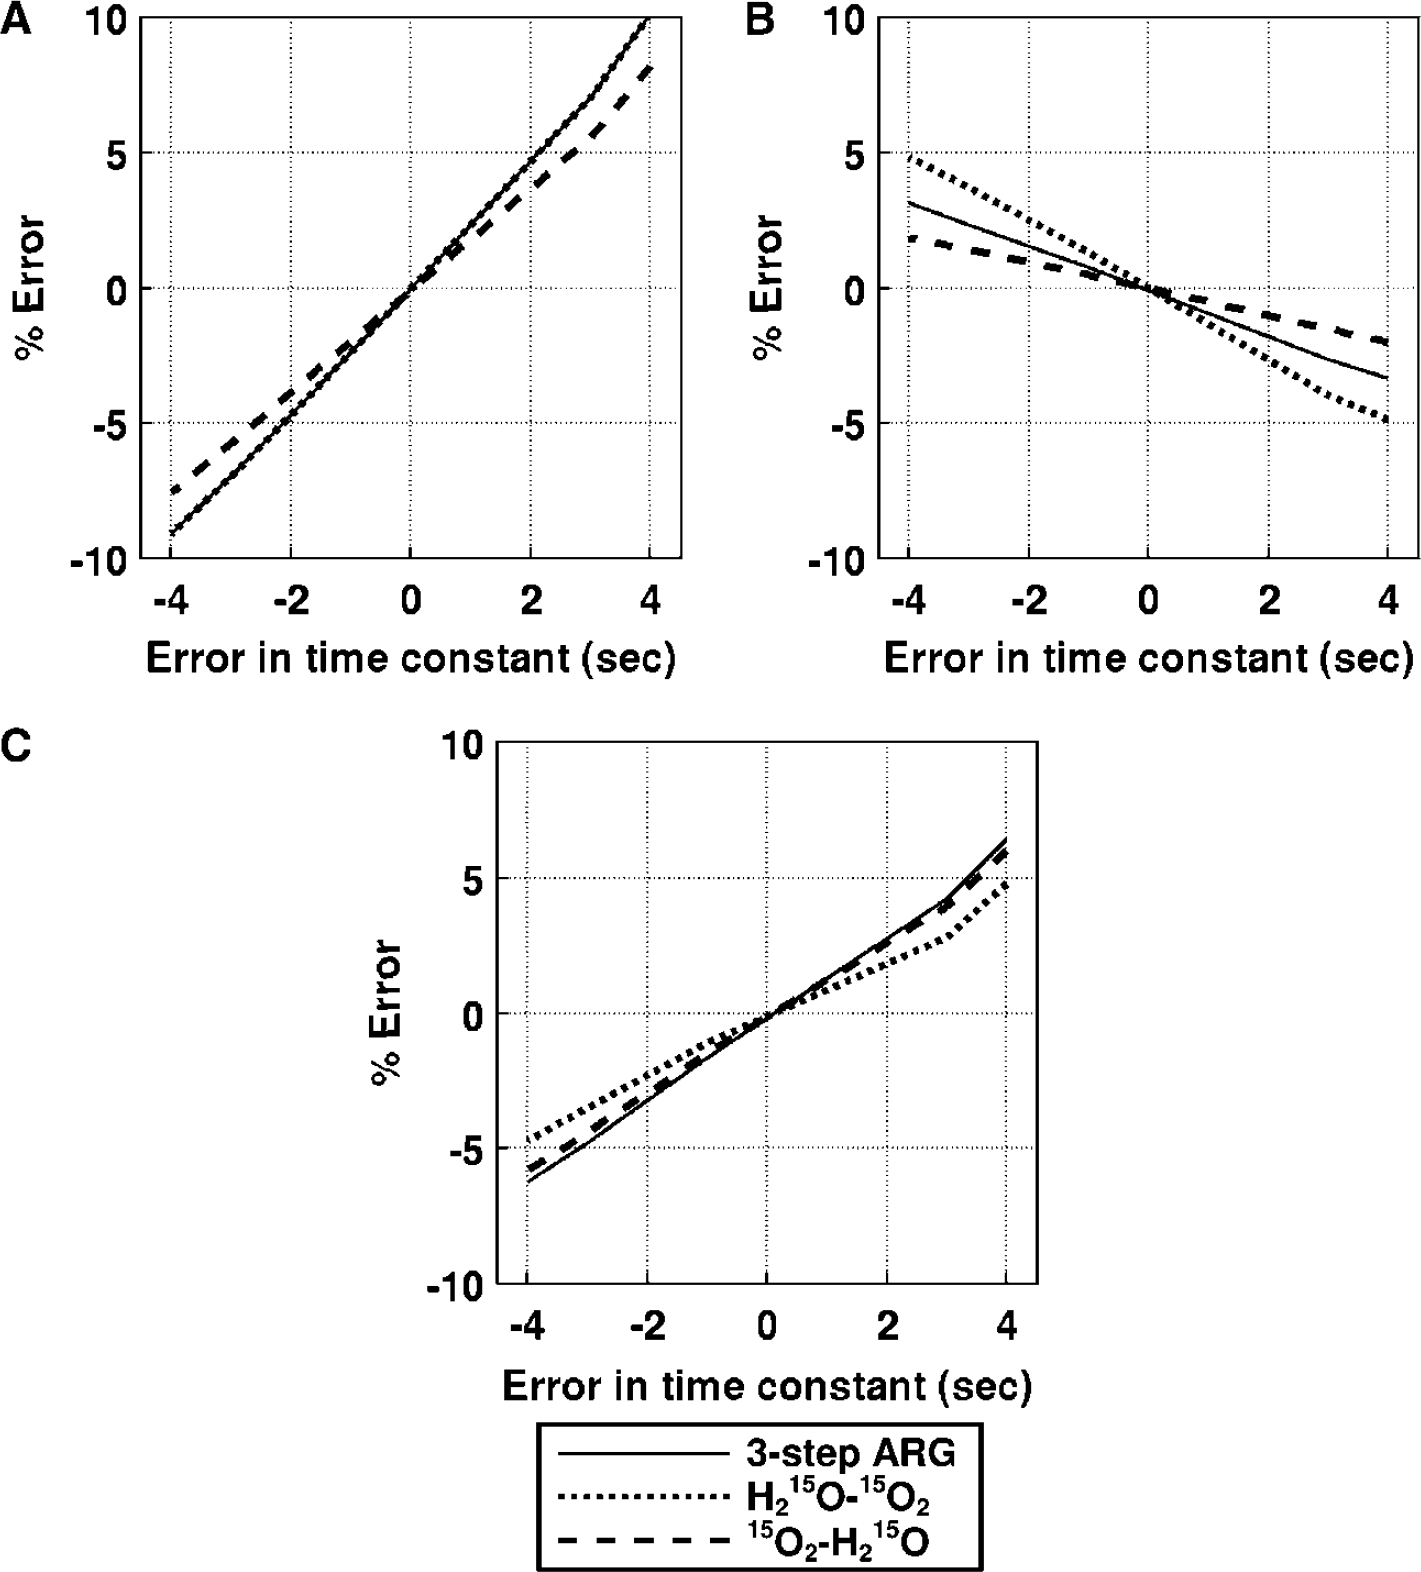
Error propagation from the error in the dispersion time constant to the functional parameters: (
Effects of the partition coefficient (Figure 9): For CBF, the error sensitivity in H215O–15O2 was the same, and that in 15O2–H215O was enhanced two-fold, as compared with three-step ARG. For OEF, the error sensitivity was enhanced three-fold in H215O–15O2 relative to three-step ARG, and the magnitude of error was almost zero for 15O2–H215O. For CMRO2, the error sensitivity was increased two-fold in H215O–15O2 and was the same in 15O2–H215O, as compared with three-step ARG. Assuming that the variation in p is 5%, the magnitude of error in the CBF estimated in 15O2–H215O was at most 3.5%, whereas the error in OEF and CMRO2 in H215O–15O2 was 7%. Although the error sensitivities in H215O–15O2 for OEF and CMRO2 were somewhat larger than those associated with three-step ARG, the overall error sensitivity in DARG was similar to that in three-step ARG.
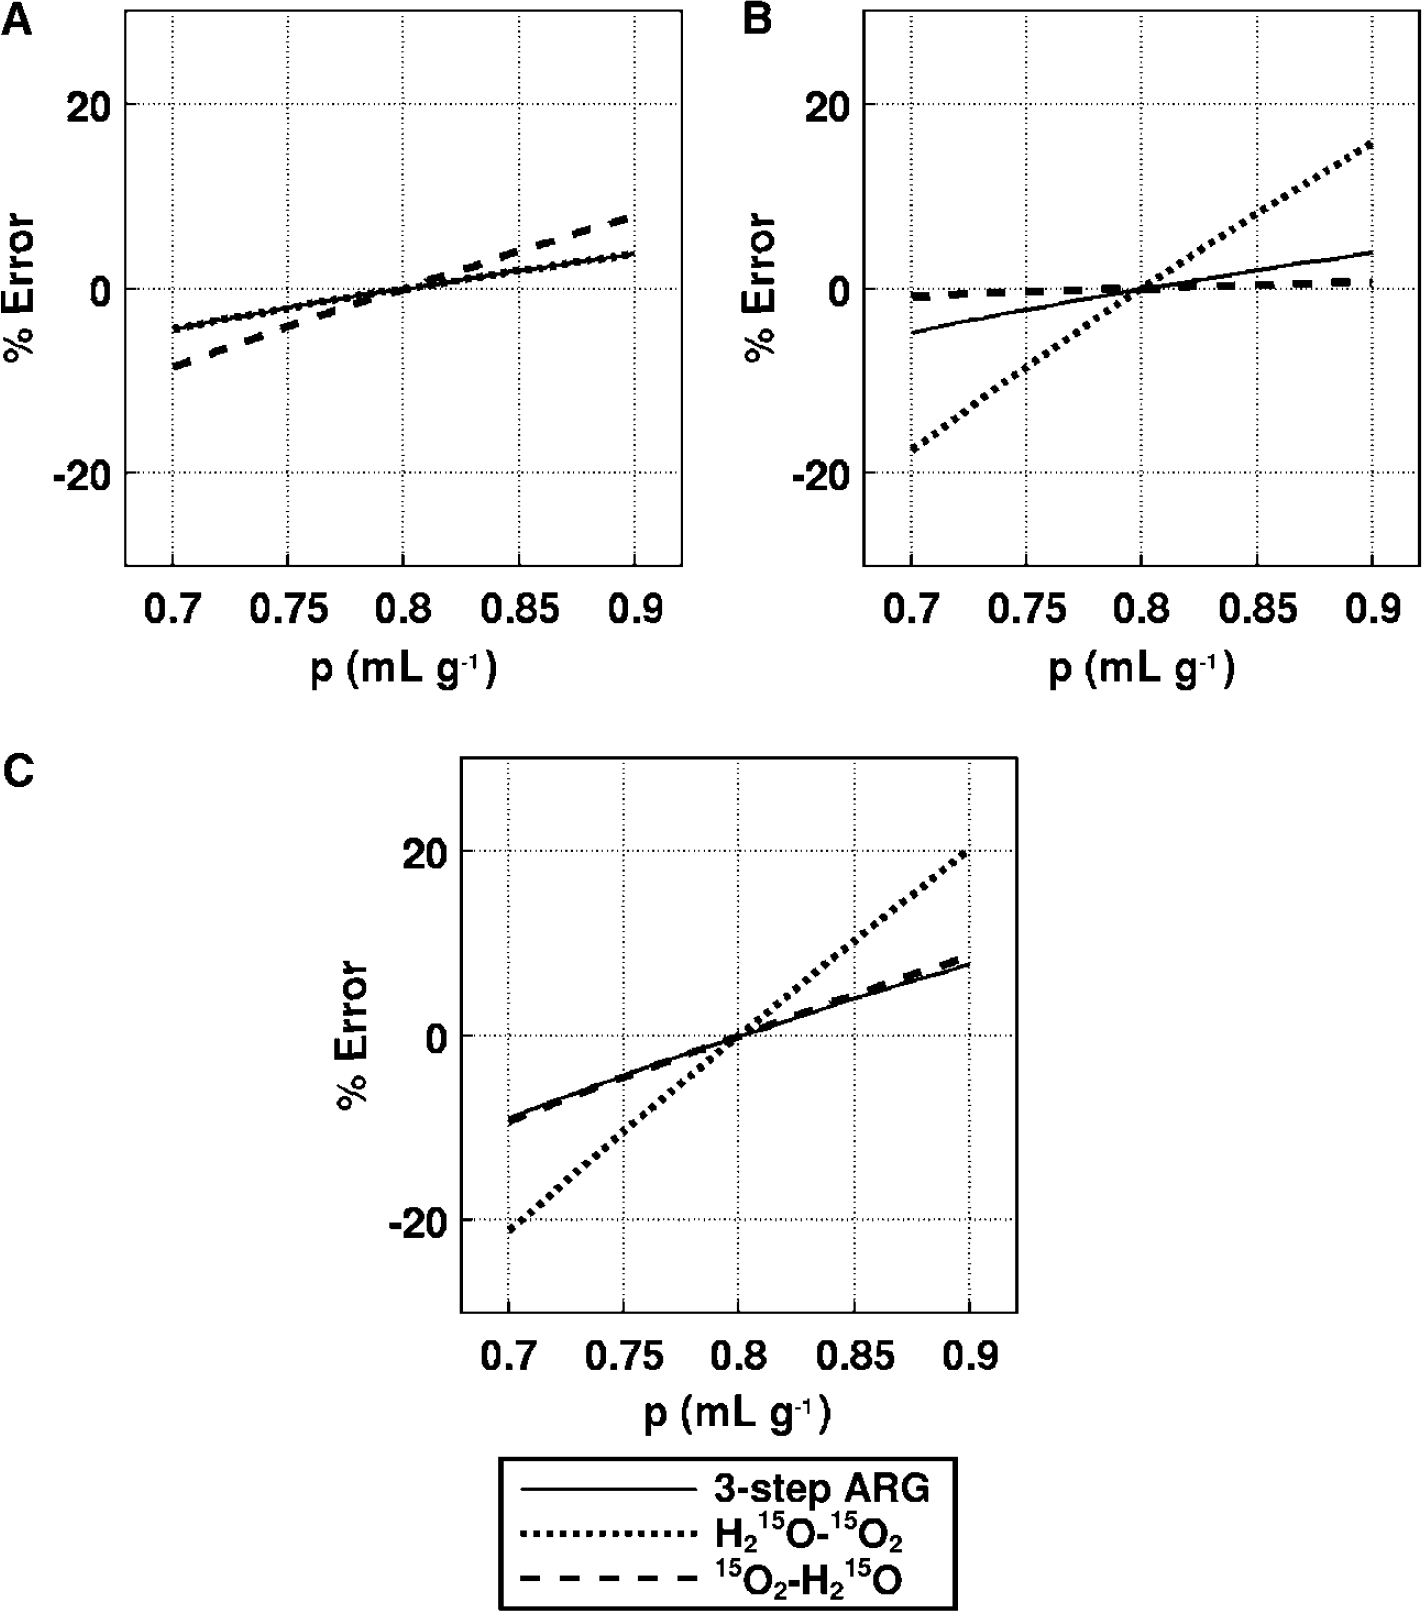
Error propagation from the partition coefficient to the functional parameters: (
Effects of blood volume (Figure 10): The error sensitivities in both DARG experiments were identical to those obtained from three-step ARG. The magnitude of error introduced into the CBF estimate were less than 1%, and that for OEF and CMRO2 was less than 5% in all methods, even assuming a true CBV of 0.06 mL/g.
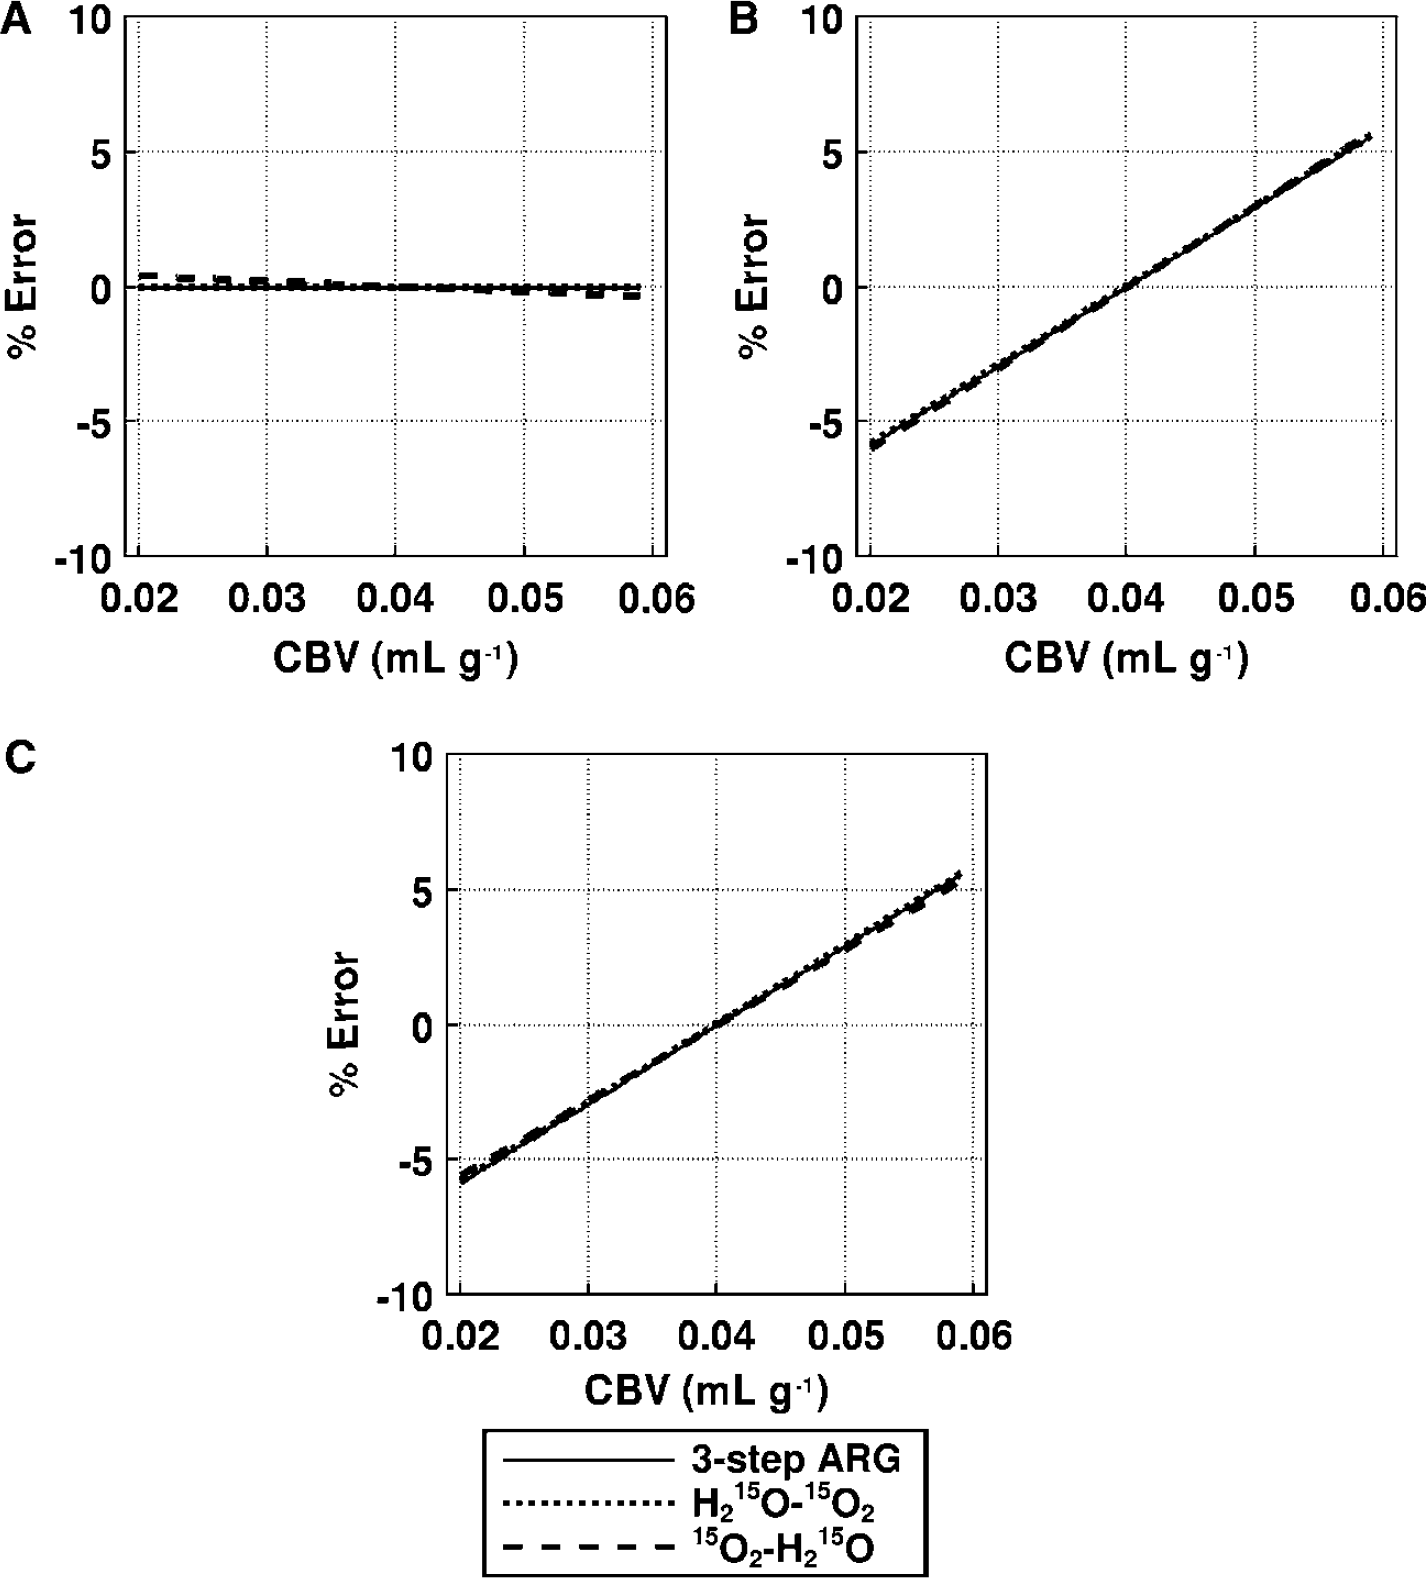
Error propagation from CBV to the functional parameters: (
This simulation study shows that the error sensitivity introduced in the quantitative values of CBF, OEF, and CMRO2 for the first phase of the dynamic PET scan used in DARG was nearly the same as that in three-step ARG. In contrast, the error for the second phase was either enhanced or suppressed, depending on the relationship of the error between measured or assumed parameters and the estimate of residual radioactivity.
Finally, we have estimated the sensitivity in diseased tissue that simulates decreased CBF with elevated OEF (f = 20 mL 100/g min and E = 0.7), namely the ischemic lesion. The magnitude of error in the functional values of this tissue was roughly the same in terms of delay and dispersion, and was relatively smaller in terms of p and CBV, than the magnitude of error for assumed normal tissue. For example, when assumed 5% error in P, the magnitude of error introduced in CBF, OEF and CMRO2 in the H215O–15O2 scan was 1.5%, 2%, and 2% respectively, whereas that in H215O–15O2 was 3%, 0%, and 3%, respectively.
Discussion
In this study, we have proposed a novel, rapid PET technique for quantitative assessment of both CBF and CMRO2 from a single PET scanning with sequential administration of two tracers. This article described the validity of this technique in anesthetized monkeys at rest and during varied PaCO2 conditions. There was no significant difference in CBF, OEF, or CMRO2 values at rest, as compared with those obtained using three-step ARG. The estimated OEF values were also found to be in a good agreement with those derived from arteriosinus blood sampling for a wide physiologic range. The image quality generated by DARG was identical to that of three-step ARG. The simulation also showed that the errors in the estimated parameters attributed to errors in delay, dispersion and the assumed partition coefficient was in the same level as compared with that of the three-step ARG. It should also be noted that the error sensitivity to the CBV was reasonably small, namely almost no errors in CBF, and only +5% errors in OEF and CMRO2 are caused even if +50% errors are included in CBV. These findings suggest that the DARG technique provides CBF and CMRO2 images with reasonable accuracy and quality, and also allows multiple assessment of CBF/CMRO2, provided that a single CBV scan is performed.
The DARG technique provides multiple parameter mapping of CBF and CMRO2 from a single PET scan during sequential administration of two tracers of H215O and 15O2 (or 15O2 and H215O). Multiple tracer approach has been applied to 11C-labeled tracers for mapping multiple receptor ligands (Koeppe et al, 2001). Another application of this approach is the repeat assessment of CBF. Watabe et al (2002) showed that CBF images can be quantitated at much shorter interval than the previous protocol, typically at 90 secs, from sequential PET scanning during repeat H215O administration at 90 secs interval
The measured OEF, CBF, and CMRO2 values obtained in this study were consistent with previous studies. OEF values in this study were 0.51+0.07 from three-step ARG, 0.54+0.04 from DARG (H215O–15O2), 0.56+0.06 from DARG (15O2–H215O), and 0.54+0.06 from arterio-sinus blood sampling. In anesthetized monkeys, Altman et al (1991) obtained OEF values of 0.53+0.13 from arteriosinus blood sampling. Using steady-state PET, others have measured OEFs ranging from 0.42 to 0.58 in normal tissues of anesthetized monkeys (Altman et al, 1991; Pappata et al, 1993; Touzani et al, 1995; Young et al, 1996; Schumann et al, 1996; Frykholm et al, 2000). Moreover, the values of gCBF in the present PET study were 30+9 mL 100/g min from three-step ARG, 30+9 mL 100/g min from DARG (H215O–15O2), and 32+11 mL 100/g min from DARG (15O2–H215O), and the CMRO2 values were 2.7+0.4 from three-step ARG, 2.7+0.2 mL 100/g min from DARG (H215O–15O2), and 2.9+0.4 mL 100/g min from DARG (15O2–H215O). Previously reported values varied from 27 to 37 mL 100/g min for CBF and 2.4 to 3.4 mL 100/g min for CMRO2 (Altman et al, 1991; Pappata et al, 1993; Touzani et al, 1995; Young et al, 1996; Schumann et al, 1996; Frykholm et al, 2000). Variations are because of the differences in monkey species, physiologic conditions, anesthetic agent used, PET scanner, and methodology; the current results clearly show that the DARG method can be used to determine these physiologic parameters with a high degree of accuracy.
There has not been systematic error sensitivity analysis for the conventional three-step ARG method. We thus have performed a simulation study to evaluate the error sensitivity for both the three-step ARG and DARG techniques. The error sensitivity appeared to be almost identical for all error sources estimated in the simulation. Small differences were, however, seen in particular cases obtained in this experiment. These differences may have arisen because of incorrect estimation of residual radioactivity in the second phase of the PET data. For example, when the true p is larger than the value assumed for H215O–15O2, the CBF will be estimated as larger than the true value. Thus, washout of water will be overestimated, leading to a lower estimate of residual radioactivity. Underestimation of the residual radioactivity and large p values results in an overestimation of oxygen uptake (OEF), thus increasing the error in the CMRO2 value. It is also notable that when the delay was overcorrected in H215O–15O2, the error in CMRO2 decreases compared with three-step ARG. The CBF becomes smaller than the true value and the amount of residual radioactivity will also be estimated to be smaller, causing overestimation of oxygen uptake (OEF). As a result, similar magnitudes of overestimation of OEF and underestimation of CBF will cancel the error in CMRO2.
The present model provides pixel-by-pixel estimates of CBF, CMRO2, and OEF based on data from a single PET scan, assuming a constant partition coefficient (p) for H215O, as has been perfprmed for H215O autoradiography (Herscovitch et al, 1983; Raichle et al, 1983) and the three-step method (Mintun et al, 1984). The error in p propagates not only to CBF but also to OEF and CMRO2. We used a fixed value of 0.8 mL/g for p, which was empirically determined so as to minimize the tissue mixture associated with the limited spatial resolution of PET scanner (Iida et al, 1989, 1991). The simulation study showed that the range of errors was almost within an acceptable range. Regional analysis also showed that the CBF, OEF, and CMRO2 values provided by DARG were consistent with by NLF in normal monkeys. Thus, using a fixed p value in DARG should not cause significant bias provided that CBF, OEF, and CMRO2 are of interest. However, this should be further validated in humans, as the effective p value could be affected by the tissue mixture and the magnitude of this effect might be different in human (Iida et al, 1991).
Several previous studies showed the feasibility of fixing a p value for H215O ARG (Herscovitch and Raichle, 1985; Kanno et al, 1987; Iida et al, 1989) and the three-step ARG (Mintun et al, 1984; Iida et al, 1993). One may argue the adequacy of this assumption in diseased tissues, that is, the p values may be increased in edematous regions, or decreased in the area of necrotic tissue. In case CBF is reduced in such lesions, errors in the estimated parameters would be small, because a linear relationship is expected between the tissue-radioactivity counts and the physiologic parameters, and the p does not contribute significantly to the kinetic behavior of the tracer accumulation. However, a great error can be expected if CBF is at a high range in the area of reduced p, as only a small change in p may cause large changes in the tissue accumulation of the tracers. Exact magnitude is unknown, and should be evaluated carefully for each of diseased conditions.
The present method has several advantages over three-step ARG. It eliminates the time required for radioactive decay between the H215O and 15O2 scans, thus shortening the procedure by at least 10 mins compared with the three-step method. Importantly, it also minimizes the error resulting from physiologic fluctuations. Kinetic models of CBF-CMRO2 used in PET techniques assume constant physiologic conditions throughout all PET scans, and CMRO2 is mathematically dependent on CBF. Thus, physiologic changes during PET measurement may underlie in part the errors in quantitative values. It is well known that CBF easily varies with PaCO2 (Grubb et al, 1974) and PaO2 (Borgstrom et al, 1975; Johannsson and Siesjo, 1975); however, CMRO2 remains constant. In fact, Hattori et al (2004) recently showed that OEF values in three-step method were not identical to those in gOEFA–V in human, suggesting the presence of physiologic change during the measurement. The present method may also make physiologic interpretations of flow and metabolism more accurate (Hayashi et al, 2003). Finally, it allows evaluation of coupling or uncoupling of CBF and CMRO2 during functional activation or pharmacological stress, such as that induced by acetazolamide used for assessment of cerebral vascular reserves.
Ohta et al (1992) showed another technique for the rapid estimation of CBF, OEF, and CMRO2 from a 3-min single PET scan following bolus inhalation of 15O2. This approach does not take into account recirculating water and involves a mathematical formula with weighted integration to calculate these quantitative values. However, the generated functional images suffer from statistical noise, which is attributed to the need for determination of multiple parameters from a small amount of time-varying data. Cerebral blood flow images, in particular, suffer significantly from noise; precise determination of CBF often requires another PET scan with H215O injection (Meyer et al, 1987; Ohta et al, 1999; Fujita et al, 1999; Mintun et al, 2002). In contrast, the present approach can generate images of reasonable quality from a single 6-min PET scan. Although currently it still requires another C15O scan for CBV correction, we believe that an additional mathematical formulation strategy, such as the basis function method (Gunn et al, 1997) could eliminate this need. In addition, to shorten the time for the transmission scan, we could possibly apply a segmented attenuation correction technique (Xu et al, 1994, 1996). We believe that the total PET scan time for measuring CBF and CMRO2, for which patients need to be on the bed of the PET scanner, could be minimized to around 10 mins.
In the present study, the recirculating water in the arterial blood has been measured directly and continuously from separated plasma. This is laborious and may limit the use of this protocol for clinical studies. However, Iida et al (1993) have estimated the amount of recirculating water and showed that its amount can be predicted using a single compartment model in three-step ARG in normal human subjects. This method eliminates the need for plasma separation and simplifies the PET procedure (Hatazawa et al, 1995; Shidahara et al, 2002). However, as this method depends on intersubject variation of the arterial 15O2 TAC (which yields a bias in the CMRO2 in DARG), its validity requires further evaluation in human studies.
Although the present study provided images of relatively good quality, image quality depends on many different factors, such as the interval, (relative) dose, and order of the two administered tracers. Given a shorter interval time between tracer administrations, a larger amount of residual radioactivity from the first tracer remains during the image acquisition for the second tracer, degrading the quality of the image calculated during the second phase of the procedure. We fixed the time interval to 3 mins in the present study based on preliminary simulations (Iida et al, 2002), which suggested that images of an equivalent quality to three-step ARG could be obtained if the time interval was at least 3 mins. The deteriorated image quality because of the second tracer can be compensated for if the amount of the second tracer is increased, so long as there are no mitigating factors such as scatter, random coincidence, and event loss because of dead time. The effects on image quality resulting from the alteration of dosage parameters are complex, and parameter changes may interact in ways that interfere with each other. From a practical point of view, the reliability of specific parameters may be limited by properties of each tracer that depend on the labelling efficiency of H215O synthesis, and can differ between supply facilities, as well as the distance and flow rate from the synthesizer to the PET scanner. Further studies are required to optimize these parameters to maximize image quality when applying this method to human studies.
In conclusion, although several issues remain to be investigated, this study shows the feasibility of rapid and simultaneous measurement of CBF and CMRO2 using a single PET scan and the sequential administration of two tracers. Both experimental and simulation studies show that the DARG method provides reasonable accuracy for quantitative values of CBF, OEF, and CMRO2, and that the quality of the images produced was comparable to that of three-step ARG. The present study suggests that this method may be applicable to the estimation of CBF and CMRO2 in humans, particularly in acute to subacute ischemic patients or in the multiple assessment of CBF/CMRO2 at different physiologic conditions.
Footnotes
Acknowledgements
The authors gratefully acknowledge Mr N Ejima for providing the operating cyclotron and daily maintenance of the CTI ECAT HR, and would also like to thank the staff of the Department of Investigative Radiology, Research Institute, National Cardiovascular Center.