
Abstract
We describe an approach to measure changes in intracellular calcium along with changes in blood volume and oxygenation directly from the exposed rat cortex in vivo during cerebral ischemia and reperfusion. Measurements were made using a catheter-based optical system. The endface of a Y-shaped bifurcated fiber optic bundle was mounted on the cortical surface. It delivered the light at three wavelengths of 548, 555, and 572 nm to the brain through a fast monochromator coupled to a xenon lamp, and collected the calcium-dependent fluorescence emission from Rhod2 at 589 nm (excited at 548 nm) along with the diffuse reflections at the wavelengths of 555 and 572 nm to determine the changes in blood volume and hemoglobin oxygenation. The feasibility of this approach was experimentally examined by inducing transient cerebral ischemia and reperfusion in the rat. The ischemia induced an 8.5%±1.7% fluorescence increase compared with the preischemic control values. Blood volume and tissue hemoglobin oxygenation decreased by 57.4%±12.6% and 47.3%±12.5%, respectively. All signals normalized on reperfusion. The ischemia-induced change in Rhod2-Ca2+ fluorescence was blocked using a calcium channel blocker, nimodipine, confirming that intracellular changes in calcium were responsible for the fluorescence changes. Thus, changes in cerebral hemodynamics and intracellular calcium concentration changes were measured simultaneously, facilitating future studies of the interrelationship between neuronal activation and metabolic and vascular processes in normal and diseased brain.
Keywords
Introduction
Measurement of hemodynamic changes associated with brain activity using magnetic resonance imaging (MRI) (Kwong et al, 1992; Menon et al, 1992; Ogawa et al, 1992, 1993; Williams et al, 1992) and diffuse optical tomography (DOT) (Culver et al, 2003; Devor et al, 2003) has made important contributions to the understanding of brain function. However, the relationships between changes in blood flow (and blood volume), hemoglobin oxygenation, and neural activity are complex and only partly understood (Logothetis et al, 1999; Raichle et al, 2001).
Calcium changes are involved in many cellular processes including secretion, contraction, excitability, and neuronal plasticity (Helmchen, 1999; Wang and Augustine, 1999). Depolarization of neurons increases the intracellular calcium concentration because of neurotransmitter release and opening of calcium channels (Nichollis et al, 1992). In excitable cells, calcium fluxes are closely linked to electrical activity (Helmchen and Waters, 2002). Thus, measurements of intracellular calcium directly track neuronal electrical activity and in vitro studies on single cells (Duchen, 1992; Miyata et al, 1994; Takahashi et al, 1993) and brain slice preparations (Kudo et al, 1992; Kann et al, 2003) have confirmed this. Two-photon microscopy has also been used to monitor calcium changes in superficial brain regions in vivo (Helmchen and Waters, 2002). Clearly, it would be advantageous to measure both calcium and hemodynamic responses to brain activation, and extend such recordings to deeper brain structures.
Dual wavelength spectrophotometry has been used to determine blood volume and hemoglobin saturation (StO2) in tissue by measuring oxyhemoglobin and deoxyhemoglobin, which have different optical absorption spectra (Jobsis, 1977; Chance, 1951). However, unlike StO2 calcium cannot be measured directly by means of optics and requires preloading of calcium-sensitive fluorescent dyes, such as fura-2, indo-1, or Rhod2. These dyes are cell membrane-permeable acetoxymethyl esters that when hydrolyzed by intracellular esterases become membrane-impermeable calcium-binding indicators (Haugland, 2003).
We recently developed a quantitative fluorescence technique to detect calcium transients from the beating heart using the calcium indicator Rhod2 (del Nido et al, 1998; Du et al, 2001; MacGowan et al, 2001a). Rhod2 has several advantages over other fluorescence dyes, including: (1) relatively long excitation and emission wavelengths that reduce the filtering of light by the tissue; (2) reduced contribution of autofluorescence, and (3) a larger dynamic range in fluorescence when complexed with calcium. Importantly, Rhod2 is the only calcium indicator that undergoes rapid hydrolysis to the free acid form in the perfused heart preparation (Scaduto and Grotyohann, 2003). This feature avoids inconsistent parent ester accumulation and consequent inaccuracies when calibrating the resulting signal ‘in situ'. Moreover, Rhod2 penetrates more deeply and homogeneously into brain slices and intact whole tissues than other dyes, and causes less fluorescence from damaged cells on the edge of the brain slice (Kudo et al, 1992; Takahashi et al, 1993). A disadvantage of Rhod2 is that calcium binding does not alter excitation or emission spectra. Commonly used ratio techniques to quantify fluorescence can therefore not be used (Haugland, 2003). However, combining fluorescence and absorbance measurements allows quantification (del Nido et al, 1998; Du et al, 2001). Several groups have used this technique to quantitatively study heart dysfunction (MacGowan et al, 2001b; London et al, 2002; Stamm et al, 2003). Other investigators have used Rhod2 in studies of single neurons, brain slices and the brain in vivo (Takahashi et al, 1999; Kudo, 1996; Takita et al, 2004). It is clear from these studies that Rhod2 loads into the cytosolic (del Nido et al, 1998; MacGowan et al, 2001a) as well as mitochondrial compartment (Kann et al, 2003; Scaduto and Grotyohann, 2003), a feature which might complicate quantification and interpretation of Rhod2-Ca2+-sensitive fluorescence changes.
The purpose of the present study was to develop a fiber optic-based approach to measure changes in the concentration and oxidation states of hemoglobin, concurrently with calcium-Rhod2 fluorescence, in the living brain. We show that our approach allows simultaneous estimation of blood volume, hemoglobin oxygenation, and intracellular calcium changes in a rat model of transient ischemia and reperfusion.
MATERIALS AND METHODS
All experimental animal procedures were approved by the Brookhaven National Laboratory (BNL) IACUC. Twelve male Sprague-Dawley rats (n = 12), weighing 250 to 320 g were used; Group 1 rats (n = 8) were exposed to 5 mins of transient cerebral ischemia and 30 mins of recirculation; Group 2 rats (n = 4) were treated with the calcium channel blocker nimodipine (2 mg/kg) before exposure to the ischemic insult.
Surgical Preparation, Rhod2/AM Administration and Transient Ischemia
Animal preparation: Animals were intubated and mechanically ventilated (Harvard Apparatus, Inspira asv, Holliston, MA, USA) and anesthesia was induced with 3% isoflurane. Anesthesia was maintained with 1.5% to 2% isoflurane in a 60% to 70% oxygen gas/air mixture. The right carotid artery was cannulated for continuous arterial blood pressure monitoring and the left carotid artery was isolated by a 3.0 suture. In Group 2 rats, the left femoral vein was catheterized for administration of nimodipine. The anesthetized rat was then positioned in a stereotaxic frame (Kopf, Frame no. 9) and a 3-mm left craniotomy was made above the area of sensorimotor cortex; the dura mater was gently pieced and removed exposing the cortical surface. Pulse oximetry (SpO2), intraarterial blood pressure (Dash 2000, GE, Milwaukee, WI, USA), heart rate, ECG, and body temperature (Module 224002, Small Animal Instr. Inc., Stony Brook, NY, USA) were continuously monitored.
Rhod2 loading: In all, 50 μg of the fluorescence calcium indicator Rhod2 acetoxymethyl ester (Rhod2/AM) (Molecular Probes, R-1243, Eugene, OR, USA) was dissolved in 2 μL dimethylsulfoxide (DMSO) and 440 μL distilled water at room temperature. A 30-G needle attached to a stereotaxic micromanipulator was inserted into the cortex (1.2. to 1.5 mm below the surface) at an angle of ~45° to the surface of the cortex. The Rhod2 solution was infused into the brain at a perfusion flow rate of 3 μL/mins using a microinjection pump (Microinjection Pump, CMA/100, Carnegie Medicine, Stockholm, Sweden). A total volume of 100-μL of the Rhod2 solution was infused. Following Rhod2 loading, the optical probe was positioned onto the exposed cortex area and baseline recordings were made for 60 to 80 mins.
Cerebral ischemia and reperfusion: Transient forebrain ischemia was induced for 5 mins by concurrently occluding the left carotid artery and rapidly withdrawing blood from the arterial line. During the ischemic period, the mean arterial blood pressure was maintained at 35 to 43 mm Hg. At the conclusion of the 5-mins ischemic insult, reperfusion was achieved by relieving the carotid occlusion and rapidly transfusing the collected blood.
Nimodipine administration: In Group 2 rats, before cerebral ischemia induction an intravenous infusion of nimodipine was initiated slowly (~0.01 mL/mins) for a total dose of 2 mg/kg with careful attention to arterial blood pressure and heart rate changes during the infusion period (Gomi et al, 2004).
Optical instrument
Photospectrometry Instrument: Figure 1 shows a block diagram of the photospectrometry instrument. Briefly, it consisted of a 150-W xenon lamp, a fast excitation monochromator (Mono-Ex), and the photo-counting detectors for fluorescence (PMT-F) and diffuse reflectance (PMT-A). The lamp was connected to the computer-controlled monochromator to select the incident lights of 548, 555, and 572 nm by time-sharing to sequentially deliver the selected lights onto the brain surface through one arm of a Y-shaped bifurcated fiber optic bundle. The fluorescence and the diffuse reflection reemitted from the brain tissue were collected by the fiber optic tip of the common leg and transferred through the outgoing leg of the bundle. After passing through a beam splitter, 5% of the signal intensity is reflected by a dichroic cube for diffuse photon detection by PMT-A, whereas 95% is delivered to PMT-F for fluorescence detection. A bandpass filter (BPF) centered at 589 nm with 10 nm bandwidth is placed in font of the PMT-F to define the fluorescence emission at 589 nm. A filter cube in front of PMT-F was synchronized with the monochromator to pass the fluorescence emission through while excited at 548 nm but block the incident light at 555 and 572 nm. The scattered reemission (i.e., diffuse reflection) at 548, 555, and 572 nm from the brain tissue were detected by PMT-A. The signals were digitized and stored in a personal computer for data processing.
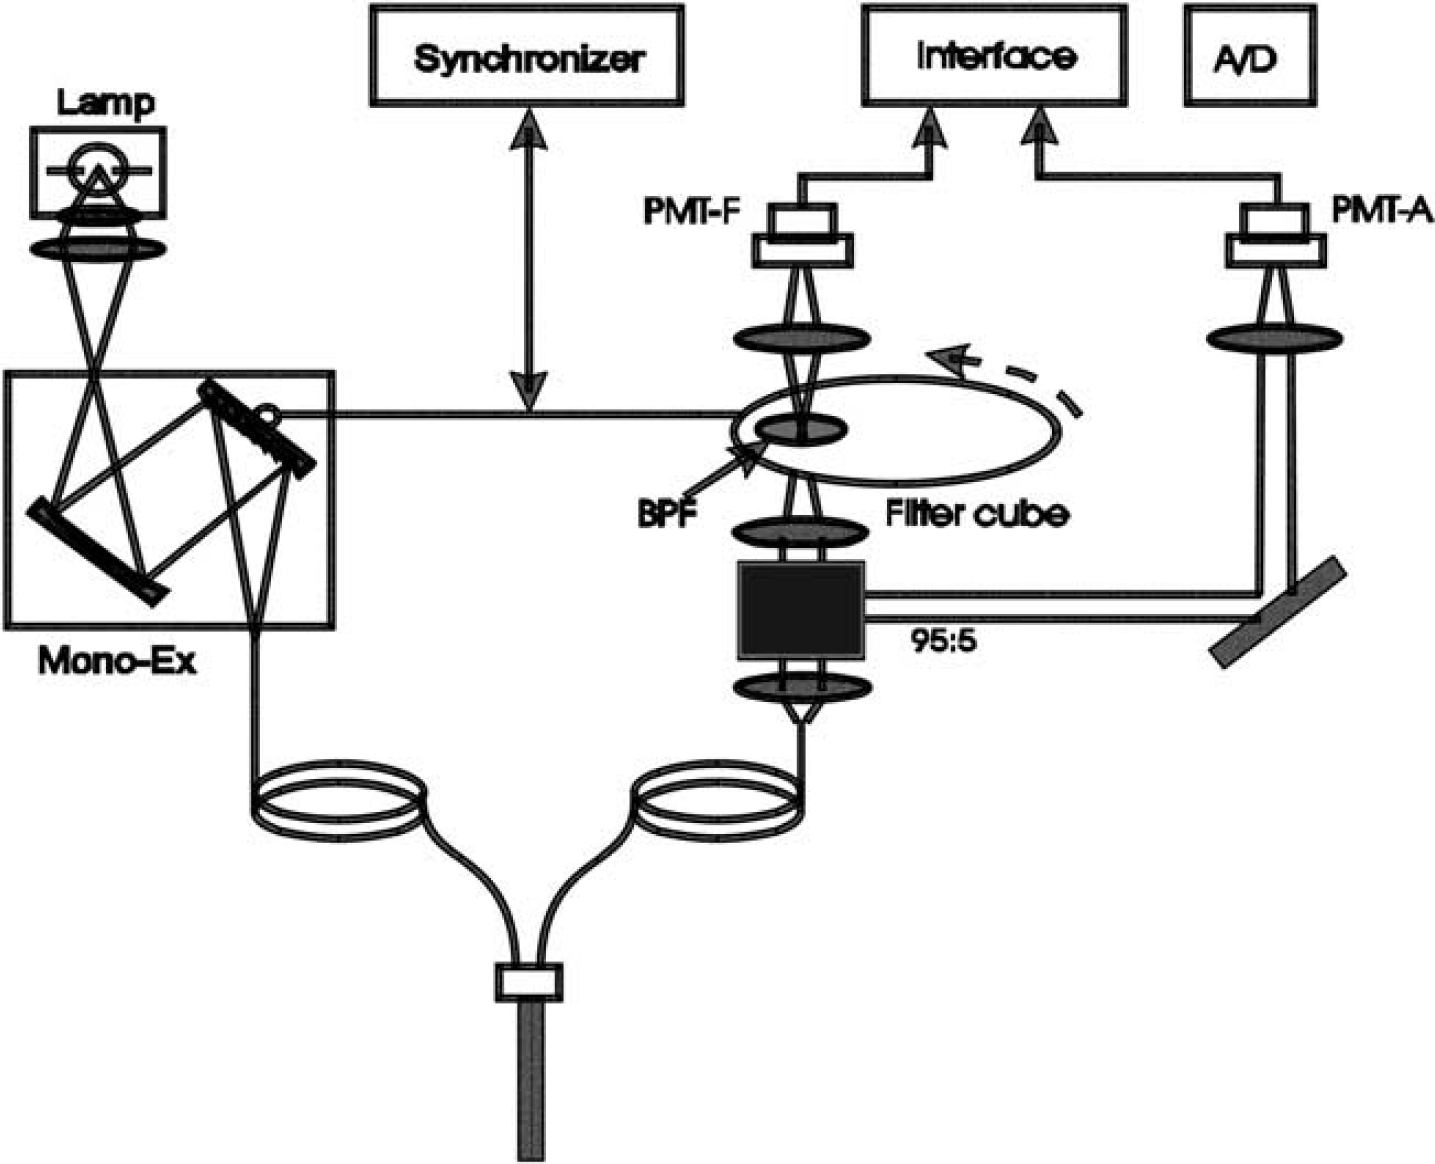
Diagram of instrumentation used for the detection of changes in Rhod2 fluorescence signal, blood volume, and cerebral oxygenation from the surface of the rat cortex.
Data Acquisition and Analysis
Data Acquisition: To detect the calcium fluorescence and diffuse reflection from the brain, the optical fiber tip was placed in contact with the cortical surface. The interface between the fiber optics and the exposed brain surface was filled with a gel (Surgical Lubricant Sterile Bacteriostatic) to reduce the mismatch in refractive index between optical fiber, air, and brain tissue; thus, minimizing the interface specular reflection from the surface of the brain. The Rhod2 excitation spectrum was acquired at 589 nm before Rhod2 loading using the photon detector PMT-F. Simultaneously, the reflectance spectrum from 420 to 570 nm was detected by the PMT-A.
After ~30 mins for Rhod2 loading and ~60 mins for Rhod2 hydrolysis, time traces were recorded for both fluorescence (excited at 548 nm and emitted at 589 nm) and the diffuse reflectance at multiple wavelengths (548, 555, and 572 nm). The excitation and diffuse reflectance spectra were measured periodically. In Group 2 rats, the recording included the period of nimodipine infusion before ischemia and reperfusion. During ischemia and reperfusion, the fluorescence and the diffuse reflectance were acquired continuously; 15 mins after reperfusion, the reflectance spectrum was taken for comparison with that acquired before the ischemia.
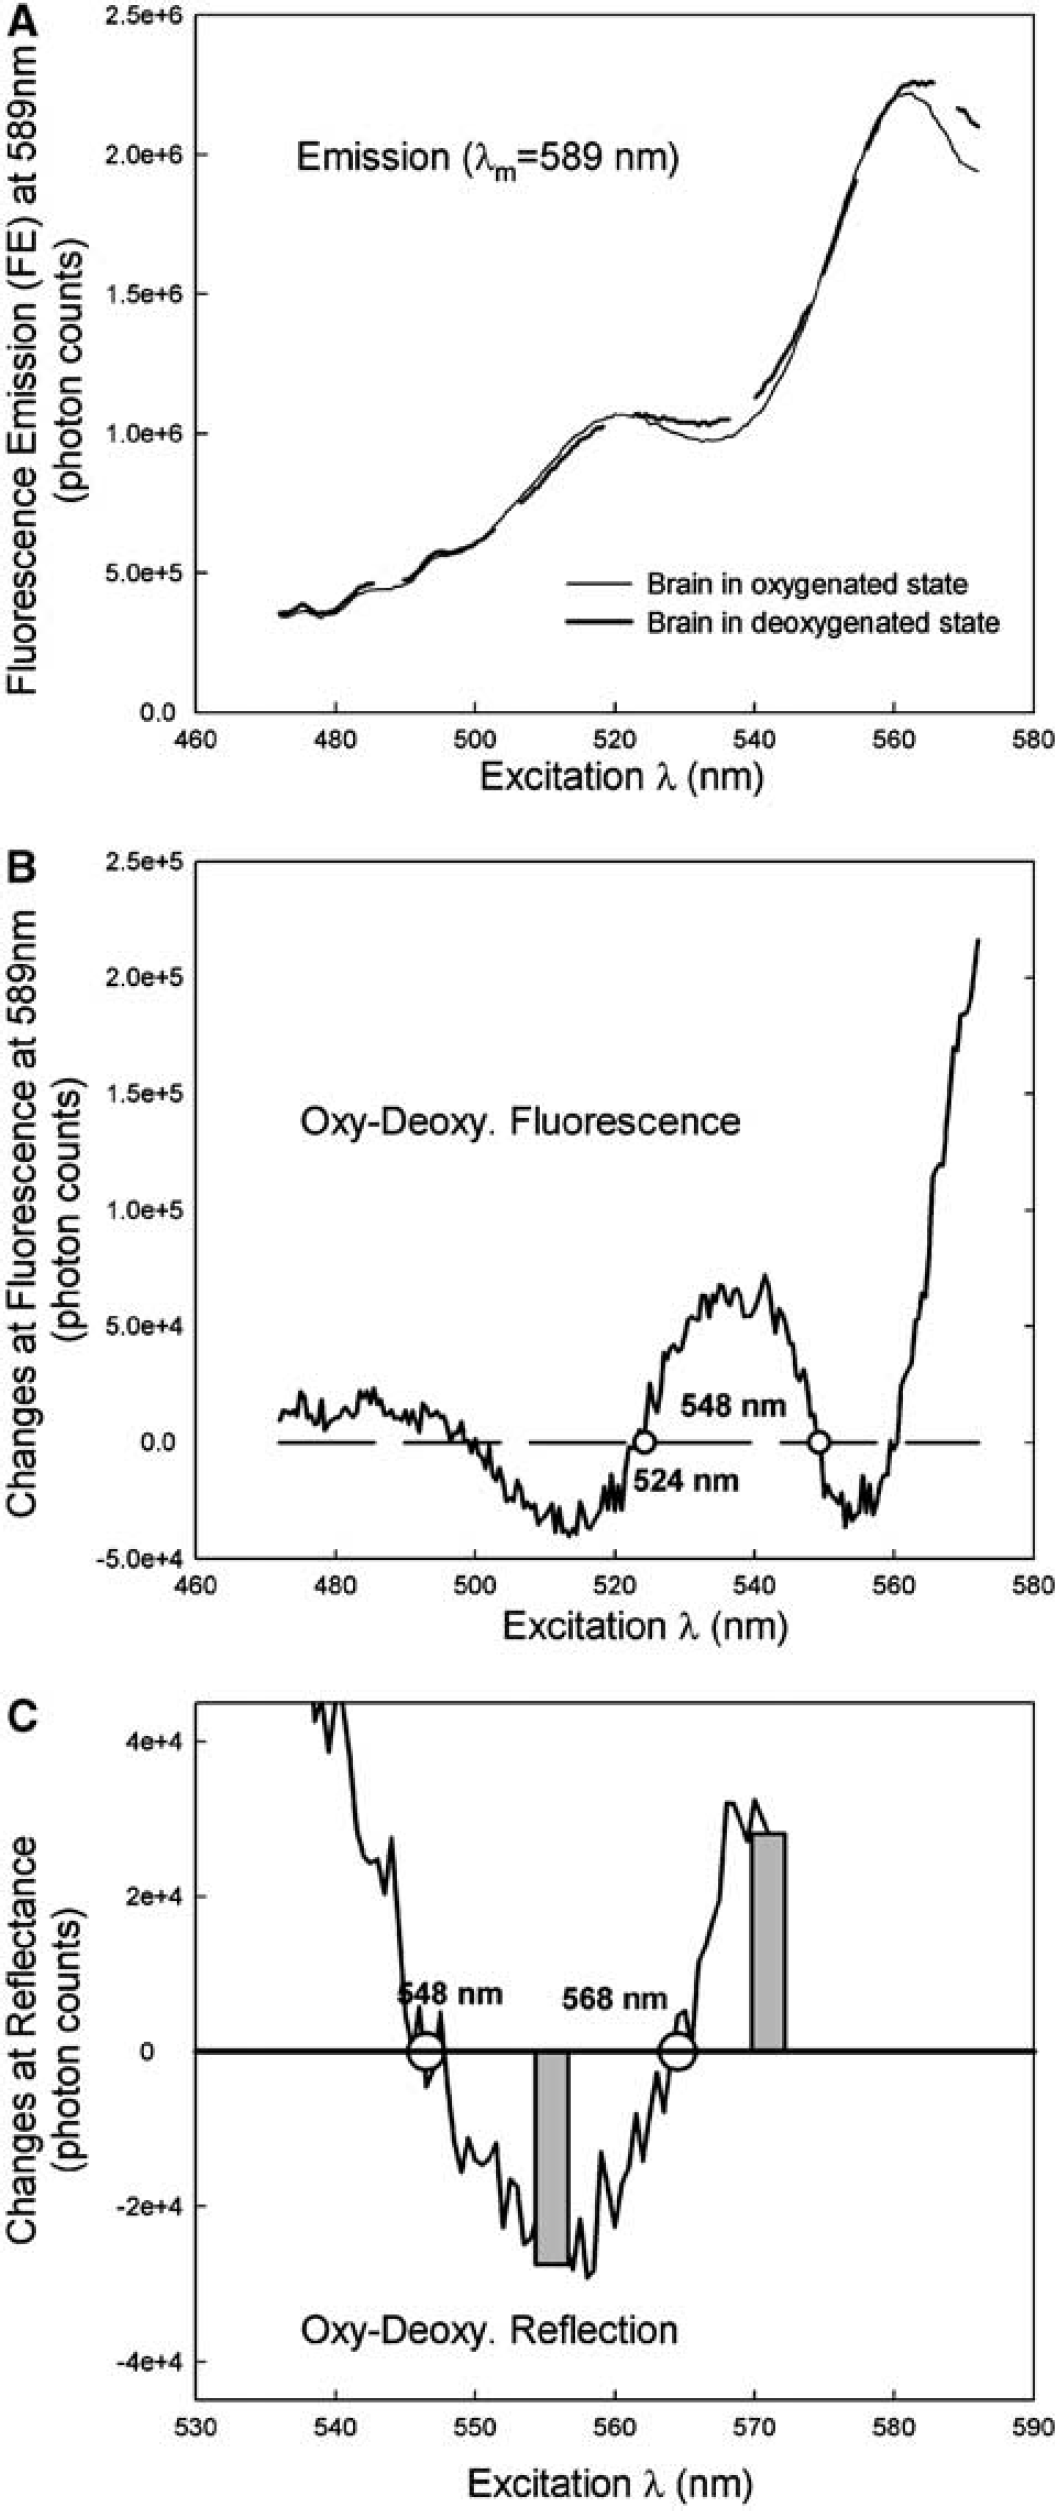
Minimization of physiologic interference on the fluorescence calcium signal: To minimize interference, particularly the variation of the oxygenation state with the fluorescence signal, we used the isosbestic wavelengths of the tissue oxygenation for fluorescence excitation and emission. At these wavelengths, the tissue's optical absorption is independent of the changes in tissue oxygenation. As has been explored previously (Haugland, 2003; Du et al, 2001), the isobestic wavelength at either 524 or 548 nm is within the absorption band of Rhod2 and can therefore be applied for Rhod2 excitation. Another isobestic wavelength at 589 nm, also within the Rhod2 emission band, can be used for the Rhod2 Ca2+-dependent fluorescence emission. Figure 2A shows the Rhod2 fluorescence excitation spectra detected at an emission wavelength of 589 nm obtained from the brain cortex at varying oxygenation states ranging from normoxic to hypoxic. Figure 2B further shows the differential spectrum between the spectra shown in Figure 2A and authenticates the presence of the isobestic Rhod2 excitation wavelengths at 524 and 548 nm in the rat brain in vivo. Importantly, Figure 2A also shows that the fluorescence emission at 589 nm is higher when excited at 548 nm than at 524 nm; thus indicating that 548 nm is a more effective excitation wavelength in regards to increasing overall signal-to-noise ratio for Rhod2-Ca2+ fluorescence detection in the brain.
(
The diffuse reflectance at 548 nm was simultaneously recorded by the detector PMT-A along with the fluorescence detection at 589 nm by the detector PMT-F. The diffuse reflectance signal is needed to correct for potential alterations in tissue optical properties because of local changes of blood volume (affecting tissue absorption) during ischemia/reperfusion, and/or possible cell swelling (affecting tissue scattering), similar to the interference of physiologic parameters on the fluorescence emission. Therefore, the diffuse reflectance at 548 nm has been used as a ‘reference beam’ to eliminate the influence of the changes in blood volume on the fluorescence signal by taking the ratio of fluorescence at 589 nm over the reflectance at 548 nm as previously described (Wu et al, 1993; Ramanujam et al, 2001; Du et al, 2001).
Determination of the changes in blood volume and oxygenation using diffuse reflectance measurements at two wavelengths: The concepts underlying these experiments to determine the hemoglobin concentration and oxygenation have been described previously (Chance, 1951; Cope and Delpy, 1988; Baos et al, 2002). The detailed optical model is described in Appendix A. In summary, our strategy was to use a pair of ‘symmetric’ wavelengths, at 555 and 572 nm as shown in Figure 2C, that have identical but opposite amplitude responses corresponding to the oxygenation changes in the tissue. The summation of the optical intensity of the absorbance signals between these two wavelengths reflect the changes in blood volume, that is, Δ[BV] in Equation (A.7) whereas the subtraction of these signals represents the changes in hemoglobin oxygenation, that is, Δ[HBO2] in Equation (A.8).
RESULTS
Spectra of Ca2+-dependent Fluorescence and Diffuse Reflection Obtained from the Cortex of the Rat Brain
Figure 3 shows the excitation spectra of the Ca2+-dependent fluorescence emission of Rhod2 (at 589 nm) obtained from the rat cortex before and after loading of Rhod2 into the brain. The background fluorescence emission before loading Rhod2 (dashed line) was very low whereas the Rhod2 fluorescence after Rhod2 loading (solid- line) was clearly detectable. Loading of Rhod2 results in a 6.6±0.3-fold increase (n = 12) in fluorescence detected at 589 nm over background at the end of the ~60 mins waiting period. The subtraction between the spectra before and after Rhod2 loading (solid line) does not significantly decrease the amplitude of the spectrum, further indicating that the interference of tissue autofluorescence on Rhod2-Ca2+ emission was negligible. In the brain, Rhod2 exhibits higher fluorescence emission excited at 548 nm than at 524 nm as mentioned previously, because of tissue absorbance properties at 548 nm (Figure 4).
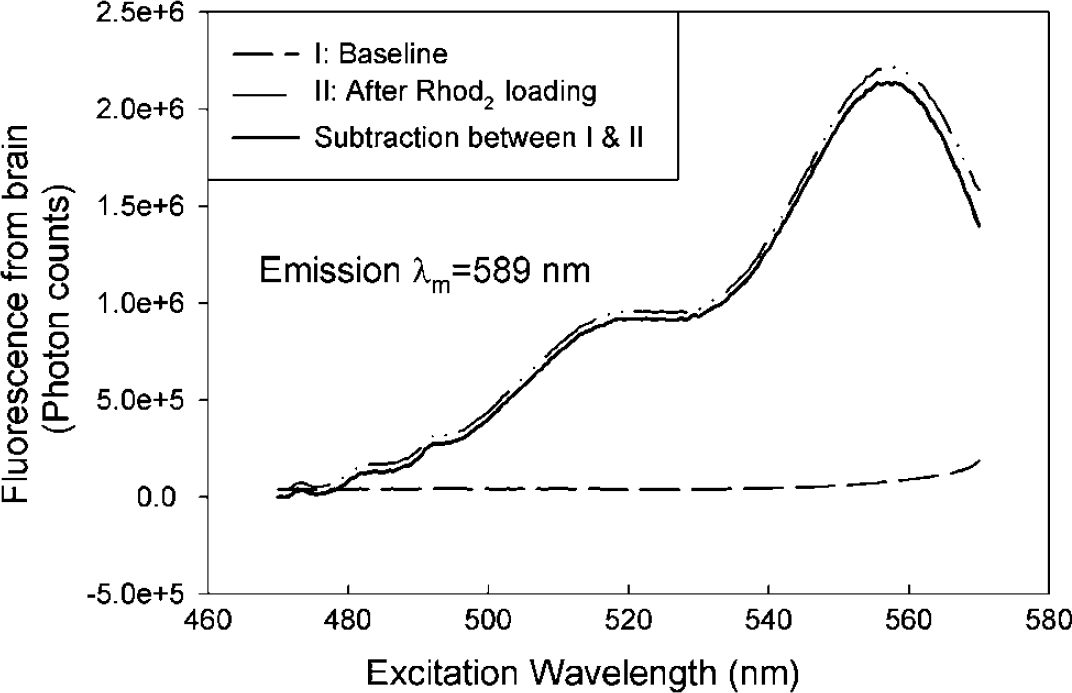
Excitation spectra obtained from the rat brain cortex in baseline before Rhod2 loading (dash line) and after Rhod2 loading (solid-dash line). The subtraction between the baseline and after Rhod2 loading is shown as a solid line, indicating the tissue autofluorescence is negligible compared to the Rhod2 fluorescence.
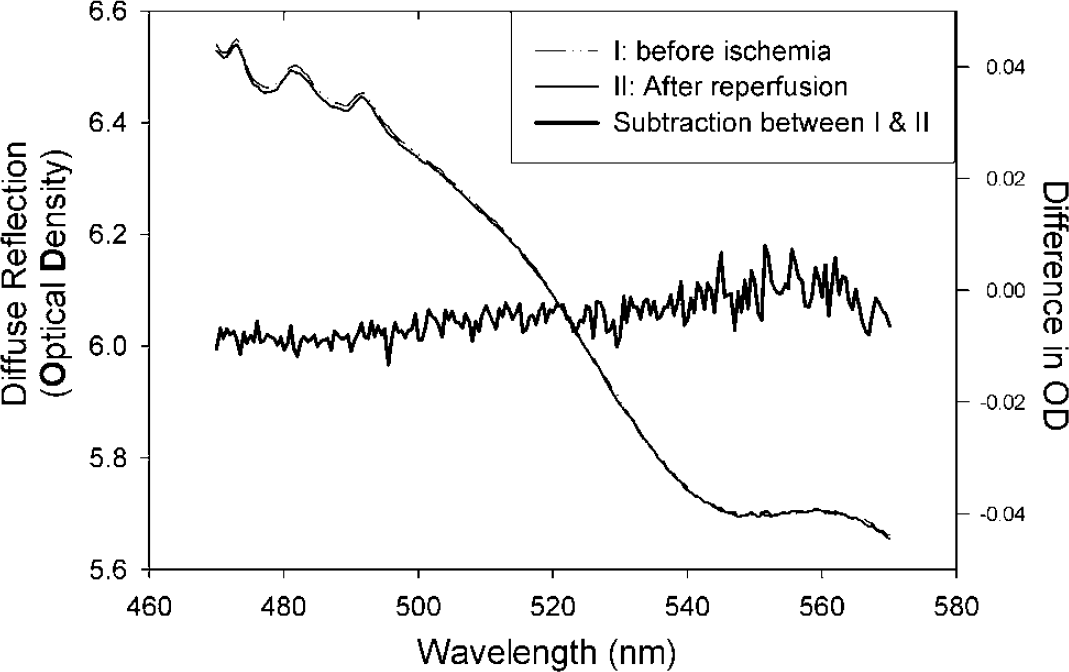
Comparison of the diffuse reflectance obtained from the brain before ischemia and after reperfusion (light solid line). The subtraction (dark solid line) of the curves between control and reperfusion shows no significant difference, thus suggesting there is no global tissue damage or physiologic difference that may be induced by ischemia insult.
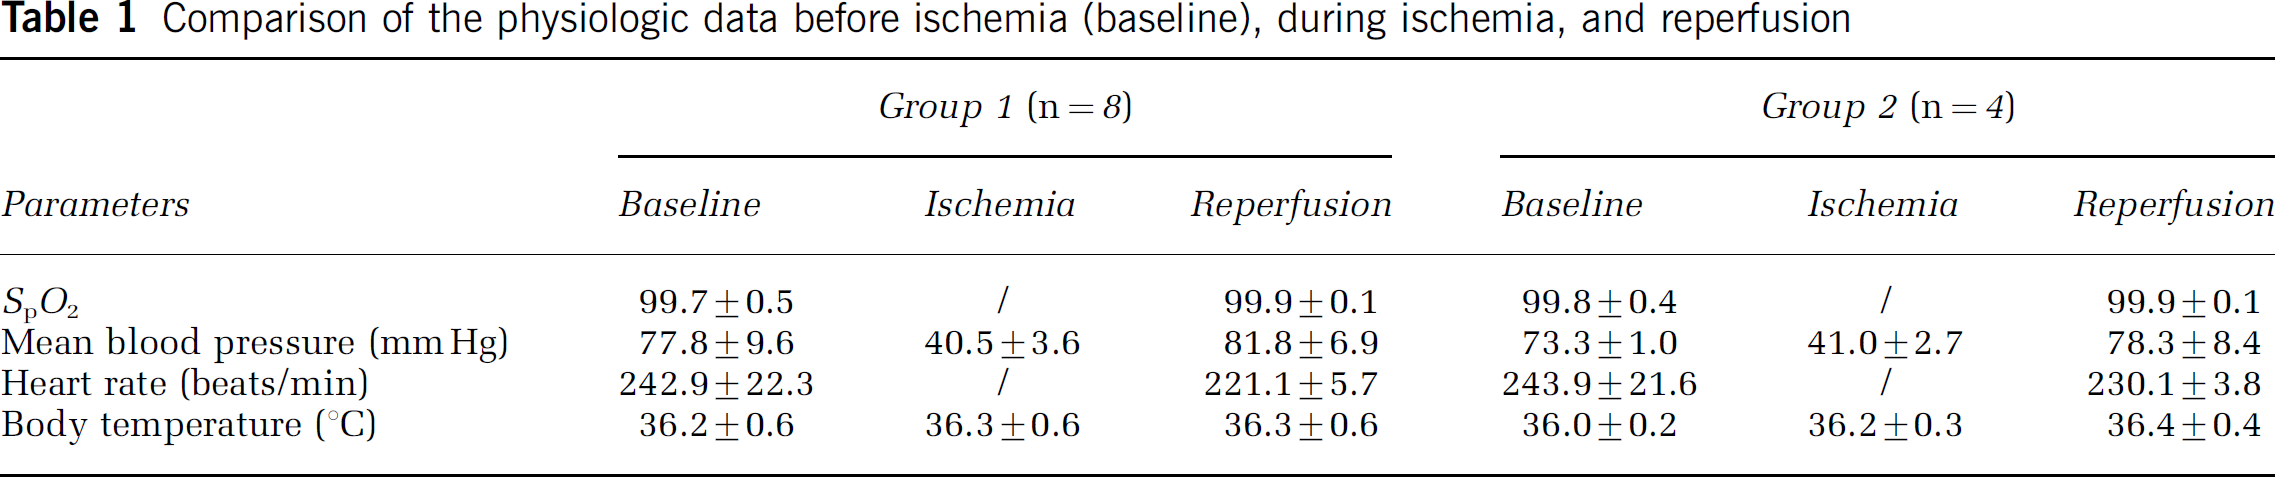
Figure 4 shows the diffuse reflectance spectra before ischemia (solid-dashed line) and after reperfusion (light solid line) obtained from the same rat brain cortex. There was no significant difference over the whole spectral wavelength range (dark solid line), indicating that the ischemia does not cause permanent changes in optical properties (i.e., absorption and scattering) associated with tissue damage; thus, demonstrating that the ischemic insult was reversible. The recorded physiologic data summarized in Table 1 shows that there were no significant changes in systemic physiologic parameters (SpO2, mean blood pressure, heart rate, and body temperature) before ischemia and during reperfusion.
Comparison of the physiologic data before ischemia (baseline), during ischemia, and reperfusion
Diffuse Reflection and Fluorescence as a Function of Time
An example of the Ca2+-dependent fluorescence detected using Rhod2 as a function of time before, during, and after ischemia is shown in Figure 5A; the simultaneous measurements of the diffuse reflection at multiple wavelengths obtained from rat cortex are shown in Figure 5B. Ischemia was induced at ~60-mins after Rhod2 loading. Immediately after occlusion of the cerebral circulation, the fluorescence emission intensity (at 589 nm) increased (Figure 5A), both because of (1) elevation in intracellular calcium, and (2) less attenuation of the fluorescence photons due to the ischemia-induced decrease in the hemoglobin concentration. Concurrently, diffuse reflection at 548, 555, and 572 nm was also increased in intensity; this is directly because of the blood volume decrease caused by ischemia. Upon reperfusion, all signals recovered gradually to control levels, indicating recovery of local cerebral blood volume.
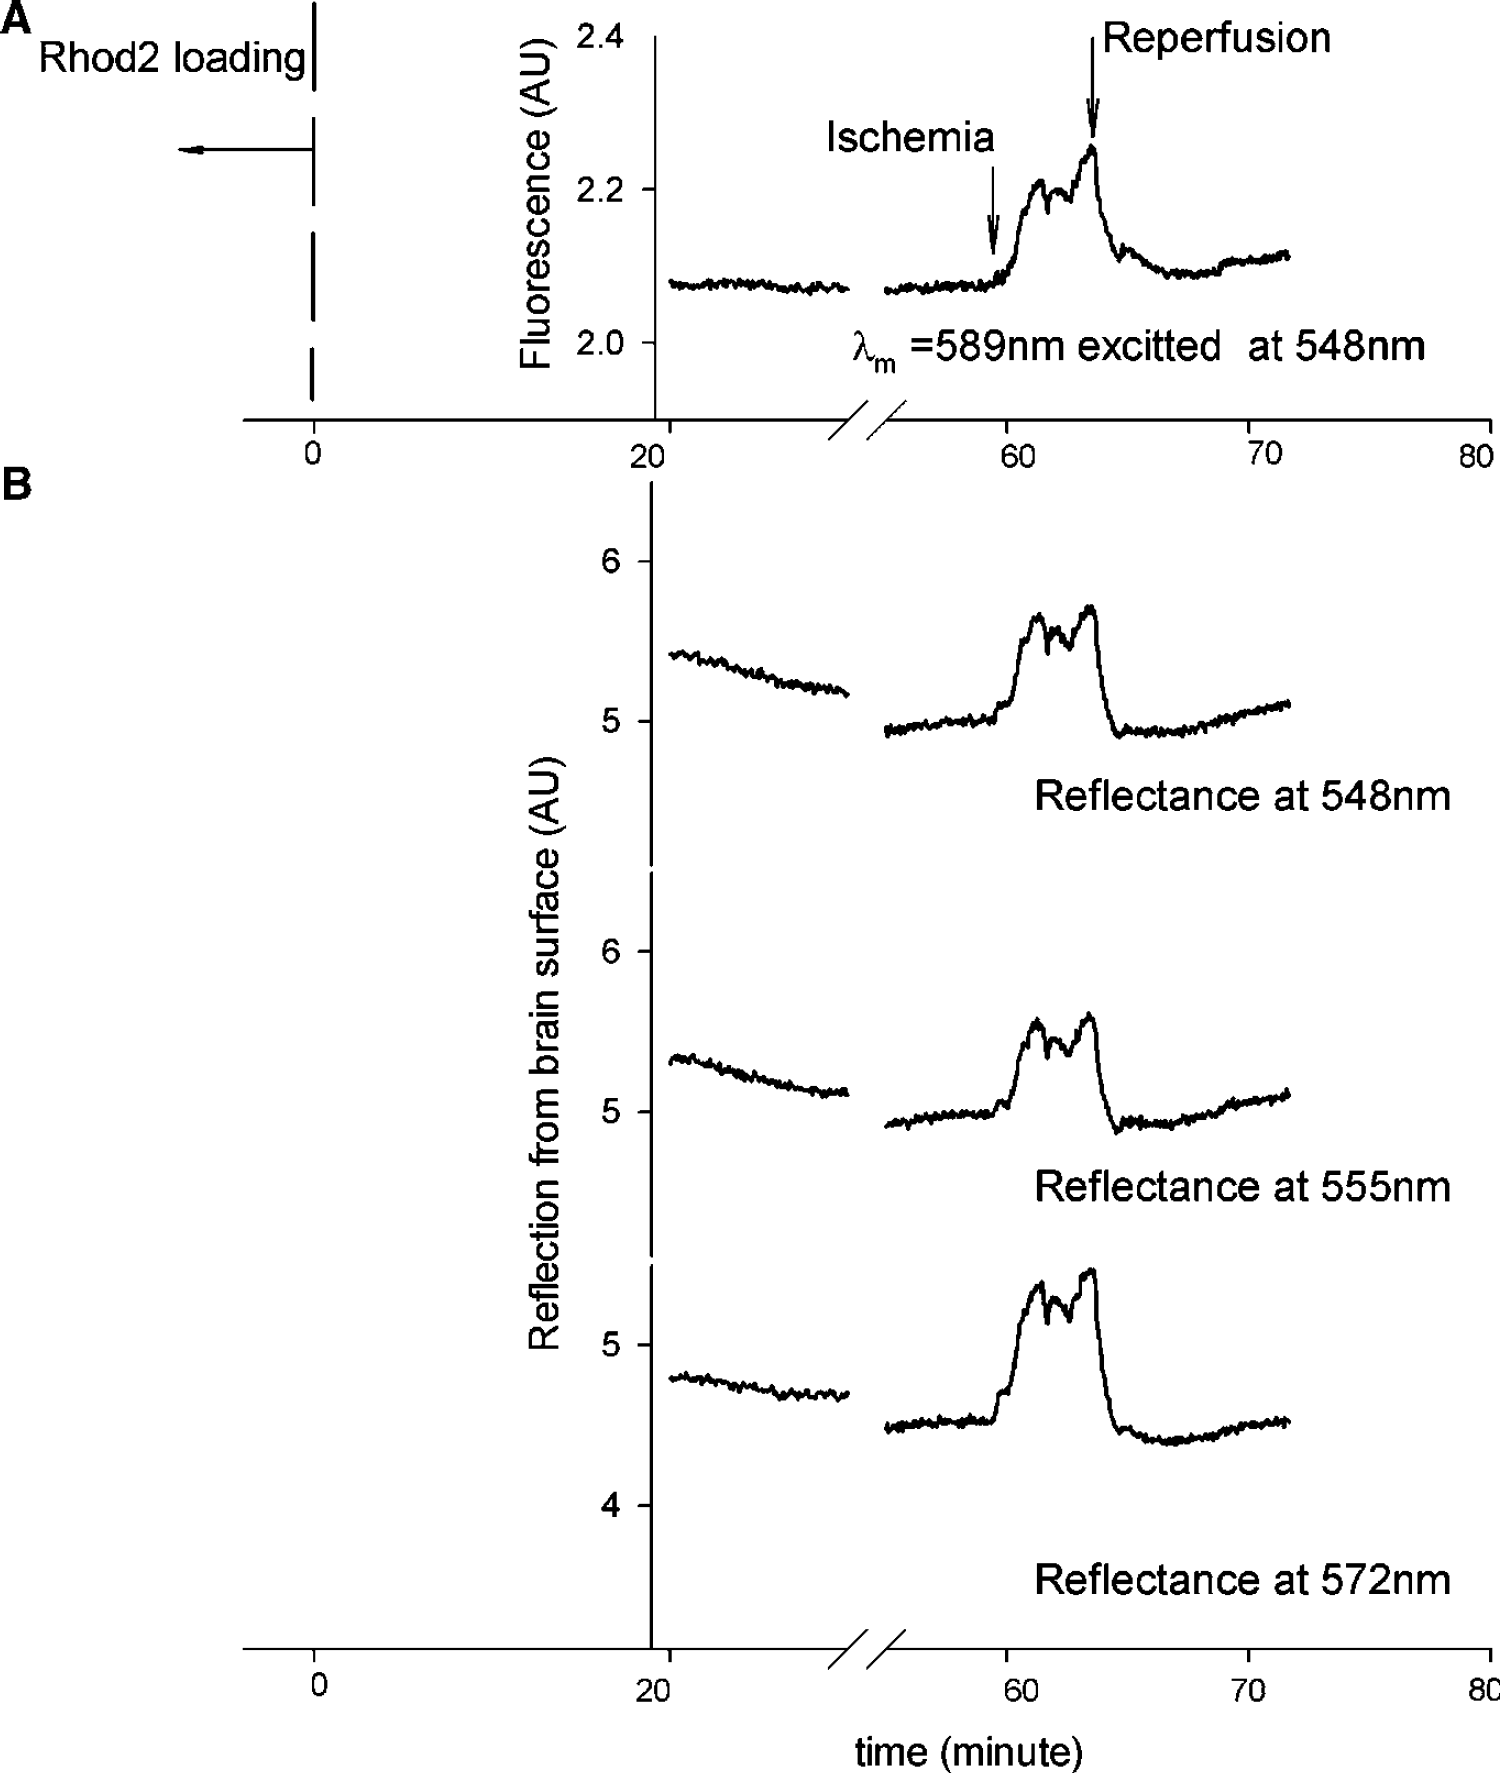
Example of time traces of (
As previously discussed, the reflectance signal at 548 nm (an isobestic wavelength) is sensitive to the change in blood volume but not to changes in the oxygenation state of tissue hemoglobin. However, the reflectance at 555 and 572 nm is sensitive to both changes in blood volume and oxygenation. As shown in Figure 2C, the amplitude response to oxygenation changes at wavelengths 555 and 572 nm were opposite (one decreases while the other increases) and the total increase of diffuse reflection at 555 nm appears smaller than that at 548 nm, whereas the increase at 572 nm is larger than that at 548 nm. In other words, the reflection increases at 555 and 572 nm represented the blood volume decrease induced by ischemia, and the magnitude difference between these two signals indicate the modulation of the tissue hemoglobin oxygenation change on the signals, which can be used to extract the tissue oxygenation information. These data demonstrate that both blood volume and hemoglobin oxygenation can be determined using these two specific wavelengths.
Changes in Ca2+-Dependent Fluorescence, Blood Volume, and Cerebral Oxygenation
Figure 6 summarizes the mean changes (n = 8) in blood volume, cerebral hemoglobin oxygenation, and Rhod2-Ca2+ fluorescence as a function of time. The first decay point of blood volume was defined as the ‘true’ initiation of ischemia and used to temporally register all experimental data sets for the statistical analysis. As shown in Figures 6A and 9, ischemia induced a 52.7%±12.5% decrease in blood volume, a corresponding decrease in cerebral oxygenation (42.6%±12.6%), and a Ca2+-fluorescence increase of 8.5%±1.7%. From the time of ischemia it took ~1.9 mins to reach the maximal changes in blood volume, and ~2.1 mins to reach the maximal changes in oxygenation and Ca2+-fluorescence. Furthermore, the time to half maximum change during ischemia (defined as t1/2 shown in Figure 6A) in blood volume and oxygenation was 0.9 and 1.2 mins, respectively, whereas the t1/2 of the fluorescence transient was ~0.98 mins. There appeared to be a small increase in both blood volume and oxygenation, during the ischemia period, whereas the Rhod2-Ca2+ fluorescence levels remained constant. Blood volume, oxygenation, and intracellular calcium all recovered upon reperfusion.
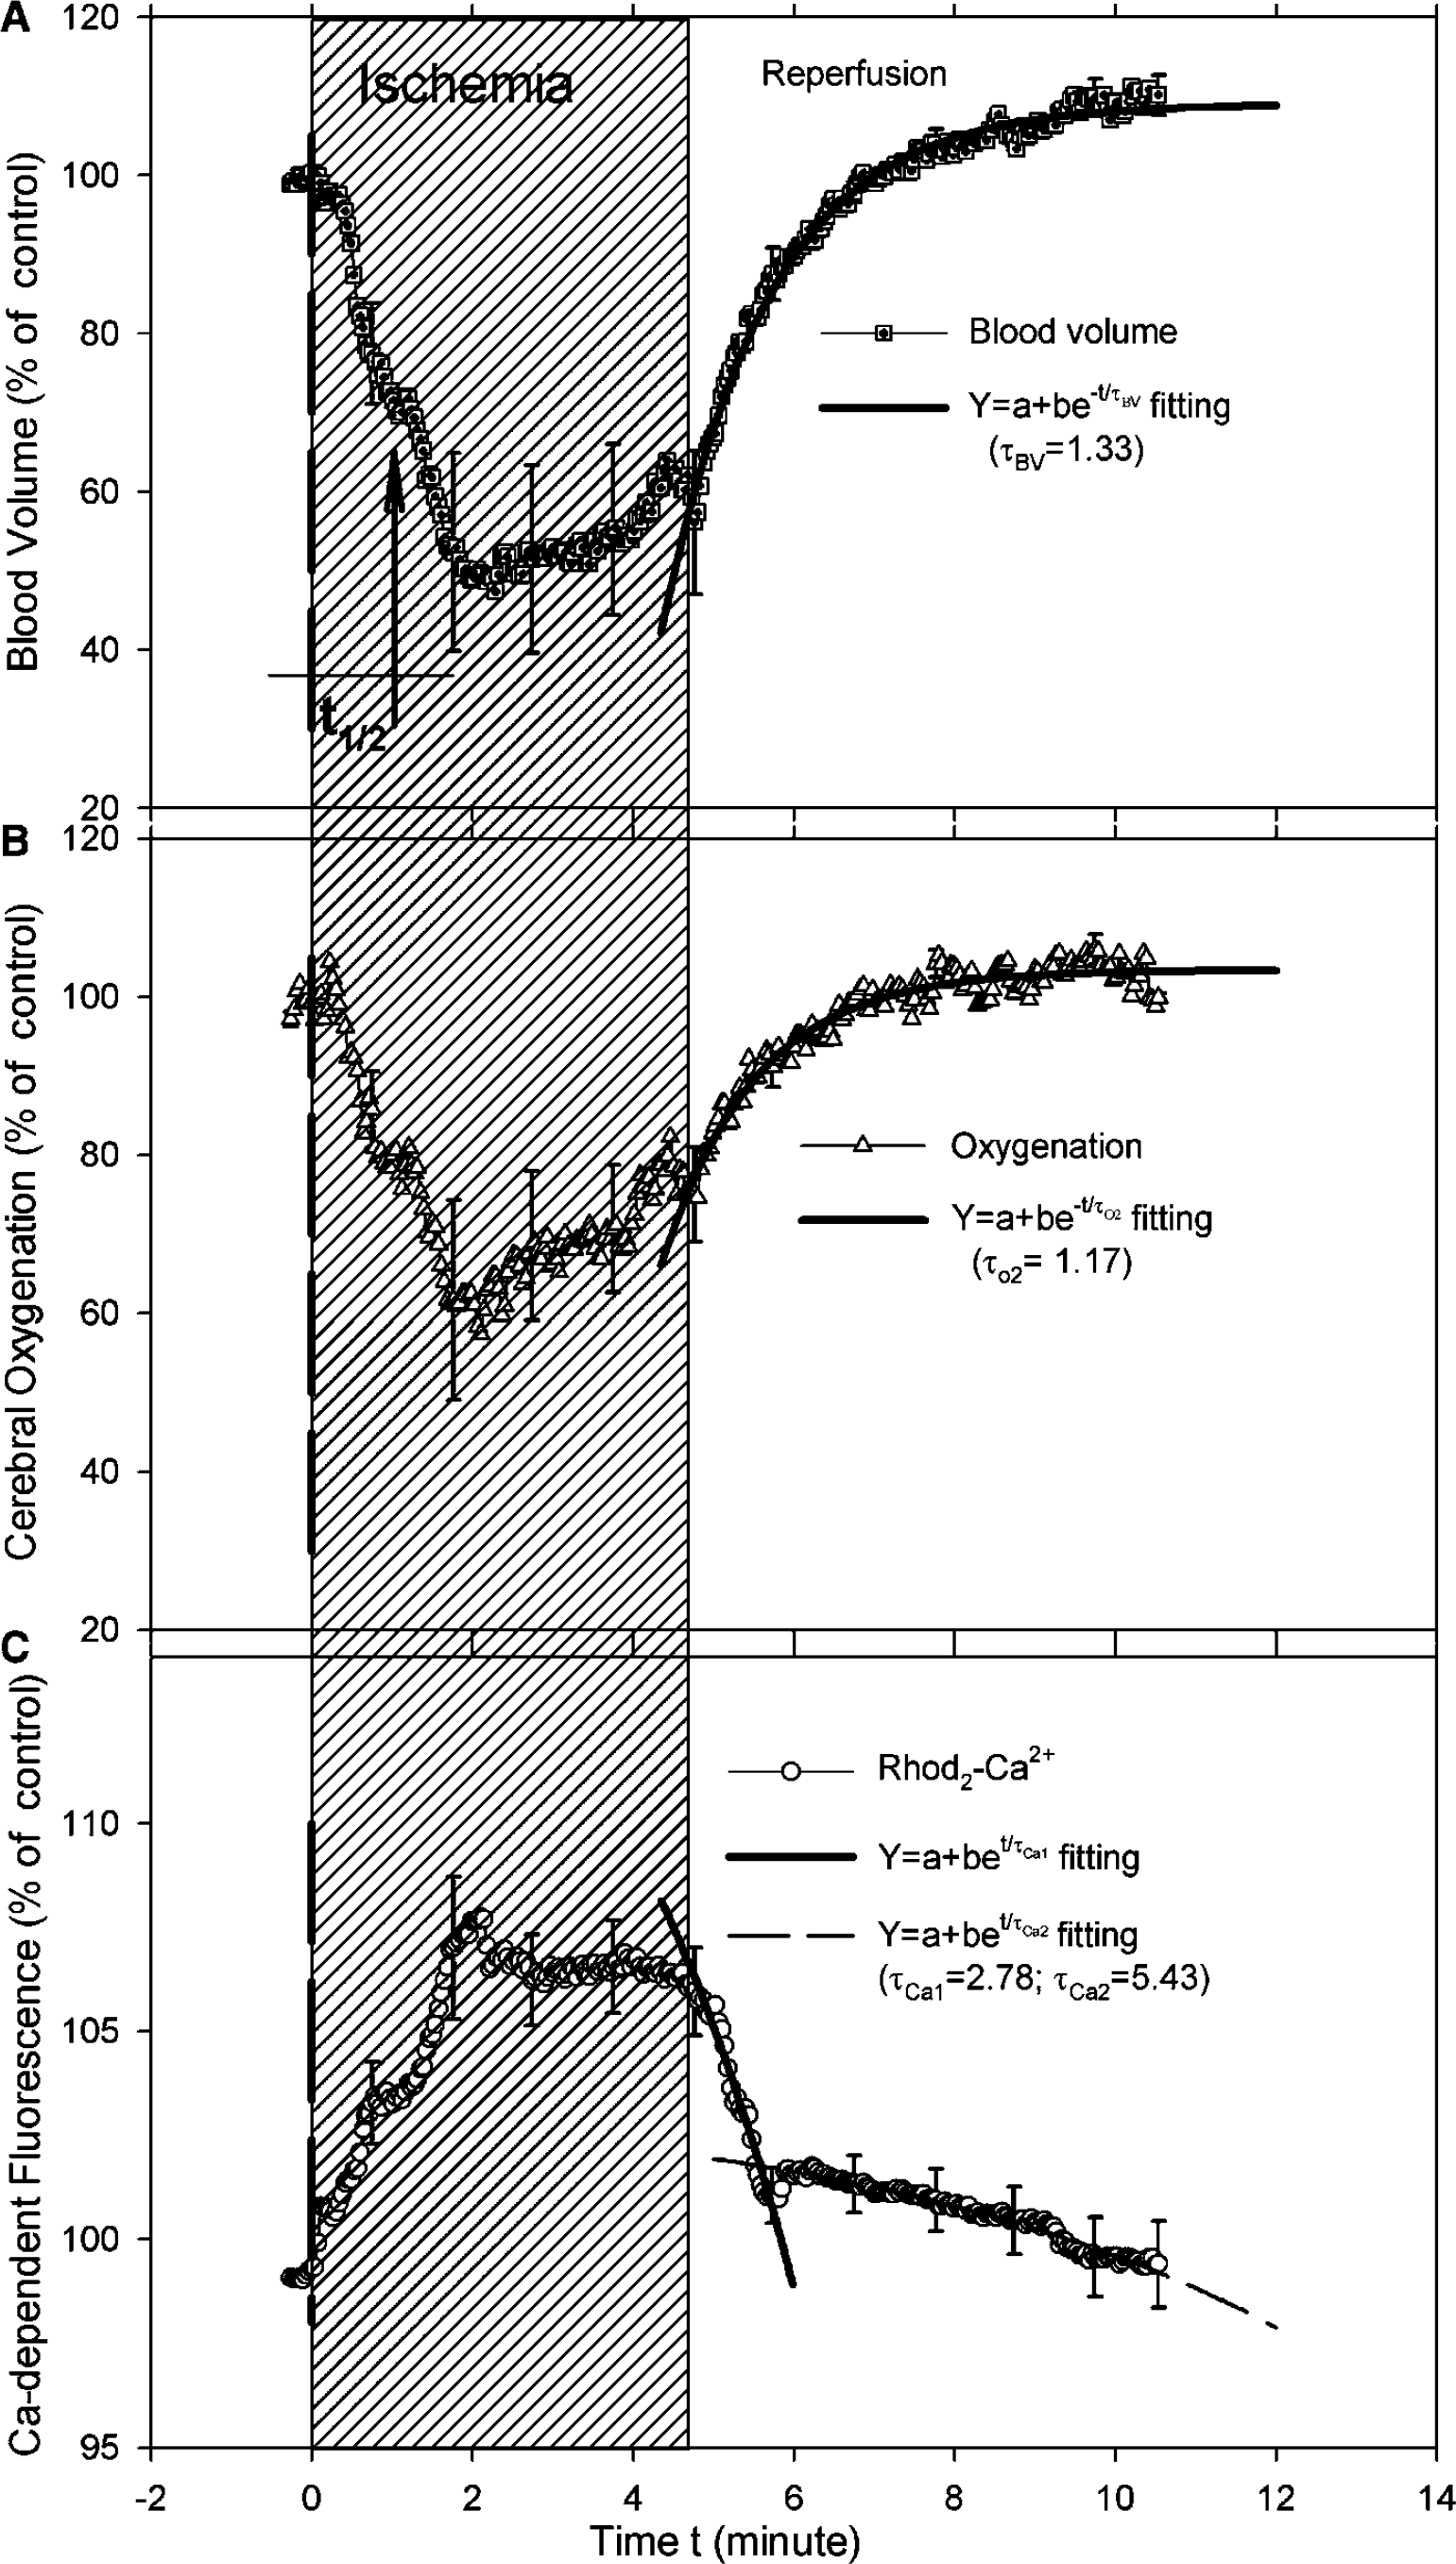
Experimental results of the changes in (
The signals representing oxygenation and intracellular calcium nearly returned to control baseline levels after 10 mins reperfusion while we observed a slight overshoot (hyperemia) in blood volume. To more accurately characterize the time course of the recovery process (reperfusion period), we fitted the recovery period of the mean transients using the exponential functions to determine a recovery time constant τ for each of the parameters. Thus, τ represents the recovery rate and can be used as a comparison parameter between the data sets. For blood volume as well as hemoglobin oxygenation reperfusion changes, an exponential increase fitting (i.e., an equation Y = a + be -t/τ ) was used. For blood volume recovery τBV was 1.33 mins and for hemoglobin oxygenation recovery τ was 1.17 mins. Thus, blood volume recovers faster than hemoglobin oxygenation during reperfusion. In the case of Ca2+-fluorescence recovery, an exponential decrease fitting was applied by using the equation of Y = a + be -t/τ . We observe two time phases in the recovery of the Ca-dependent fluorescence signal during reperfusion: The first recovery phase was about twice as fast as the second recovery phase (τCa1 = 2.78 mins versus τCa2 = 5.43 mins) as shown in Figure 6C. Further, ~61% of the total fluorescence signal was represented by the fast decay and ~39% by the slow decay in the reperfusion period.
Elevations of Ca2+-Dependent Fluorescence with and Without Nimodipine
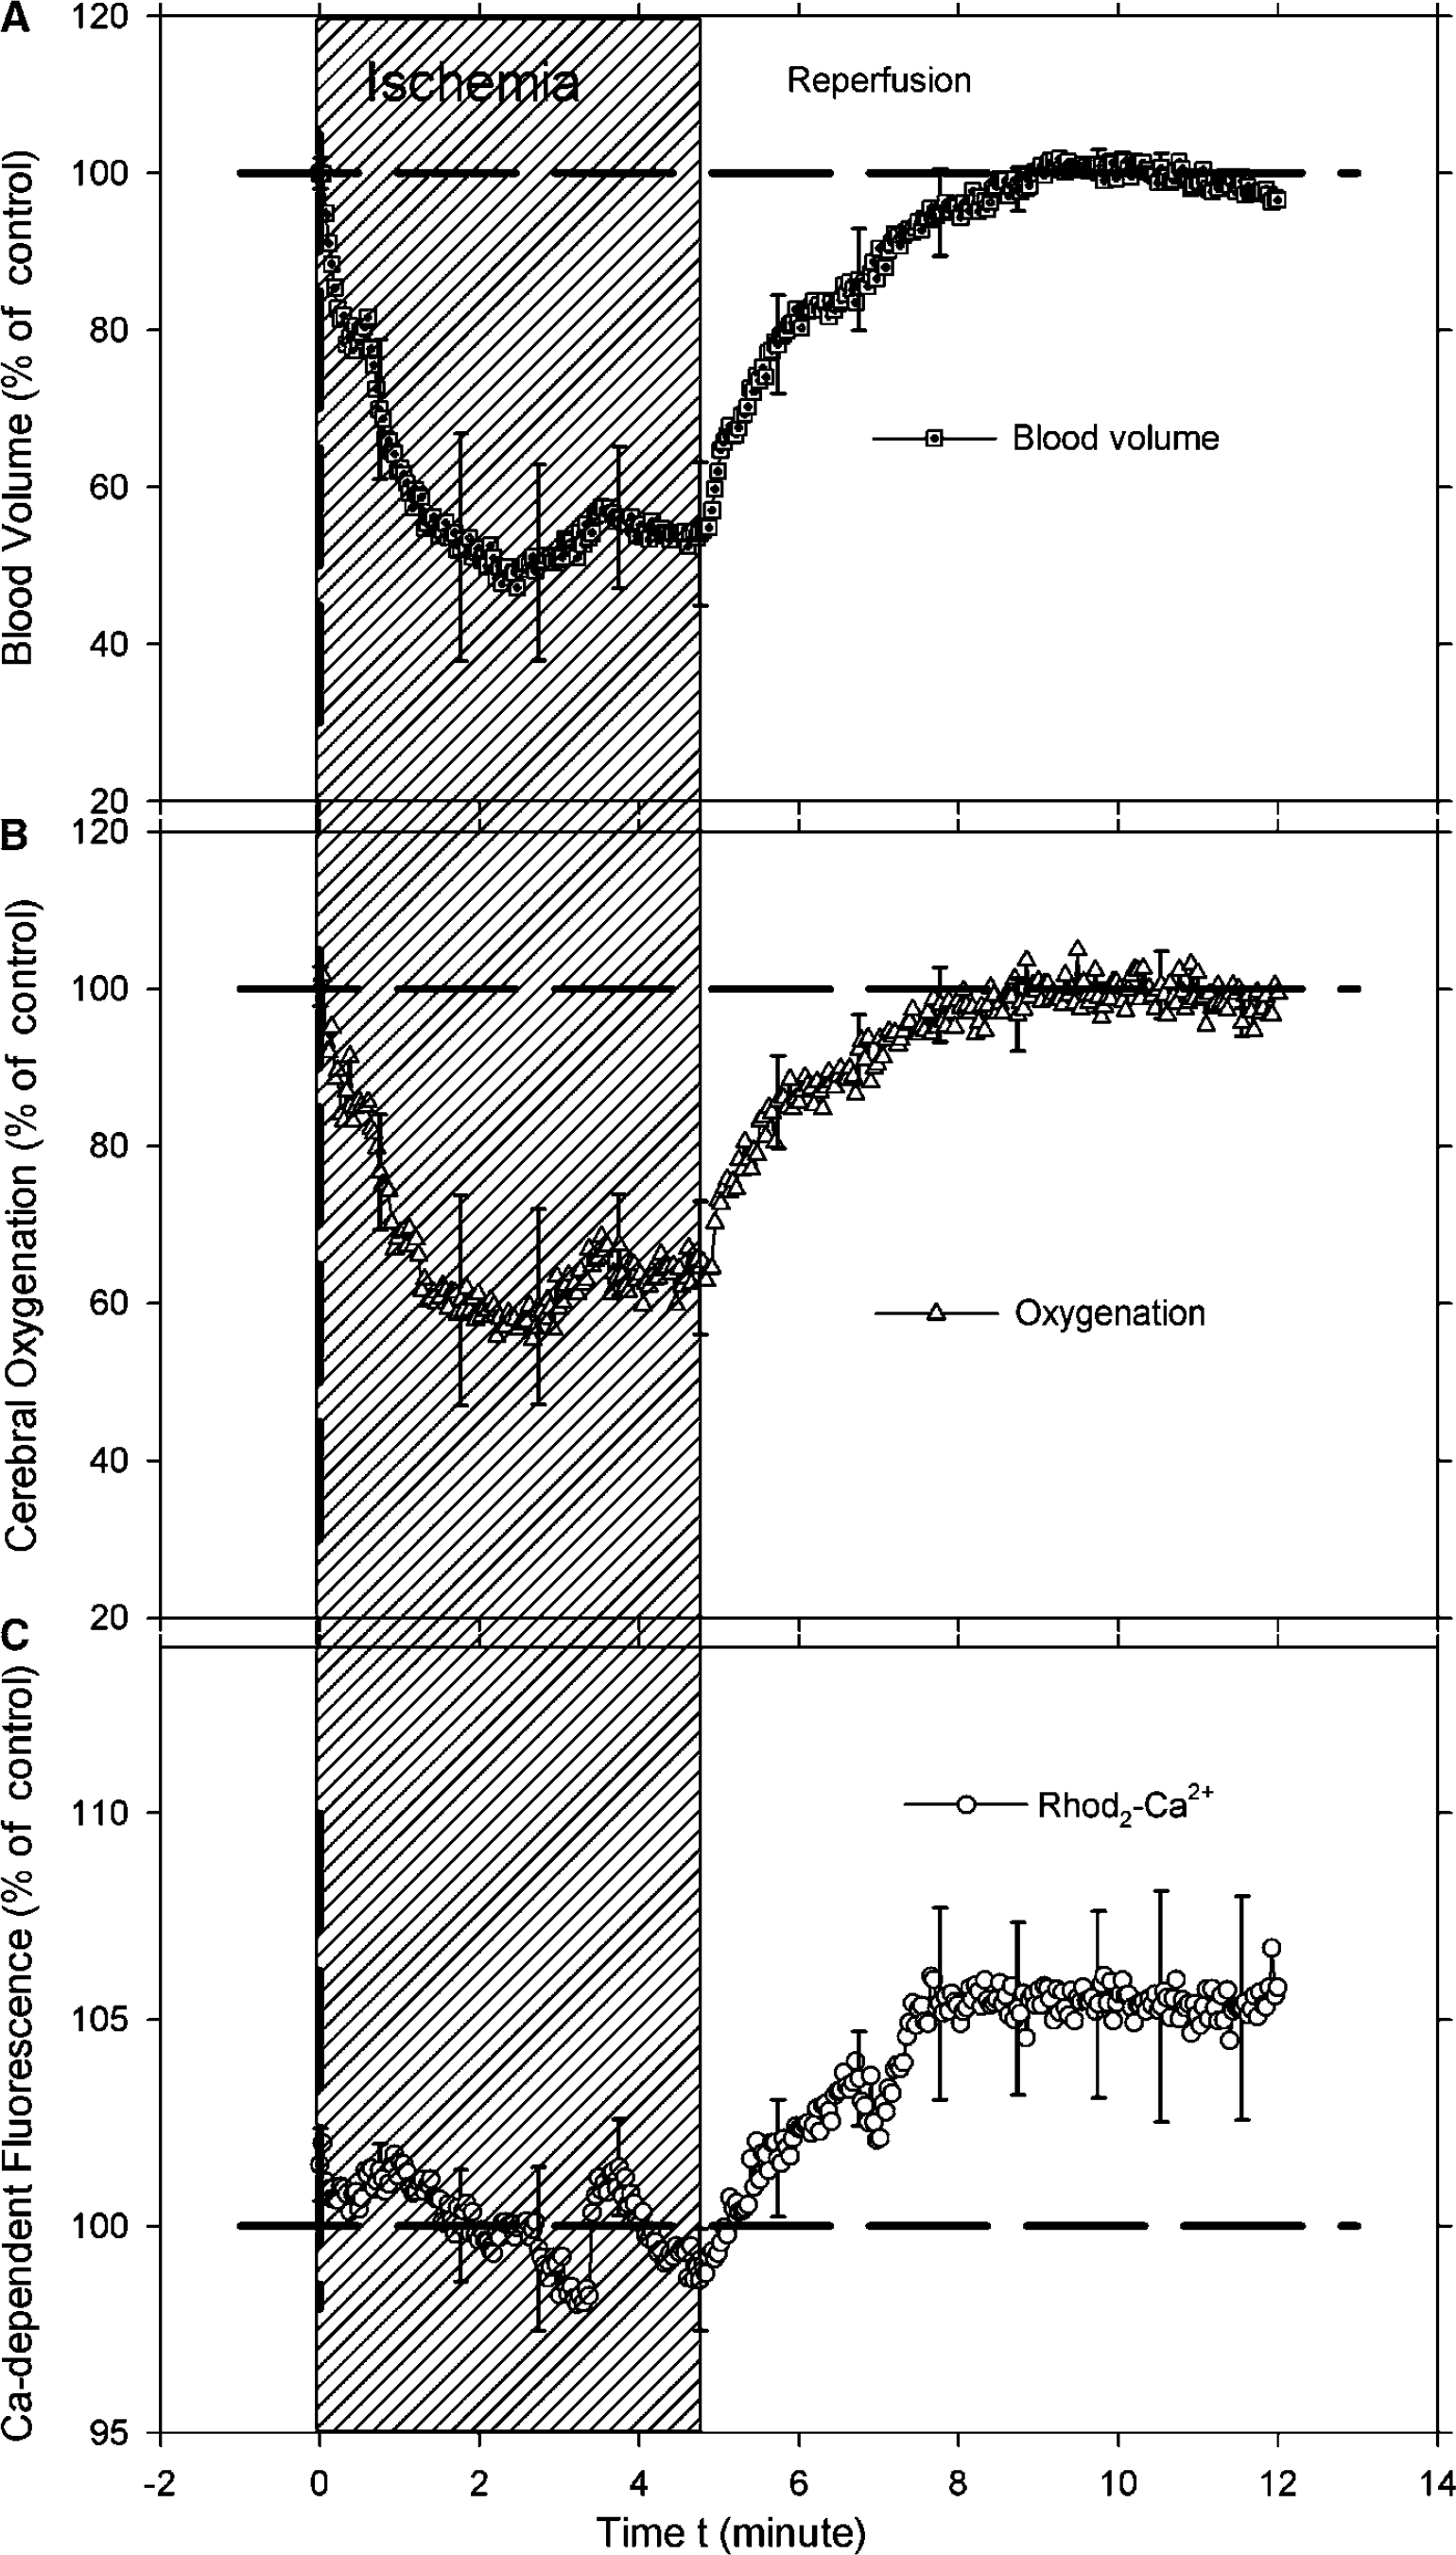
Figure 7 shows the mean time course of blood volume, oxygenation, and Ca-fluorescence during ischemia and reperfusion obtained from the cortex of rats (n = 4) pretreated with nimodipine before the ischemic insult. There were no significant Ca-dependent fluorescence increases during the ischemic insult, although both blood volume (Figure 7A) and hemoglobin oxygenation (Figure 7B) display typical ischemia changes as indicated in Figure 7C. However, while blood volume and hemoglobin oxygenation returned to baseline on reperfusion the calcium dependent fluorescence overshot by approximately 5% compared with preischemic baseline levels.
The average time traces of the changes in (
Figure 8 illustrates a summary of calcium and tissue hemoglobin oxygenation changes in response to the ischemia-induced decease in blood volume, with and without nimodipine pretreatment. There was a significant attenuation of the ischemia-induced calcium-dependent fluorescence increase in the nimodipine group compared with the control group (0.65%±0.8% versus 7.69%±0.4%). However, the ischemic insult produced similar blood volume (47.1%±2.5% versus 48.3%±1.9%) and cerebral oxygenation changes (38.2%±3.2% versus 33.6%±3.4%) in the two groups. The nimodipine data indicate that the elevation of fluorescence is predominately caused by an intracellular calcium increase and not by an activated Rhod2 leaking into the extracellular space.
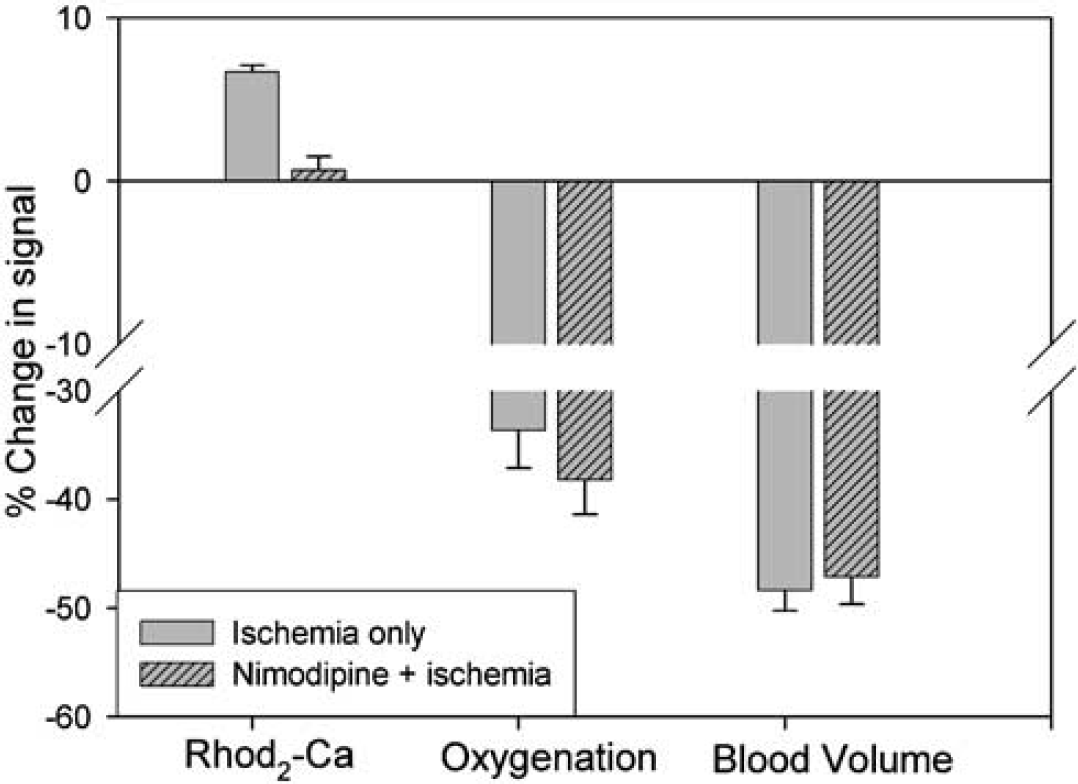
Comparison of the ischemia-induced changes in the cerebral blood volume, oxygenation, and calcium-dependent fluorescence. The results are analyzed by averaging the data during 2 to 5 mins ischemia periods. It shows effect of a calcium blocker, nimodipine on Ca2+-dependent fluorescence of Rhod2 during ischemia 2 to 5 mins, though a similar changes in blood volume and oxygenation.
Conclusion and discussion
In the present study, we measured changes in intracellular calcium along with changes in blood volume and oxygenation in the rat brain in vivo. In spite of our previous success implementing the Rhod2-Ca2+ fluorescence technique in studies of the whole perfused heart, it was clearly more challenging to integrate the detection of three optical parameters into one measurement. For example, to eliminate the influence of changes in hemoglobin oxygenation on Rhod2 excitation and emission, we used a pair of isosbestic wavelengths at 548 and 589 nm. The reason for selecting 548 nm for excitation was its more efficient emission at 589 nm when compared with other exciting wavelengths (e.g., 524 nm) as illustrated in Figures 2A and 3. Further, to eliminate the influence of the ischemia-induced changes in blood volume and scattering on the fluorescence signal, we divided the fluorescence emission (λem = 589 nm) by the diffuse reflectance of the excitation light (λex = 548 nm). This approach was pioneered by Chance (1951), theoretically analyzed by Wu et al (1993), and experimentally validated in isolated organs (Du et al, 2001) and the brain in vivo (Ramanujam et al, 2001). We further examined the ratio approach by injecting a bolus of saline into the arterial catheter in some of the rats after concluding the reperfusion period. The ratio of the fluorescence emission (at 589 nm) to the diffuse excitation (at 548 nm) from the brain tissue was observed to be independent of the local blood concentration changes during the saline bolus (data not shown). This suggests that the ratio approach can correct the alterations in tissue optical properties such as absorption because of local changes of blood volume during ischemia and reperfusion. To detect changes in the hemoglobin saturation and concentration, we measured the diffuse reflectance from the brain surface at the two additional wavelengths of 555 and 572 nm. These coincide with the absorption bands of oxy- and deoxy-hemoglobin, and change with the same amplitude but in opposite directions corresponding to the change in hemoglobin oxygenation. A theoretical model was developed (Appendix A) to determine separately the changes in hemoglobin oxygenation and concentration (i.e., blood volume) by subtracting and summing the optical densities of the signals at these two wavelengths.
We used a reversible forebrain ischemia model to validate our optical technique and tracked three physiologic parameters (blood volume, oxygenated hemoglobin, and intracellular calcium) simultaneously in vivo. As expected, ischemia rapidly reduced the cerebral oxygen delivery (indirectly represented by the decrease in blood volume, i.e., ΔBV), and as a consequence decreased the available oxygenated-hemoglobin (represented by ΔStO2) because of excessive tissue/cellular oxygen extraction and ATP consumption during the ischemic insult. Excessive energy consumption during ischemia is caused in major part by dissipation of transmembrane ion gradients and rapid intracellular calcium increases. We note that the timing of the hemoglobin oxygenation changes (reaching maximum at 2.1 mins) is slower than the findings of Silver and Erecinska (1990), who reported a pO2 tension of zero within 15 to 30 secs after onset of ischemia. However, hemoglobin saturation reports on vascular oxygen in a manner dependent on hemoglobin affinity while the electrodes (Silver and Erecinska, 1990) measure tissue oxygen tension. The calcium ion changes detected using Rhod2 fluorescence during ischemia and reperfusion were very similar to those previously detected from intracellular and extracellular measurements using microelectrodes (Silver and Erecinska, 1990; Benveniste et al, 1989). The calcium-dependent fluorescence signal increased rapidly after the onset of blood volume changes and reached maximum at 2.1 mins followed by a plateau phase which lasted until reperfusion (Figure 6C).
In the nimodipine-treated group, the Rhod2-Ca2+ fluorescence intensity varied around baseline levels during ischemia and then overshot during reperfusion (Figure 7C). The fact that nimodipine inhibited the ischemia-induced fluorescence is particularly important for our study because it strongly suggests that the Rhod2-Ca2+ fluorescence signal is derived specifically from the intracellular compartment. In other words, the Rhod2-Ca2+ fluorescence signal measured during ischemia is not a result of Rhod2 leaking out of the cells and fluorescence increasing when exposed to the much larger extracellular calcium pool. Alternatively, nimodipine might interfere directly with the Rhod2-Ca2+ binding process and hence result in the fluorescence not to be increased during ischemia. However, this is unlikely because there was no fluorescence change during nimodipine administration before ischemia. Further, Pisani et al (1998) previously showed in a brain slice model that ischemia (oxygen and glucose deprivation) caused an increase in intracellular calcium of cortical pyramidal neurons that could be inhibited by nimodipine (and nifedipine), which are in agreement with our data. During the reperfusion phase, we observed an overshoot of the Rhod2-Ca2+ fluorescence signal in the rats treated with nimodipine. A similar phenomenon has previously been described in a rat transient forebrain ischemia experiment using extracellular calcium microelectrodes during administration of the glutamate antagonist APV; and a transient decrease in the extracellular calcium was observed before normalization towards baseline levels (Benveniste et al, 1988). The extracellular calcium ‘undershoot’ (Benveniste et al, 1988) and the intracellular calcium ‘overshoot’ (this study) in the immediate postischemic period can be explained as a consequence of reversal of the Na+/Ca2+ exchanger. This exchanger may change direction when the membrane potential varies (depolarization or repolarization) and/or when the cytosolic Na concentration is altered. Under normal conditions, the Na+/Ca2+ exchanger can move Ca2+ either in or out of the cell depending on the prevailing electrochemical driving force. Immediately after ischemia, the pump would be in the calcium ‘entry’ mode because of the dissipation of the plasma membrane sodium gradient. For example, it has been shown that after depolarization-induced calcium entry, calcium efflux from isolated nerve terminals is markedly slowed (Godukhin et al, 2002; MacGregor et al, 2003). The fact that the intracellular calcium overshoot occurs only after nimodipine could reflect greater ATP reserves in the nimodipine-treated group, which would serve to activate the Na+/Ca2+ exchanger more rapidly (Benveniste et al, 1988; Blaustein and Lederer, 1999; MacGregor et al, 2003).
Rhod2 is known to load into the cytosolic (del Nido et al, 1998; MacGowan et al, 2001a; Rubart et al, 2003) as well as the mitochondrial compartment (Hajnoczky et al, 1995; Kann et al, 2003; Scaduto and Grotyohann, 2003; Mironov et al, 2004), a feature which might complicate quantification and interpretation of Rhod2-Ca2+ fluorescence changes. Minta et al (1989) originally described that Rhod2 accumulate, hydrolyzed and trapped in the mitochondrial compartment. Since then several investigators using fluorescence imaging in single cells preloaded at room temperature have shown that Rhod-2 indeed localized in punctuate and filamentous regions around the nucleus consistent with mitochondrial localization (Babcock et al, 1997; Boitier et al, 1999). Further in chromatoffin cells potassium-induced depolarization induced rapid calcium entry into the mitochondria and increased the Rhod-2 fluorescence within the mitochondria (Babcock et al, 1997). Babcock et al developed a technique to simultaneously monitor mitochondrial and cytosolic calcium changes using various blockers and showed that rapid removal of cytosolic calcium requires uptake via the mitochondrial uniporter. Additionally, it was shown that subsequent calcium export from mitochondria required the Na+/Ca2+ exchanger. Although cell culture experiments may differ fundamentally from those operating in vivo these results are important for the interpretation of our findings obtained during and after ischemia. Recently, Kann et al (2003) concluded that most (79%) of the Rhod2 signal came from the mitochondrial compartments. They used a low dose of Rhod2/AM (5 μmol/L) and loaded it into brain slice culture at 36.5°C for ~50 to 60 mins. Importantly, the tissue was then incubated in normal artificial cerebrospinal fluid for 1.5 h before taking fluorescence measurements, which might allow washout of most cytosolic Rhod2. In our studies, we loaded Rhod2 (100 μmol/L) at body temperature for ~30 mins with a slow injection rate (3 μL/mins). Ischemia was performed after 60 to 80 mins to allow for Rhod2 hydrolysis. However, no washout procedure was introduced to clean the unhydrolyzed Rhod2 in extracellular and perhaps hydrolyzed dye in cytosol. Future work will look at the cellular distribution of Rhod2 under the loading conditions used.
Ischemia rapidly induces neuronal depolarization because of arrest of Na+/K+ ATPase activity and causes calcium to enter cells, overloading the cytosol, the mitochondria, and the endoplasmic reticulum. During reperfusion, normalization of the intracellular calcium concentrations may be delayed dependent on the subcellular compartment. For example, Dux et al (1987) have previously shown excessive calcium deposits in mitochondria of neurons and glial cells in gerbil brains >30 mins after recovery from a 5-mins ischemic episode using oxalate-pyroantimonate electron cytochemistry. Similar results were obtained in rat brain by Zaidan and Sims (1994). However, it is clear from microelectrode experiments that the cytosolic calcium concentration normalizes much more rapidly after transient ischemia (Silver and Erecinska, 1990). In the present study, increases in intracellular calcium induced by cerebral ischemia started to normalize on reperfusion with a fast and a slow component as illustrated in Figure 6C, which suggests that the fast signal represents a predominantly cytosolic calcium recovery whereas the slow one is derived from the mitochondrial compartment.
Another issue to address is the accuracy of detecting the Rhod2-Ca2+ fluorescence changes during ischemia given the fact that the dissociation constant (Kd) of Rhod2 for calcium binding is sensitive to factors such as pH values and temperature. Thus, changes in the intracellular milieu other than calcium concentration may alter fluorescence signals. Stamm et al. (2003) investigated this problem in an ischemia model in the intact heart and measured fluorescence with the intracellular pH values changing from 7.1 to 6.8 during 5 mins of ischemia and during temperature changes. It was shown that the dissociation constant Kd of Rhod2 to calcium remained stable in the ranges of intracellular pH from 7.1 to 6.8 and tissue temperatures from 22°C to 37°C. Accordingly, we would not expect ischemia-induced changes in pH to affect the Rhod2-Ca2+ binding Kd in any major way because the pH would be expected to decrease from approximately 7.2 to 6.3 during the 5-mins ischemic insult (Silver and Erecinska, 1990). However, it might be a problem with longer episodes of ischemia. Furthermore, in our experiments the animals were kept normothermic during the ischemia. As indicated in Table 1, the body temperature is constant during ischemia and reperfusion for both Group 1 and Group 2 experiments. Therefore, we attribute the observed fluorescence responses during the ischemia/reperfusion to metabolic events and not to changes in the Rhod2-Ca2+ binding constant.
Because we tracked three parameters simultaneously we were able to directly correlate their time-signal profiles during and after the ischemic insult. For example, Figure 9 shows the changes in tissue hemoglobin oxygenation (ΔStO2) as a function of the corresponding blood volume changes (ΔBV) during ischemia and reperfusion. A linear correlation with a slope of 0.73 was found. In other words, a 10-fold decrease in blood volume corresponded to a 7.3-fold decrease in cerebral hemoglobin oxygenation. We found a similar correlation in the rats pretreated with nimodipine (opened squares in Figure 9), indicating that nimodipine per se does not influence the blood flow and metabolism (hemoglobin oxygenation) changes that occur during ischemia (Gomi et al, 2004). Several studies have examined the relationship between the cerebral metabolic rate for oxygen consumption (CMRO2), cerebral blood flow (CBF) and blood volume (CBV) using MRI techniques and showed a tight proportionality between fractional changes in CMRO2 and CBF measured at rest in humans (Hyder et al, 1998) and during graded anesthesia in the rats (Kida et al, 2000). For example, the ratio defined as ΔCMRO2/ΔCBF (measured during pharmacologic perturbations) in anesthetized rats is approximately 0.8 to 0.9 and can be increased or decreased slightly by assuming alterations of the oxygen diffusivity properties of the capillary bed (Kida et al, 2000). However, under conditions of graded anesthesia there appears to be coupling (≈ 0.9:1) between CMRO2 and CBF over a range of activities that includes functional activation (Hyder et al, 1998). In our study, the ratio of the changes in hemoglobin oxygenation (ΔStO2) and blood volume (ΔBV) was found to be 0.73:1 during onset of ischemia. This discrepancy is not surprising because the optical parameters (i.e., ΔStO2 and ΔBV) are not precisely identical to the MRI parameters (i.e., ΔCMRO2 and ΔCBF). Also, swelling of the capillaries and/or general tissue edema during ischemia could significantly alter the tissue oxygen diffusion.
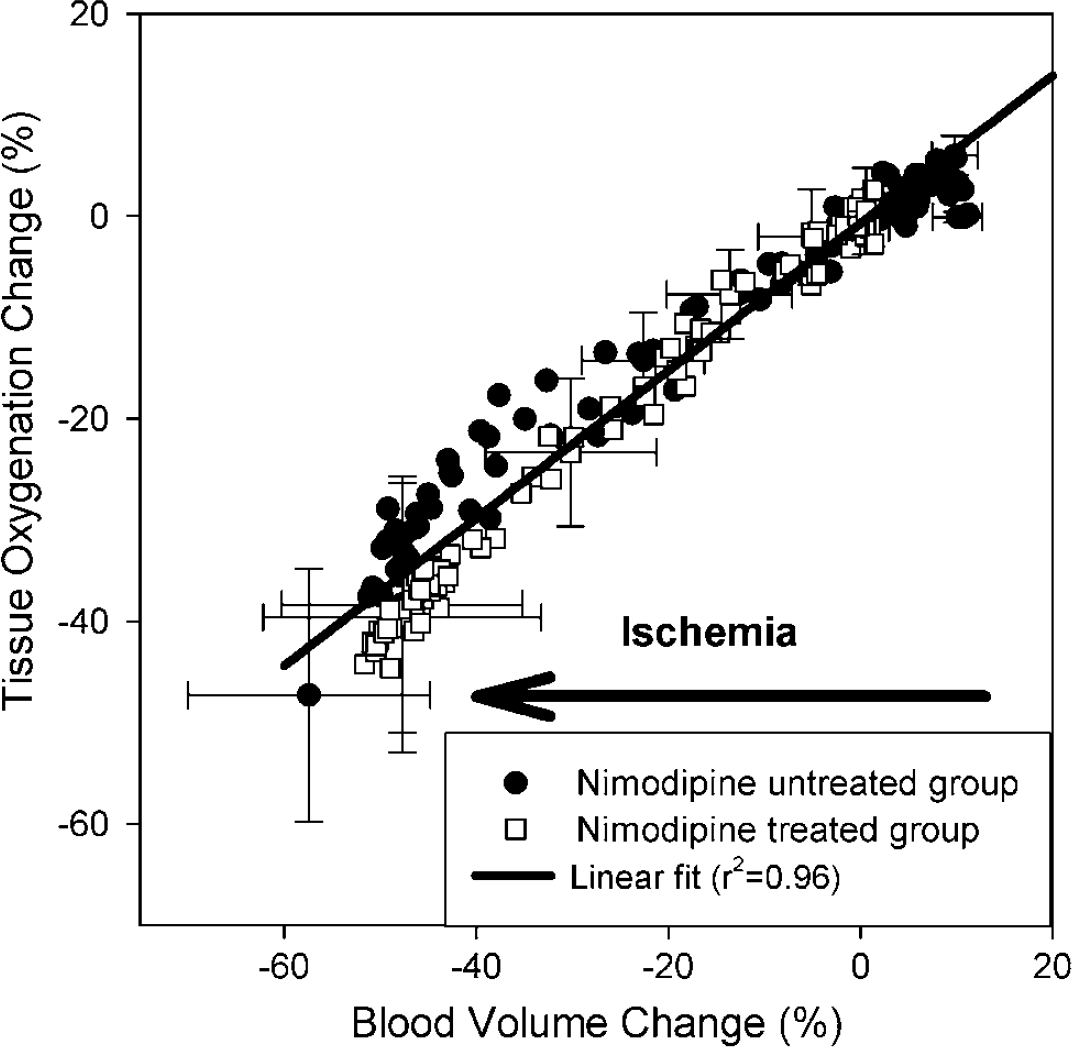
Comparison of the changes in cerebral oxygenation (ΔStO2) to the changes in blood volume (ΔBV) during the ischemia and reperfusion for nimodipine-treated and untreated groups. The cross-correlation was analyzed using a linear fitting (i.e., ΔStO2 = –0.70 + 0.73 ΔBV; r2 = 0.96). Error bars indicate standard error of the mean.
Summary
An optical instrument was designed to detect the fluorescence emission and diffuse reflectance from the brain surface based on the concept of time sharing at multiple wavelengths. Animal studies using a reversible-ischemia model validated the technique and permitted simultaneous detection of changes in intracellular calcium, blood volume, and cerebral hemoglobin oxygenation. Our optical technique offers the distinct advantage that one can separate and directly detect changes in free intracellular calcium along with hemodynamic alterations in the brain in vivo. We are in the process of reducing the physical size of the optical probe and improving the temporal resolution so that it can be used to measure changes in any region of the brain with millisecond resolution. This approach may open new opportunities to study the function of normal brain as well as contribute to our understanding of cerebral pathological processes such as a drug-driven cell injury or brain functional change.
Acknowledgements
The authors thank Xinhua Lin and Mei Yu for the assistance in chemical and experimental preparation, and SJ Gatley for editorial advice and valuable discussion. This research was supported by the Laboratory Directed Research and Development (LDRD) Grants No: 02-08 (HB) and No: 04-066 (CD), Brookhaven National Laboratory, and a US Department of Energy contract (DE-AC02***98CH10886).
Appendix A: Theoretical Concept of Optically Determining the Changes in Hemoglobin Concentration and Oxygen Saturation—Dual-Wavelength Methodology
To optically measure the hemoglobin concentration and oxygenation status, we need to select the detection wavelengths that coincide with the absorption bands of oxy- and deoxy- hemoglobin. The differential spectrum of the brain absorption between oxygenated and deoxygenated states is shown in Figure 2C, which was obtained from the surface of the rat brain cortex during varying oxygenation states from normoxic to hypoxic. It is clear that the wavelengths of 555 and 572 nm are ‘symmetric points' to the isosbestic wavelength at 568 nm, which means that there is a similar amplitude change in the signal intensity corresponding to the changes in the tissue hemoglobin oxygenation, but in opposite directions (i.e., one is increased whereas another is decreased). The detection of the signals at these two wavelengths allows one to separately determine the changes in hemoglobin concentration and oxygenation as being discussed in the following.
Changes in the concentrations of oxy- and deoxy-hemoglobin can be quantified using a modified Beer-Lambert law, which is an empirical description of optical attenuation in highly scattering medium (Cope and Delpy, 1988; Baos et al, 2002), that is,

where OD is the optical density, Io is the incident light intensity, I is the detected light intensity, ε is the extinction coefficient of the chromophhore, C is the concentration of the chromophhore, L is the distance between where the light enters the tissue and where the detected light exits the tissue, B is a pathlength factor that accounts for increases in the photon pathlength caused by tissue scattering, and G is a factor that accounts for the measurement geometry.
A change in the chromophore concentration causes the detected intensity to change. When the concentration changes, the excitation coefficient ε and distance L and the geometry factor G remain constant and it is assumed that the change in B is negligible, Thus, Equation (A.1) can be rewritten as

where ΔOD = ODafter–ODbefore is the change in optical density, Iafter and Ibefore are the measured intensities before and after the concentration change, and ΔC is the change in concentration, L is specified by the probe geometry, ε is an intrinsic property of the chromophore, and B is often referred to as the differential pathlength factor (DFP), which can be determined from independent measurements with ultrashort pulses of light (Delpy et al, 1988) and has been tabulated for various tissues. Thus, given the extinction coefficient, it is possible to quantify the change in chromophore concentration.
To consider the contributions of two chromophores, that is, oxy- (HbO) and deoxy-hemoglobin (Hb), we need to rewrite Equation (A.2) as

where λ indicates a particular wavelength. Equation (A.3) explicity accounts for independent concentration changes in oxy-hemoglobin (Δ[HbO]) and deoxy-hemoglobin (Δ[Hb]).
The blood volume BV is a representation of total hemoglobin concentration, which is attitude to the oxy- and deoxy-hemoglobin, i.e.,

Then Equation (A.3) can be rewritten to be dependent on the blood volume, also if we apply it for two wavelengths λ1 and λ2, we have


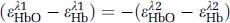
The spectral difference of the brain absorption between oxygenated and deoxygenated states is plotted in Figure 2C. There is an unchanged point, that is, so-called ‘isosbestic’ wavelength near 568 nm, signifying that the optical intensity measured at this wavelength is independent of changes in hemoglobin oxygenation states. If we select two wavelengths that are ‘symmetric’ to the ‘isosbestic’ point, for example 555 and 572 nm, we will have identical but opposite amplitude responses corresponding to the oxygenation changes in tissue:
The summation of the signal intensities between these two wavelengths can be derived from, (Equations A.5a) and (A.5b), that is,

whereas the subtraction of the signals between λ1 and λ2 gives

Assuming that (a) the deviation between ελ1Hb and ελ2Hb is negligible because of the proximity of the selected wavelengths, and (b) the factors B and L are consistent with regard to the physiologic changes of the animal, the blood volume changes can be represented by the summation of the signals between λ1 (555 nm) and λ2 (572 nm) as described by Equation (A.7), whereas the oxygenation change can be extracted from these two wavelengths by the subtraction as described by Equation (A.8). This dual-wavelength algorithm can be used to extract the simultaneous changes in blood volume and cerebral oxygenation during ischemia and reperfusion.