
Abstract
The spatiotemporal dynamics of neurovascular coupling during epilepsy are not well understood, and there are little data from studies of the human brain. We investigated changes in total hemoglobin (Hbt) and hemoglobin oxygenation in patients undergoing epilepsy surgery with intraoperative intrinsic optical spectroscopy (IOS) during triggered afterdischarges (ADs). We found an early (~0.5 secs) focal dip in hemoglobin oxygenation, arising precisely in the stimulated gyrus that lasted for 11.5 ± 10.0 secs, approximately the length of the AD (10.4 ± 4.4 secs). A later oxygen overshoot and increase in blood volume occurred in the adjacent surrounding gyri. After a significant delay (~20 to 30 secs), the overshoot and blood volume signal became extremely focal to the area of the onset of the AD. A smaller very late undershoot, the last phase of the ‘triphasic’ response, was also identified, although localization was inconsistent. In this study, we show that a ‘late focal overshoot’ and late Hbt signal may be extremely useful, in addition to the early dip, for the localization of seizure onset. It is likely that a separate mechanism underlies the persistent focal increase in cerebral blood volume after a long-duration cortical stimulation, compared with the nonspecific mechanism that causes the initial increase in cerebral blood flow.
Keywords
Introduction
Most of our understanding of neurovascular coupling arises from studies of normal cortical processing in the nonhuman brain. There are little data on neurovascular coupling during abnormal physiologic states, such as epilepsy, and only scattered case reports on the human epileptic brain with subsecond temporal and submillimeter spatial resolution (Haglund and Hochman, 2004; Zhao et al, 2007).
Recent animal studies of somatosensory processing have shown that neurovascular coupling is not a static phenomenon and that both perfusion and oxygenation are dynamically linked with neuronal activity. For example, cerebral blood volume (CBV) was originally thought to be poorly localized with neuronal activation, because the upstream arteriolar dilation spatially overperfuses the area of increased metabolic activity (Malonek and Grinvald, 1996). However, a careful analysis of the resulting optical signal revealed that a higher spatial correlation could be found at early time points, as CBV initially increases, and also at later time points during its dissolution, particularly with a long-duration stimulation (Berwick et al, 2008; Vanzetta et al, 2005). It is unknown whether a similar phenomenon exists during epileptiform activity and also whether animal data can be extrapolated to the human brain.
Similarly, an early increase in deoxygenated hemoglobin (Hbr) and decrease in oxygenated hemoglobin (HbO2), also known as the ‘initial dip’, was described in certain studies of normal sensory processing and thought to provide a more focal but transient representation of areas of increased metabolism and neuronal activation than perfusion-based signals (Malonek and Grinvald, 1996; Vanzetta and Grinvald, 1999). After the dip, hemoglobin oxygenation increases, which has also been known as the ‘overshoot’ (Chen-Bee et al, 2007). This second phase of hyperoxygenation is less well-localized and forms a significant component of the blood oxygen level-dependent (BOLD) signal imaged with functional magnetic resonance imaging (fMRI) (Chen-Bee et al, 2007). Finally, a delayed ‘undershoot’ is reported, which is slightly smaller than the ‘overshoot’. Human and animal studies of epileptiform activity using fMRI generally lack the temporal resolution for identifying an initial dip (Kobayashi et al, 2006a, b; Nersesyan et al, 2004b). On the contrary, animal intrinsic optical spectroscopy (IOS) studies unequivocally show a profound dip at the onset of both interictal and ictal events (Bahar et al, 2006; Suh et al, 2005). Later components of this oximetry signal, such as the ‘undershoot’ and ‘overshoot’ have not been described in human IOS studies of epilepsy.
To directly address these outstanding questions, we wished to determine the spatiotemporal dynamics of hemodynamic response in human epilepsy. Intrinsic optical spectroscopy was performed in the operating room after craniotomy for surgical treatment of medically refractory epilepsy on anesthetized humans. As spontaneous seizures are infrequent in the operating room, afterdischarges (ADs) were triggered with bipolar cortical stimulation. We report not only the presence of a long focal early dip followed by a less focal overshoot but also, for the first time, a later focal overshoot that may be useful in localizing the epileptic activity. Similarly, a late focal increase in CBV provides another useful source of localizing information.
Materials and methods
Subjects
Eligible subjects were patients with medically intractable epilepsy undergoing two-stage surgery for localization and possible resection of their epileptic focus. All patients provided consent for optical imaging of the triggered ADs. The procedure was approved by the Institutional Review Board at Weill Medical College of Cornell University. At the time of the imaging procedure, patients had undergone an earlier craniotomy for the implantation of electrodes to record interictal and ictal electrographic data. Hence before IOS, the location of both the seizure focus and the surrounding functional cortex was known. Intrinsic optical spectroscopy was performed during a second operation when the electrodes were removed from the brain before resective surgery under general anesthesia consisting of isoflurane (<0.2%) and remyfentanyl (1 μg/kg per h).
Electrical Stimulation and Recording
Two 4-contact strip electrodes (interelectrode distance:1 cm; Ad-Tech, Madison, WI, USA) were placed adjacent to one another on the cortical surface (Figures 1A and 2A). The two distal contacts of one strip were used for electrical stimulation, whereas those of the second strip were used to record electrocorticography from an adjacent gyrus. Neither set of the electrodes straddled a blood vessel or a sulcus. Stimulation was performed on the crest of a gyrus within the epileptic focus, at least 1 cm from the Sylvian fissure or other large superficial veins. The epileptic focus was defined as the area(s) of ictal onset and/or maximal interictal spiking during chronic recordings with implanted electrodes.
Experimental methodology and comparison between raw intrinsic signal changes and spectroscopic data. (
Spatial extent of perfusion and oximetry signals (
Bipolar stimulation was obtained from an S-12 stimulator (Grass-Telefactor, West Warwick, RI, USA). Trains of 1-ms pulses were delivered at 50 Hz for 5 secs at amplitudes of 5 to 15 mA. Amplitudes were chosen for individual patients by increasing the stimulation current by increments of 1 mA until an AD was evoked. This lowest, suprathreshold amplitude was used throughout the experiment. However, if a second AD was not elicited at this stimulation amplitude, the amplitude was increased until ADs were again elicited. Stimulus amplitude was increased either to a maximal amplitude of 15 mA or until an AD occurred, which lasted for > 30 secs, at which time the study was terminated. Only trials with clear ADs that lasted for > 5 secs were included in this study. We did not induce > 15 ADs in any one patient.
The electrocorticography data were amplified (Grass IP511, West Warwick, RI, USA) and digitized at 2,000 Hz and recorded onto a personal computer using the Spike 2 program (CED Power 1401, Cambridge, UK). Real-time examination was performed to ensure the presence of ADs and the absence of spreading depression. The electrocardiogram (EKG) was taken directly from the anesthesia machine and digitized onto a personal computer using Spike 2.
Optical Imaging
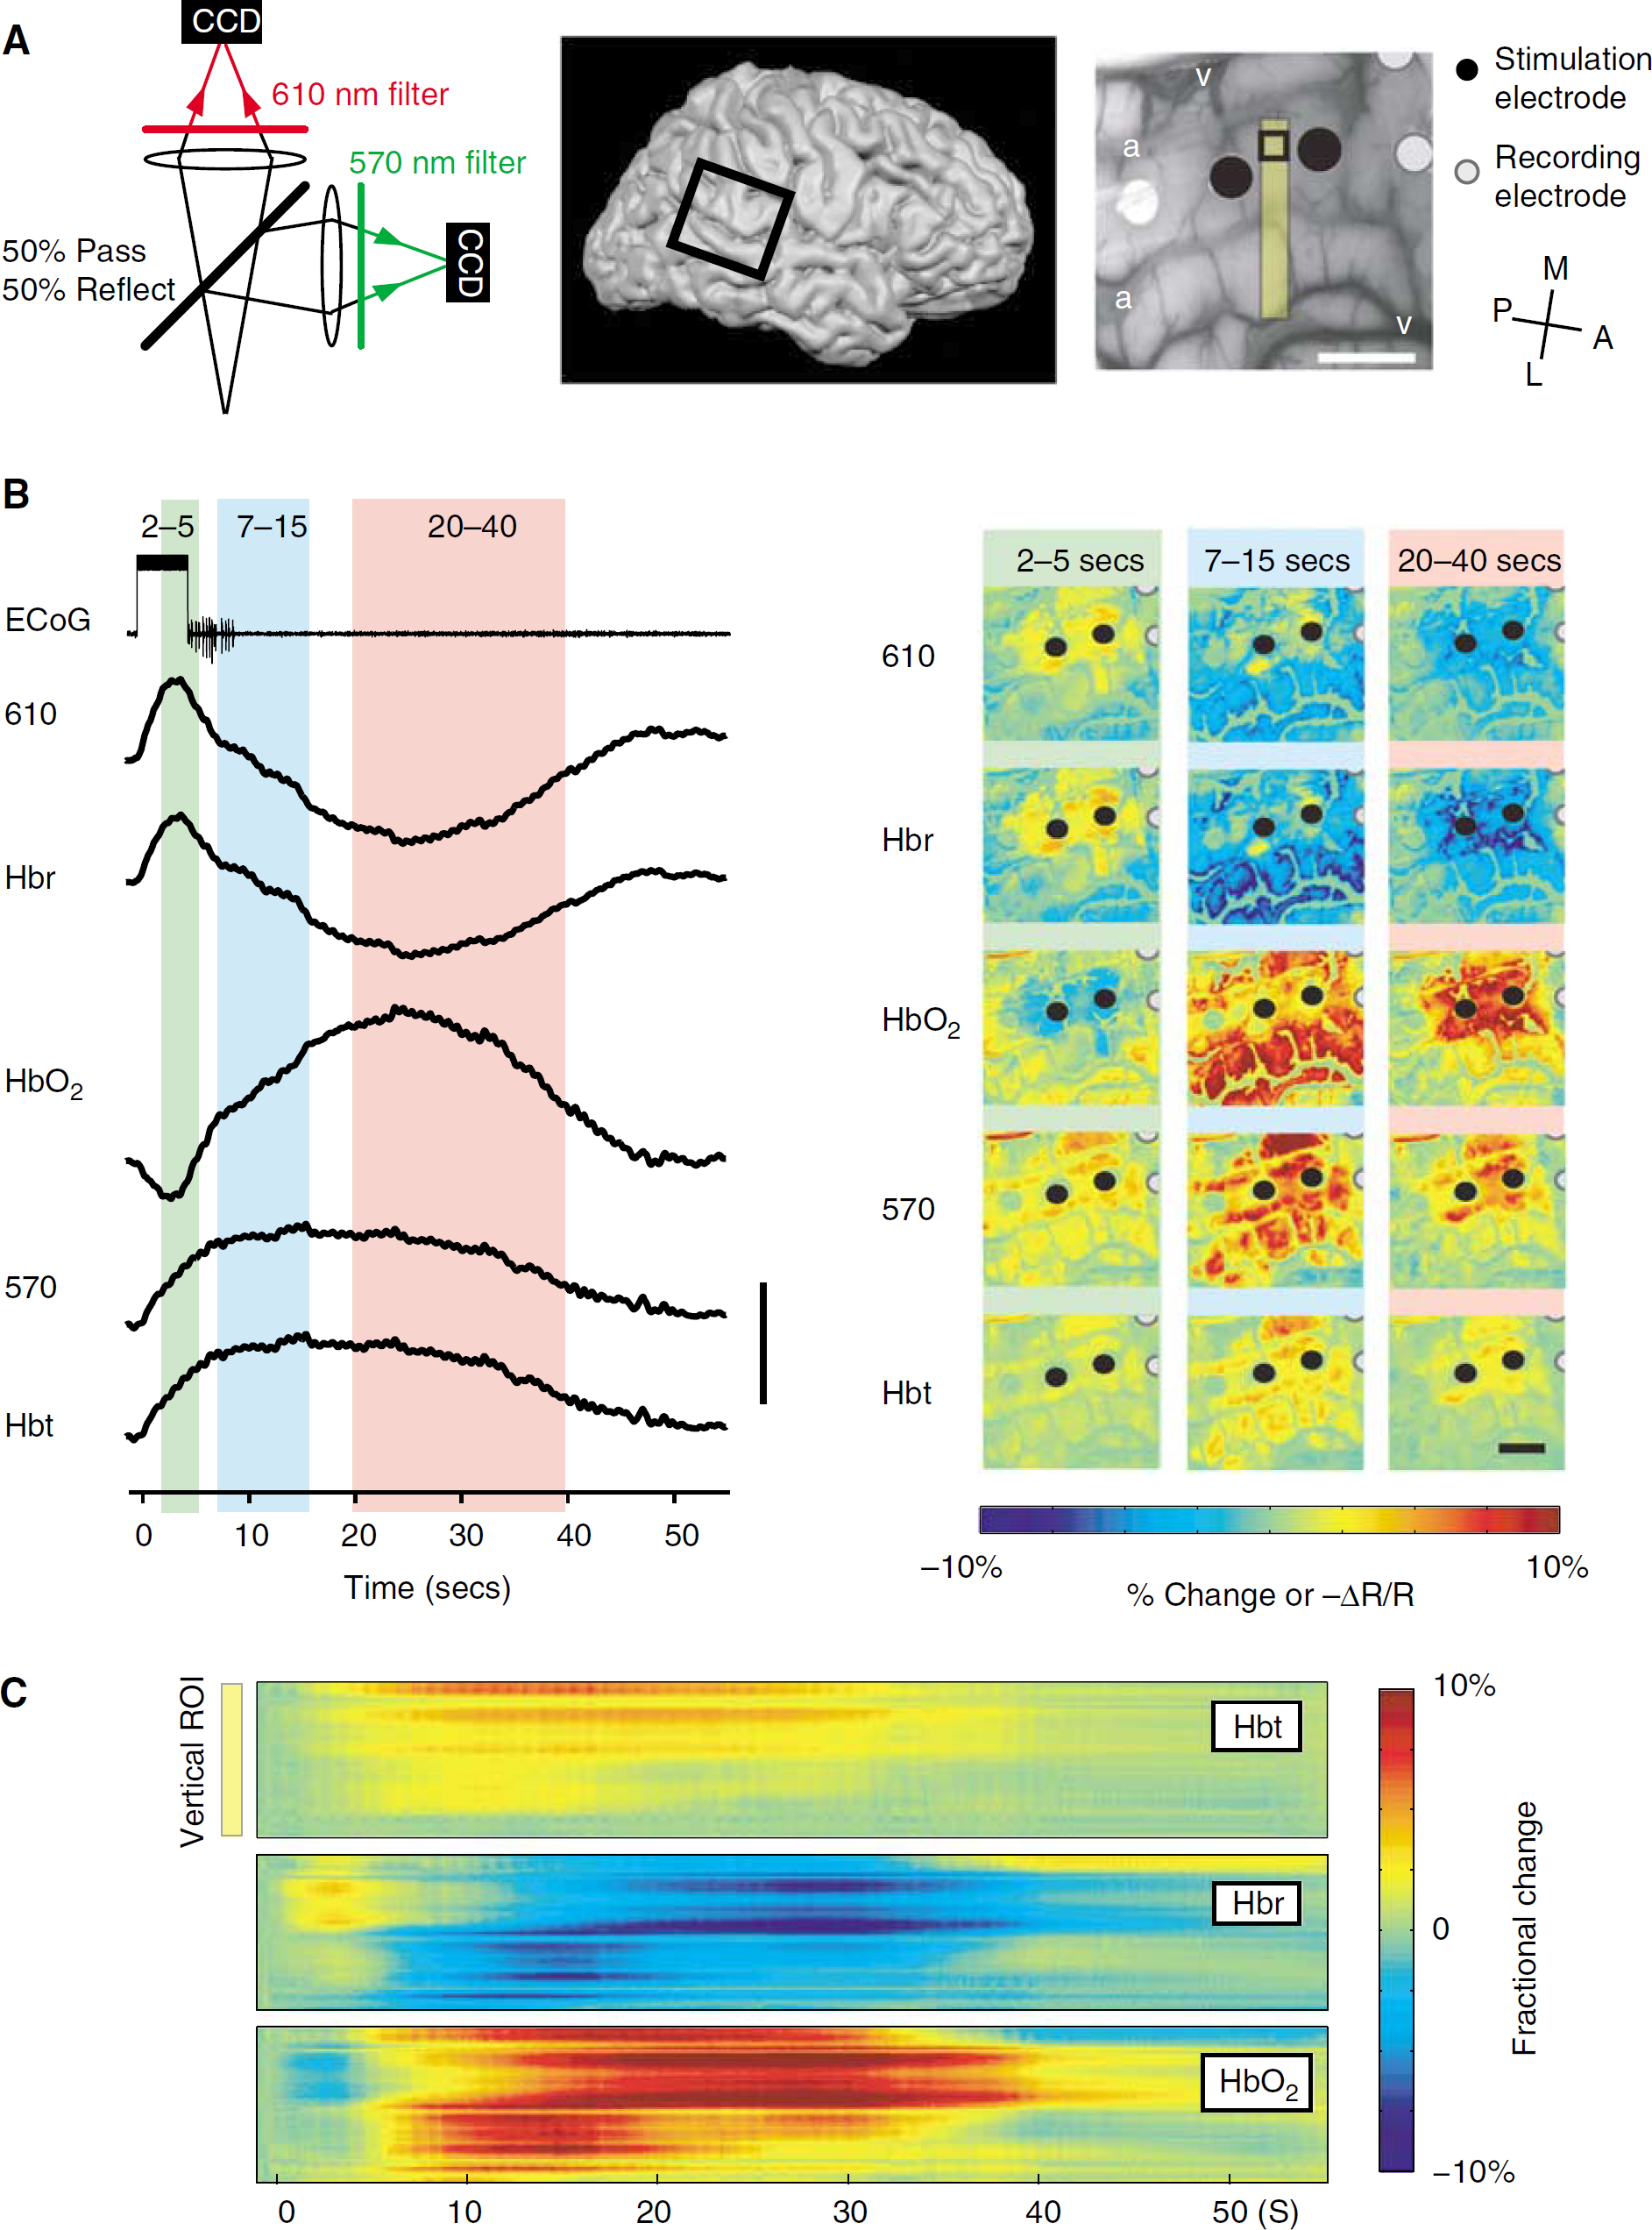
A sterile polycarbonate plastic footplate with antiglare coating (4 × 4 cm) was placed on the surface of the brain over the electrodes for stabilization and for dampening the movement artifacts caused by heartbeat and respiration. A custom-made camera holder with gross and fine x-y-z manipulators were used to suspend the camera over the surface of the brain. A single 35-mm lens was used for imaging. We have successfully used this technique to map the subthreshold cortical stimulation and spontaneous seizures (Suh et al, 2006; Zhao et al, 2007). The operating room was darkened and the cortex illuminated using a ring illuminator attached to a Tungsten halogen lamp (100 W). The light was passed through bandpass filters of different wavelengths. An image of the surface of the brain was first acquired at 570 ± 10 nm to document the vascular anatomy and the locations of the recording and stimulating electrodes (Figure 1A). During the experiment, the images were then acquired at both 570 ± 10 and 610 ± 10 nm. We chose to record at 570 and 610 nm on the basis of their sensitivity to total hemoglobin (Hbt) and Hbr, respectively.
Although the intrinsic signal recorded at 610 nm is sensitive to Hbr, they are not equivalent. The concentration changes in Hbr, Hbt, and HbO2 can be calculated if data are acquired simultaneously at both 570 and 610 nm using a modified Beer-Lambert calculation (Sheth et al, 2004; Suh et al, 2006). In this report, we acquired data sequentially from different wavelengths during separate seizures in two patients. In two additional patients, the images were acquired at both wavelengths simultaneously by splitting the light path and adding an additional camera (Figure 1A). Using this technique, we could quantify changes in Hbt and Hbr. The optical reflectance signal was digitized onto a personal computer at 33 f.p.s. The camera resolution was 256 × 160 pixels.
The stimulation delay was 5 secs. The image acquisition for each trial was at least 60 secs, which was typically longer than it took for the intrinsic signal to return to baseline, because the maximal length of each trial was 40 secs (5 secs prestimulus, 5 secs stimulation, and < 30 secs AD) (Figure 1). The minimum interval between the two consecutive trials was 120 secs for avoiding overstimulation and signal contamination between trials.
Spectroscopic Calculations and Terminology
In the two patients undergoing simultaneous dual wavelength imaging, a modified Beer-Lambert Law was used to calculate the changes in Hbr, HbO2, and Hbt from the 570-and 610-nm data with path length correction (Sato et al, 2002; Sheth et al, 2004) using equation (1).
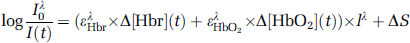
where I0 is the prestimulus intensity, I(t) the measured intensity time course, ε the extinction coefficients, l the path length through the tissue, S scattering, Δ[Hbr](t) and Δ[HbO2](t) the time course of change in absorbers, and superscript Λ indicates wavelength dependency. We determined a path length corrected value of Δ[Hbr](t) and Δ[HbO2](t) by measuring I0 and I(t) at two wavelengths and using the known wavelength dependency of the optical path length (± = ε l) (Sheth et al, 2004). The wavelength dependency of the optical path length was obtained from the work by Sheth et al using an in vitro phantom (Sheth et al, 2004).
In these patients, we were also able to determine a high degree of spatial correlation between the raw data acquired at 570 nm and Hbt images, and between those acquired at 610 nm and Hbr images (see Results). Thus, we pooled data from the first two patients, for whom simultaneous wavelength imaging was not performed, with the data from the latter two simultaneous-wavelength patients, to increase our ‘n’ to 4.
Data Analysis
Stimulus and AD-induced changes in light reflection were identified by dividing each image frame in each trial by an average of the frames acquired during the 5-sec prestimulus baseline. We have shown earlier that the signal-to-noise ratio of the human intrinsic signal after cortical stimulation and even spontaneous seizures is so adequately high that no averaging is required (Suh et al, 2006; Zhao et al, 2007).
To remove the mechanical noise stemmed from the patient's breathing and heartbeat, a Chebyshev Type-II filter was used to dampen the noise frequencies in the stop band using custom-written software (Matlab, The Math Works, Natick, MA, USA). It is possible that changes in the intrinsic signal were artificially minimized as a result of the algorithm. Data were compared before and after noise removal and two-dimensional correlation coefficients were calculated. Data with R2 < 0.900 were excluded from the study.
The blood vessel artifact was then reduced using an automated algorithm that effectively clipped the images. As the change in reflection in the blood vessels was generally much greater than those in the parenchyma, we linearly plotted all pixel maxima and minima for a given trial. Pixels with extrema outside the dynamic range of the data, defined as the median ± 1.5 times the interquartile range, were found to spatially overlap with the blood vessels and were removed from the dataset. In addition, the blood vessels were further removed by visual inspection and masking. Each frame was then smoothed using a 3 × 3 pixel Gaussian mask to dampen local extrema.
For the IOS signal, changes in light reflectance were calculated as -AR/R for the raw data and fractional change for the spectroscopic data using custom-written software (Matlab, The Mathworks). The onset time of the signal at each pixel was defined as the first time point when the amplitude of the signal was statistically above/below (P <0.05) the prestimulus baseline (5 secs window before stimulation) using a two-tailed paired t-test with Bonferroni correction. Similarly, the offset time of the signal was defined as the first time point when the amplitude was not significantly different from the prestimulus baseline. The duration of the signal is the interval between the onset and the offset. The maximal amplitude of the signal was defined as the highest amplitude of all the pixels during the entire trace. The area of activation was calculated by choosing a threshold of 30% of the maximum amplitude in a given direction, a widely accepted method for thresholding in the intrinsic imaging literature (Berwick et al, 2008; Chen-Bee et al, 1996).
For the electrocorticography data, the onset time was determined from the moment of stimulus onset. The power of the AD was calculated, and the offset of the seizure was identified from the moment when the power of electrocorticography was not statistically different (P <0.05) from the prestimulus baseline using a two-tailed paired t-test with Bonferroni correction.
Pseudocolor images were generated for displaying the spatial distribution of the onset times of each of the hemodynamic components. To generate these images, the latency of the first statistically significant change for each individual pixel was assigned a color from a liner color scale. The onset map of each hemodynamic component (increased Hbt, increased Hbr, and decreased Hbr) was generated. We also calculated the onset time difference between the increase in Hbt and the increase (dip) or decrease (overshoot) in Hbr. The onset time difference for each individual pixel was defined as the onset time of the increase in Hbt minus the onset time of the dip or overshoot. A negative number indicates that the increase in Hbt occurs earlier than the dip or overshoot, and a positive number indicates that the increase in Hbt occurs later than the dip of overshoot. Pseudocolor images were also used to present the spatial distribution of the onset time difference between Hbt and Hbr changes.
Results
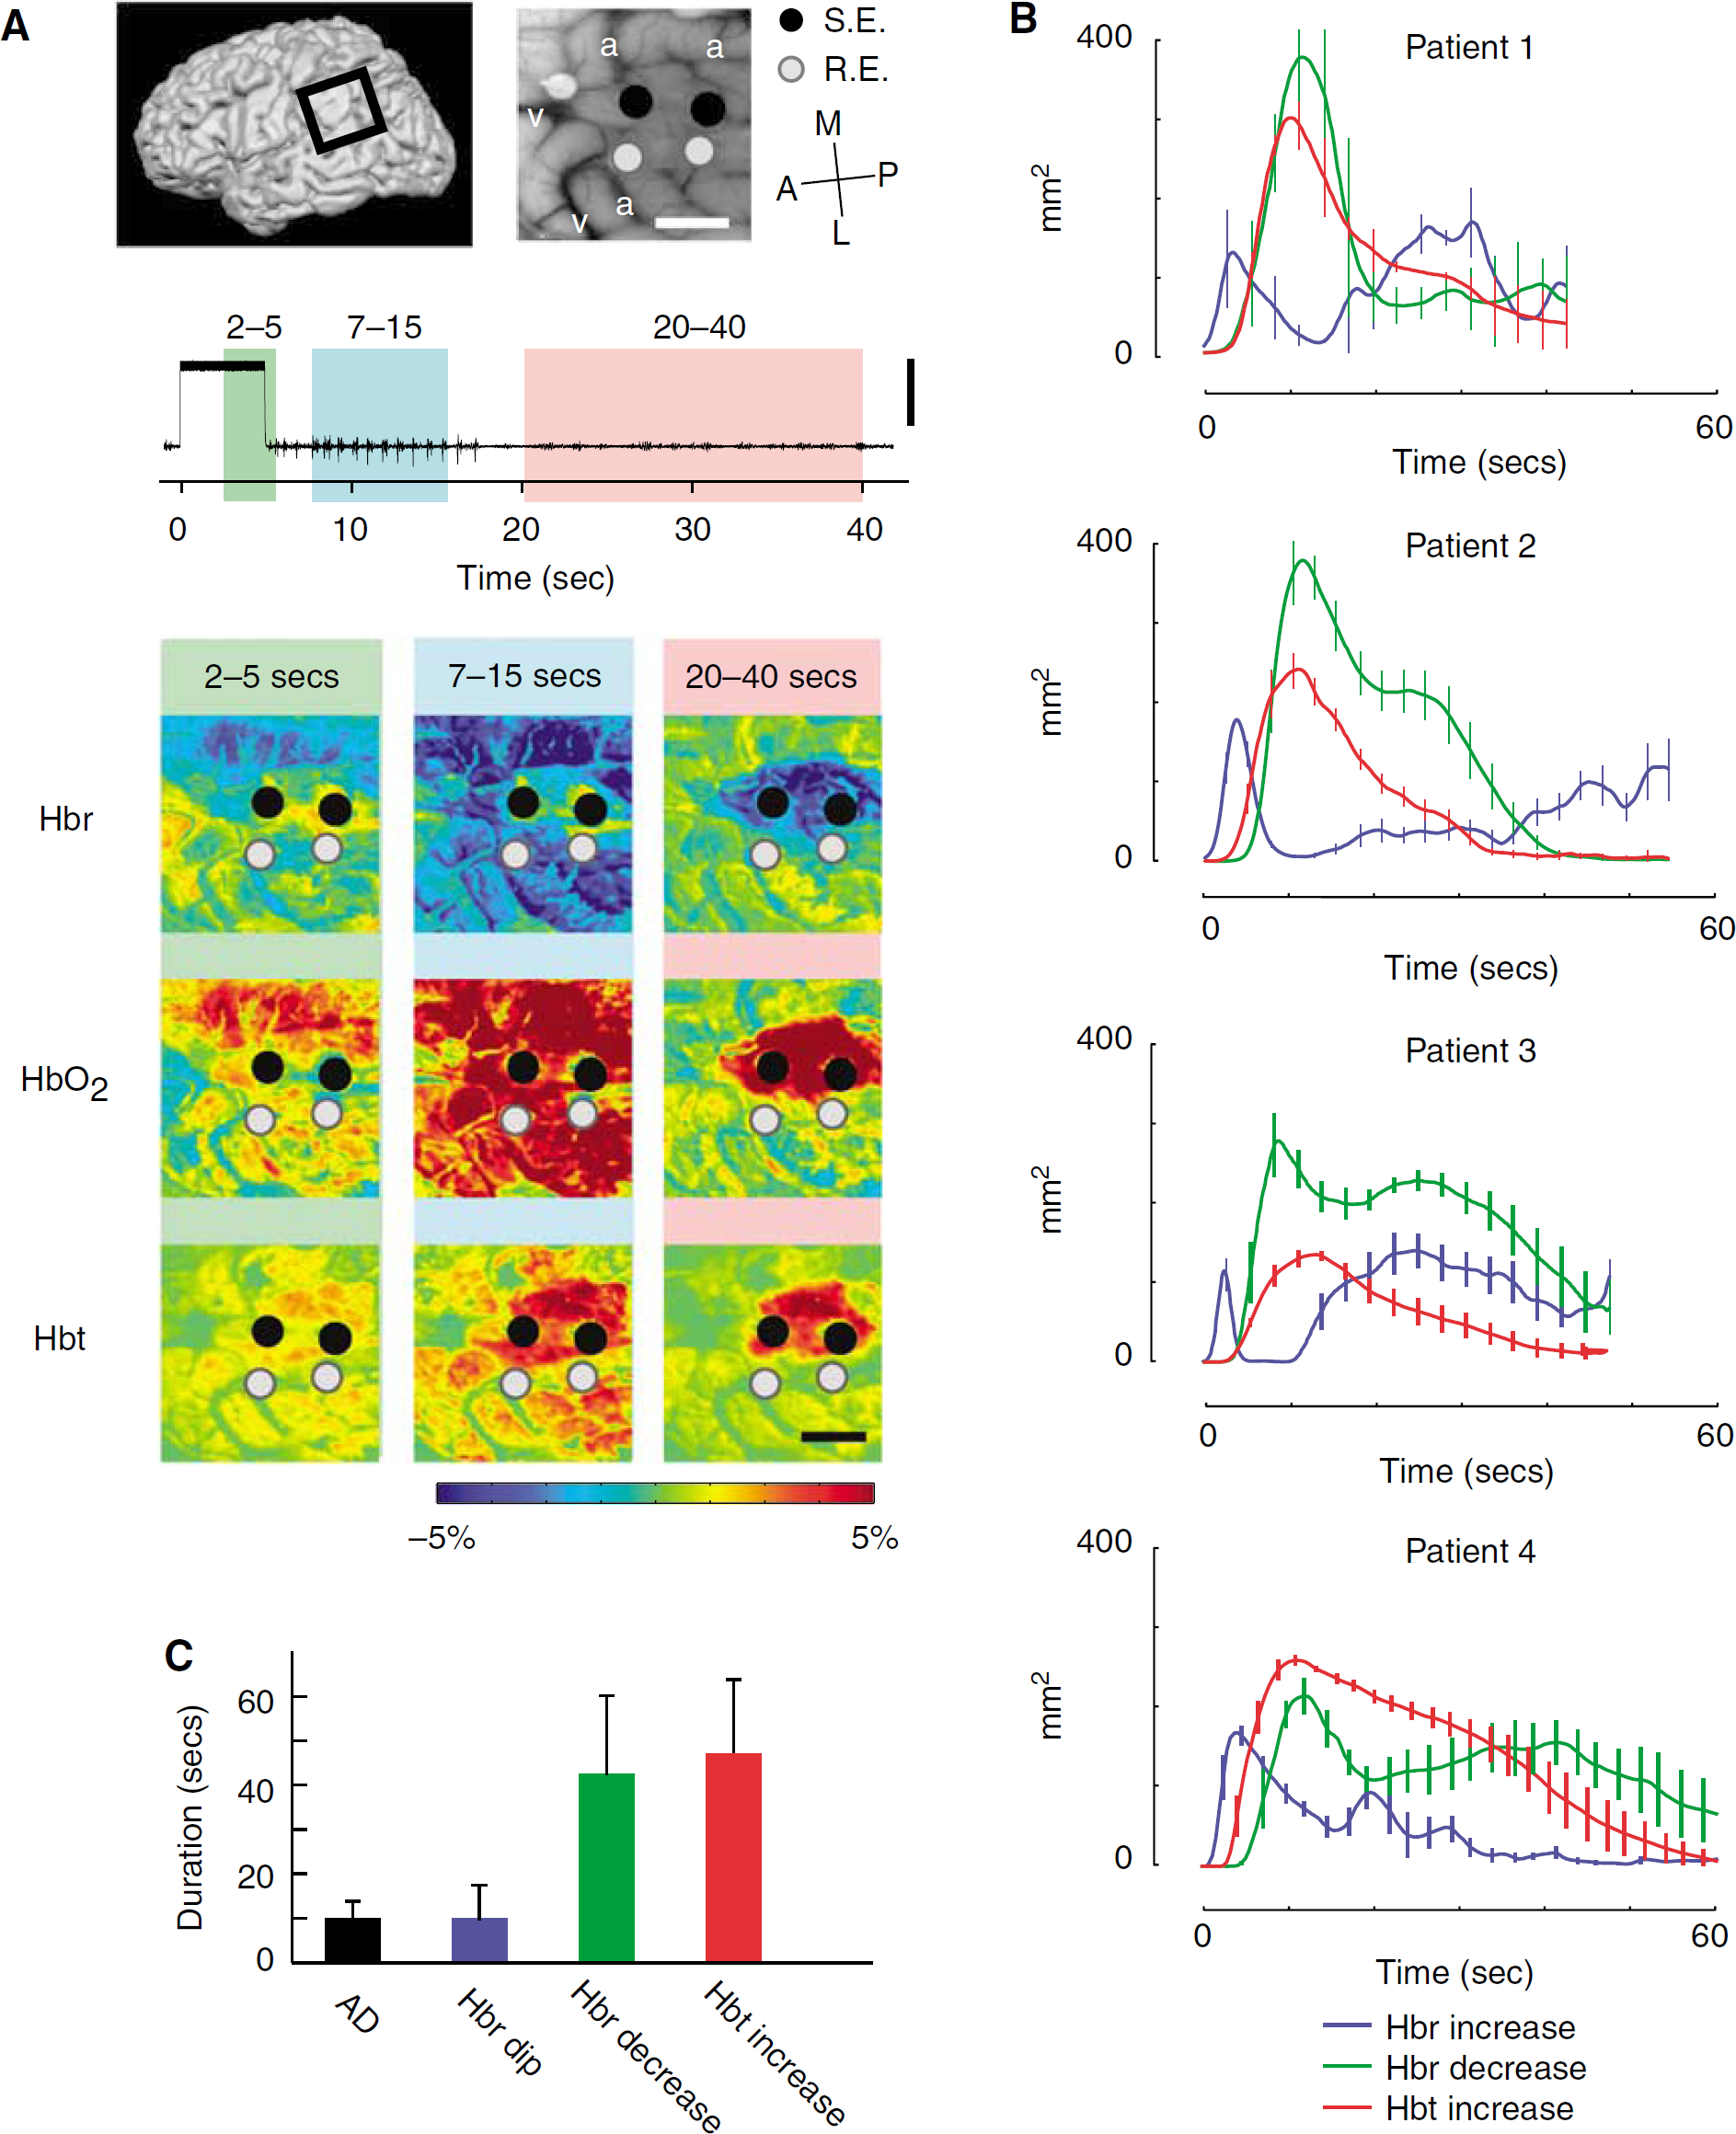
Afterdischarges (n = 33) were recorded from 4 subjects with an average (s.d.) duration of 10.4 ± 4.4 secs. Eleven ADs were recorded with dual-wavelength spectroscopic imaging (n=2 subjects), 10 ADs were recorded only at 570 nm, and 12 ADs were recorded only at 610 nm (n = 2 subjects). The time course of the intrinsic signal was similar in all patients at a given wavelength. Representative examples of ADs recorded from two separate patients in which 570 and 610 nm were recorded simultaneously are shown in Figures 1 and 2. The data recorded at 610 nm and the Hbr signal showed similar morphology, time course, and spatial extent (Figure 1). Similarly, the morphology, time course, and spatial extent of the data recorded at 570 nm were nearly identical to the Hbt signal (Figure 1). From pooled data in the two patients who underwent simultaneous 570 and 610 nm imaging, the R2 correlation coefficients between 570 nm and Hbt, and between 610 nm and Hbr were 0.999 and 0.980, respectively. When calculating the duration and intensity of signal changes, because we observed such a high correlation, we pooled the Beer-Lambert correlated data obtained from the two simultaneous imaging patients with the raw intrinsic signal imaging data from the two patients who underwent separate wavelength recordings. From this point on, we use Hbt and Hbr to indicate changes in 570 and 610 nm, respectively, unless otherwise indicated. It must be noted that the morphology, time course, and spatial extent of the HbO2 signal was an inverted version of the Hbr signal.
The Spatiotemporal Dynamics of the Hemodynamic Signals During an Afterdischarge
The Hbt signal, corresponding with CBV changes, consisted of a monophasic increase followed by a more gradual return to baseline that far outlasted the duration of the AD (Figures 1 and 2). Increases in Hbt in the stimulated gyrus arose focally and then quickly spread to the adjacent gyri, peaking at 14.5 ± 8.3 secs. The maximal amplitude was 12.0% ± 7.0%, without evidence of an inverted signal in the surrounding cortex (Figures 1 and 2). Significant changes persisted for an average of 48.8 ± 17.0 secs, which was 38.4 ± 17.5 secs longer than the AD duration (Figure 2C). The signal also seemed to become more focal over time; hence, a late focality was identified underneath the stimulating electrode (Figures 1 and 2). This finding will be discussed in more detail in the next section.
In contrast, the Hbr signal was more complex. In the cortex immediately beneath the stimulating electrodes, which is the presumed location of the onset of the AD, we recorded a focal increase in Hbr that inverted into a later decrease in Hbr. This initial dip in hemoglobin oxygenation lasted for an average of 11.5 ± 10.0 secs with a peak amplitude of 4.0% ± 1.9%, occurring at 3.0 ± 1.3 secs (Figures 1 and 2). The duration of the initial dip closely approximated the AD duration (Figure 2C). The initial dip then quickly inverted. This late Hbr decrease, or overshoot, persisted for 44.0 ± 17.6 secs (sometimes beyond the end of recording) with maximal amplitude of −7.4% ± 2.6%, which occurred at 30.3 ± 9.5 secs (Figures 1 and 2). The duration of the late Hbr decrease is similar in length to the Hbt increase (Figure 2C). Although the initial dip sometimes involved the gyrus adjacent to the stimulated gyrus, the signal was more focal than the increase in Hbt (Figures 1 and 2). Spatially, the overshoot started in the gyri surrounding the focus and evolved into the focus over time (Figures 1 and 2). This early Hbr decrease in the surround lasted for 19.9 ± 10.6 secs, with a peak of −7.9% ± 2.8%, occurring at 10.4 ± 3.0 secs.
In the two patients having multiwavelength spectroscopic imaging, the HbO2 signal was similar to the Hbr signal, but with an inverted orientation. Immediately after cortical stimulation, a decrease in HbO2 in the focus occurred, which lasted for 5.08 ± 2.29 secs, with a peak amplitude of −3.0% ± 1.0% that occurred at 3.08 ± 0.93 secs. The HbO2 concentration then increased for 30.83 ± 9.94 secs, with a peak amplitude of 6.0% ± 2.0% that occurred at 21.17 ± 8.26 secs. In the surround, HbO2 increased and remained elevated for 34.71 ± 12.92 secs, with a peak amplitude of 8.0% ± 2.0% that occurred at 11.67 ± 1.97 secs. As the HbO2 signal almost mirrored the Hbr signal, we will only report the data for the Hbr and Hbt signals.
Spatial Extent of ‘Early’ Versus ‘Late’ Signals
Averaging among all the ADs (n = 33), the spatial extents of the Hbr and Hbt signals were both temporally dependent (Figure 2B). During the earliest time period, from 2 to 5 secs after stimulus, the increase in Hbr was best localized in the gyrus under the stimulating electrode, spreading to an area of 183.6 ± 510 mm2 at its maximum spatial extent (at 2.5 ± 1.0 secs). During a later time period, from 7 to 15 secs, the Hbr signal inverted in the surround and this decrease reached its maximal spatial extent of 336.4 ± 98.2 mm2, which was significantly more diffuse than the initial Hbr increase (P < 0.001; Figures 1 and 2). During a ‘late’ phase between 20 to 40 secs, the Hbr decrease (overshoot) constricted to an area similar in size (203.73 ± 76.9 mm2) and location to the initial Hbr increase. We call this the ‘late focal overshoot’.
A later increase in Hbr, also known as the late undershoot, was found in 21 of 23 trials (Figure 2B). We calculated the spatial extent of the pixels (threshold = 30% maximum amplitude) with an increase in Hbr starting at least 20 secs from the stimulus onset. This effectively eliminated the signal from the initial dip. The maximum average area of this later undershoot was 148.3 ± 70.8 mm2, with a peak at 36.6 ± 12.5 secs. This third phase of the triphasic response frequently arose first in the surrounding cortex, and sometimes moved to the focus by the end of recording. However, the involved area was typically diffuse, not consistently focal and did not entirely lie within either of the cortical regions.
The spatial extent of the increase in Hbt was also temporally dependent. During the earliest time period, from 2 to 5 secs after stimulus, the signal was spatially restricted to the area under the stimulating electrodes. During a later time period from 7 to 15 secs after stimulus, the Hbt signal also reached its maximal spatial spread of 274.8 ± 76.9 mm2 (Figures 1 and 2). At this stage, unlike the Hbr signal, the Hbt increase involved both the focus and the surround. Finally, during a ‘late’ period between 20 to 40 secs, the area of the Hbt signal diminished gradually until only a small, focal area (118.7 ± 54.8 mm2) remained. Hence, a late focal region of restricted Hbt, or CBV, was identified, which co-localized with the region of onset of the AD.
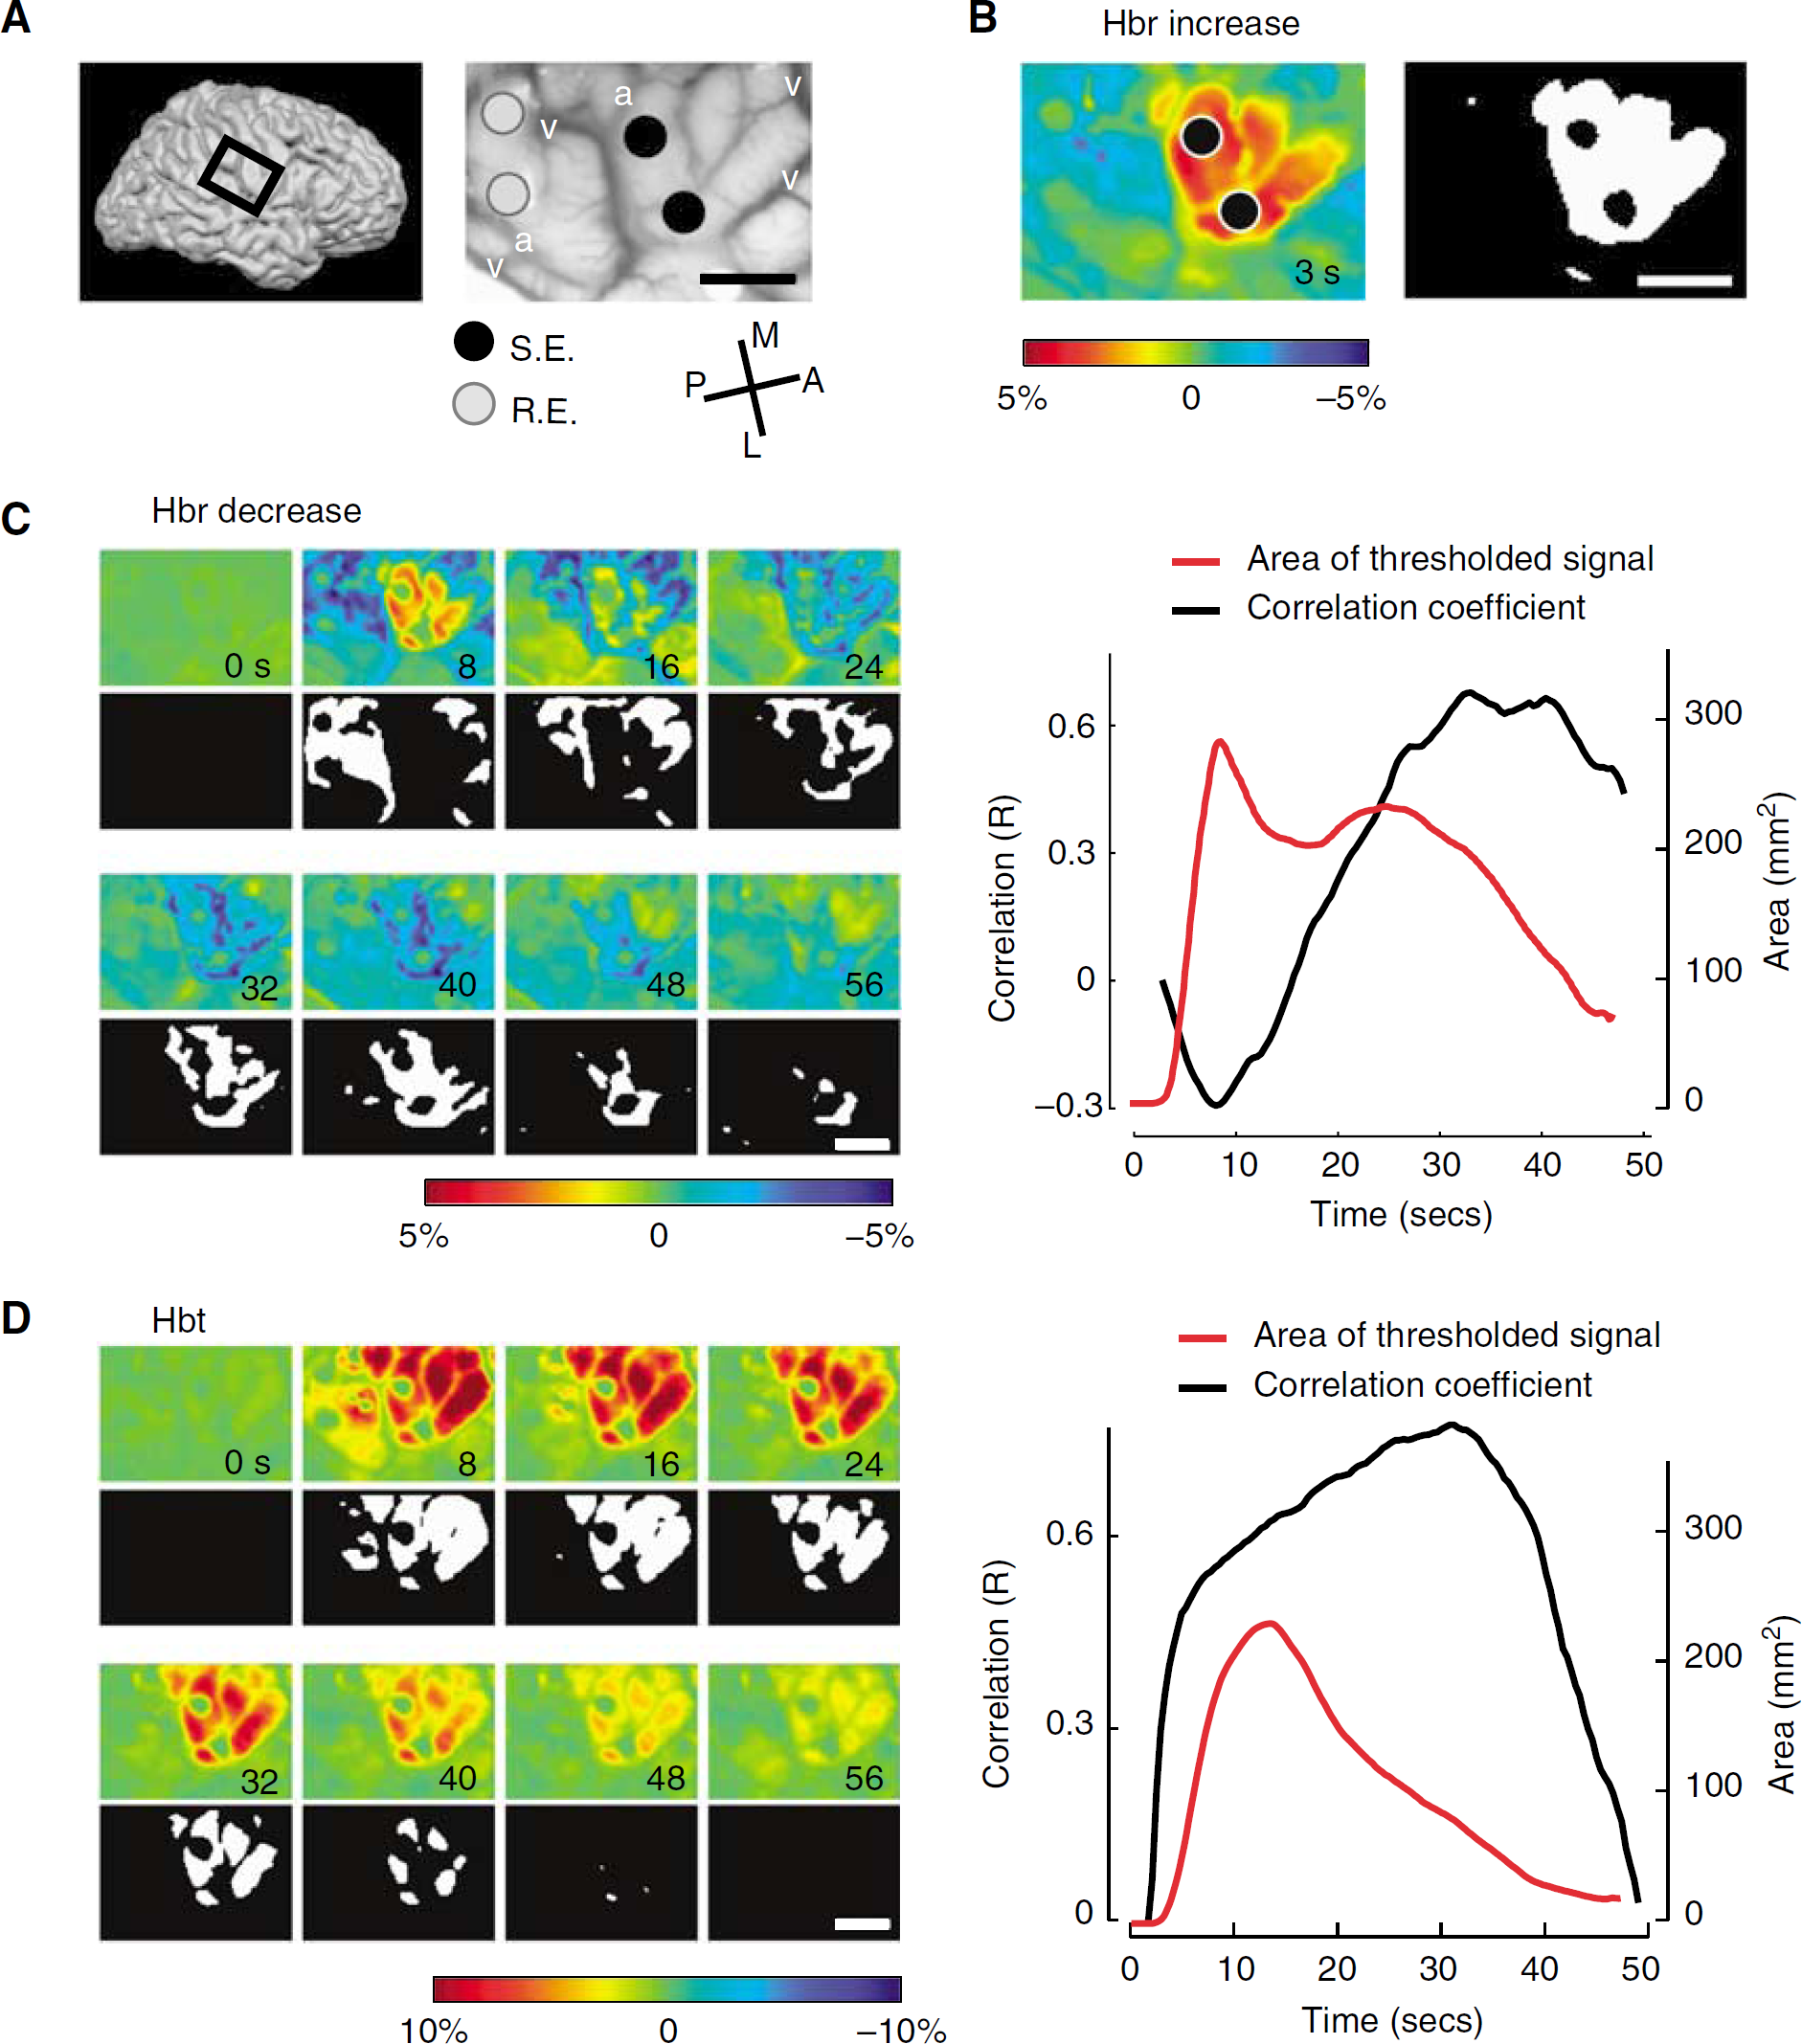
As both the decreased Hbr (overshoot) and increased Hbt signals grew progressively more focal over time, we calculated the two-dimensional correlation between the area of the Hbr initial dip under the stimulating electrodes and the location of the late Hbr overshoot and late increase in Hbt (Figure 3). Averaging among all trials, the overshoot correlated highly with the area of the initial dip at 31.6 ± 8.4 secs (r = 0.50 ± 0.15), and the increase in Hbt correlated well at 21.4 ± 9.1 secs (r = 0.60 ± 0.14). These results indicate that certain components of the hemodynamic response may be highly correlated with the site of the onset of long-duration epileptic events at later time points in their evolution. As the increased BOLD signal recorded with fMRI comprises the overshoot and an increase in CBV, the results of our study indicate that the BOLD signal may be highly focal 20 to 30 secs after seizure onset.
Cross-correlation of the early dip with the late overshoot and late CBV signal. (
The Influence of the Afterdischarge on the Initial Dip
As our epileptic events were triggered by cortical stimulation, it was not clear whether the electrical stimulus or the AD were a more significant trigger for the initial dip. To investigate which event had a greater influence on the dip, we calculated the slope of the focal increase in Hbr during the 5-sec period of cortical stimulation and during the duration of the subsequent AD. During cortical stimulation, the Hbr slope was always positive (7.3 × 10⁻⁴ ± 1.0 × 10⁻³). During the AD itself, the slope was always negative (−1.0 × 10⁻³ ± 7 × 10⁻⁴), indicating a decline in Hbr once electrocortical stimulation ceased. Hence, the metabolic demand of the AD by itself was not sufficient to deoxygenate hemoglobin. However, the AD occurred after the cortical stimulation, at which point neurovascular coupling mechanisms had a chance to induce a large increase in cerebral blood flow (CBF), whereas the metabolic activity increase elicited by the cortical stimulation preceded the reactive increase in CBF. However, the duration of the dip (11.5 ± 10.0 secs) closely approximated that of AD (10.4 ± 3.0 secs), and this duration was longer than the 2- to 3-sec dip induced by cortical stimulation in the absence of a subsequent AD (Suh et al, 2006) and was also longer than the 3-sec initial dip recorded in the human somatosensory cortex during normal sensory processing (Sato et al, 2002). The length of the dip indicates that the AD likely contributed to the duration of the dip. Comparing our data with an artificial dataset in which no AD was produced (Supplementary document), confirms that the AD contributed to the duration of the hemodynamic change (Supplementary Figure 1).
Latency of Intrinsic Signal Change
We further investigated the initiation and propagation of the hemodynamic signal. Although both Hbr and Hbt started increasing within 1 sec of stimulation, the earliest significant onset of the Hbr increase was 518 ± 210 ms, which was located adjacent to the stimulation electrodes (Figure 4A). The earliest significant onset of the Hbt signal was 926 ± 765 ms, which was also located at the cortex under the stimulating electrodes (Figure 4A). The onset time of the Hbt signal was significantly delayed compared with that of the Hbr signal (two-tailed t-test significant at P <0.05). However, in the surrounding area, the Hbr decrease (overshoot) occurred later than the Hbt increase (Figure 4B). The spatial distribution of the temporal delays between the Hbr and Hbt signals indicate the following events; an increase in metabolic demand in the stimulated gyrus elicits an early dip followed by an increase in CBF in both the focus and the surrounding cortex that then causes a decrease in Hbr (overshoot).
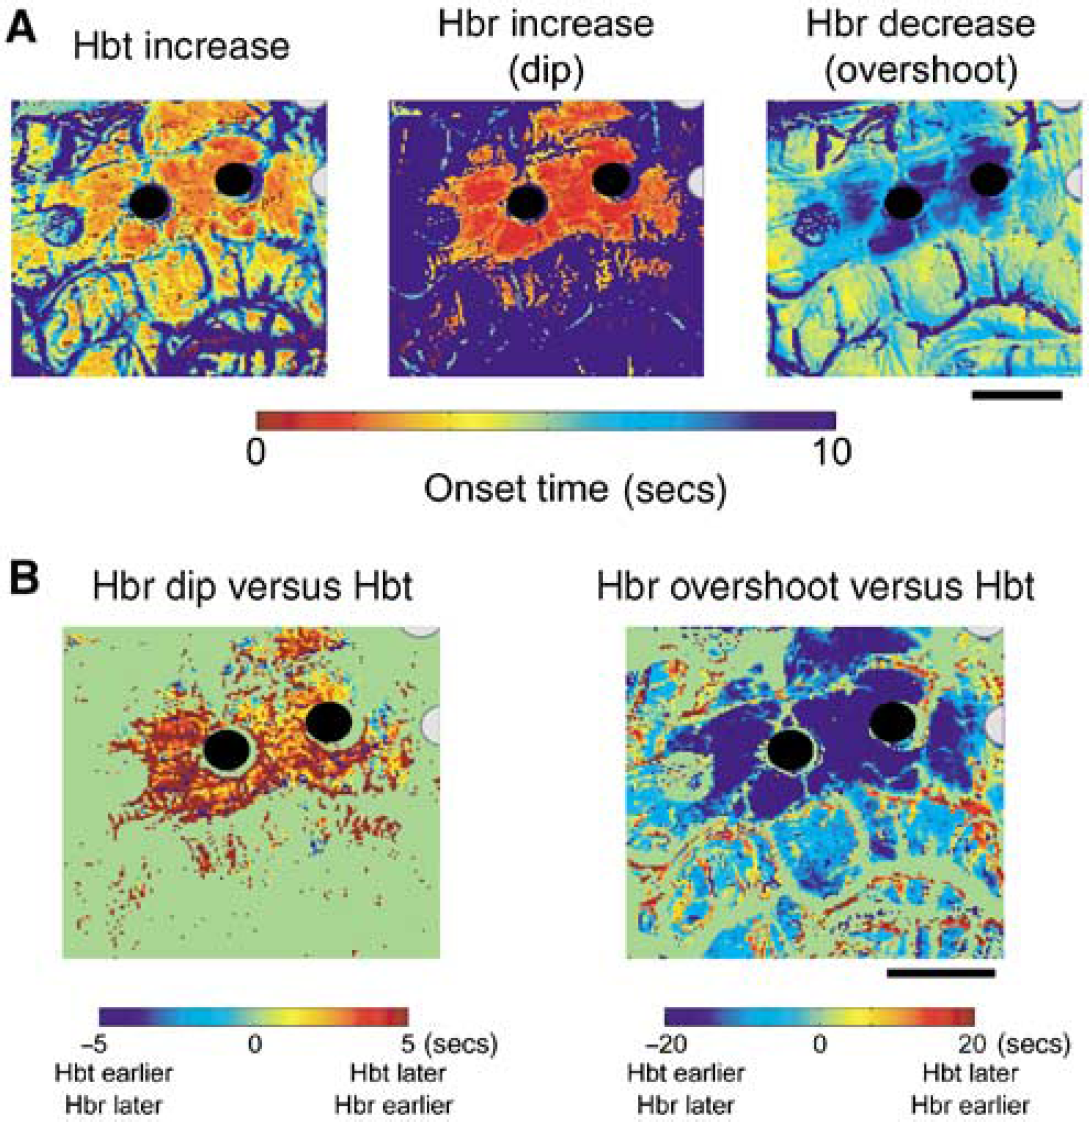
Example of the spatial distribution of the relative onset times of each component of the hemodynamic signal. (
Discussion
This study is the first report of IOS imaging of triggered seizure activity in the human brain at wavelengths sensitive to perfusion and oximetry. We elicited ADs using standard bipolar electrodes normally used to perform electrocorticographic recordings from the human brain, as well as for stimulation mapping. During cortical stimulation mapping, a brief train of 50 Hz stimulus is applied to the brain either to activate the motor or sensory function or to disrupt language function (Ojemann, 1993). The amplitude of stimulation is chosen to avoid ADs, which would spread to the adjacent gyri and disrupt the mapping process. We took advantage of this phenomenon and purposely induced ADs by increasing the amplitude of stimulation.
The significant findings are that stimulation-induced ADs elicit a long dip in hemoglobin oxygenation, which remains focally restricted to the site of the onset. Compared with the 3-sec duration of the dip occurring after normal cortical processing (Sato et al, 2002), triggered ADs elicit a longer duration dip, likely because of the dramatic increase in neuronal metabolism. However, signals arising from the increase in Hbt and the Hbr overshoot spread to the adjacent gyri and may not provide localizing information in the earlier time points (< 20 secs). After a delay of ~20 secs, the Hbr decrease, or overshoot, and Hbt increase overlap spatially with the focal initial dip, indicating an ideal timing for fMRI or even IOS epilepsy imaging. This late focal overshoot is a novel signal that may be specific to human epileptiform activity. Finally, as described in animal models (Chen-Bee et al, 2007), a later undershoot was also found in the majority of cases but with a smaller amplitude and varying spatial localization.
The Prolonged Early ‘Dip’ in Human Epilepsy
It is not surprising that seizure activity, which elicits a dramatic, sustained increase in neuronal activity and cerebral metabolism rate of oxygen (CMRO2) should produce a dip in hemoglobin oxygenation (Franck et al, 1986; Meldrum and Nilsson, 1976). However, seizures also induce a marked increase in CBF and for many years, it was thought that metabolic demand was adequately met by this enormous influx of oxygenated blood (Chassagnon et al, 2005; Ingvar and Siesjo, 1983; Nersesyan et al, 2004a). However, more recent studies in animal models using higher resolution IOS and fMRI, show a transient dip in hemoglobin oxygenation accompanying both interictal (Suh et al, 2005) and ictal events (Bahar et al, 2006; Schridde et al, 2008). Human IOS studies of epilepsy consist of a single case report, which showed a long ‘epileptic dip’ that lasted for the duration of the seizure (Zhao et al, 2007). In this study, we not only confirm the presence of a reproducible dip accompanying human triggered seizures in a larger series but also extend our understanding of its etiology.
Whether the initial dip is linearly, or at all causally, related to the degree of neuronal activity has been debated in several animal studies of normal cortical processing, many of which find no relation (Polley et al, 1999). The existence and amplitude of the dip was thought to be more of a function of the small signal-to-noise ratio of the signal and the subject's anesthetic level or blood gas tension (Mayhew et al, 2000). Our data provide direct evidence to the contrary, although it is not completely contradictory. The amplitude and duration of the dip after high-amplitude cortical stimulation and a triggered AD was clearly larger and longer than after normal somatosensory processing or subthreshold cortical stimulation in humans, for whom a dip of 3 and 2 to 3 secs was elicited, respectively (Sato et al, 2002; Suh et al, 2006). Similarly, the dip accompanying a full-blown spontaneous seizure has been reported to last several minutes in an unanesthetized human (Zhao et al, 2007); although the duration of the dip in this case may have been because of the lack of anesthesia, which is known to increase hemodynamic signals. Similarly, in a recent fMRI study of seizures in an animal model, the area of the brain with the highest metabolism displayed a negative BOLD signal, consistent with a persistent dip (Schridde et al, 2008).
Hence, the degree of metabolic activity is clearly one of the determinants of the dip amplitude. However, the dip began to decrease during the AD, indicating that the degree of metabolic demand associated with an AD may not be sufficient to maintain the dip in the face of functional cerebrovascular autoregulatory mechanisms, although the rate of decline may have been diminished by the demand of the ongoing epileptic activity. Hence, although the existence and duration of the dip may be partially dependent on the degree of the increase in metabolism, a significant contribution must also come from other perfusion-related factors, such as the rapidity of vasodilation, level of anesthesia, and saturation of hemoglobin as had been hypothesized from earlier animal studies.
The Late Focal Overshoot in Epilepsy
The second phase of the hemoglobin oxygenation response has been called the ‘overshoot’ or ‘positive BOLD’ signal, as it represents a decrease in Hbr and increase in HbO2 that form a significant component of the BOLD signal (Chen-Bee et al, 2007). The etiology of the overshoot arises from a nonspecific increase in CBF, which brings oxygenated blood to the region of active neurons and to the surrounding adjacent brain. Multiple studies in both animals and human have shown that this signal is less focal than the initial dip during normal cortical processing (Chen-Bee et al, 2007; Malonek and Grinvald, 1996; Polley et al, 1999; Sheth et al, 2004; Suh et al, 2006). Some animal data exist showing that the early component of the overshoot may provide a well-localized signal (Chen-Bee et al, 2007). Our human data do not support this claim, but rather we report a novel finding namely, a late focal overshoot that highly correlated with the area of cortical stimulation. One possible explanation for this finding is the long duration of the cortical stimulation in our study, which was often on the order of 10 to 20 secs when the direct stimulation is added to the length of the AD. Most studies of neurovascular coupling have involved shorter duration cortical stimulation (only a few seconds), which induces the dilatation of nonspecific upstream arterioles (Berwick et al, 2008; Iadecola et al, 1997). Recent animal data have illustrated that longer duration stimulation may involve a separate later mechanism of neurovascular coupling, which induces a delayed more focal increase in CBV on the order of the capillary or pericyte. Berwick et al (2008) describe a late focal increase in CBV, which was not accompanied by an associated decrease in Hbr nor an increase in HbO2 as in our study (Berwick et al, 2008). One possible explanation for persistent increases in hemoglobin oxygenation after triggered ADs would be the well-described postictal depolarization block (Dichter and Spencer, 1969). A prolonged focal decrease in metabolism, in combination with a prolonged focal increase in CBV might result in an increase in HbO2 and decrease in Hbr, which may be specific to the postictal state. These results raise the intriguing possibility that the BOLD signal may be more focal in the postictal state, and that later images might be highly localizing when not contaminated by the earlier nonspecific overshoot and CBV response, which dominate the signal for the duration of the seizure.
Early and Late Cerebral Blood Volume Response in Human Epilepsy
The increase in CBV measured with IOS arises from a complex interaction between dilating arterioles that increase CBF, brain compliance, venous compliance, and venous outflow (Buxton et al, 2004). Cerebral blood volume signals at their maximum amplitude are clearly less focal than early oxygenation signals. However, several studies in animals have shown that the early CBV signal is highly localized, with an amplitude and signal-to-noise ratio that may be higher or at least comparable to the initial dip, particularly if imaged at the level of the capillary rather than that of the arteriole (Sheth et al, 2004). The capillary-based regulation of CBF and CBV is supported by several lines of evidence. Precapillary arteriole corrosion cast studies reveal pericyte strictures indicating fine-scale vascular control (Harrison et al, 2002). Astrocyte endfeet and pericytes have also been shown to regulate local capillary diameter (Takano et al, 2006). Several studies have also shown that the CBV response starts in the parenchyma and passes in a retrograde fashion to the arterioles and arteries (Berwick et al, 2005). However, localization of normal functional architecture with early CBV responses may depend on the anatomic link between the penetrating arterioles and cortical columns (Woolsey et al, 1996). Although functional architecture may not seem directly relevant to epileptic spread, there is evidence that horizontal propagation may involve a sequential recruitment of cortical columns (Chervin et al, 1988), which may in turn recruit their vascular units.
In our study, the early CBV response was also extremely focal, but likely related more to the cortical stimulation than to the elicited AD, as the signal began within < 1 sec of stimulus onset, before the AD. However, the idea of imaging the onset of seizures using CBV remains just as compelling, because it is likely that focal seizures will also elicit a focal increase in CBV at their onset before lateral propagation of the seizure and upstream propagation of vascular dilatation. Early ictal CBV localization has already been shown with IOS in spontaneous human seizures (Haglund and Hochman, 2004; Zhao et al, 2007), as well as in animal studies (Bahar et al, 2006).
With regard to the negative intrinsic signal described around an epileptic focus, we did not report a similar finding at wavelengths sensitive to CBV, which might indicate shunting or steal of regional CBF (Bahar et al, 2006; Haglund et al, 1992; Schwartz and Bonhoeffer, 2001; Suh et al, 2005). However, earlier studies that found inverted intrinsic signals in the surrounding cortex, imaged interictal spikes (Schwartz and Bonhoeffer, 2001; Suh et al, 2005) or did not examine CBV-sensitive wavelengths (Haglund et al, 1992; Schwartz and Bonhoeffer, 2001). Another possibility is that shunting may occur in human seizures on a larger scale than the field of view of our camera. This notion is supported by ictal single photon emission computed tomography (SPECT) and fMRI studies that reveal decreases in CBF in neighboring lobes, but not in neighboring gyri in the human and animal brains during partial seizures (Englot et al, 2008; Van Paesschen et al, 2003), which correlate with neocortical slow waves (Englot et al, 2008).
The late focal CBV response we describe is reminiscent of a similar response described in animals during a long-duration sensory stimulation (Berwick et al, 2008). The etiology of this separate neurovascular coupling mechanism may be similar to the mechanisms involved in the early CBV response, namely local pericyte or astrocyte control of capillary dilatation separate from upstream arteriolar and arterial control (Takano et al, 2006). Another possibility is a smaller network of arterioles under separate control from larger arterioles (Nishimura et al, 2007).
The Triphasic Response in Human Epilepsy
The third phase of the triphasic response (referred to as the ‘undershoot’) follows the initial dip and overshoot, and represents a later increase in Hbr and decrease in HbO2. The undershoot is likely mediated by a different mechanism than the initial dip (Chen-Bee et al, 2007), and tends to occur in a different area of cortex than the dip. The undershoot is smaller than both the dip and the overshoot in amplitude, although it spreads across a similar total cortical area as the dip. Although the dip is caused by a rapid increase in Hbr stemming from an increase in CMRO2, the undershoot must be caused either by a more rapid decrease in CBF than in CBV or a persistent later nonneuronal increase in CMRO2 (Chen-Bee et al, 2007; Mandeville et al, 1999). We identified a late undershoot associated with human ADs. The signal was found in nearly all subjects, although it was fairly small in most of them, and occurred in the surrounding cortex away from the focus, at the perimeter of the late focal overshoot. Longer imaging may have highlighted this phenomenon in our human subjects. Mechanistically, if we presume that the focus is hypometabolic at this stage in depolarization block, then the surrounding cortex may be relatively hypermetabolic, which would cause an undershoot, as CBF is also decreased at this postictal time point.