
Abstract
Pharmacological studies using bradykinin B2 receptor antagonists suggest that bradykinin, an early mediator of inflammation and the main metabolite of the kallikrein-kinin system, is involved in secondary brain damage after cerebral ischemia. However, the time-course of bradykinin production and kinin receptor expression as well as the conclusive role of bradykinin B2 receptors for brain damage after experimental stroke have not been elucidated so far. C57/Bl6 mice were subjected to 45 mins of middle cerebral artery occlusion (MCAO) and 2, 4, 8, 24, and 48 h later brains were removed for the analysis of tissue bradykinin concentration and kinin B2 receptor mRNA and protein expression. Brain edema, infarct volume, functional outcome, and long-term survival were assessed in WT and B2−/− mice 24 h or 7 days after MCAO. Tissue bradykinin was maximally increased 12 h after ischemia (three-fold), while kinin B2 receptor mRNA upregulation peaked 24 to 48 h after MCAO (10- to 12-fold versus naïve brain tissue). Immunohistochemistry revealed that kinin B2 receptors were constitutively and widely expressed in mouse brain, were upregulated 2 h after ischemia in cells showing signs of ischemic damage, and remained upregulated in the penumbra up to 24 h after ischemia. B2−/− mice had improved motor function (P<0.05), smaller infarct volumes (–38%; P<0.01), developed less brain edema (–87%; P<0.05), and survived longer (P<0.01) as compared with wild-type controls. The current results show that bradykinin is produced in the brain, kinin B2 receptors are upregulated on dying cells, and B2 receptors are involved in cell death and brain edema formation after experimental stroke.
Introduction
The kallikrein-kinin system is one of the first inflammatory pathways activated after tissue damage. It is initiated by the activation of kallikrein that cleaves kininogen to produce the nonapeptide bradykinin. Bradykinin binds to the constitutively expressed B2 receptor, thereby exerting various actions, for example, increase of vessel permeability, induction of pain, and vasodilatation (Couture et al, 2001).
Particularly because of its ability to increase vessel permeability, the kallikrein-kinin system has been investigated for its ability to promote brain edema and secondary brain damage in various models of central nervous system (CNS) injury, for example, bacterial meningitis (Lorenzl et al, 1996), traumatic brain and spinal cord injury (Maier-Hauff et al, 1984; Unterberg and Baethmann, 1984; Unterberg et al, 1986; Marmarou et al, 1999; Pruneau et al, 1999; Stover et al, 2000; Gorlach et al, 2001; Pan et al, 2001; Plesnila et al, 2001a; Kaplanski et al, 2002; Hellal et al, 2003), and global cerebral ischemia (Kamiya et al, 1990, 1993; Kamiya, 1990; Lehmberg et al, 2003; see Raidoo and Bhoola, 1998; Plesnila and Relton, 2001 for a review). In experimental stroke, several studies using bradykinin B2 receptor antagonists showed reduced brain edema and infarct formation after transient and permanent occlusion of the middle cerebral artery (MCA) in mouse and rat (Relton et al, 1996, 1997; Zausinger et al, 2002; Ding-Zhou et al, 2003). Despite these encouraging results, the kallikrein-kinin system has not been studied further in focal cerebral ischemia. Therefore, it is still unknown whether and when bradykinin is released in ischemic brain parenchyma, and how the expression of bradykinin receptors is influenced by cerebral ischemia. In addition to these open questions, a recent publication describing a novel bradykinin receptor subtype with high amino-acid sequence homology to the B2 receptor (Boels and Schaller, 2003) may challenge the selectivity of previously used bradykinin B2 receptor antagonists. Therefore, the aim of the current study was to investigate the time-course of the production of bradykinin and the expression of kinin B2 receptor mRNA and protein in ischemic brain tissue and to elucidate the role of bradykinin B2 receptors for cell death and brain edema formation after focal cerebral ischemia by using bradykinin B2 receptor knockout mice.
MATERIALS AND METHODS
Transient Focal Cerebral Ischemia
Male C57/BL6 (body weight 18 to 22 g, Charles River, Sulzfeld, Germany) and bradykinin B2 receptor knockout (B2−/−) mice (body weight 18 to 22 g, Jackson Laboratory, Bar Harbor, ME, USA) initially generated by Borkowski et al (1995) were used for the current experiments. To reduce genetic variability, B2−/− mice were backcrossed with one of their genetic background strains, C57/BL6, for eight generations.
Transient focal cerebral ischemia was performed as previously described (Plesnila et al, 2001b, 2004). Briefly, anesthesia was initialized with 4% halothane, 30% O2, and 66% N2O and maintained with 1% halothane, 30% O2, and 69% N2O for the whole duration of surgery (<20 mins). Femoral artery catheterization for arterial blood pressure measurement and blood gas analysis was performed in a parallel group of animals subjected to the same anesthesia and surgery protocol (Table 1). Body temperature was maintained at 37.0°C±0.1°C with a feedback-controlled heating pad (Heater Control Module, FHC, Bowdoinham, ME, USA). A flexible laser-Doppler probe was glued onto the exposed left parietal skull over the territory of the MCA for continuous monitoring of regional cerebral blood flow (rCBF; Perimed 4001 Master, Perimed, Järfälla, Sweden). Thereafter, the left common and external carotid arteries were exposed and ligated. The common carotid artery was incised and a silicone-coated 8-0 nylon monofilament was pushed into the internal carotid artery until the laser-Doppler signal indicated occlusion of the MCA. Laser-Doppler flow during occlusion was 17%±7% and 18%±7% of baseline in C57/BL6 and B2−/− mice, respectively, indicating ischemic blood flow conditions in this area in both mouse strains. Wounds were sutured, the animals transferred to an incubator (32°C), and allowed to wake up. Forty-five minutes after MCAO, mice were shortly reanesthetized and ischemia was terminated by the removal of the intraluminal suture. For maintenance of body temperature after surgery, animals were retransferred to the incubator for another 2 h. Sham-operated animals underwent the same procedure without insertion of the occluding filament.
All procedures described are in accordance with local laws and were approved by the animal protection committee of the Government of Upper Bavaria.
Characterization of the Vascular Anatomy of C57/BL6 and B2−/− Mice
C57/BL6 and B2−/− mice (n = 5 each) were killed in deep halothane anesthesia by transcardial perfusion with 4% paraformaldehyde. Thereafter 200 μL of India ink was infused transcardially. The brains were removed and the territories of both middle cerebral arteries on the dorsal surface of the brain, together with the development of the posterior communicating artery (PcomA) were quantified, as previously described (Murakami et al, 1998; Maeda et al, 1999). The MCA territory is given in mm2, the development of the PcomA in arbitrary unity (0 = PcomA not present; 4 = PcomA fully developed).
Physiologic parameters 10 mins before, 15 mins after MCAO, and 15 mins after reperfusion after 45 mins of focal cerebral ischemia in WT and B2−/− mice
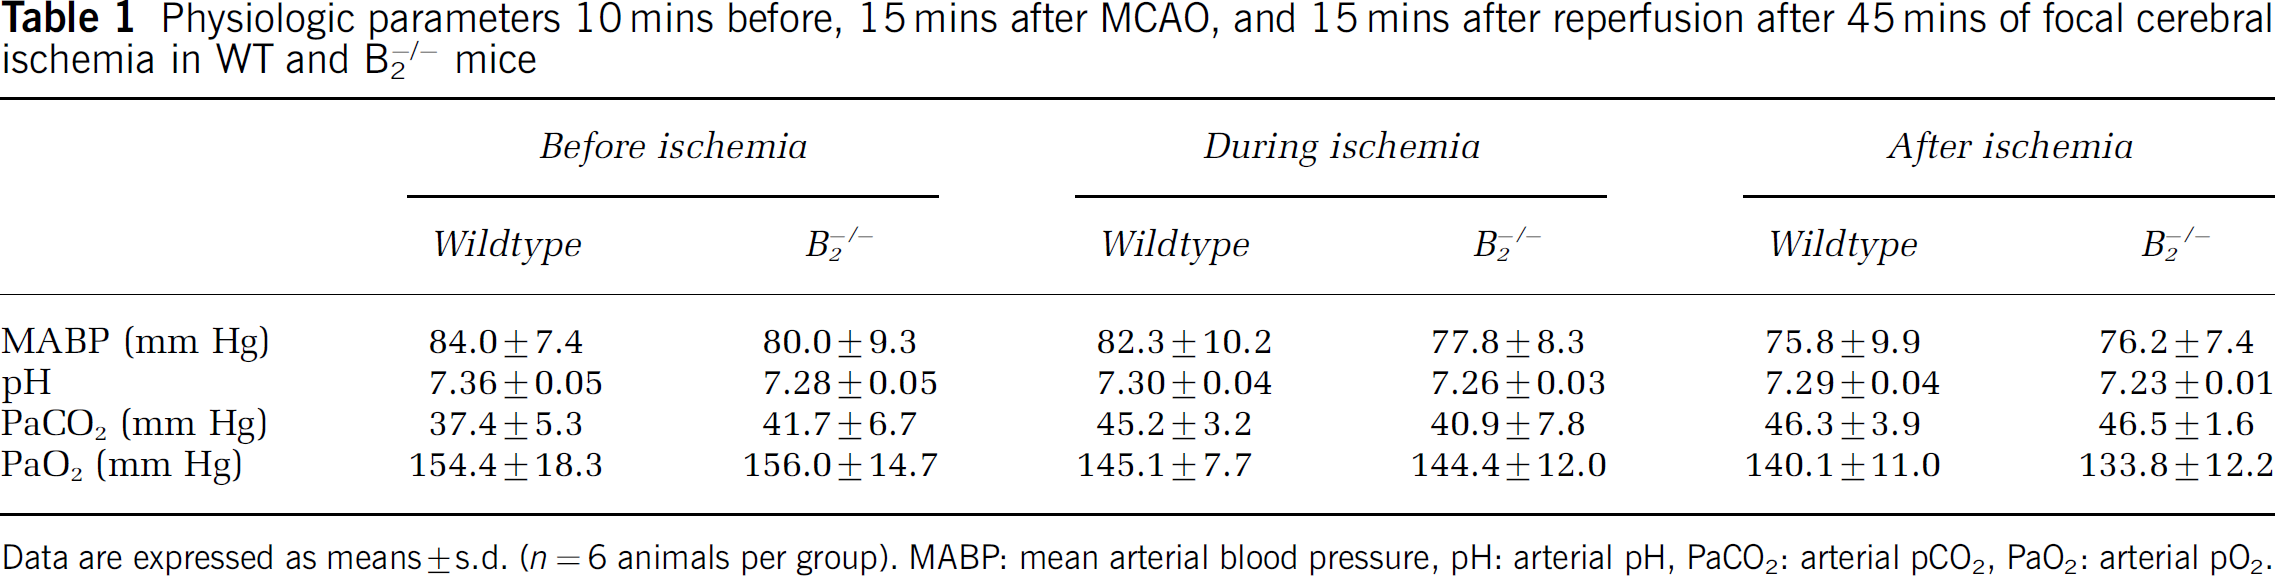
Data are expressed as means ± s.d. (n = 6 animals per group). MABP: mean arterial blood pressure, pH: arterial pH, PaCO2: arterial pCO2, PaO2: arterial pO2.
Measurement of Blood and Tissue Bradykinin Levels
Brain and blood (300 μL) from naive B2−/− mice, naive C57/BL6 mice, and C57/BL6 mice subjected to 45 mins of MCAO followed by 2, 4, 12, 24, or 48 h of reperfusion (n = 4 per group) were sampled and snap frozen in 2 mL ethanol precooled to –80°C. Measurements were performed as previously described (Nussberger et al, 1998). Briefly, after homogenization, ethanol extracts were evaporated under nitrogen at 37°C and the residues were dissolved in 140 μL 10 mmol/L acetic acid. Bradykinin was separated from precursors and metabolites that may crossreact with the antiserum by isocratic HPLC (Hewlett Packard 1090A, Agilent Technologies, Palo Alto, CA, USA). Then rabbit antiserum 1881 (final dilution 1:35,000) and 125iodine-labelled bradykinin (New England Nuclear, Herts, UK) were added to the samples or to known amounts of bradykinin (0.06 to 125 fmol (Peninsula Labs, St Helens, UK)) for RIA. Samples were incubated at 4°C for 24 h. Thereafter, antibody-bound and free bradykinin were separated by addition of 0.2 mL dextran-coated charcoal (1% suspension in water). Bradykinin was quantified by comparison of the percentage bound radioactivity of unknown samples with that of standards. Personnel who performed these assays were not aware of the origin of the samples.
Quantification of Kinin B2 Receptor mRNA by Real-Time Polymerase Chain Reaction
Brains from naive, sham-operated (3 and 24 h after surgery), or C57/BL6 mice subjected to focal cerebral ischemia (1, 3, 8, 24, or 48 h after reperfusion) were removed, placed in ice-cold phosphate-buffered saline (PBS) and cut in 4-mm-thick coronal sections (n = 2 per group). Samples from the striatum and from the latero***parietal cortex representing the core and the penumbra of the infarct, respectively, were dissected and total RNA was isolated using NucleoSpin RNA II Kit (Macherey-Nagel, Düren, Germany). Complementary DNA (cDNA) was prepared from RNA (2 μg) in 30 μL reverse transcription buffer (Gibco BRL, Paisley, Scotland, UK) supplemented with 0.5 mmol/L each of dATP, dGTP, dCTP, and dTTP (Eppendorf, Hamburg, Germany), 32 U RNase inhibitor (Roche Molecular Biochemicals, Mannheim, Germany), 400 U of Moloney murine leukemia virus reverse transcriptase (MMLV-RT, Gibco BRL, Paisley, Scotland), 10 mmol/L dithiotreitol, and 1.5 mmol/L p(dT)15 primer (Roche Molecular Biochemicals, Mannheim, Germany) at 37°C for 60 mins. Subsequently, the reaction mixture was heat-inactivated for 10 mins at 95°C.
Complementary DNA (20 ng) and gene-specific primers (300 nmol/L) were added to QuantiTect SYBR® Green PCR master Mix (Qiagen, Hilden, Germany) containing SYBR green I dye, ROX (passive reference dye), HotStarTaq DNA polymerase (QIAGEN, Hilden, Germany), dNTP mix including dUTP, and optimal buffer components.
Polymerase chain reaction (PCR) primers were designed using Beacon Designer software (Biorad, Hercules, CA, USA) based on the given GenBank Accession Numbers:
Mouse β-Actin (X03672): CCACTGCCGCATCCTCTTCC and CGCTCGTTGCCAATAGTGATGAC.
Mouse kinin B2 receptor (NM_009747): CACTGTGGCC GAGATCTACCT and GGCACAACACCTCTCCAAACA.
Twenty-five microliters of PCR reaction mix were then amplified (1 cycle at 95°C for 15 mins and 40 cycles at 94°C for 15 secs, 60°C for 30 secs, 72°C for 30 secs, and 95°C for 1 min) using an iCycler iQ (Biorad, Hercules, CA, USA). To verify the presence and the predicted size of specific amplified fragments, real-time PCR products were separated by electrophoresis and visualized in 4% bis-tris E-Gels (Invitrogen, Carlsbad, CA, USA) containing ethidium bromide. For each sample-primer set, a melting curve was performed increasing the temperature from 55°C to 95°C. Neither primer dimer formation nor nonspecific amplification products were detected.
Specifically amplified transcripts were quantified using the comparative threshold cycle method using β-actin as normalizer and the corresponding sample from the contralateral hemisphere (baseline) as internal controls. Comparative expression level = 2−ΔΔCT [CT = threshold cycle, ΔCT = CT(target)—CT(normalizer), ΔΔCT = ΔCT—ΔCT (baseline)].
Standard curves (initial amount of cDNA versus CT values) were performed for each set of primers showing that for the same range of total cDNA amplification, efficiency of target genes and normalizer (β-actin) were equal.
Immunohistochemistry for Kinin B2 Receptors
C57/BL6 mice subjected to 45 mins of MCAO or sham surgery and were killed 2, 4, 8, or 24 h after reperfusion (n = 4 per group) by transcardial perfusion with 4% paraformaldehyde solution (PFA) in deep halothane anesthesia. Brains were removed, postfixed in 4% PFA overnight, dehydrated, and embedded in paraffin. Five-micrometer-thick coronal sections were prepared on conventional glass slides coated with amino-propyltri-ethoxy-silane (Merck, Darmstadt, Germany). Nonspecific binding was blocked for 20 mins with horse serum (Vectastain Elite ABC kit PK-6200, Vector Laboratories, Burlingame, CA, USA) and endogenous peroxidase activity was blocked with 3% H2O2 in methanol for 10 mins. A mouse monoclonal antibody raised against a peptide mapping the C-terminus of human bradykinin B2 receptor (1:250, BD Biosciences/Transduction Laboratories, San Jose, CA, USA) was used as primary antibody and was applied in PBS containing 2% BSA and 0.3% Triton X-100 overnight at 4°C. Thereafter, the sections were incubated with 100 μL of a horse anti-mouse/rabbit biotinylated secondary antibody (BA-1400, Vector Laboratories, Burlingame, CA, USA) together with 100 μL universal blocking solution, according to the manufacturer's instructions (Vectastain Elite ABC kit, PK-6200, Vector Laboratories, Burlingame, CA, USA), for 60 mins at room temperature. Visualization was performed using amino-9-ethylcarbazole (AEC-Kit, Vector Laboratories, Burlingame, CA, USA).
Quantification: Two sections passing through the infarcted brain (bregma 0.5 and –2.5 mm) were selected from each animal. In these sections, four regions of interest (ROI; 0.3 mm × 0.2 mm) were selected: two in the middle (3.2 mm lateral and 2.5/3.5 mm deep; core) and two in the upper and lower margins of the infarcted cortex (2.5/3.1 mm lateral and 1.5/4.5 mm deep; penumbra). In these ROIs, all structures identified as cells (irrespective if normal, injured, or dead) were counted with respect to their staining pattern for the kinin B2 receptors. The staining pattern was divided into two categories: normal (as shown in Figure 3B) or altered (increased staining intensity, immunoreactivity of the cell membrane). Because cell density in the investigated areas decreased after cerebral ischemia, the results were expressed as percent of cells within the ROI. As a control, cells were also counted in the same area of sham-operated animals. A total of eight ROI's in five animals were examined in each group.
Western Blot Analysis of Kinin B1 Receptor
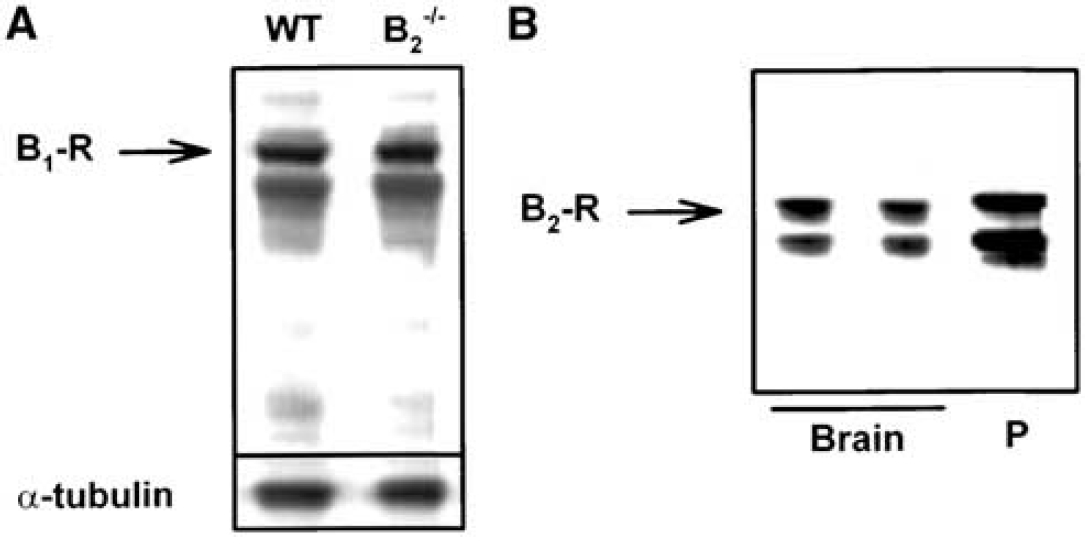
Western blot analysis on cell lysates from mouse brain was performed using a similar technique as previously described (Plesnila et al, 2004). Briefly, 20 μg protein was loaded together with 7 μL SeeBlue plus 2 molecular weight marker (Invitrogen, Karlsruhe, Germany) on 10% NuPage Bis-Tris gels (Invitrogen, Karlsruhe, Germany), separated by electrophoresis, and blotted overnight onto Hybond PVDF membranes (Amersham Biosciences, Freiburg, Germany). Blots were then probed with an affinity-purified rabbit polyclonal antibody raised against a peptide mapping the N-terminus of mouse B1 receptor (1.5 μg/mL) or with the same B2 antibody as used for immunohistochemistry (see above) at 4°C overnight. Membranes were then exposed to a rat anti-rabbit HRP-conjugated secondary antibody (DakoCytomation, Hamburg, Germany, 1:5,000). Antibody binding was detected colorimetrically with an Opti-4CN substrate (Opti-4CN Substrate Kit, Bio-Rad Laboratories, Munich, Germany). Equal protein loading was shown by stripping and reprobing the membrane with an anti-α-tubulin antibody (B-7, 1:1,000, Santa Cruz Biotechnology, Santa Cruz, CA, USA).
Infarct Volume
C57/BL6 and B2−/− mice (n = 7 per group) were killed 24 h after reperfusion. Infarct area was quantified on cresyl violet/Nissl-stained 10 μm coronal sections (n = 12) taken at 750 μm intervals using an image analysis system (Optimas 5.1, MediaCybernetics, Carlsbad, CA, USA). Lesion volume was calculated as previously described (Plesnila et al, 2001b; Zweckberger et al, 2003). Data are expressed as percent of contralateral hemisphere to correct for differences in brain size and brain edema.
Brain Edema
C57/BL6 and B2−/− mice (n = 4 per group) were killed 24 h after reperfusion, at the time point of maximal brain edema formation. Brains were removed, hemispheres separated, and weighed to assess the wet weight (WW). Thereafter, the hemispheres were dried for 24 h at 110°C and the dry weight (DW) was determined. Hemispheric water content (%) was calculated using the following formula: ((WW-DW)/WW) × 100.
Functional Outcome
Motor function was tested using a five-point score (0 to 4), as previously described (Plesnila et al, 2001b): 0 = normal motor function, 1 = flexion of torso and contralateral forelimb on lifting the animal by the tail or failure to extend the forepaw when suspended vertically, 2 = circling to contralateral side but normal posture at rest, 3 = leaning to contralateral side at rest, and 4 = no spontaneous motor activity.
Long-term survival of C57/BL6 and B2−/− mice after MCAO was assessed over a period of 7 days (n = 10 per group).
Statistical Analysis
Results are presented as means±standard deviation (s.d.). Survival analysis was performed using the Peto test (Statistica, StatSoft, Tulsa, OK, USA). For all other statistical analysis SigmaStat 2.0 software was used (Jandel Scientific, Erkrath, Germany). For comparisons between groups, we used the Mann-Whitney rank sum test. Measurements over time (physiology and rCBF) were tested versus baseline with Friedman's Repeated Measures ANOVA on Ranks followed by Dunn's or Dunnett's All Pairwise Multiple Comparison Procedure as post hoc test. P<0.05 was considered statistically significant.
RESULTS
Bradykinin Levels in Blood and Brain
With the currently used method, we were able to measure baseline levels of bradykinin in blood and brain of naïve mice. In C57/Bl6 wild-type mice (n = 4), blood bradykinin was 1.8±0.6 fmol/g, while B2−/− mice (n = 4) had significantly higher blood bradykinin levels (5.8±3.0 fmol/g; P<0.03). Tissue bradykinin was 3.1±1.4 fmol/g in C57/BL6 wild-type mice (n = 16) and did not differ significantly from values found in B2−/− (2.5±1.4 fmol/g; n = 10).
After ischemia, blood as well as tissue bradykinin levels increased over time, reaching a maximum 12 h after reperfusion (Figure 1). In blood, the bradykinin level increased from 1.8±0.6 fmol/g in naïve animals to 4.0±4.0 and 5.5±4.8 fmol/g, 4 and 12 h after reperfusion, respectively, and returned to baseline 24 h after reperfusion (1.8±0.3 fmol/g). Brain tissue bradykinin concentrations increased 3-fold at 12 h after reperfusion (from 3.1±1.4 to 9.5±3.9 fmol/g; P<0.05) and returned to baseline levels 12 h later (3.7±3.6 fmol/g).
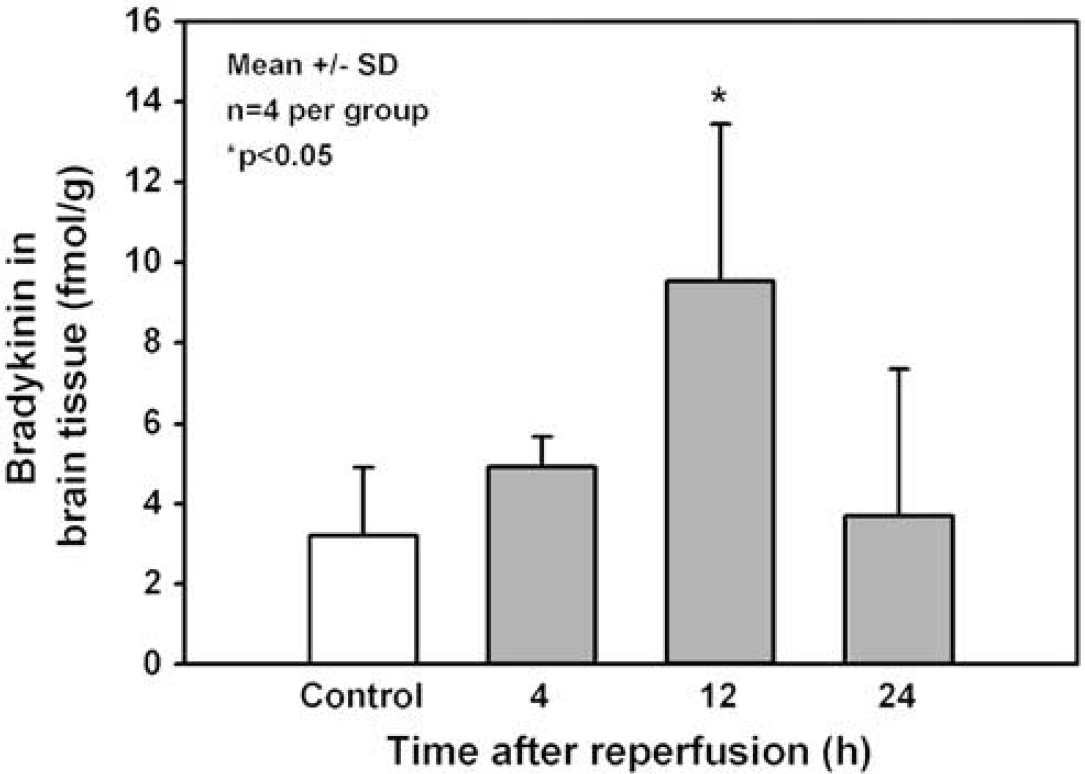
Brain tissue bradykinin at different time points after 45 mins of MCAO in wild-type mice. Brain tissue bradykinin was significantly increased 12 h after cerebral ischemia (P<0.05).
Kinin B2 Receptor mRNA Expression
Kinin B2 receptor mRNA expression was analyzed by quantitative real-time PCR in naïve mouse brain as well as in the ischemic core and penumbra of mice subjected to 45 mins of transient focal cerebral ischemia. We detected robust signals for kinin B2 receptor mRNA in mouse brain (Figure 2). Surgery and anesthesia had no effect on bradykinin B2 receptor mRNA expression, while cerebral ischemia induced considerable upregulation in the ischemic core and penumbra 24 to 48 h after the insult (Figure 2). B2 receptor mRNA levels reached a maximum of 12 to 14 times of baseline in the infarct core 24 to 48 h after reperfusion (Figure 2A). In the penumbra, the B2 receptor was upregulated 13 times of baseline at 24 h after reperfusion and was downregulated thereafter (Figure 2B).
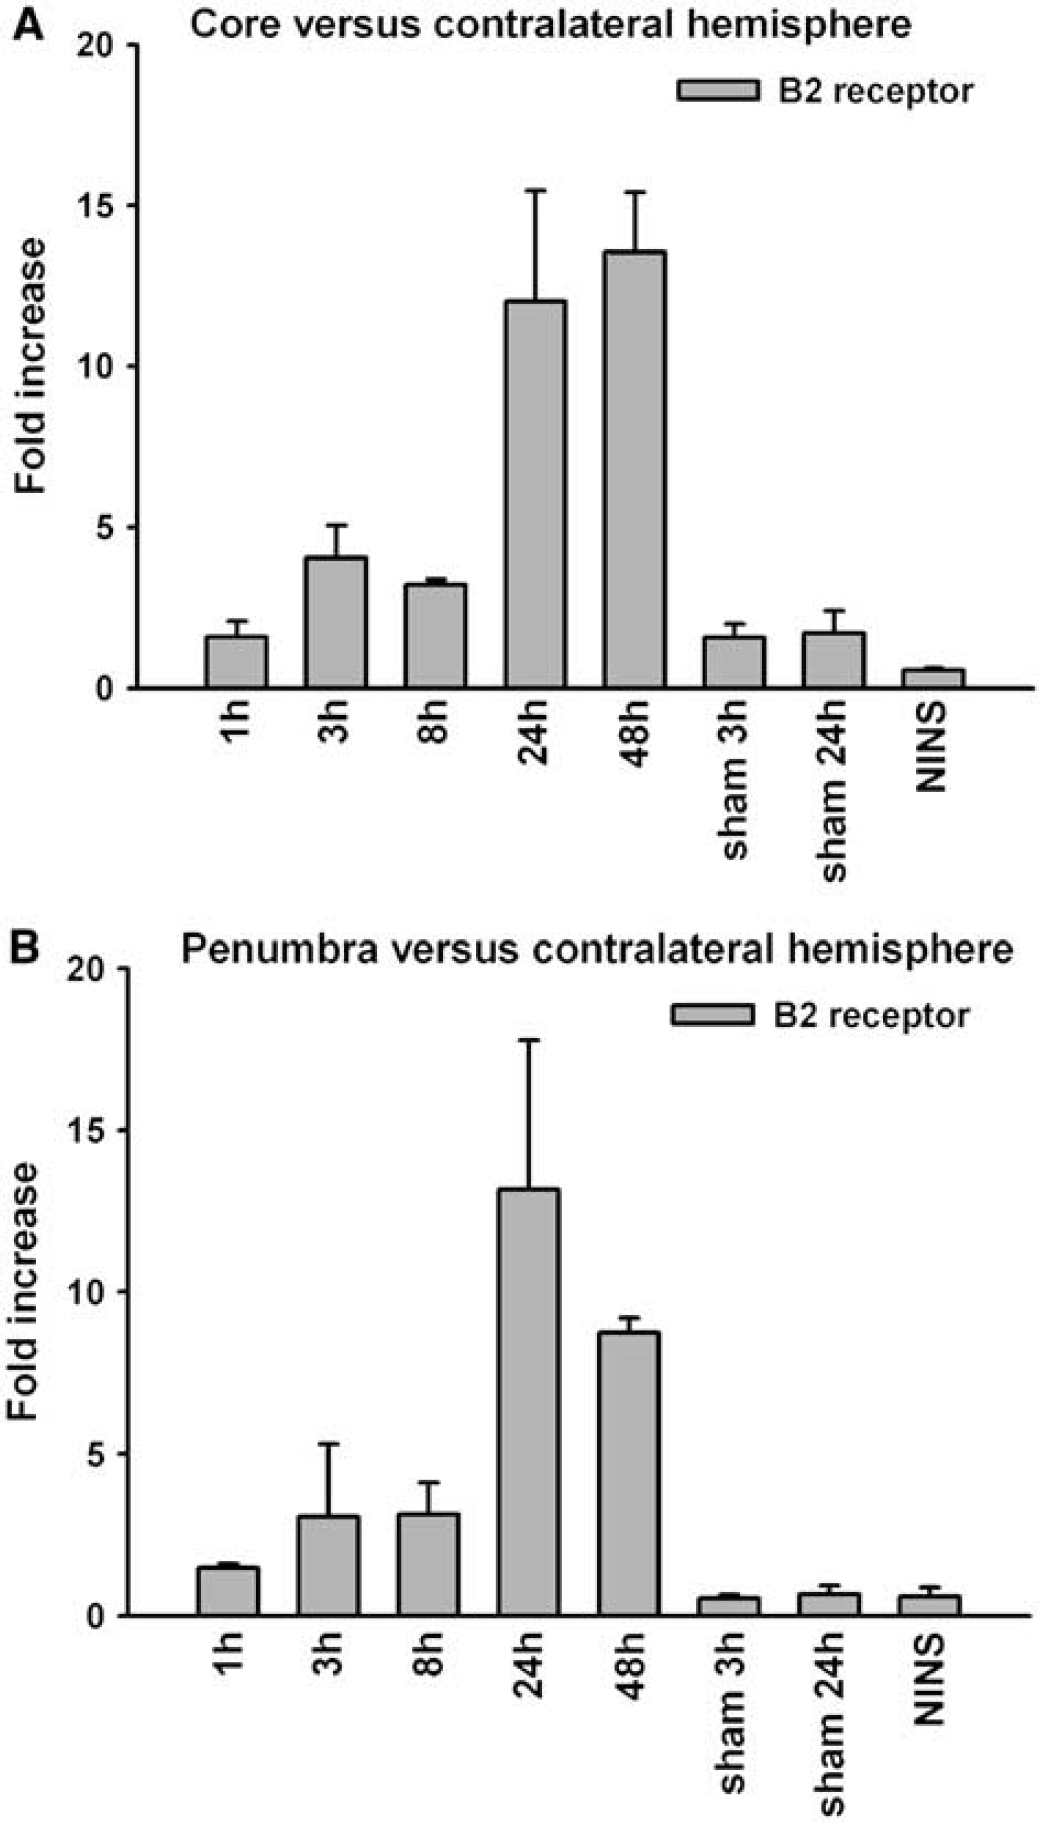
Quantification of kinin B2 receptor mRNA in the infarct core and in the penumbra after 45 mins of MCAO in wild-type mice by real-time PCR. Tissue for infarct core was taken from the ischemic striatum, tissue for the penumbra from the adjacent cortex. Sham-operated animals killed 3 or 24 h after surgery and animals without surgery and ischemia (no-ischemia, no-surgery, NINS) were used as controls. Results were normalized for β-actin expression and receptor expression in the contralateral, healthy tissue. Data for kinin B2 receptor expression in core (
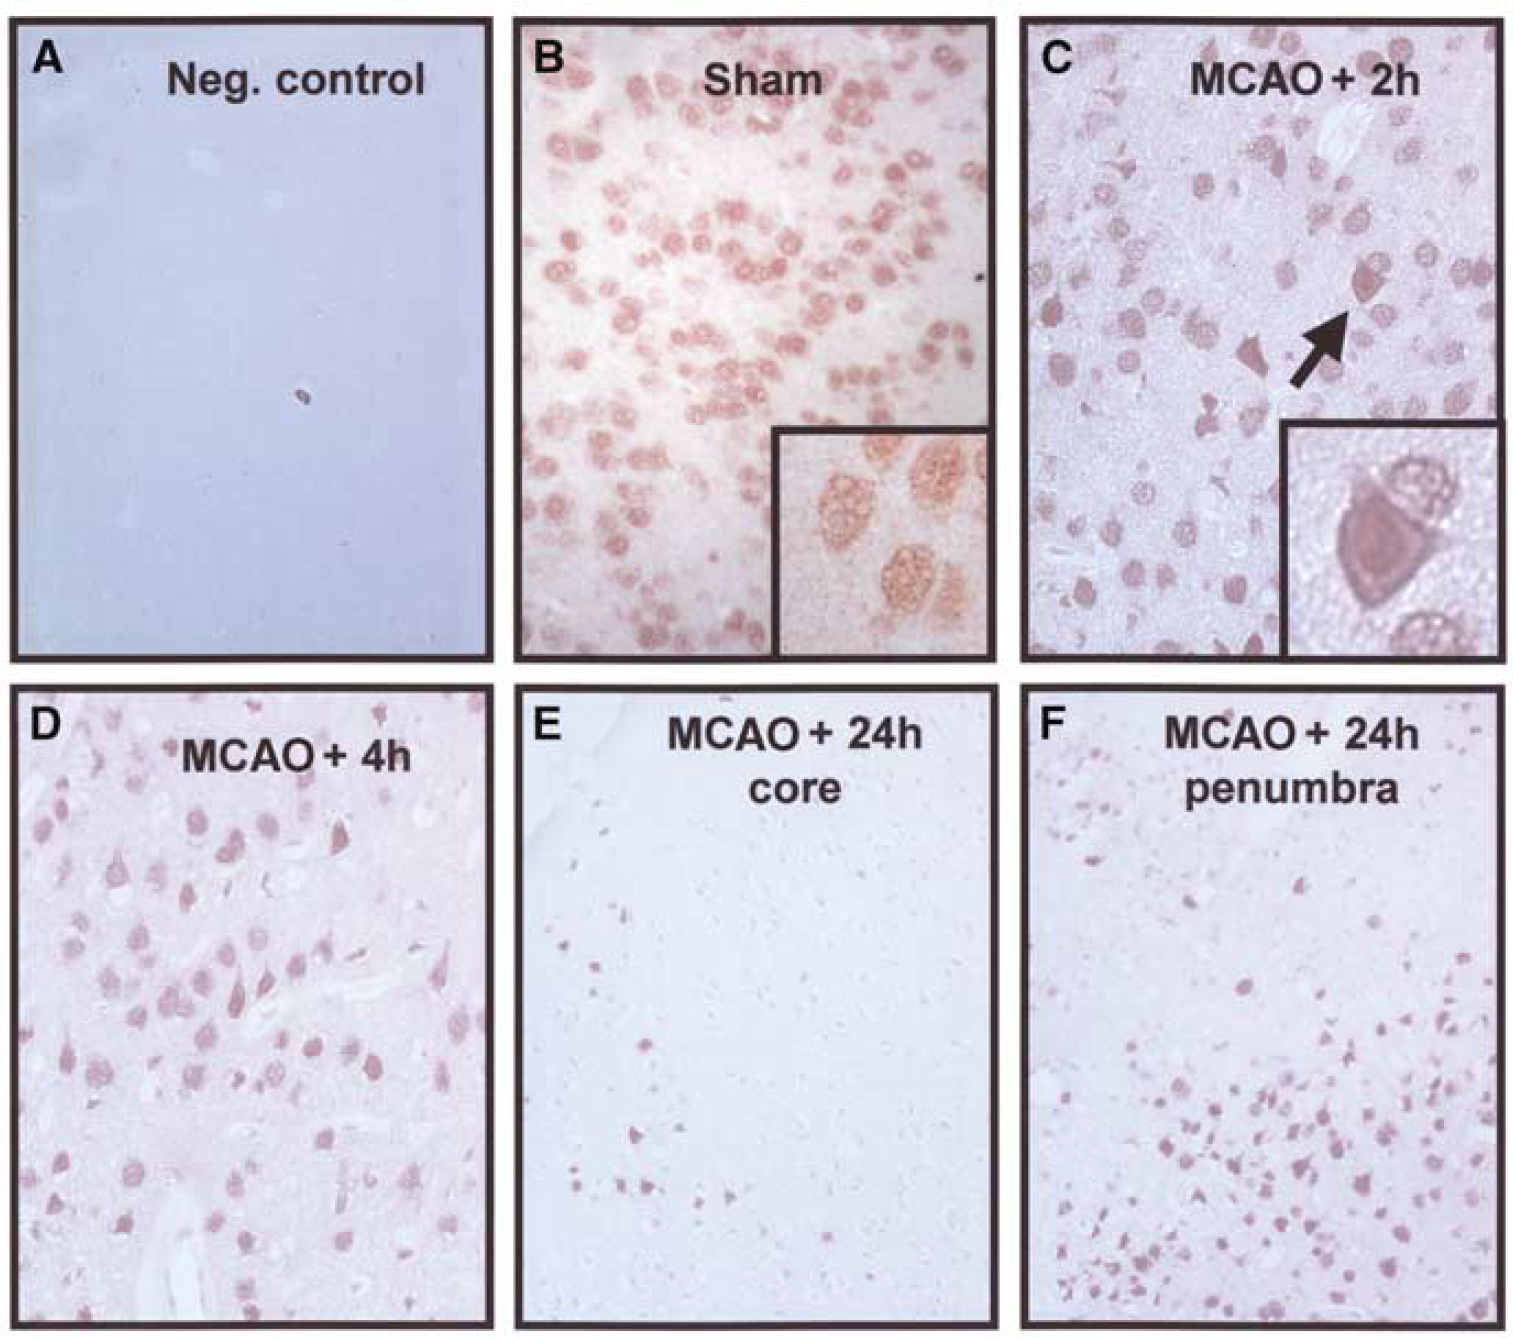
Immunohistochemistry for bradykinin B2 receptors in the healthy brain and at different time points after 45 mins of MCAO in wild-type mice. No staining is observed in infarcted tissue (
Kinin B2 Receptor Protein Expression and Localization
Staining for the bradykinin B2 receptor protein was identified throughout the healthy brain including all layers of the cerebral cortex, striatum, and the hippocampus (Figure 3B). B2 receptors were exclusively identified in cells showing neuronal morphology and no staining was found on cerebral vessels or other nonneuronal cell types (Figures 3B-3D). Staining of normal cells was mainly located in the nuclear membrane and the nucleus; immunoreactivity of the cell membrane was weak (Figures 3B-3D). Omission of the primary antibody abolished staining completely (Figure 3A). Starting 2 h after MCAO, a change of B2 receptors' immunoreactivity was observed in cells displaying signs of ischemic damage: the staining intensity increased in the nucleus and cell membrane immunoreactivity became evident (Figure 3C, arrows). Dead cells in the infarct core did not show any staining (Figures 3E and 3F) showing no unspecific staining of damaged cells by the B2 antibody. In contrast to these cells and to cells from normal tissue, cells in the border zone of the infarct, that is, the penumbra, showed strong immunoreactivity of nucleus and cell membrane (Figure 3F). These changes of kinin B2 receptor protein expression were quantified in the core and in the penumbra of the infarct (Figure 4). The kinin B2 receptor was significantly upregulated in all investigated brain regions already 4 h after ischemia (P< 0.05), a time point where delayed cell death begins to occur in the current model (data not shown). Twenty-four hours after cerebral ischemia, almost 100% of cells in the infarct core showed increased B2 receptor immunoreactivity (Figure 4, core). In the penumbra, where 20% of cells had normal morphology at this time point, 70% to 80% of cells displayed augmented B2 receptor immunoreactivity (Figure 4, penumbra). These findings indicate that all cells that show signs of ischemic damage upregulate their kinin B2 receptors.
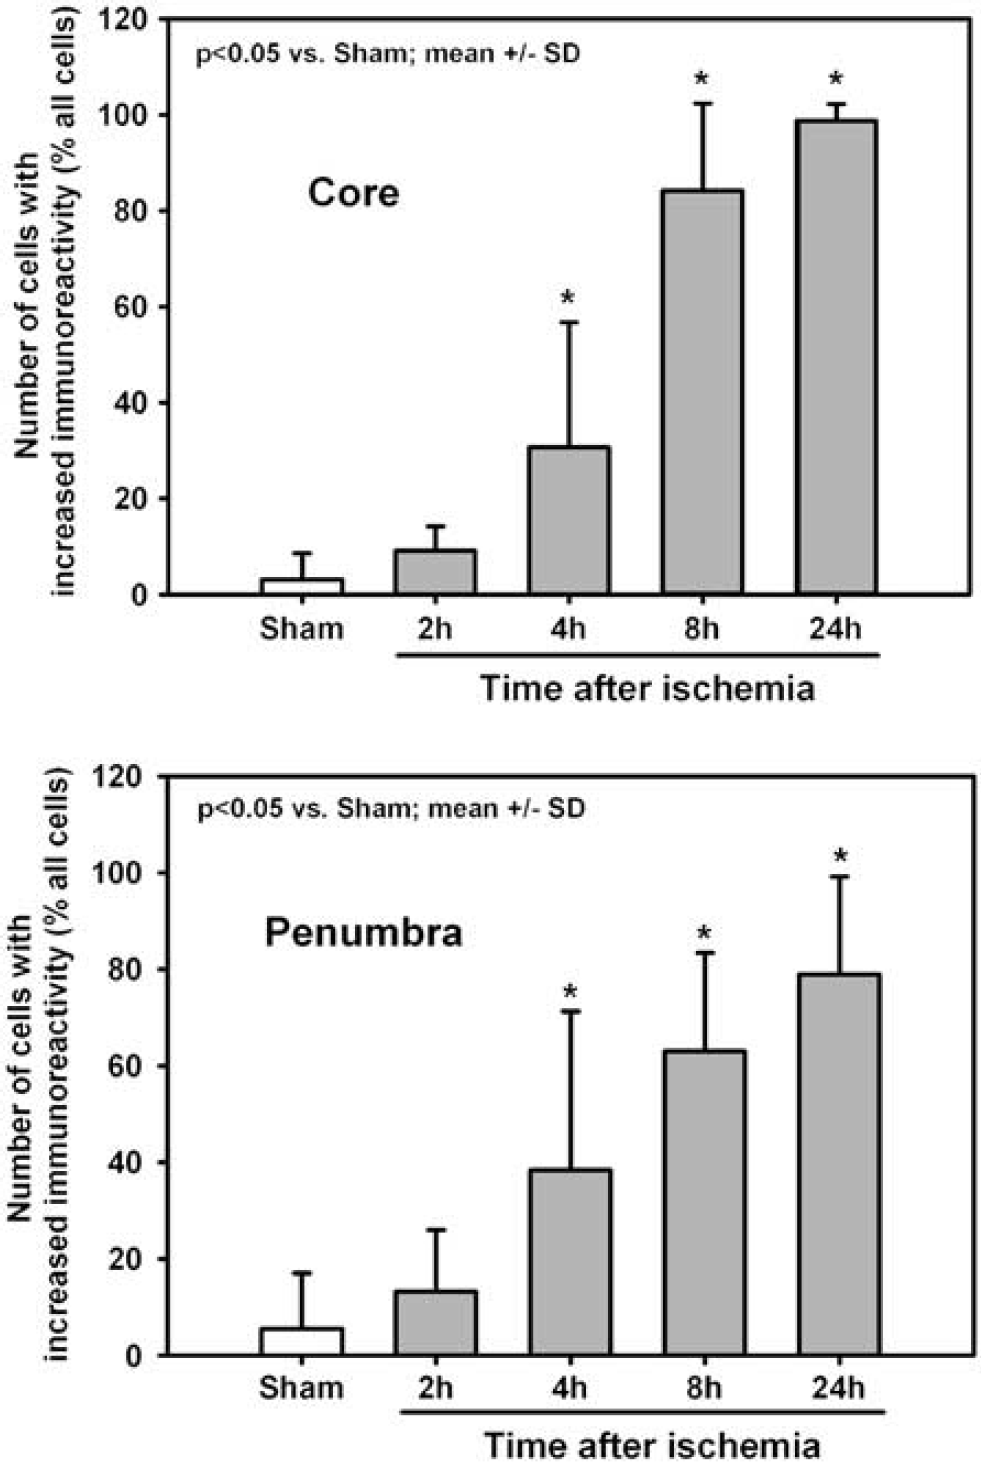
Quantification of cells showing enhanced expression of B2 kinin receptors in the ischemic core and the penumbra by immunohistochemistry. The number of cells with increased kinin B2 receptor immunoreactivity is expressed as percent of all counted cells to correct for the change of cell density over time, which occurs because of postischemic cell loss.
Characterization of B2 Receptor Knockout (B2−/−) Mice
The area of the MCA territory on the dorsal brain surface was 45%±5% of the total hemisphere in C57/BL6 mice (n = 9) and 40%±5% in B2−/− mice (n = 9; n.s.). Grading the morphology of the PcomA revealed no difference between the two mouse strains (1.4±0.9 and 1.4±1.1 in C57/BL6 and B2−/− mice, respectively; n = 9 per group).
C57/BL6 and B2−/− mice did not differ concerning B1 receptor expression (Figure 5), blood pressure and blood gases before, during, and after surgery (n = 6 per group; Table 1), body temperature before and up to 48 h after MCAO (n = 5 per group; data not shown), and the degree of cerebral blood flow reduction during MCAO (n = 7 per group; Figure 6).
(
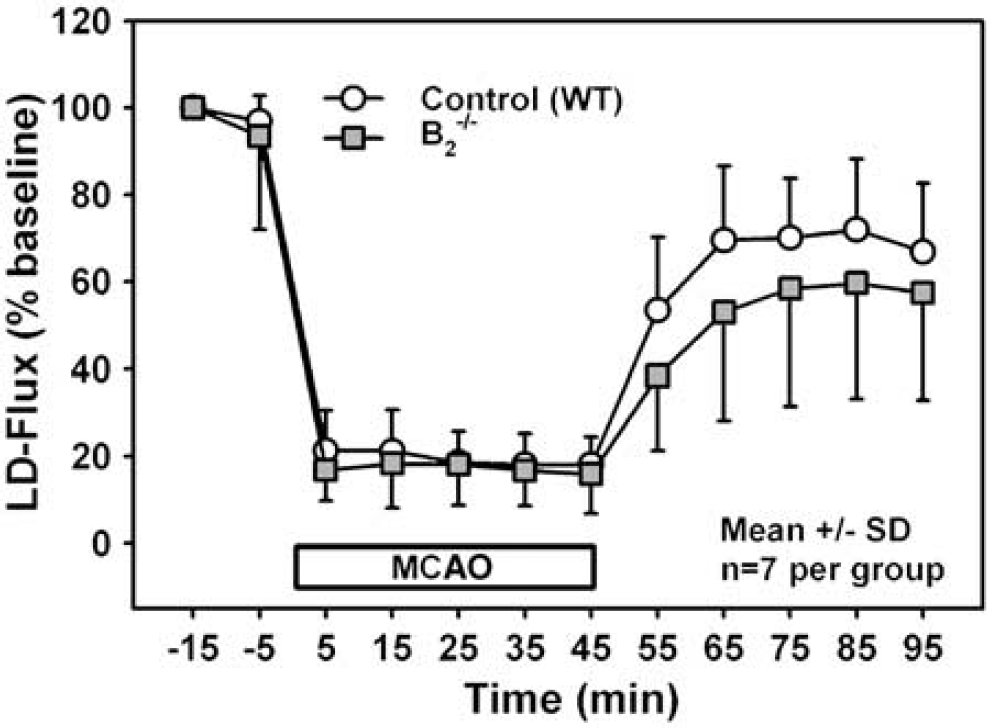
Regional cerebral blood flow (rCBF) in the core of the MCA territory of WT and B2−/− mice before, during, and after ischemia measured by laser-Doppler fluxmetry. Flow values are averages of 4-min intervals and are expressed as mean±s.d. (n = 5 animals per group). Regional CBF during and after ischemia was not different between WT and B2−/− mice.
Infarct Volume and Brain Edema in B2−/− Mice after Cerebral Ischemia
Twenty-four hours after 45 mins of MCAO, infarct volume of control mice (n = 7) was 32.3%±9.5% of the contralateral hemisphere. Infarct volume in B2−/− mice (n = 7) was only 20.1%±2.1% of the contralateral hemisphere, representing an almost 40% reduction as compared with wild-type animals (Figure 7; P<0.01).
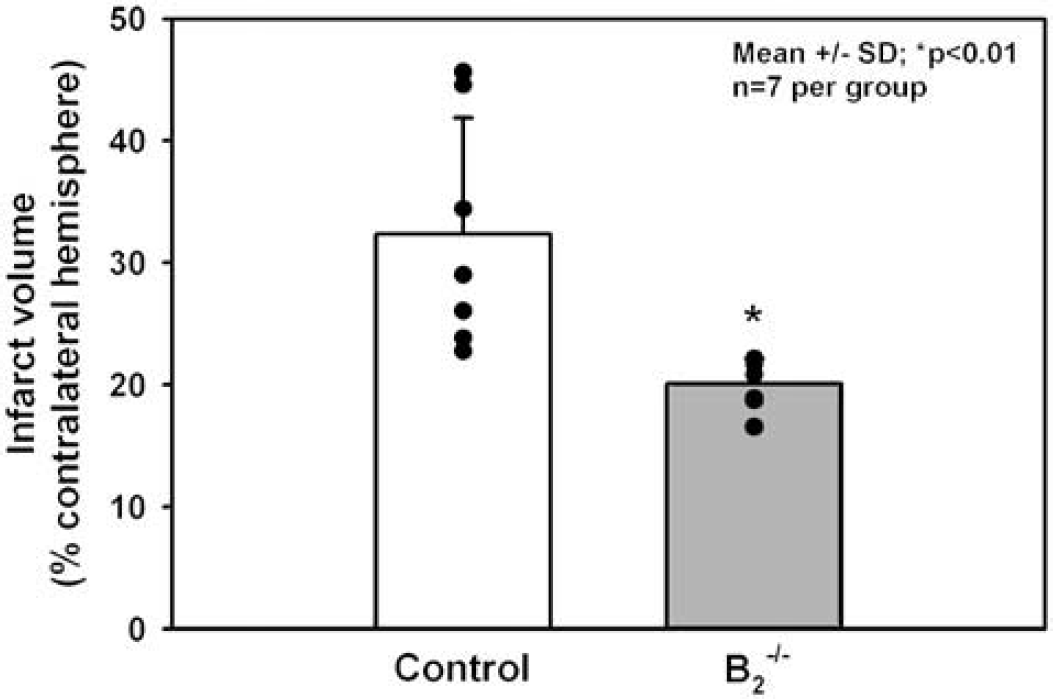
Infarct volume of B2−/− and WT mice 24 h after 45 mins MCAO. For correction of brain edema and different brain sizes, infarct volume (mean±s.d., n = 7 per group) is expressed as percent of the contralateral hemisphere. Infarct volume was significantly (*P<0.01) smaller in B2−/− mice (–38%) as compared with WT controls.
Brain water content did not differ between naïve C57/BL6 and B2−/− mice (78.1±0.1 versus 78.7±0.3; n.s.; n = 4 per group). Twenty-four hours after focal cerebral ischemia, brain water content increased by 3.5% to 81.6%±1.1% in WT mice (P< 0.03 versus naïve C57/BL6 mice; Figure 8). In B2−/− mice, this increase was only 0.5% (to 79.2%±1.0%), representing a reduction of postischemic brain edema in these animals by 87% as compared with WT animals (P< 0.03).
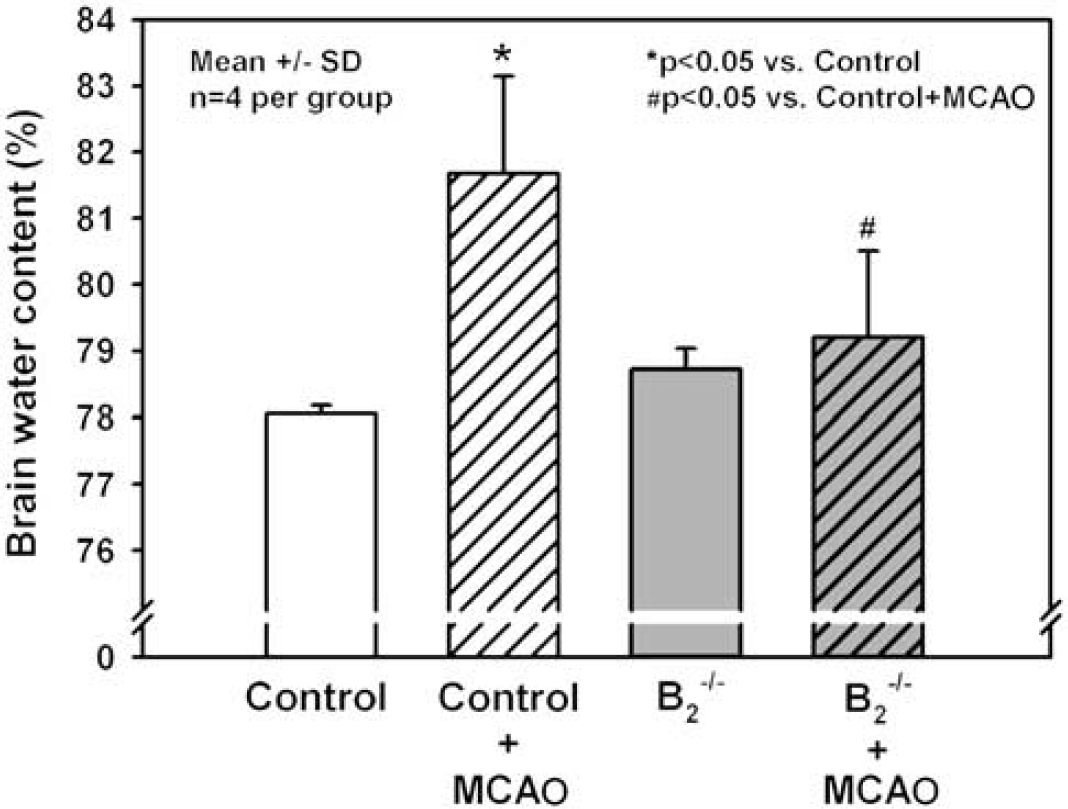
Brain water content as a measure of brain edema of the ischemic hemisphere of B2−/− and wild-type (WT) mice 24 h after 45 mins MCAO (mean±s.d., n = 4 per group). Ischemic brain edema was significantly reduced in B2−/− mice (−87%; P<0.05).
Functional Outcome and Survival of B2−/− Mice after Experimental Stroke
Motor function was determined at reperfusion and 24 h after reperfusion (Figure 9). One hour after reperfusion, 5/7 WT mice had a moderate motor deficit and 2/7 animals had a severe motor deficit (Figure 9). In contrast, none of the B2−/− mice had a severe motor deficit at this time point. Four out of seven animals had a moderate motor dysfunction and 3/7 mice had only slight motor dysfunction (P<0.03 versus WT). Over the next 23 h, motor function in all animals recovered to such good levels (P<0.03) that differences between groups were no longer detectable.
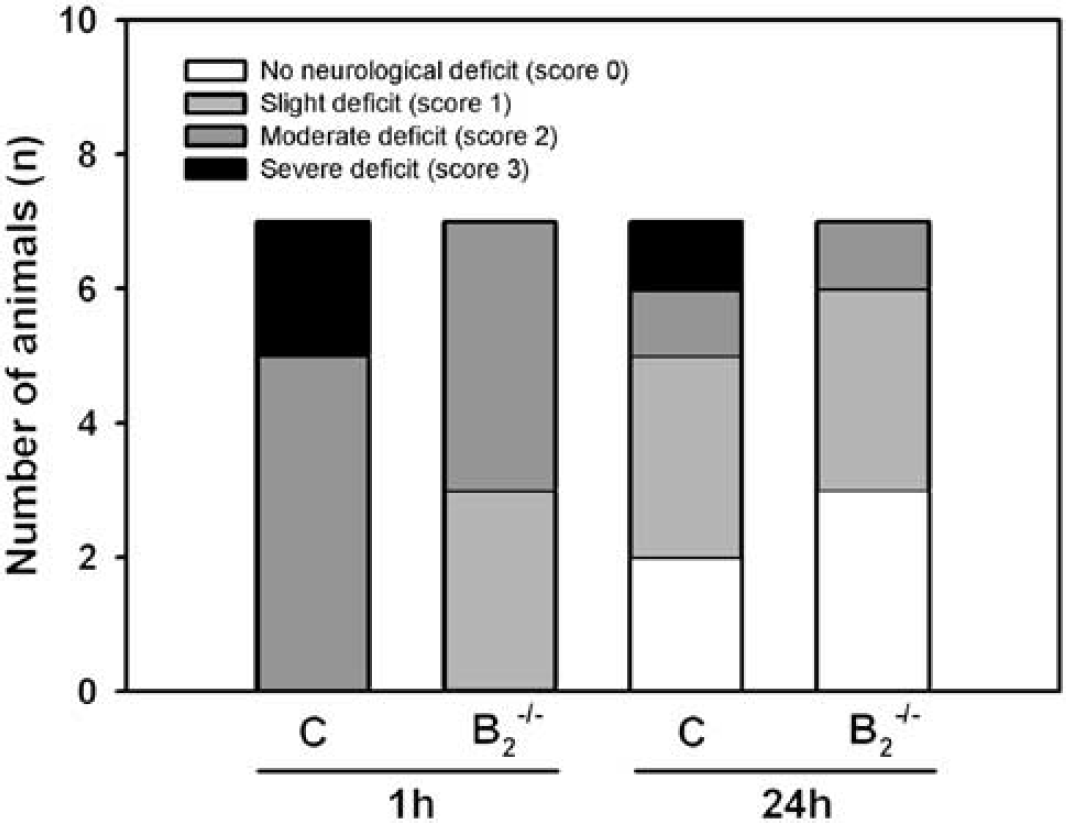
Motor function in WT and B2−/− mice immediately before reperfusion and 24 h after reperfusion (n = 7 animals per group). At reperfusion, B2−/− mice had a significantly better score as compared with the WT group (#P<0.05).
To investigate whether B2−/− mice benefit in the long term, we investigated survival of WT and B2−/− mice over 1 week. All B2−/− mice and 9/10 WT mice survived the first 24 h after MCAO (Figure 10). However, already 2 days after the insult, 50% of the wild-type mice were no longer alive. At this time point, only one out of 10 B2−/− mice died. One week after the insult, 9/10 control mice were dead, while 4/10 B2 knockout mice survived (P< 0.05).
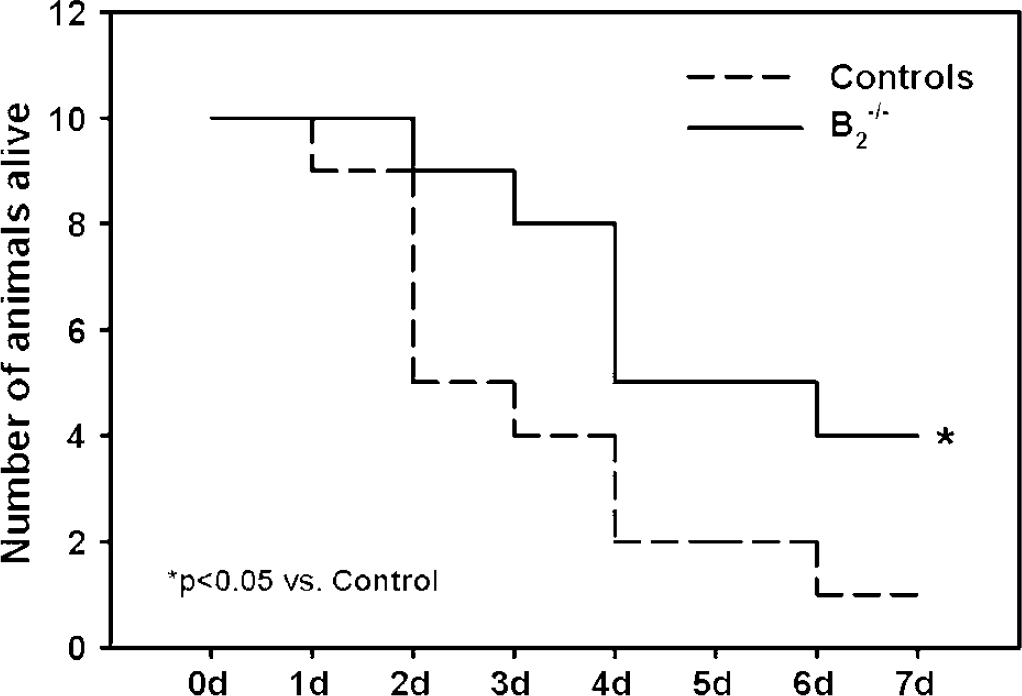
Long-term survival (7 days) of WT and B2−/− mice after 45 mins of MCAO. B2 receptor knockout mice survived significantly longer as compared with wild-type control mice (P<0.01).
DISCUSSION
The current study shows, to our knowledge for the first time, that bradykinin is released in brain parenchyma after focal cerebral ischemia, and that kinin B2 receptors are upregulated on damaged neuronal cells. In a second line of experiments, we were able to show that kinin B2 receptors are involved in brain edema formation and neuronal cell death after focal cerebral ischemia.
Bradykinin Production in Ischemic Brain Tissue
All components of the kallikrein-kinin system have been found in the brain (Kleniewski and Bogumil-Oczkowska, 1980; Kariya et al, 1981, Kariya et al, 1982; Chao et al, 1983; Scicli et al, 1984) and bradykinin was detected in normal mammalian brain tissue (Perry and Snyder, 1984; Yamauchi et al, 1985; Kariya et al, 1985). Bradykinin might be involved in neuronal signalling by causing calcium-dependent release of glutamate from astrocytes (Parpura et al, 1994), induces the production of inflammatory mediators in glial cells (Schwaninger et al, 1999), and increases intracellular calcium in microglial cells (Noda et al, 2003). Data on the expression of kininogen mRNA in cultured neurons and astrocytes and immunohistological studies on brain sections indicated that bradykinin was found only in neurons (Correa et al, 1979; Takano et al, 1999); however, the precise source of bradykinin production in the CNS is still unknown.
Measurement of bradykinin plasma concentrations is technically demanding, because bradykinin is a short-lived peptide (T1/2<30 secs) that is expressed at very low concentrations in the presence of substantial amounts of closely related precursor and metabolite peptides resulting in erroneously high values if detection techniques are not highly specific for bradykinin. The absolute values of plasma bradykinin measured in wild-type mice in the current study (1.8±0.6 fmol/g plasma) are well in agreement with values previously found in humans, using equally specific and sensitive detection techniques (Pellacani et al, 1994; Nussberger et al, 1998). It is interesting to note that levels of plasma bradykinin were elevated in B2−/− mice as compared with WT mice. This may result from the higher fraction of free versus receptor-bound bradykinin because of the lack of bradykinin receptors in these animals.
Bradykinin concentration in the brain parenchyma of wild-type and B2−/− mice (3.1±1.4 fmol/g brain tissue) was in the same range as that in plasma. Because the brains were flushed with PBS before processing, it is unlikely that bradykinin originating from plasma interfered with measurements in brain tissue. Respective values from the literature are up to 200 times higher than those currently reported (100 to 600 fmol/g) (Perry and Snyder, 1984; Yamauchi et al, 1985; Kariya et al, 1985); however, such high values for bradykinin were obtained at a time when detection techniques for bradykinin were not as specific and sensitive as they are today.
Data on brain tissue bradykinin after brain injury are so far only available after global ischemia (Kamiya et al, 1993). Brain and plasma bradykinin increased 30 mins after 3 h of bilateral common carotid occlusion in rats (at the time of maximal brain edema formation) and decreased thereafter to baseline levels. As compared with global ischemia, the time-course of brain tissue bradykinin elevation after focal cerebral ischemia is completely different, reaching its maximum 12 h after the insult (Figure 1). This difference in the time-course of bradykinin release might be because most brain tissue where bradykinin was measured after global ischemia did not show any sign of damage, while these areas of the brain, for example, cortex and striatum, suffered from massive neuronal cell death after focal ischemia. Most interestingly, the time-course of postischemic cell death (4 to 12 h after reperfusion, data not shown) and bradykinin production (Figure 1) showed a marked correlation indicating that bradykinin might be involved in tissue damage after cerebral ischemia.
Expression of Kinin B2 Receptors after Cerebral Ischemia
Expression of the bradykinin B2 receptor has been reported on cultured astrocytes, oligodendrocytes, and microglia (Cholewinski et al, 1991; Gimpl et al, 1992; Stephens et al, 1993; Hosli and Hosli, 1993; Noda et al, 2003), and functional studies in vitro and in vivo suggest the presence of the B2 receptor on cerebral endothelial cells (Whalley and Wahl, 1983; Wahl et al, 1983; Unterberg et al, 1984); however, in the brain, constitutive expression of bradykinin B2 receptors has only been reported in neurons (Raidoo et al, 1996; Chen et al, 2000), as also confirmed by our own results (Figures 2 and 4). Neuronal B2 receptor expression has been detected in most areas of the brain, including in the regions of the brain affected by MCAO, that is, the cerebral cortex and the striatum (Raidoo et al, 1996; Chen et al, 2000) (Figure 4). Despite this detailed knowledge on bradykinin B2 receptor expression, its functional role in the brain is still unclear. It has been suggested that B2 receptors may serve as a signalling system between astrocytes and neurons (Parpura et al, 1994); however, the significance of this finding was challenged by the lack of any apparent CNS-related phenotype in B2−/− mice (Borkowski et al, 1995).
Regulation of kinin receptors after cerebral ischemia has to our knowledge not been reported so far. Our data indicate that B2 receptor mRNA was upregulated already 1 to 8 h after ischemia; however, massive upregulation to about 10-fold of the baseline expression was only observed 24 to 48 h after MCAO. Immunohistologic analysis clearly shows that B2 receptor protein expression after ischemia was increased in cells showing signs of ischemic damage, whereas dead cells did not show kinin receptor expression (Figure 3). Quantification of these data reveals that bradykinin B2 receptor upregulation follows the time-course of cell death in the currently used model of focal cerebral ischemia, that is, neuronal death in the striatum occurs within 1 to 2 h after reperfusion, while in the cortex, cell death is delayed by 4 to 12 h (Plesnila et al, 2004) (Figure 4). This close correlation between the progression of cell death and the upregulation of bradykinin B2 receptors suggests that the kallikrein-kinin system might be involved in the initiation of neuronal cell death after focal cerebral ischemia. This assumption is also supported by our data showing elevated brain tissue bradykinin concentrations during the same period of time, that is, the first 12 h after MCAO (Figure 1).
Role of Bradykinin B2 Receptors for Neuronal Cell Death after Cerebral Ischemia
Among the current data, the strongest evidence for a role of bradykinin receptors for neuronal cell death after cerebral ischemia is provided by the experiments using bradykinin B2 receptor knockout mice (B2−/− mice; Figures 7–10). These mice, lacking the B2 receptor, have smaller infarct volumes, less postischemic brain edema, and a reduced mortality as compared with wild-type animals after MCAO. Because the phenotype and the expression of the B1 receptor of B2−/− mice is not different from that of control animals, the observed neuroprotection has to be related to the expression of the bradykinin B2 receptor, as also suggested by us and others based on studies using B2 receptor antagonists (Relton et al, 1997; Zausinger et al, 2002; Ding-Zhou et al, 2003).
No published evidence exists pointing towards a role of kinin B1 receptors in the development of secondary brain damage after cerebral ischemia; however, blockade of B1 receptors seems to alleviate the neuroprotective effect of B2 receptor antagonism (J Relton, personal communication). These findings, together with a recent study showing neuroprotection by the overexpression of kallikrein in the brain (Xia et al, 2004), may point to a detrimental as well as to a neuroprotective role of bradykinin after acute brain injury, depending on differential receptor binding, as also suggested previously (Plesnila et al, 2001a).
Although the present data suggest an important role for bradykinin B2 receptors for the development of postischemic brain damage, the mechanisms of bradykinin-induced cell death are still not well understood. So far bradykinin B2 receptor-induced brain damage was mainly explained by an increase of vascular permeability and the subsequent development of postischemic or posttraumatic brain edema (Maier-Hauff et al, 1984; Unterberg and Baethmann, 1984; Unterberg et al, 1986; Kamiya et al, 1990, Kamiya et al, 1993; Francel, 1992; Whittle et al, 1992; Wahl et al, 1996; Yong and Linthicum, 1996; Schilling and Wahl, 1999; Stover et al, 2000; Plesnila et al, 2001a; Zausinger et al, 2002; Kaplanski et al, 2002). Although other mechanisms were also proposed, for example, generation of inflammatory mediators, neutrophil adhesion and migration, and production of free radicals (see Francel, 1992, for a review), these might well be secondary to the neuroprotective effect exerted by the reduction of brain edema. Our current results, showing marked expression of bradykinin B2 receptors in neurons (see above), may point towards a direct effect of bradykinin on neuronal survival after cerebral ischemia. This effect might have been missed previously, because neurons in culture do not express bradykinin receptors (Couture et al, 2001), thereby making studies on the role of kallikrein-kinin system on neuronal survival difficult. However, a recent report showing that overexpression of kallikrein in brain macrophages reduced programmed cell death and infarction volume after experimental stroke (), rather favors a protective role for the kinin-kallikrein system after brain injury. These findings may again point to a dual role of bradykinin for neuronal survival and death after acute brain injury and show the necessity for further investigations.
Taken together, our results show the temporal expression pattern of kinin B2 receptors and brain tissue bradykinin after focal cerebral ischemia and may indicate a role for bradykinin B2 receptors in postischemic cell death. In contrast to previous findings, the current experiments suggest a direct role for bradykinin and bradykinin B2 receptors in the development of ischemic cell death. These findings broaden our so far limited understanding of the kallikrein-kinin system after cerebral ischemia and may pave the way for the development of novel, more specific strategies for the treatment of ischemic stroke.