
Abstract
Brain responses to external stimuli after permanent and transient ischemic insults have been documented using cerebral blood volume weighted (CBVw) functional magnetic resonance imaging (fMRI) in correlation with tissue damage and neurological recovery. Here, we extend our previous studies of stroke recovery in rat models of focal cerebral ischemia by comparing blood oxygen level-dependent (BOLD) and cerebral blood volume (CBV) changes. Responses to forepaw stimulation were measured in normal rats (n = 5) and stroke rats subjected to 2 h of middle cerebral artery occlusion (n = 6). Functional magnetic resonance imaging was performed 2 weeks after stroke to evaluate the recovery process. After stroke, animals showed variable degrees of fMRI activation in ipsilesional cortex, the extent of which did not correlate with structural damages as measured using apparent diffusion coefficient, fractional anisotropy, blood volume, and vessel size index. While the contralesional cortex showed good overlap between BOLD and CBV-activated regions, the ipsilesional cortex showed low covariance between significantly activated voxels by BOLD and CBVw techniques. In particular, the relative activation during contralateral stimuli in the ipsilesional somatosensory cortex was significantly higher for CBVw responses than BOLD, which might be due to stroke-related alterations in fMRI hemodynamic coupling. Aberrant subcortical activations were also observed. When unaffected forelimbs were stimulated, strong bilateral responses were observed. However, little thalamic responses accompanied stimulation of affected forelimbs despite significant activation in the ipsilesional somatosensory cortex. These results suggest that stroke affects not only local hemodynamics and coupling but also other factors including neural connectivity.
Introduction
Noninvasive imaging has shown that cortical reorganization and functional plasticity accompany recovery of poststroke brain function. Earlier studies using positron emission tomography (PET) revealed activation-induced regional cerebral blood flow (rCBF) increases in brain regions of stroke patients, which are not normally active in control subjects (Chollet et al, 1991; Nelles et al, 1999; Weiller et al, 1992). Subsequently, spatial and temporal patterns of brain reorganization in cortical and subcortical regions have been recently documented in poststroke humans and animal models using various techniques to map task-induced changes in regional brain activity (Dijkhuizen et al, 2001; Nelles et al, 1999; Rossini and Pauri, 2000).
Techniques that are frequently used for understanding functional patterns after cerebral damages include PET, transcranial magnetic stimulation (TMS), magnetoencephalography (MEG), electroencephalography (EEG), and magnetic resonance imaging (MRI) (Green, 2003; Rossini and Pauri, 2000). Among these methodologies, functional magnetic resonance imaging (fMRI) enables nearly simultaneous acquisition of high-resolution structural images and functional activation maps. Numerous fMRI studies clearly revealed that the brain activation pattern in stroke patients evolves over time in terms of response intensity and spatial distribution when subjected to various stimulus paradigms (Cramer et al, 1997). Since these dynamic poststroke fMRI events appear to be correlated with physical recovery (Ward et al, 2003), an accurate representation of neural recovery is important for our understanding of the mechanisms in poststroke recovery possible treatment strategies, and assessment efficacy.
In practice, human fMRI acquisitions are ordinarily performed using blood oxygen level-dependent (BOLD) signal, whereas most fMRI studies of stroke recovery in animal models have relied on a more sensitive technique that is weighted by cerebral blood volume (CBV) responses (Abo et al, 2001; Dijkhuizen et al, 2001; Mandeville et al, 1998; Marota et al, 1999). Although the mechanistic links between neuronal activities and fMRI activations are not defined clearly yet, it is highly probable that the functional representations acquired using various cerebral hemodynamic responses are correlated with the pathophysiological states of recovering brains. Since the acquisition of fMRI activation relies on temporal variations in cerebral hemodynamics, it is important to assess whether different MRI reporters of functional restoration (e.g., BOLD versus CBV), which exploit different hemodynamic parameters, produce equivalent information, or whether aspects of flow-metabolism coupling are altered during the recovery period.
In this respect, fMRI activations of both healthy and stroke-bearing animals were examined with both BOLD and CBV-weighted fMRI techniques. The goal of the study was to understand the underlying physiology in recovering brains after a transient stroke by comparing the two different fMRI reporters and to assess whether normal relationship between neuronal stimuli and subsequent hemodynamic responses could be affected. We present experimental evidence that transient stroke damages alter the relationship between two fMRI reporters, and that overall connectivity is independent of local structural damages.
Materials and methods
Animal Surgery and MRI Acquisition
Temporary stroke was induced by 2-h occlusion of the right middle cerebral artery (MCAO) by advancing an intraluminal filament up into the internal carotid artery of adult Sprague Dawley rats (n = 6, 250 to 350 g). Detailed surgery procedures were as described previously (Dijkhuizen et al, 2003). At 2 weeks after the temporary MCAO in right hemispheres of rats (see Figure 1), fMRI experiments were performed. Normal rats were used as controls (n = 5, 250 to 300 g).
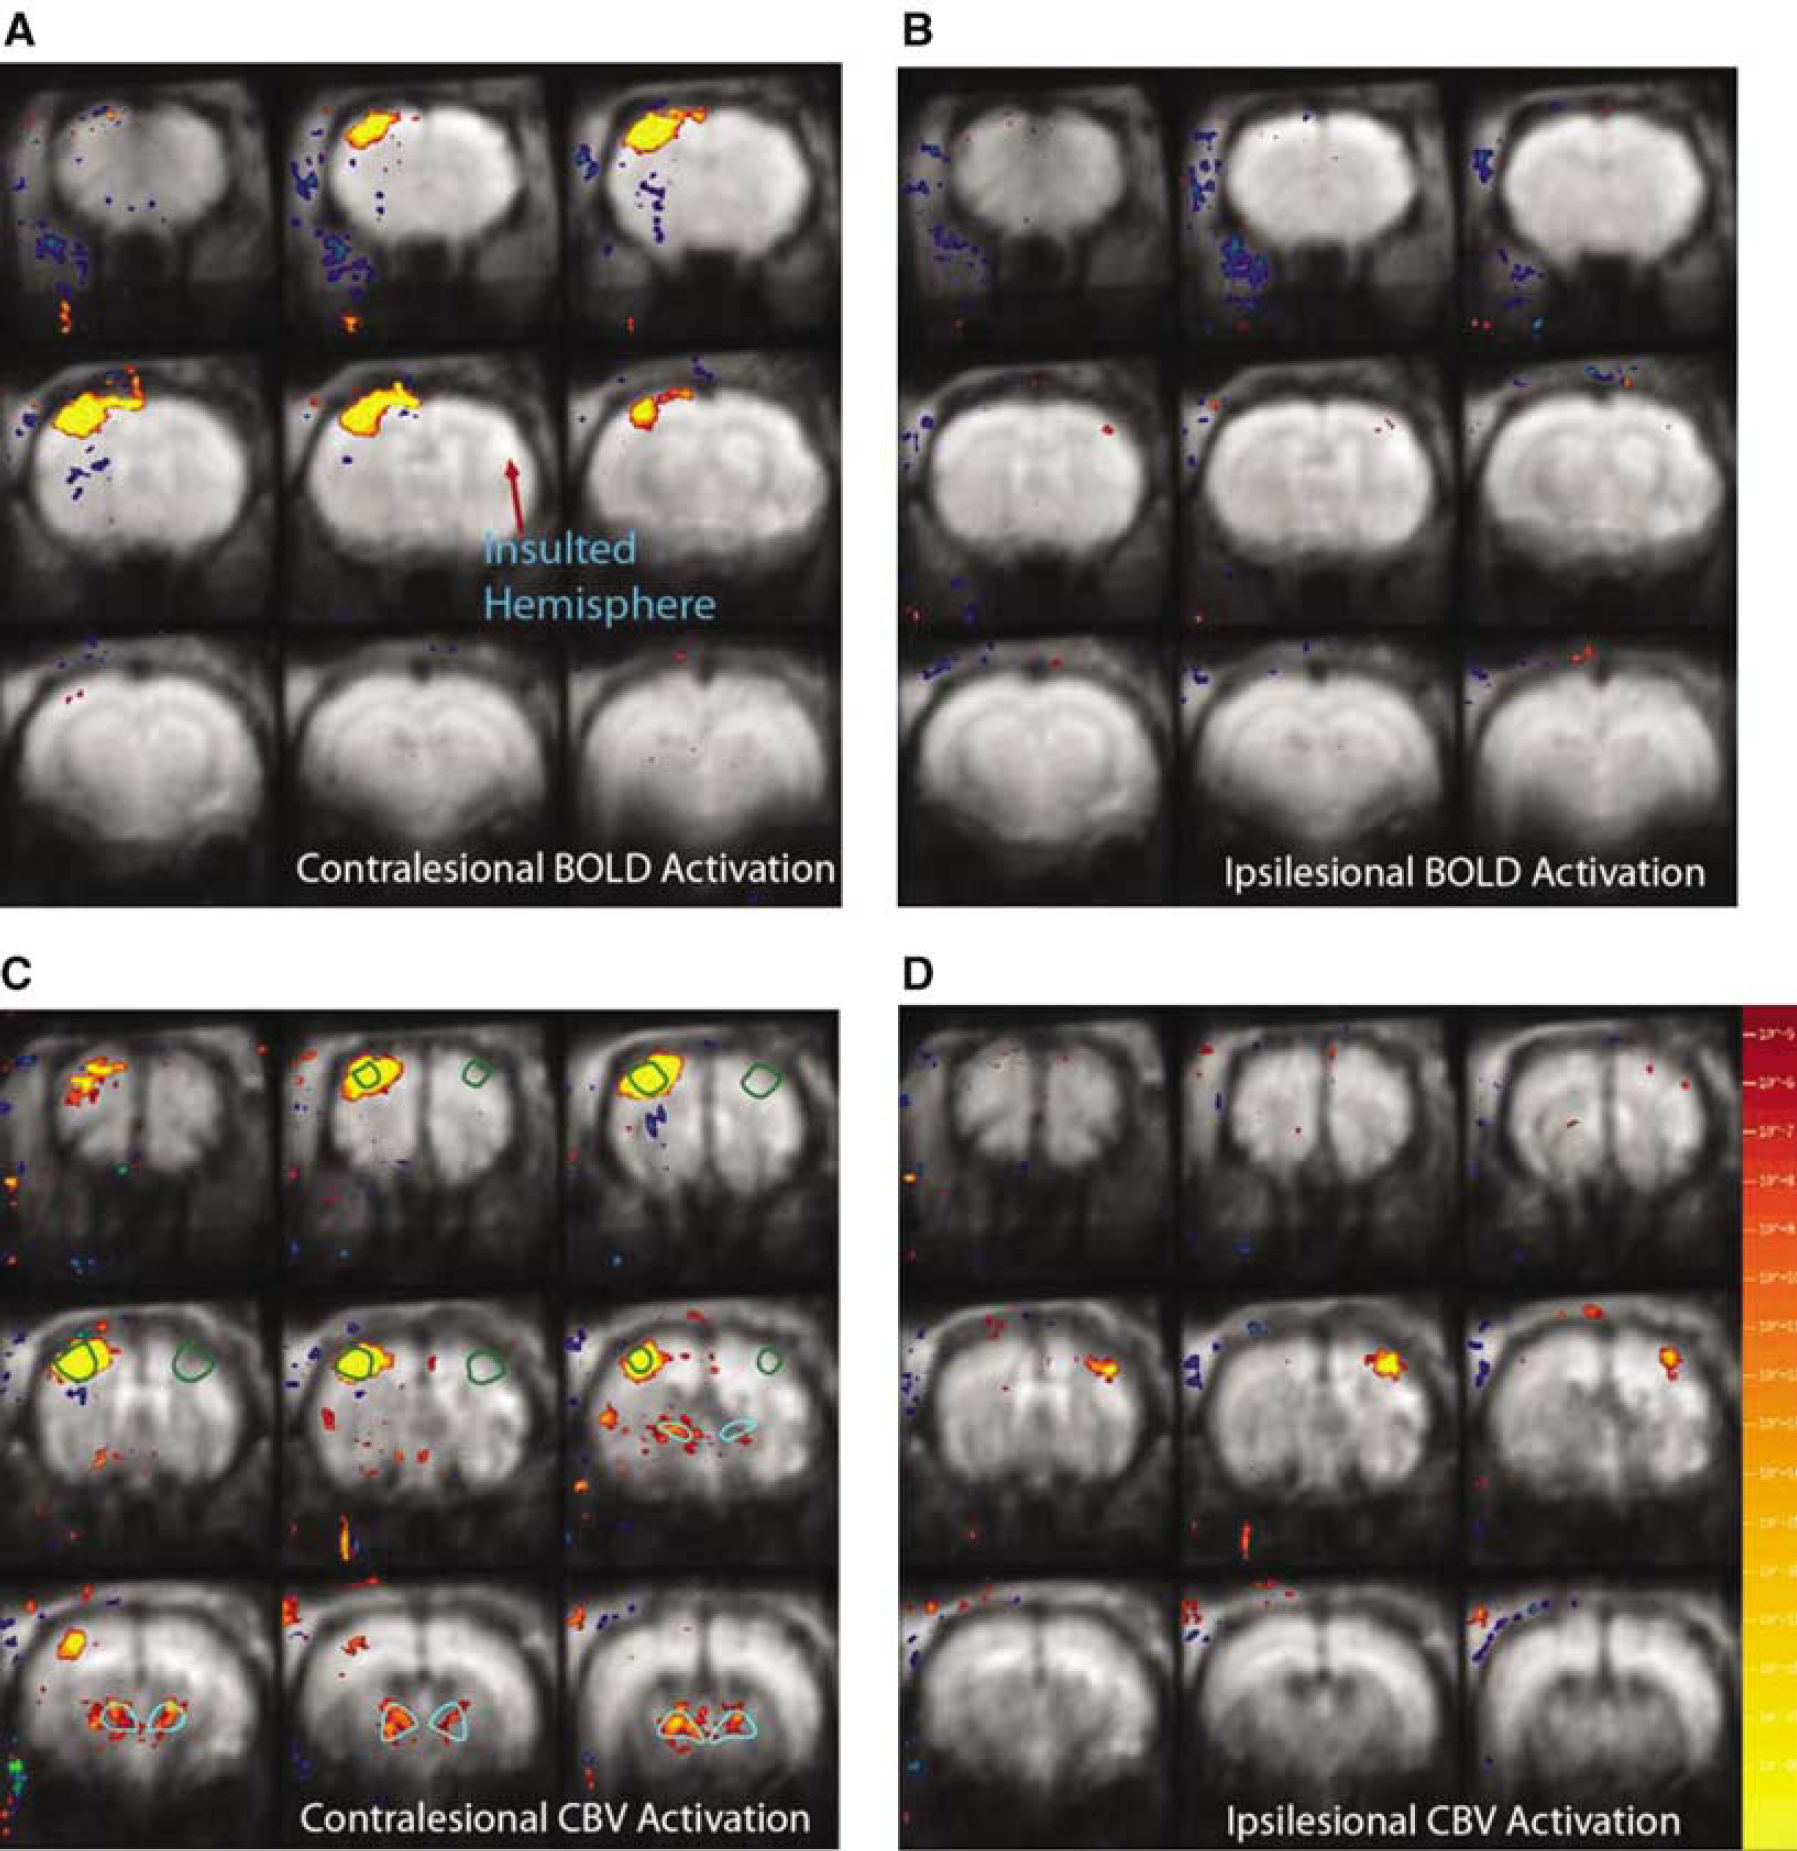
Functional magnetic resonance imaging activation maps of concatenated stroke brains 2 weeks after the insult (n = 6), acquired by stimulating unaffected and affected forelimbs (left and right columns, respectively) using BOLD and CBV responses (top and bottom rows, respectively), with the activation threshold of P<0.0001. *Green and cerulean lines show ROIs that were used for the analyses of somatosensory cortex and thalamus, respectively.
Before MRI acquisition, both left and right femoral veins (for infusion of anesthetics and contrast agent administration, respectively) and right femoral artery (for blood pressure monitoring and blood gas analysis) were catheterized. Thereafter, animals were tracheotomized and mechanically ventilated with 1.5% halothane in O2/air (1:1). Body temperature was measured with a rectal probe. Thin copper wires were subcutaneously inserted into both forepaws at the level of wrists for electrical stimulation. A constant voltage generator was used, and the threshold voltage for stimulation was determined by detecting the onset of muscle flexion. To ensure supermaximal stimulation, the applied voltage during fMRI was approximately 1 V higher than the threshold voltage which ranged from 3 to 4 V. The stimulus duration and frequency were 0.3 ms and 3 Hz, respectively. Before the MRI experiment, the anesthetic regimen was switched from the halothane gas mixture used for surgery to continuous infusion of α-chloralose (30 mg/kg/h), preceded by a loading bolus (~20 mg/kg). Concurrently with α-chloralose administration, rats were paralyzed with an intravenous bolus of pancuronium (1 mg/kg), which was followed by continuous infusion (~1.25 mg/kg/h) of pancuronium. Body temperature, blood oxygen saturation level, heart rate, blood gas, and blood pressure were monitored and carefully maintained at normal levels throughout the experiment. A sufficient time (1-2 h) was allowed for the anesthetic transition before fMRI measurements.
Functional magnetic resonance imaging activations with BOLD and cerebral blood volume weighted (CBVw) techniques were measured sequentially. Functional images (Gradient Echo Planar Imaging, TR/TE = 3700/15 ms for BOLD, TR/TE = 3700/11 ms for CBVw FOV = 2.5 × 2.5 cm2; nine contiguous 1 mm slices, and 80 × 80 matrix zero filled to 128 × 128) were acquired on a horizontal bore 9.4T Bruker/Magnex system, equipped with a home-built rat head surface RF transmit and receive coil with the approximate diameter of 3 cm. Unilateral electrical stimulation paradigm, consisting of 3 periods of 37 sec ‘stimulation on’ separated by 185 sec ‘stimulation off,’ was alternated between the left and right forepaw, and this paradigm was repeated 2 to 5 times each for BOLD and CBVw images. After BOLD fMRI, the blood pool T2 contrast agent (MION) was intravenously administered (36 mg (FeO2)/kg), and the stimulation paradigm was repeated.
Before the contrast agent administration, T2 and T2* maps were created by conventional gradient echo and spin echo pulse sequences using multiple echoes where TR/TE = 1000/4, 7, 10, 13 ms for gradient echoes and TR/TE = 3000/15, 30, 45, 60, 75, 90, 105, and 120 ms for spin echoes. Lesion volumes were calculated from the multislice T2 datasets using the image analysis software AFNI (Cox and Hyde, 1997). T2 lesion volume was defined as the ipsilateral parenchymal brain volume with T2 values higher than the mean + 2 standard deviation (s.d.) of the T2 values in contralateral tissue. In addition, cortical and subcortical lesion volumes were independently calculated and correlated with acquired functional measurements. For further structural analysis, apparent diffusion coefficient (ADC) maps were created with a diffusion-weighted EPI pulse sequence with TR/TE = 3700/40 ms and b = 5, 300, 800, and 1200 sec/mm2. To obtain fractional anisotropy (FA), diffusion tensor imaging was performed with the acquisition of a reference image (b = 0) and six gradient directions, in each of which total b = 1200 sec/mm2. Twice-refocused spin echo EPI (TR/TE = 10,000/40 ms) was used to reduce eddy-current-induced distortion (Reese et al, 2003).
After intravenous MION administration, T2 and T2* maps were again created as described above for the calculation of blood volume (BV), calculated as the MION-induced relaxation rate change, and the vessel size index (VSI), which is based on the ratio of gradient and spin echo relaxation rates due to MION (Dennie et al, 1998). In addition, three normal rats were used in control studies to investigate the temporal stability of the fMRI response because the order of BOLD and MION studies could not be randomized due to the long blood half-life of MION. For these animals, only CBVw activations were performed, and the experiment durations were approximately matched to the duration of other rat experiments using both BOLD and CBVw techniques.
Data Analysis
For fMRI data, rat images from each session were aligned relative to a template using nine degrees of freedom (three translations, three rotations, and three inflations), and multiple runs within each session were averaged into a single paradigm consisting of three stimulus/rest epochs for each rat; thereafter, BOLD or CBV data were concatenated across animals for detecting group functional activations. Data were analyzed using the standard general linear model approach (Friston et al, 1995), in which the stimulus paradigm is convolved with the respective hemodynamic response function for the BOLD or CBV response to generate a maximum likelihood estimator. Functional activation maps were computed voxel by voxel using an equivalent t-test between the on and off stimulus periods. Unless specified otherwise, the statistical threshold for significant activation response was P<0.01 with a Bonferroni correction for multiple comparisons throughout the measured brain volume.
For all the structural and percent signal change analyses, ROIs were placed over regions identified as primary motor cortex (M1) and forelimb sensory areas (S1fl) (see Figure 1) based on the rat brain atlas of Paxinos and Watson (1998). From these assigned voxels, the stimulus/rest epochs (i.e., activation epoch) were averaged across rats. In particular, for the control animals, each hemisphere was individually analyzed and combined for the presentation. For the analysis of fMRI activation in SS cortices, the acquired fMRI responses were divided into two categories: (1) contralateral to the stimulated forepaw and (2) ipsilateral to the stimulated forepaw. As shown in Figure 2, the contralateral stimulus (i.e., ‘contrastimulus') was defined as a pair of fMRI activations in the ipsilesional and contralesional SS cortices due to the left and right forelimb stimulations, respectively.
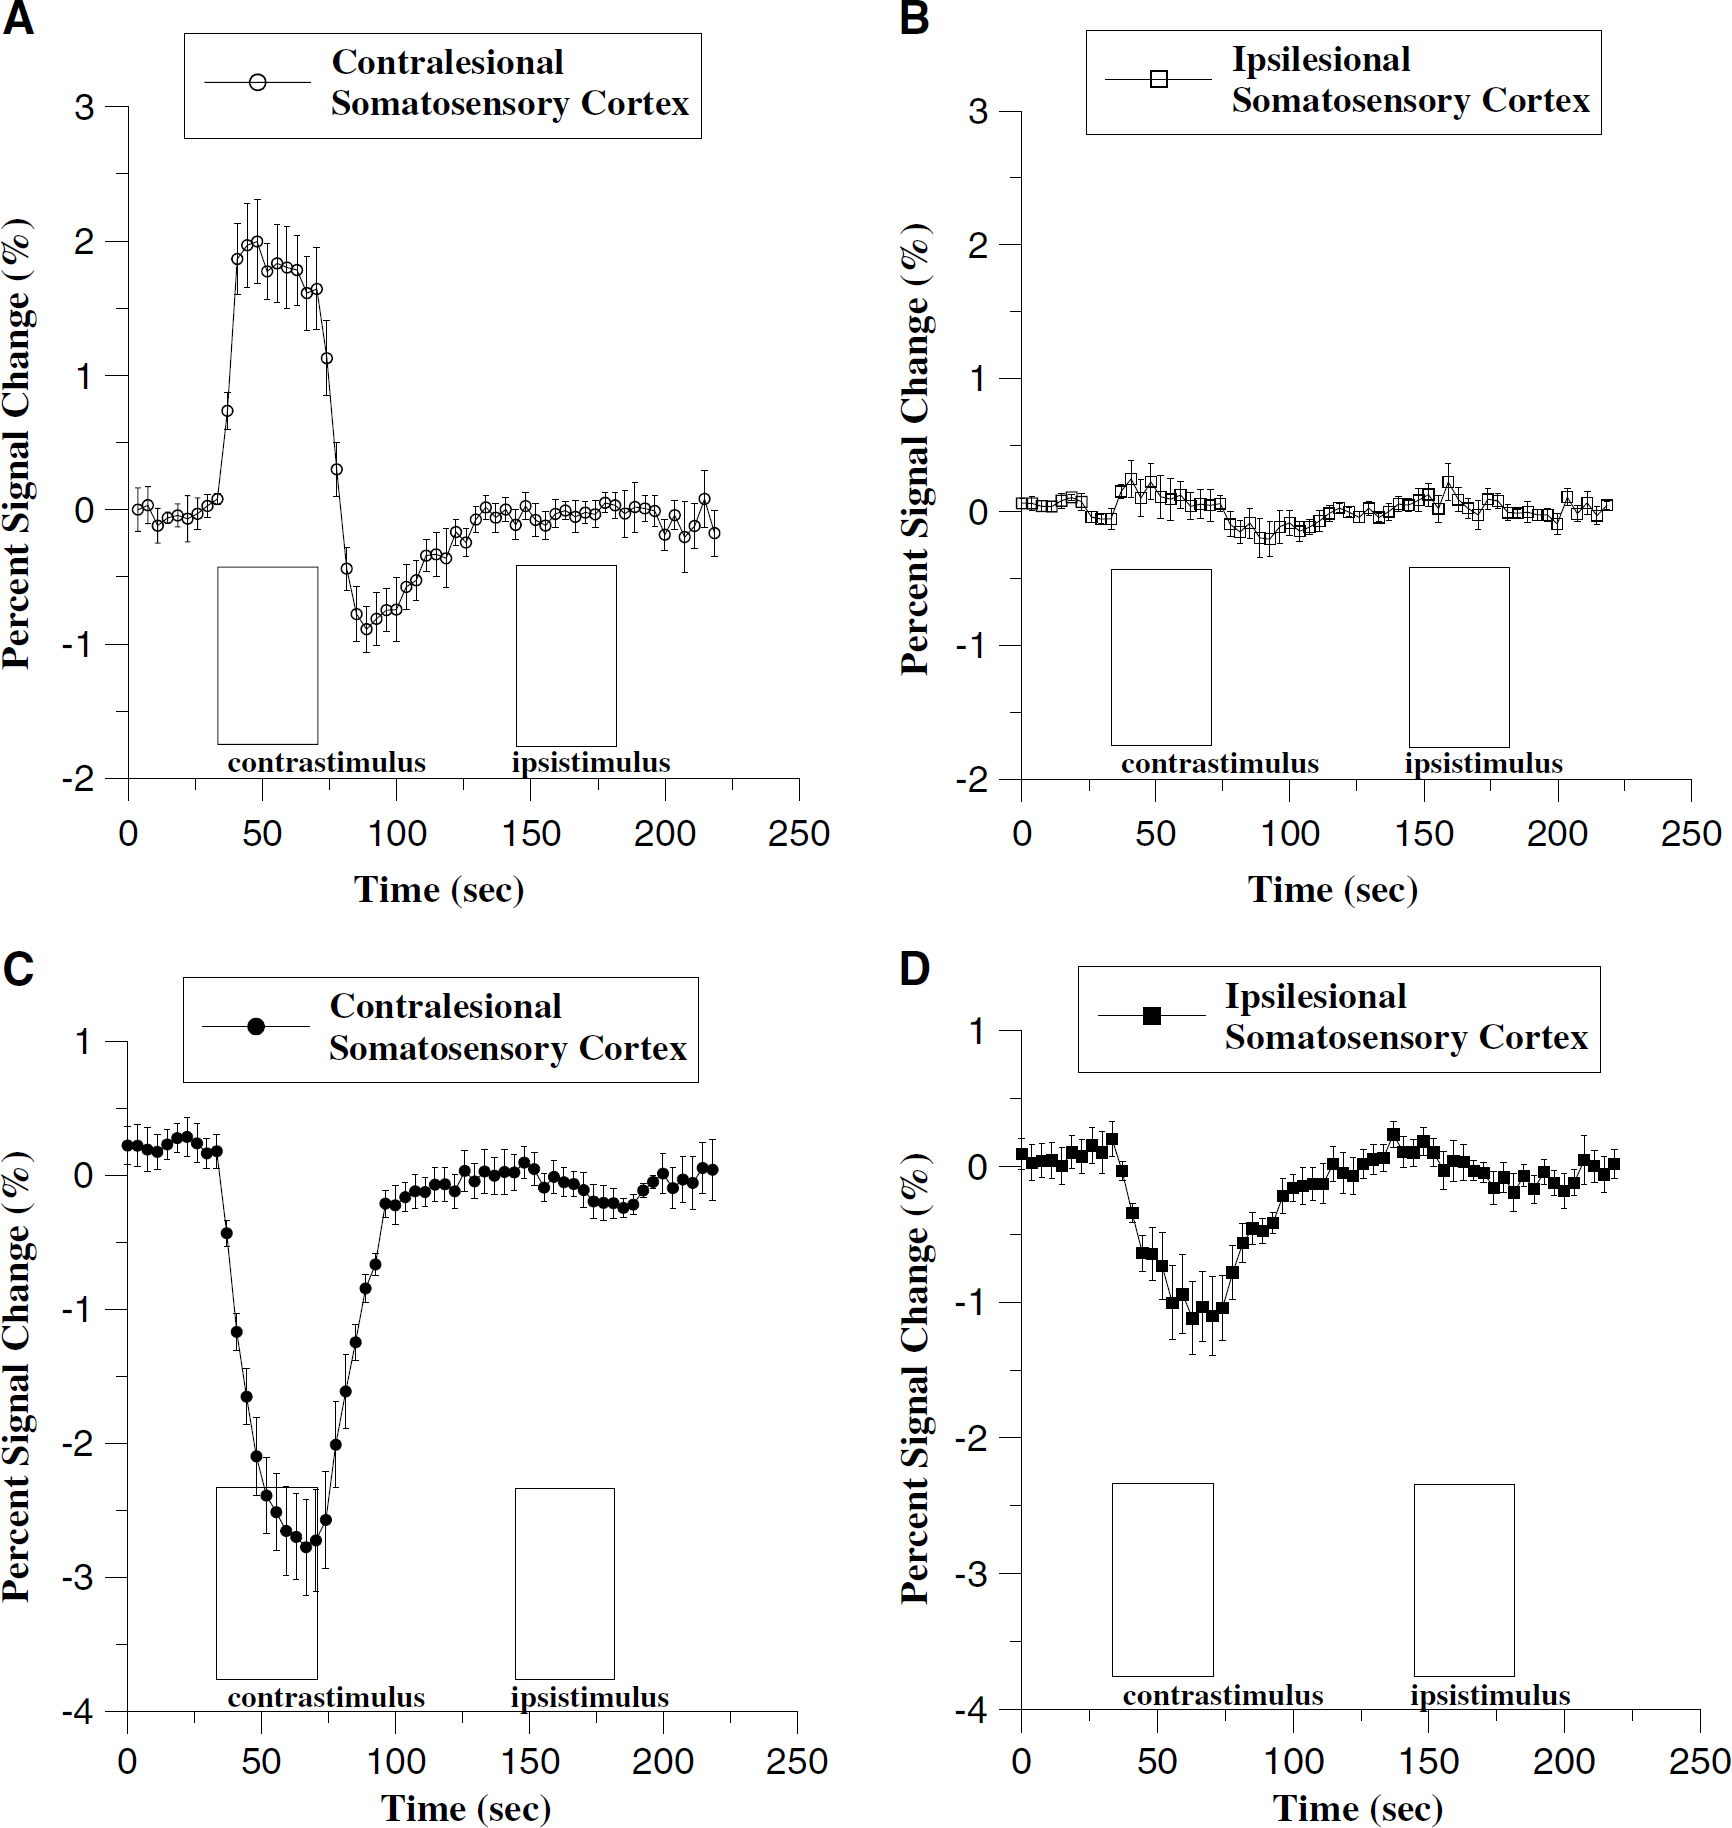
Average time course of percent signal change of stroke animals (n = 6) for BOLD response (
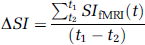
The tissue mean percent signal change in somatosensory cortex (ΔSI) was acquired for BOLD and CBVw responses, in which ΔSI for BOLD was defined as temporally-averaged signal intensity for a duration of 20 secs starting 5 secs after the initiation of each contralateral stimulus or ipsilateral stimulus and 15 secs after the initiation of stimuli for the CBVw responses, unless specified otherwise (e.g., ΔSI)(t1-t2); t1-t2 = time period used for averaging signal intensity in an activation epoch):
The averaging window for CBV responses was delayed with respect to the BOLD window to account for the slower CBV response (Mandeville et al, 1998). The ΔSI ratios (rΔSI) between contralesional and ipsilesional cortices were calculated as follows:
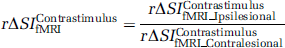
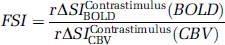
Functional status index (FSI) was evaluated as follows for the characterization of functional status in relation to the contrastimulus rΔSI (rΔSIContrastimulusfMRI):
In addition, the time courses (SIfMRI(t)) of contralesional and ipsilesional somatosensory cortices were created, and temporal dependence was qualitatively analyzed.
For the comparison of MRI-derived structural parameters, each ROI within a slice was analyzed by comparing the ipsilesional value with the contralesional counterpart to minimize any possible variations across slices. Percent differences (i.e., (Contralesional-Ipsile-Ipsilesional)/Contralesional) of ADC, FA, VSI, and BV were calculated for both somatosensory cortex and thalamus. For the analysis of thalamus, all the MRI-derived structural and functional measurements were performed on the ROIs placed over anatomically-defined regions by comparing the acquired MR images to the rat atlas. In particular, stimulus-dependent bilateral thalamic activity was analyzed (i.e., affected versus unaffected forelimbs). Unless specified otherwise, all the statistical analyses for ROIs presented in the study were performed using a two-tailed t-test with paired two samples for means, and for correlation analyses we applied the Pearson product moment correlation test (and linear regression). All the numerical data were presented in average ± 1 s.d. Statistical significance was accepted at a confidence level of 0.95.
Results
For all unaffected cortices (normal rats and contralateral hemisphere of stroke rats), strong fMRI activation was observed in the primary motor and forelimb sensory cortex (M1/S1fl) during contralateral limb stimulation for both BOLD (increased signal, Figures 1A and 2A) and CBV (decreased signal, Figures 1C and 2C) images. We did not observe any significant variations in response magnitude (i.e., ΔSI) for repeated stimuli using the CBVw technique (n = 3) during the 3-h duration of the experiments. The lesion volumes were calculated as ratios to cotralesional volume: 0.308 ± 0.171, 0.120 ± 0.048, and 0.253 ± 0.113 for cortex, subcortex, and total, respectively.
Ipsilesional/Contralesional Activation Volume Ratio was Similar between Blood Oxygen Level-Dependent and Cerebral Blood Volume Weighted Techniques
In the contralesional hemisphere of stroke rats, the general anatomic location of the CBV and BOLD activation responses were well matched. However, the volume of activated cortex measured via CBVw technique (35.1 ± 12.4 mm3) was larger (P<0.1) than that measured via BOLD (23.4 ± 6.2 mm3) (Figure 3). In the ipsilesional hemispheres of stroke rats, varying degrees of fMRI activation were observed for both BOLD and CBVw responses, in which the BOLD activation volume (4.1 ± 6.0 mm3) was also smaller but not significantly different (P<0.1) from the CBVw activation volume (8.6 ± 9.8 mm3). Consequently, the activation volume ratios between ipsilesional and contralesional cortices remained similar for both fMRI reporters (Figure 3). These results are consistent with the improved functional sensitivity (i.e., contrast to noise ratio) provided by CBVw technique.
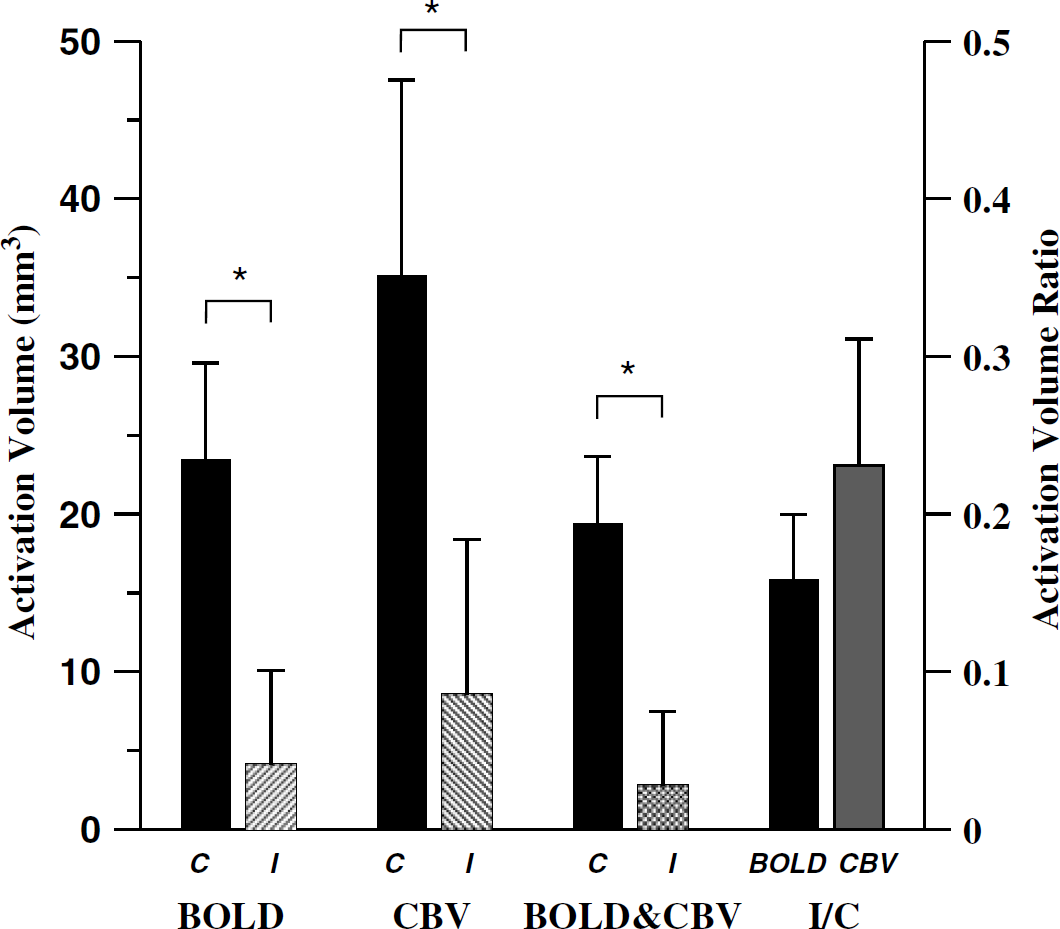
Calculated activation volume in contralesional and ipsilesional SS cortices of stroke animals using BOLD and CBV responses. The tissue volumes that were registered by both responses were shown as BOLD&CBV: C-contralesional, I-ipsilesional, and I/C-activation volume ratio (*P<0.05).
Ipsilesional/Contralesional Activation Signal Intensity Ratio using Cerebral Blood Volume Weighted Technique was Significantly Larger than Using Blood Oxygen Level-Dependent
In contrast to volumes of activated cortex, the magnitude of fMRI responses for BOLD versus CBVw measurements was significantly altered by cerebral ischemia (Figures 2B and 2D). When normalized to the contralesional activation magnitudes, the CBVw fMRI response in the ipsilesional cortex measured using MION was significantly larger (r&DLSIContrastimulusCBV = 29.5 ± 30.0%; see equation (2)) compared with the BOLD fMRI response (rΔSIContrastimulusBOLD = 8.0 ± 15.2%) in all stroke (P<0.05). For normal control animals, r&DLSIContrastimulusCBV ≈ rΔSIContrastimulusBOLD ≅ 1.
Ipsistimulus Functional Magnetic Resonance Imaging Responses were Delayed but Detectable in Stroke and Normal Rats
For all rats, significant ipsistimulus activation was observed in addition to the expected contrastimulus response (Figure 2). The signal intensity amplitude of ipsistimulus response was generally more pronounced for CBVw response than BOLD (Figure 4). This ipsistimulus ‘leak’ in fMRI response was always delayed compared with the contrastimulus responses in all rats. The delay was rather long, approaching almost 11 secs in normal brain (Figure 4B). Both signal intensity and temporal dependency were irrespective of stroke and nearly identical between contra and ipsilesional cortices (Figure 4D).
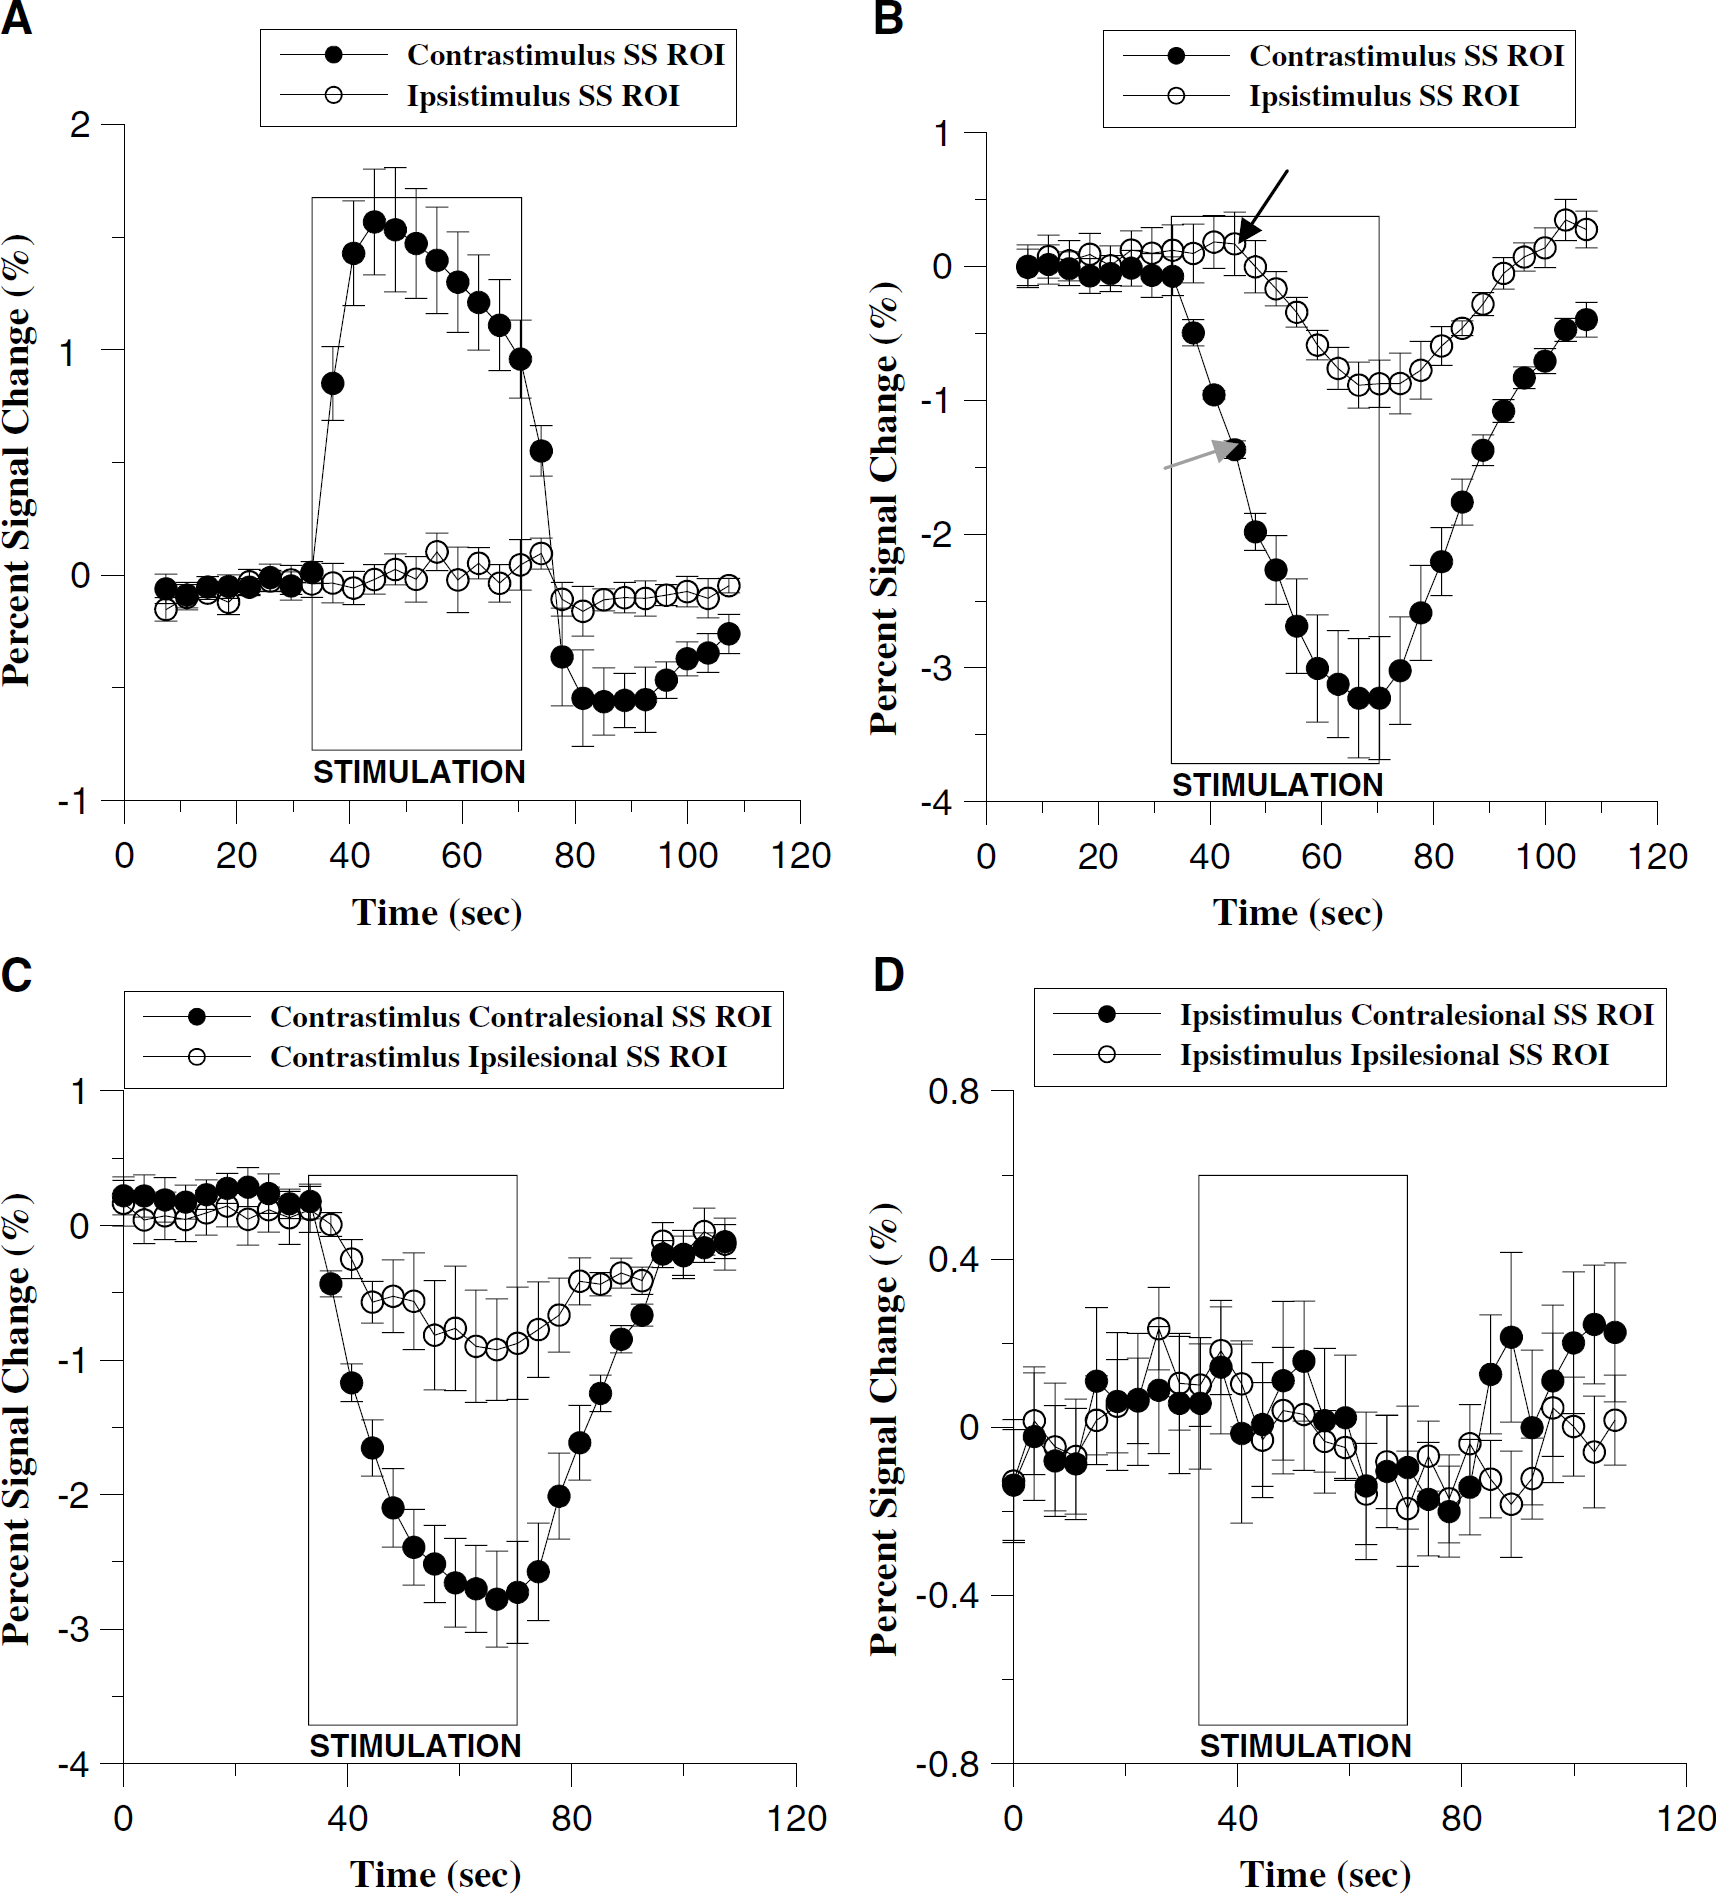
Blood oxygen level-dependent (
Bilateral Thalamic Activation is Affected by Stroke
In normal brain of control rats, bilateral fMRI activation in the thalamus was always observed after forelimb stimulation (Figure 5A). This thalamic activation was much more readily detected using CBV measurements than BOLD, similar to what was observed in cortex when comparing these two fMRI reporters. The bilateral thalamic BOLD response was only approximately 14% of the average CBV response. In stroke rats, bilateral thalamic activation was detected only when the unimpaired forelimb was stimulated (see Figures 1 and 5B). When the impaired forelimb was stimulated, thalamic responses were negligible (Figure 5B).
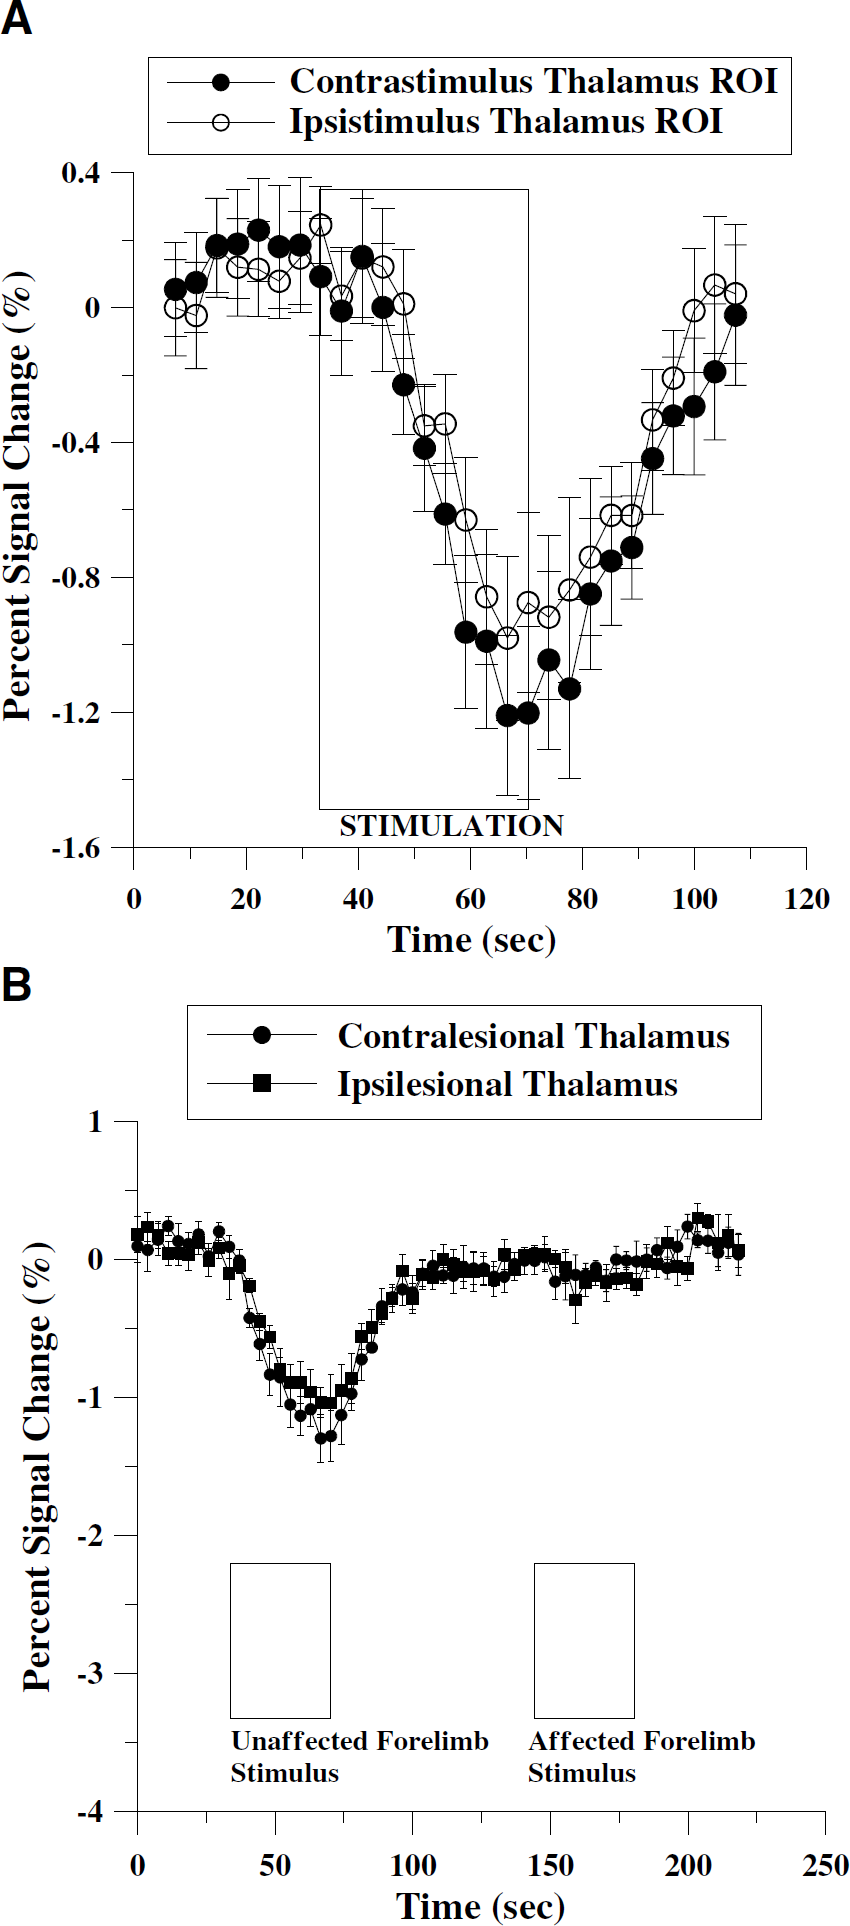
Averaged time course of percent signal change in control animals (n = 5) using CBVw response in thalamus (
Local Structural Parameters were not Correlated with Functional Magnetic Resonance Imaging Recovery after Stroke
We attempted to compare fMRI responses in stroke rats versus a wide array of structural MRI parameters (Figure 6). As shown in Table 1, no significant correlation was found between functional activity, total lesion volume, and other MRI-derived structural parameters. Further correlation analyses using cortical and subcortical lesion volumes independently also did not reveal any dependence of lesion size on other parameters (data not shown). The ADC values in ipsilesional somatosensoty cortex were highly variable at this delayed 2-week stage after stroke. However, the mean ADC was 30 ± 29% higher than contralesional levels (P<0.05). Another parameter that was significantly different was FA, which was 14 ± 15% lower in ipsilesional cortex versus contralesional cortex (P<0.05). Additionally, volume ratio, lambda parallel, and lambda perpendicular from the acquired DTI data were quantified. Either lambda parallel or lambda perpendicular did not yield much different information from the measured FA and ADC results which showed significant difference between contralesional and ipsilesional cortices. However, the volume ratio was not significantly different between two regions. No statistically significant differences were found for the calculated VSI and BV values.
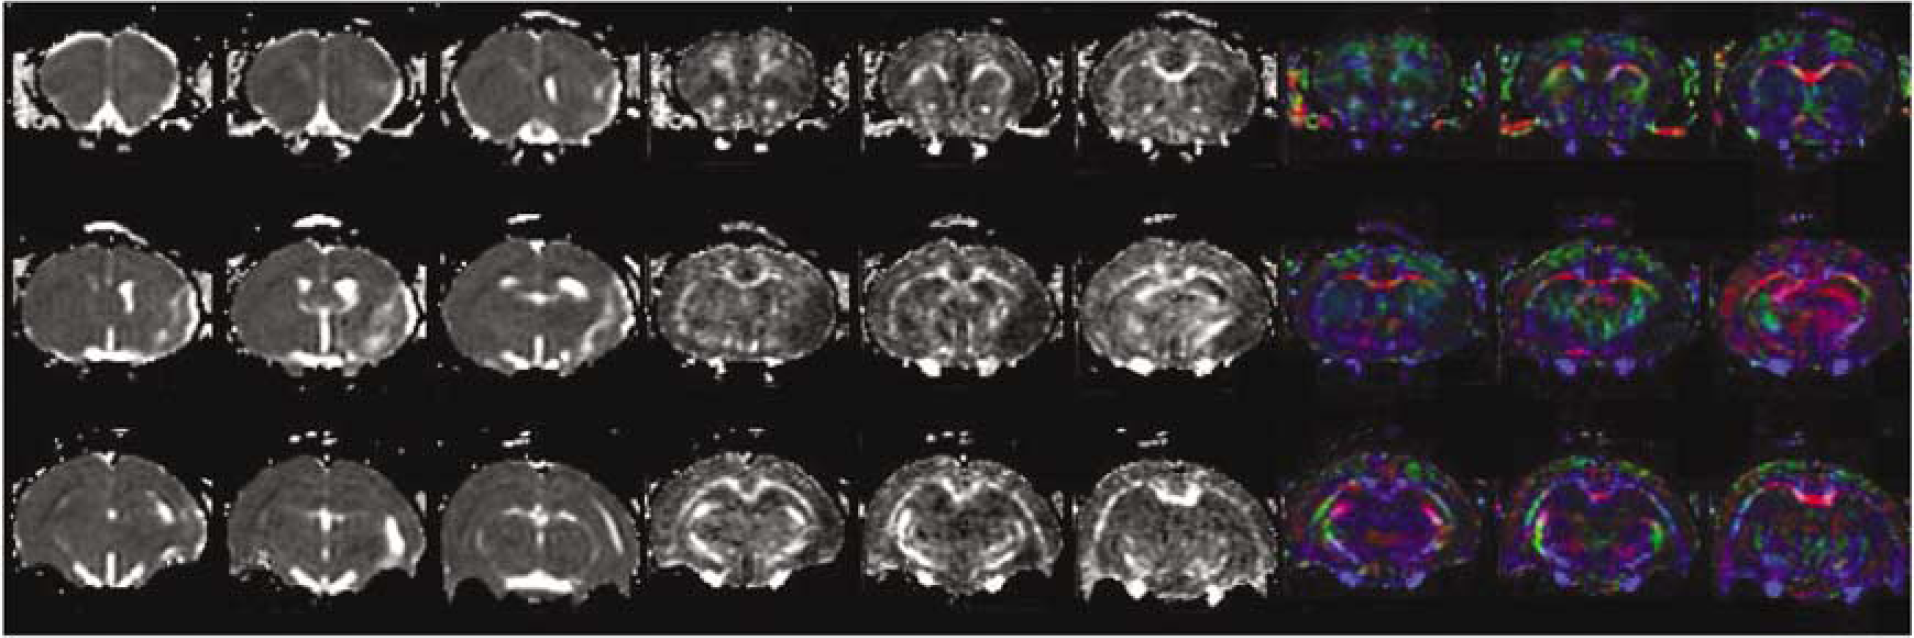
Representative maps of ADC (left 3 × 3 images), FA (middle 3 × 3 images), and color-coded DTI (right 3 × 3 images) with the background of gray-scaled FA map (blue: rostral-caudal, red: left-right, and green: superior-inferior).
Correlation coefficient (r) between MRI-measured structural parameters and functional activities (CS-contrastimulus) using somatosensory ROIs
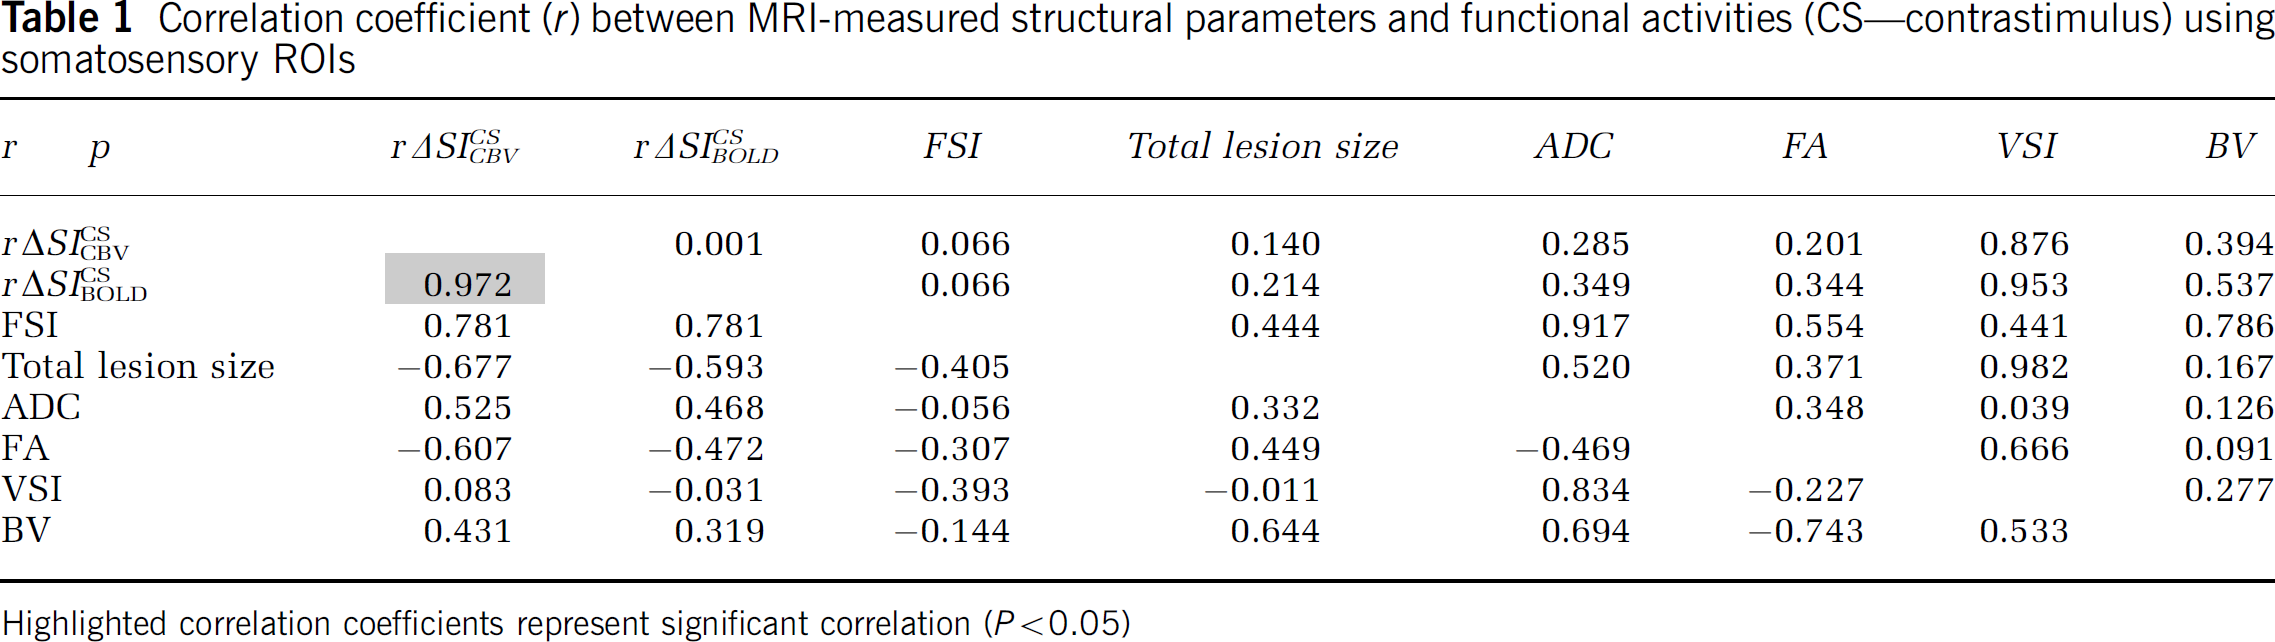
Highlighted correlation coefficients represent significant correlation (P<0.05)
Discussion
Our primary goal was to show whether the fMRI activation status (i.e., vascular physiology of fMRI responses) after transient ischemic insults is transformed during the stroke recovery phase. Although the CBVw technique provided better overall detection power (or contrast to noise ratio), BOLD activation in the stroke hemisphere was significantly attenuated compared with the CBVw activation counterpart even after normalizing each response to the unaffected hemisphere. The data imply that intrinsic hemodynamic responses during the electrical stimulation have been altered in the stroke-affected hemisphere. Additionally, we showed that the overall subcortical activity was also significantly altered, in which fMRI response was only seen with the stimulation of the unaffected forelimb. We also found that ipsilateral (i.e., ipsistimulus) fMRI responses were significantly delayed and appeared to extend beyond sensorimotor cortex. Functional magnetic resonance imaging responses in the lesion hemisphere were heavily dependent on the fMRI reporters (i.e., BOLD and CBVw), however, not on the MRI-derived local structural parameters.
Since fMRI activations were found to be stable for the duration of experiments (n = 3), relative BOLD response magnitudes can be properly compared with the CBVw responses that were measured later in the experiment. Moreover, for stroke animals, any possible temporal dependence and individual variations were further mitigated by measuring the ratios of ΔSI between the contralesional and ipsilesional hemispheres for comparison. As shown by FSI values less than 1 (equation (3)) across all individual stroke rats (FSI = 0.219 ± 0.177 versus 1.07 ± 0.14 for normal rats, P<0.005 using two tailed t-test with unequal variances), mismatched relationship between BOLD and CBVw responses in the affected cortices of the stroke rats was highly reproducible across subjects. A significant difference of the percent signal change ratio (rΔSI) between contralesional and ipsilesional ROIs (i.e., rΔSIContrastimulusfMRI; see equation (1)) and the lopsided FSI values may indicate alterations of several physiological factors, including the baseline ratio CMRO2/CBF (i.e., the ratio of cerebral metabolic rate of oxygen to cerebral blood flow, which is proportional to blood deoxygenation) (Derdeyn et al, 2002) or an altered CBF-CBV relationship (Kajimoto et al, 2003)).
Detailed future studies are warranted to elucidate either if the deviation of the BOLD-CBVw relationship in the stroke hemisphere was caused by alteration of the physiological baseline state, alteration of metabolic or hemodynamic contributions to the response, or an intrinsic nonlinearity of the scaling relationship between BOLD and CBVw responses for small responses. Moreover, it would be also informative to understand whether the effects of prolonged anesthesia influenced the hemodynamic coupling in the presence of stroke-related damages. Although the present study does not provide sufficient answers to address these possibilities, under the current experimental conditions, the relationship between the two fMRI reporters was clearly altered in recovering ischemic brains relative to intact brains.
Significant ipsistimulus responses were observed even in the healthy normal rat brains as shown in Figure 4B. The delayed ipsistimulus responses (~11 secs) may suggest a physiological response that is related to a secondary hemodynamic surge rather than the stimulus-induced neuronal responses which immediately (~20 ms) follow the onset of the stimulus. The delays of ipsistimulus activations were also seen in the previous animal stroke model study using a 2 T system (Dijkhuizen et al, 2003). This delayed-secondary response appeared to affect the entire cortex area (data not shown), in which an elevated BV response was also observed for the contrastimulus response at the onset of ipsistimulus response (see the arrows in Figure 4B). In this regard, it could be suggested that the previously observed ipsistimulus responses derived from the secondary hemodynamic responses might be intrinsically different from the contrastimulus responses. This speculation could be inferred not only from the temporal delay of ipsistimulus responses in the healthy brains but also from the ipsistimulus responses in the stroke models, the onsets of which appeared delayed in both contralesional and ipsilesional cortices when compared with the contrastimulus responses (see Figure 4D). On the other hand, Dijkhuizen et al (2003) previously showed that ipsistimulus responses of stroke rats 14 days after transient stroke were attenuated compared with those of earlier stroke rats (1 to 3 days). Similarly, in the current study, the ipsistimulus response magnitudes of lesion hemisphere were largely reduced (~20%) in comparison to those of normal healthy cortices, suggesting that the ipsistimulus response might be affected during stroke recovery.
Blood oxygen level-dependent percent signal change is believed to be roughly proportional to the blood concentration of deoxyhemoglobin (dHb). The related observations also showed that the BOLD CNR (contrast to noise ratio) is highly correlated with the local BV, while the resting BV dependence of CBV CNR is considerably less than that of BOLD (Mandeville et al, 2001). However, in this study, the mean resting BV in the ipsilesional somatosensory (M1/S1fl) cortex was not significantly different from the contralesional counterpart. Therefore, the measured difference between rΔSIContrastimulusCBV and rΔSIBOLDContrastimulus cannot be attributed to the resting BV. Moreover, no signal voids indicative of a compromised blood-brain barrier (BBB) were observed in any of the experiments. Although the hydrodynamic size of MION particles (diameter: ~30 to 40 nm) is significantly larger than other commonly available contrast agents (e.g., Gd-DTPA), it is still quite possible that BBB disruption in some infarcts at selected time points could degrade functional or structural imaging that relies on this agent. Disruptions of BBB are known to occur soon after acute stroke (Zhang et al, 2000); for these experiments (2 weeks) and previous experiments at 3 days (Dijkhuizen et al, 2001), this was not an issue. Therefore, the fact that the MRI-measured structural parameters were largely uncorrelated with fMRI results (Table 1) shows that the fMRI response can be used as an independent means to evaluate the functional recovery processes.
Our previous results of fMRI responses using a 2 T system indicated that subcortical CBV responses due to forelimb stimulation greatly vary during the recovery phase (Dijkhuizen et al, 2003). In the current study, we examined the subcortical fMRI activities of stroke animals using a 9.4 T magnet. As mentioned above, thalamic CBVw response activities were greatly enhanced as compared with BOLD responses. Interestingly, most of bithalamic activities were observed only when the unaffected forelimbs were stimulated (Figure 5B). Only 13.6 ± 10.6% of CBVw response was seen for BOLD ΔSI. in the contralesional thalamus with the stimulation of the unaffected forelimb. It was previously shown that the BOLD/CBV ratio is smaller in thalamus than in cortex, an effect consistent with regional differences in the resting BV (Mandeville et al, 2001). However, in the current report, when stimulating the unaffected paws, the ratio
Smaller overall subcortical activation volume in the ipsilesional hemisphere than contralesional counterpart (Figure 1) might have resulted from the stroke lesion that extended to the subcortical areas, of which the lesion size relative to the total contralesional subcortical area was 0.120 ± 0.048. However, there were no significant local differences in the measured ADC and FA values between the contralesional and ipsilesional thalamus. ROI analysis also revealed that there was no significant difference in other MRI-derived vascular parameters between the bilateral thalamus (data not shown). The results may indicate that thalamic fMRI activations were more influenced by overall neuronal connectivity than local structural damages. Despite significant contrastimulus CBV responses in ipsilesional SS cortices, the thalamic responses to the affected forelimb stimulation were nearly absent. It can also be suggested that the detection of overall fMRI activation in stroke models is more dependent on neurological factors than local hemodynamic parameters. Although no direct correlation of thalamic activation to the stroke recovery has been made here, in addition to the stroke-affected BOLD and CBVw responses in sensorimotor cortex, we further showed how the assessment of subcortical responses to electrical forelimb stimulation could contribute to developing means for monitoring and understanding the stroke recovery processes.
The purpose of our study was to investigate whether stroke alters fMRI hemodynamics and to present detailed descriptions of vascular damages by quantifying MRI-derived structural parameters. The results warrant detailed future studies to address a number of important questions: i.e., (1) the alteration of couplings between CBF, CBV, and CMRO2 in relation to normal fMRI hemodynamics, (2) unexpectedly poor correlation between lesion size and fMRI activation magnitude, (3) the nature of surprisingly long ipsistimulus delay to onset of fMRI signal, and (4) the origin of subcortical fMRI responses and how the restoration of such is related to the overall stroke recovery. With the detailed understanding of fMRI characteristics after ischemic insults, future studies will aid in clarification of actual damages and altered physiology and will play an important role in the assessment of stroke recovery and the analysis of pharmacological intervention and related outcomes.
Footnotes
Acknowledgements
The authors gratefully acknowledge the financial support from NIH-NHLBI grant 501EB002066 and Dr Saal van Zwanenbergstichting (Organon NV).