
Abstract
The hemodynamic response to neural activity consists of changes in blood flow, blood volume and oxygen metabolism. Changes in the vascular state after sensory stimulation have different spatial and temporal characteristics in the brain. This has been shown using imaging techniques, such as BOLD functional magnetic resonance imaging (fMRI), which monitor vascular changes once the stimulus is turned on, and the eventual return to baseline levels, once the stimulus is turned off. The BOLD fMRI signal during sensory stimulation has been well characterized and modeled in terms of the spatial and temporal characteristics of the vascular response. However, the return of the signals to baseline levels after sensory stimulation is not as well characterized. During this period, a poststimulus undershoot in the BOLD signal is observed. This poststimulus undershoot has been modeled and investigated to characterize the physiological mechanisms (cerebral blood flow (CBF), cerebral blood volume (CBV), and cerebral oxygen consumption) associated with the response. However, the data in the literature, which lack any spatially dependent information, appear to be contradictory in terms of the mechanisms associated with this poststimulus response. With a high spatial resolution cat model at 9.4 T, we show that CBV changes in the tissue persist once the stimulus is turned off, while CBV changes in the surface vessels quickly return to baseline levels, despite a concurrent undershoot in the BOLD signal in both the tissue and surface vessel areas. In addition, the BOLD data alone indicate that different physiological mechanisms regulate the poststimulus response in the tissue versus the surface vessel regions.
Introduction
Increases in neural activity in the brain are accompanied by elevations in cerebral blood flow (CBF), cerebral blood volume (CBV) and cerebral oxygen consumption (CMRO2). These changes are detectable with the blood oxygen level-dependent (BOLD) (Ogawa and Lee, 1990; Ogawa et al, 1990a, b) signal contrast, which is used in functional imaging of brain activity with magnetic resonance (MR) (functional magnetic resonance imaging (fMRI)) (Kwong et al, 1992; Ogawa et al, 1992). BOLD contrast is sensitive to changes in the tissue concentration of paramagnetic deoxyhemoglobin, which, in turn, reflects perturbations in CBF, CBV and/or CMRO2.
The temporal dynamics of stimulus-induced perturbations in CBF, CBV and CMRO2 are not identical and lead to mismatches in the total concentration of deoxyhemoglobin. The first observable mismatch occurs at the onset of neural activity, where increases in oxygen consumption in the tissue result in enhanced levels of local deoxyhemoglobin (Cannestra et al, 2001; Ernst and Hennig, 1994; Frostig et al, 1990; Grinvald et al, 1991; Malonek and Grinvald, 1996; Menon et al, 1995; Thompson et al, 2003; Yacoub et al, 2001). Originally reported in optical imaging studies (Frostig et al, 1990; Grinvald et al, 1991; Malonek and Grinvald, 1996), this early mismatched state has been detected in T*2-weighted gradient-echo (GE) MR studies on several occasions (Cannestra et al, 2001; Ernst and Hennig, 1994; Menon et al, 1995; Yacoub et al, 2001), most robustly in human studies, and is commonly referred to as the ‘initial dip’. The ‘initial dip’ is short lived (2 to 3 secs), and requires relatively high temporal resolution to detect. Cerebral blood flow increases that follow within a few seconds more than compensate for any increases in oxygen consumption and CBV, resulting in an overall decrease in the local deoxyhemoglobin content and, consequently, increased signal intensity in T2- or T*2-weighted MR images.
Subsequent to the termination of the stimulus, the return of fMRI signals to basal levels can take as long as 90 secs (Fransson et al, 1998), depending on the nature of the stimulus. During this time, a decrease below the baseline MR signal level, followed by a slow return to the baseline, is often observed in T*2-weighted GE MR images, and this phenomenon is referred to as the poststimulus undershoot (Chen et al, 1998; Davis et al, 1994a, b; Frahm et al, 1996; Kruger et al, 1996). This negative BOLD signal change can be the result of mismatches in CBF, CBV and/or CMRO2. In the literature, the fMRI data and subsequent modeling of the data can be broken down into two main groups. The first, initially proposed by Frahm et al (1996; Kruger et al, 1996) and Davis et al (1994a, 1998), and more recently by Lu et al (2004), proposes a possible mismatch or uncoupling between oxidative metabolism and CBF. According to this explanation, a slower return of CMRO2 to baseline compared with CBF causes the observed BOLD undershoot after stimulation. The second, formulated by Buxton et al (1998) and Mandeville et al (1999b) based on data from Mandeville et al (1998), suggests an uncoupling between CBF and CBV, with CMRO2 and CBF remaining tightly coupled. In this model, a slow return of CBV to baseline levels compared with CBF and CMRO2 is the mechanism underlying the poststimulus undershoot in the BOLD signal. An expansion of this model (Friston et al, 2000; Hoge et al, 1999) allowed for, in addition to the slowly recovering CBV changes, an undershoot in CBF after stimulation as a contributing mechanism to the BOLD undershoot. What is lacking in the literature is the investigation of any potential spatial dependencies of these observed poststimulus signals, which may explain some of the discrepancies in the published data.
Just like their steady-state magnitudes, the temporal dynamics of the physiological parameters that contribute to fMRI signals, namely CBF, CBV and CMRO2, are expected to be spatially dependent and sensitive to different blood vessel types. Cerebral oxygen consumption changes occur in the tissue and affect the hemoglobin oxygenation state first in the capillaries; due to blood flow, this change in blood deoxyhemoglobin concentration propagates down the postcapillary vasculature and appears in draining veins at a later time. Similarly, CBV and/or CBF changes, which also contribute to fMRI signals, need not occur at the same time in the vascular tree. In addition, these changes do not necessarily propagate down the vascular tree. The discrepancies between the previous studies regarding the mechanism of the poststimulus undershoot (Lu et al, 2004; Mandeville et al, 1998) may in fact originate from differences in the spatio-temporal dynamics. We have investigated this question by acquiring high spatial resolution images in the cat visual cortex at 9.4 T using CBV-weighted monocrystalline iron oxide nanoparticles (MION) and gradient echo (GE) and Hahn spin echo (HSE) BOLD during and after the presentation of a visual stimulus.
Materials and methods
Cats (n = 4) were prepared as described previously (Harel et al, 2002, 2005). Briefly, the animals were initially anesthetized intramuscularly with a ketamine (10 to 25 mg/kg) and xylazine (2.5 mg/kg) cocktail. The animals were intubated and artificially ventilated with isoflurane anesthesia throughout the experiment (1% in a N2O:O2 mixture of 70:30). Blood pressure, end-tidal CO2 and body temperature were maintained at normal conditions. The animal's eyes were refracted and focused on the stimulus using corrective contact lenses. The animal was placed in a cradle and restrained in normal postural position using a custom-designed stereotaxic frame. Visual stimuli consisted of binocular high-contrast square-wave moving and rotating gratings (0.15 cyc/deg, 2 cyc/sec) for 40 secs. To achieve a maximum amount of activity, the drift direction of the gratings was reversed every 2 secs, and every 4 secs the orientation of the gratings was changed in increments of 36° so that a total of 360° of rotation was achieved by the end of a stimulation period.
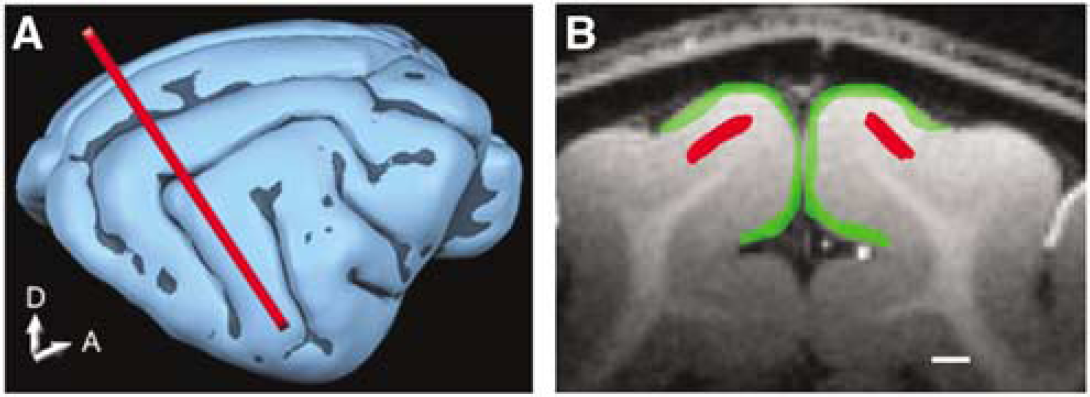
All MRI experiments were performed on a 9.4 T/31 cm (Oxford, UK) magnet equipped with a Varian console (Palo Alto, CA, USA). A 1.4-cm diameter transmit and receive surface coil was used. A coronal slice perpendicular to area 18 (crossing at Horsley-Clark AP2) was used for the functional study (see Figure 1A). Anatomic images were obtained using a T1-weighted 2D TurboFLASH (fast low angle shot) and a T1-weighted 3D GEMS (gradient echo multi-slice) sequence with a matrix size of 128 × 128 × 128 over a field of view of 5 × 5 × 5 cm3. Functional images were obtained using both GE and HSE BOLD sequences. In addition, CBV-weighted GE images were acquired after an intravenous bolus injection of MION (10 mg Fe/kg). Image parameters for the GE BOLD and MION studies were: data matrix = 128 × 128, four-segment echo planar imaging (EPI), FOV = 1.92 × 1.92 cm2. The slice thickness was 2 mm and the TE/TR was 20 ms (10 ms with MION)/1 sec (per segment). A flip angle of 60° was used, corresponding to the Ernst angle. For the HSE BOLD sequence, a reduced FOV along the phase encode direction was applied using a selective refocusing pulse. This allowed us to reduce the number of segments needed for the high-resolution images. Imaging parameters were: data matrix = 256 × 64, two-segment EPI, FOV = 3.84 × 0.96 cm2. The slice thickness was 2 mm and the TE/TR = 40 ms/2 secs (per segment). The scan time for 1 image was 4 secs and the in-plane resolution 0.15 × 0.15 mm2 for all sequences. The readout time for a single line of K-space was 0.7 ms, yielding a total EPI readout time of 22.4 ms for both GE-and HSE-weighted acquisitions. The spatial blurring due to the EPI readout was negligible (Haacke et al, 1999). The MRI data were Fourier transformed and analyzed using the Stimulate software (Strupp, 1996) and Matlab codes (The MathWorks, Inc.). A low-pass (temporal) filter was used to remove high-frequency noise; however, no spatial smoothing was applied. Functional time courses were generated by selecting all pixels within regions of interest (ROIs) in the tissue areas, as well as in the surface vessel areas in each cat (see Figure 1B). In addition, all pixels in these ROIs were included in the analysis (i.e. pixels were not excluded based on statistical thresholds of activation). Tissue ROIs were centered over the middle cortical layers and expected to primarily contain small vessel or capillary signals. Surface vessel ROIs were dominated by pial surface vessels. Data from an individual cat and the average of all cats are presented.
(
The spatial temporal dynamics of the tissue and surface vessel regions were examined for both the BOLD- and CBV-weighted MION data. Tissue and surface vessel regions were analyzed for changes in the hemodynamics during and after the presentation of the stimulus. The stimulus response period was defined starting from 12 secs (3 images) after the stimulus was turned on until the stimulus was turned off for a total of 7 images (28 secs). The poststimulus response period was defined as the time period starting 16 secs after the stimulus was turned off through the next 40 secs (10 images) thereafter. This time period was selected by finding the average peak negative poststimulus response in the BOLD signal and then averaging several images before and after the peak response. The baseline signal level was defined as the average signal during the time period before the stimulus was turned on. The CBV percent signal changes in the tissue and surface vessel regions during this poststimulus period were quantified and compared for differences. The magnitudes of the BOLD responses during the stimulus response period and during the poststimulus response period were separately quantified and averaged. The ratios of the positive BOLD response (percent change from baseline) between the tissue and surface vessel regions, and the ratios of the poststimulus BOLD response (percent change from baseline) between the tissue and surface vessels regions, were compared (see eq. (1)). Any differences between these ratios can be attributed to spatially dependent mechanisms controlling the two responses (see Discussion). This was performed separately for GE and HSE data, which have intrinsically different vessel and tissue contributions to the data (Yacoub et al, 2005b). Finally, the fMRI timecourses from each cat were normalized to the maximum signal change for the CBV and BOLD data, respectively, and the normalized data were then averaged across all cats.
Results
Statistically significant signal changes were observed in 4 cats for the GE BOLD, HSE BOLD and CBV-weighted MION images. Sustained positive and negative signal changes were observed in T*2-weighted images in the absence and presence of the contrast agent MION, respectively. The former is ascribed to the BOLD effect consequent to a stimulus-induced decrease in the local deoxyhemoglobin concentration. The intravenous injection of MION causes the MR signal to decrease due to the shortening of the T*2 of blood water and due to the increased susceptibility gradients surrounding blood vessels. Thus, when CBV, and hence the volume occupied by MION, increases, as it does after neuronal stimulation, additional signal decreases are observed in T*2-weighted images. For comparison and visualization purposes with the BOLD data, the CBV-weighted MION data are shown with the opposite sign (positive signal changes).
In addition to signal changes during the presentation of the stimulus, after the cessation of the stimulus, prolonged responses in the hemodynamic signals were observed before they finally returned to baseline levels. In the data reported in this paper, the early dip was not observed. The reasons for this are twofold. First, the image repetition time was 4 secs and the dip signal has been reported to last only 2 to 3 secs (Hu et al, 1997; Yacoub et al, 1999). Second, all the analysis was performed using ROIs, and as a result pixels that might have the early dip were mixed with others, in close proximity, which did not have the dip. Unlike the ROI-based analysis used here, studies aimed at identifying the early dip use in their statistical analysis a template containing this temporal behavior to identify the appropriate pixels (e.g. Yacoub et al, 1999).
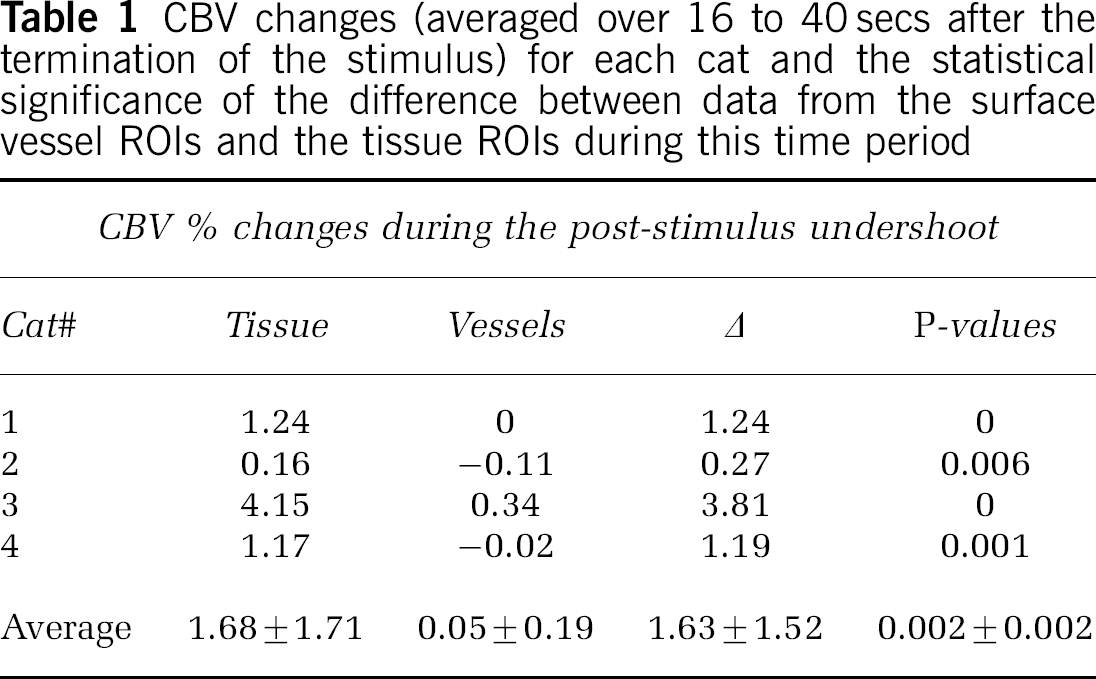
Time courses from ROIs in the tissue and surface vessel regions for the GE BOLD- and CBV-weighted studies from a representative cat are shown in Figure 2. Note that the temporal profiles of the GE BOLD signals from the surface vessel and the tissue region are similar, except for differences in the signal amplitudes (Figure 2A). However, temporal profiles of the CBV-weighted signals are noticeably different (Figure 2B). While the profiles are similar for the duration that the stimulus is on, once the stimulus is turned off, there is a discrepancy between the two regions. In the surface vessel region the CBV-weighted signal levels return close to baseline levels soon after the cessation of the stimulus, while in the tissue region the signal remains elevated for several more seconds. As described in the Materials and methods section, for quantitative analysis, time spanned by image number 23 through 32 (inclusive) was defined as the poststimulus period (16 to 40 secs after the stimulus termination). Averaged over this poststimulus period, the percent CBV change observed in the tissue and surface vessel ROIs in this and all other cats are given in Table 1. A Student's t-test was performed to calculate the significance of the difference of the CBV data points during the poststimulus period in the tissue versus the surface vessel ROI for each cat. The corresponding P-values are also reported in Table 1.
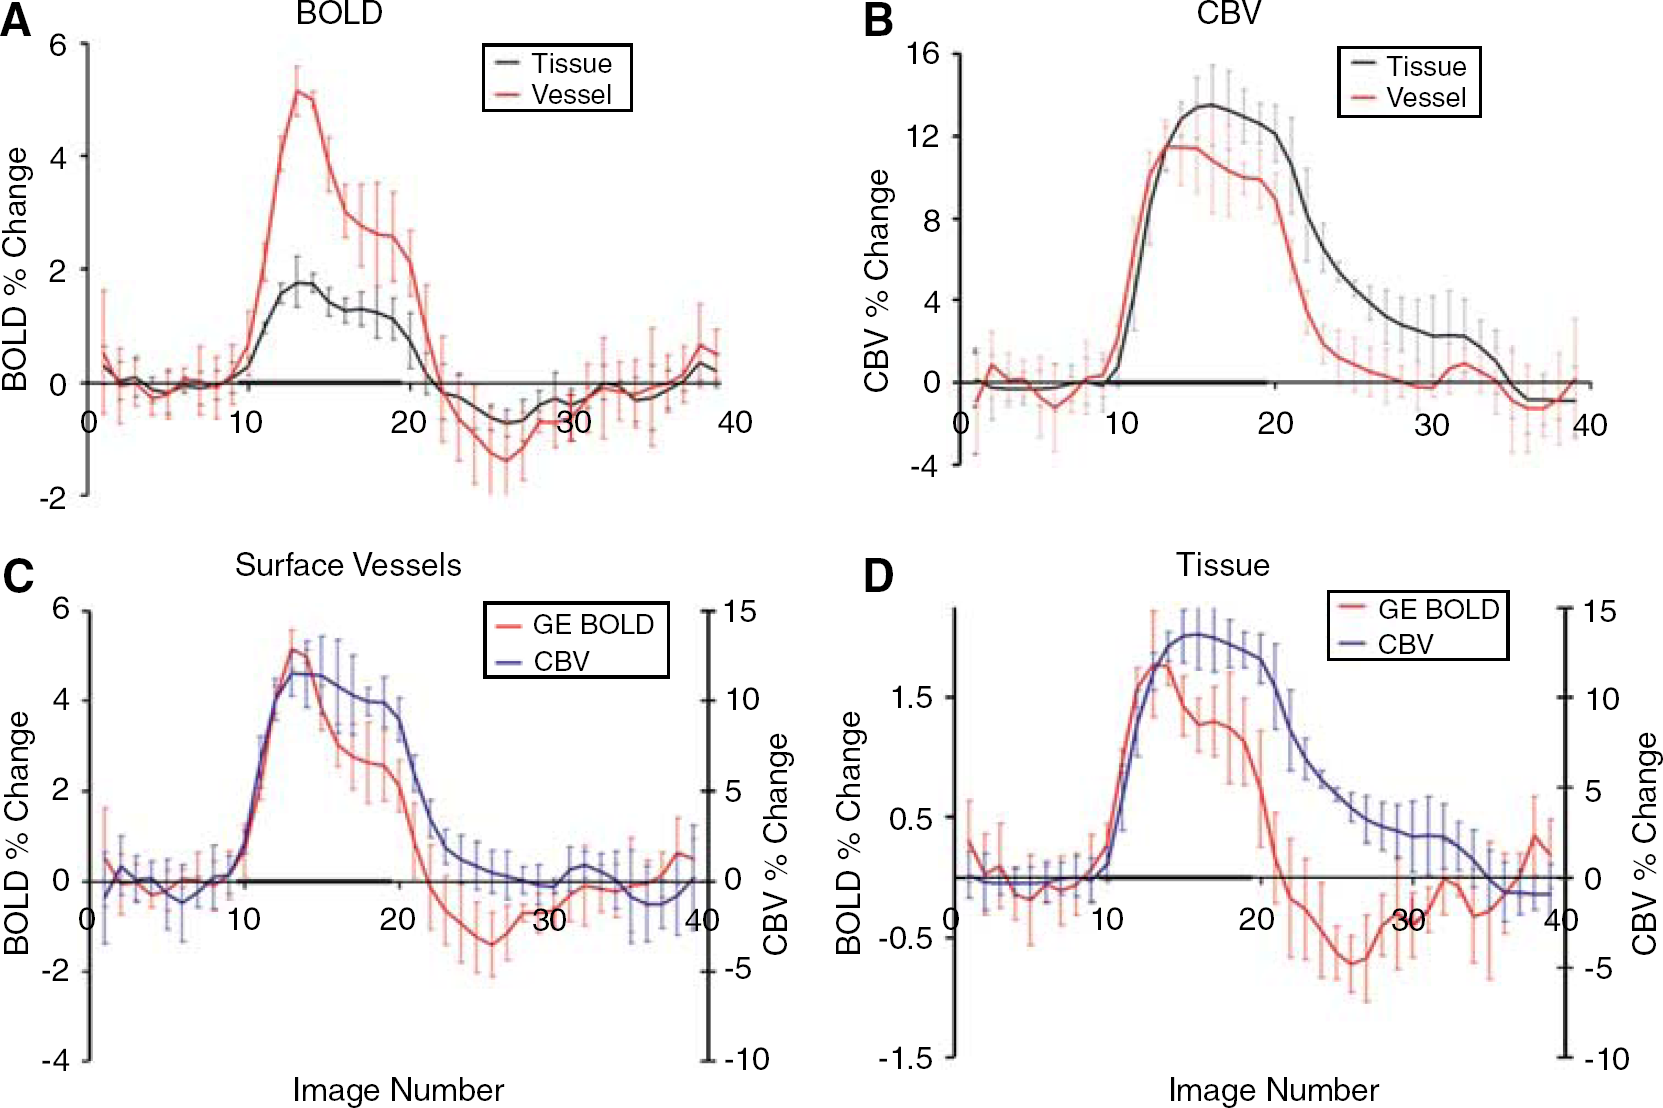
CBV changes (averaged over 16 to 40 secs after the termination of the stimulus) for each cat and the statistical significance of the difference between data from the surface vessel ROIs and the tissue ROIs during this time period
Plots showing data from a single cat. Tissue versus vessel timecourses are compared in (
Figures 2C and 2D display the same data as in Figures 2A and 2B, but are grouped in a different way to better illustrate the relationship between the temporal dynamics of CBV versus GE BOLD in a given spatial location. Figure 2C shows the time courses of GE BOLD and CBV together for the surface vessel ROI; in this spatial location, a GE BOLD signal undershoot is observed, while CBV changes have essentially returned to baseline levels. Figure 2D depicts the analogous data for the tissue ROI, where the poststimulus undershoot of the GE BOLD response is evident, while the CBV response persists during the same period. Averaged over all animals, the percent change in CBV from baseline during the poststimulus period was 1.68 ± 1.71 in the tissue ROIs, and 0.05 ± 0.19 in the surface vessel ROIs (Table 1). The average of the individual animal P-values reflecting the statistical significance of this difference was P < 0.002 ± 0.002 (the error signifies the spread of P-values between the different cats).
There can be substantial hemodynamic variance between cats, depending on the physiology of the animal (Harel et al, 2002). Despite this possible confound, the trends seen in one cat shown in Figure 2 were observed in all four cats. This is illustrated in Figure 3, which shows the normalized (to maximum percent change) time courses averaged over all animals. Figures 3A and 3B display the GE BOLD data (Figure 3A) and the CBV data (Figure 3B), respectively. The GE BOLD behavior is not different for the surface vessel versus the tissue ROI. However, the poststimulus CBV response in the two different ROIs is different.
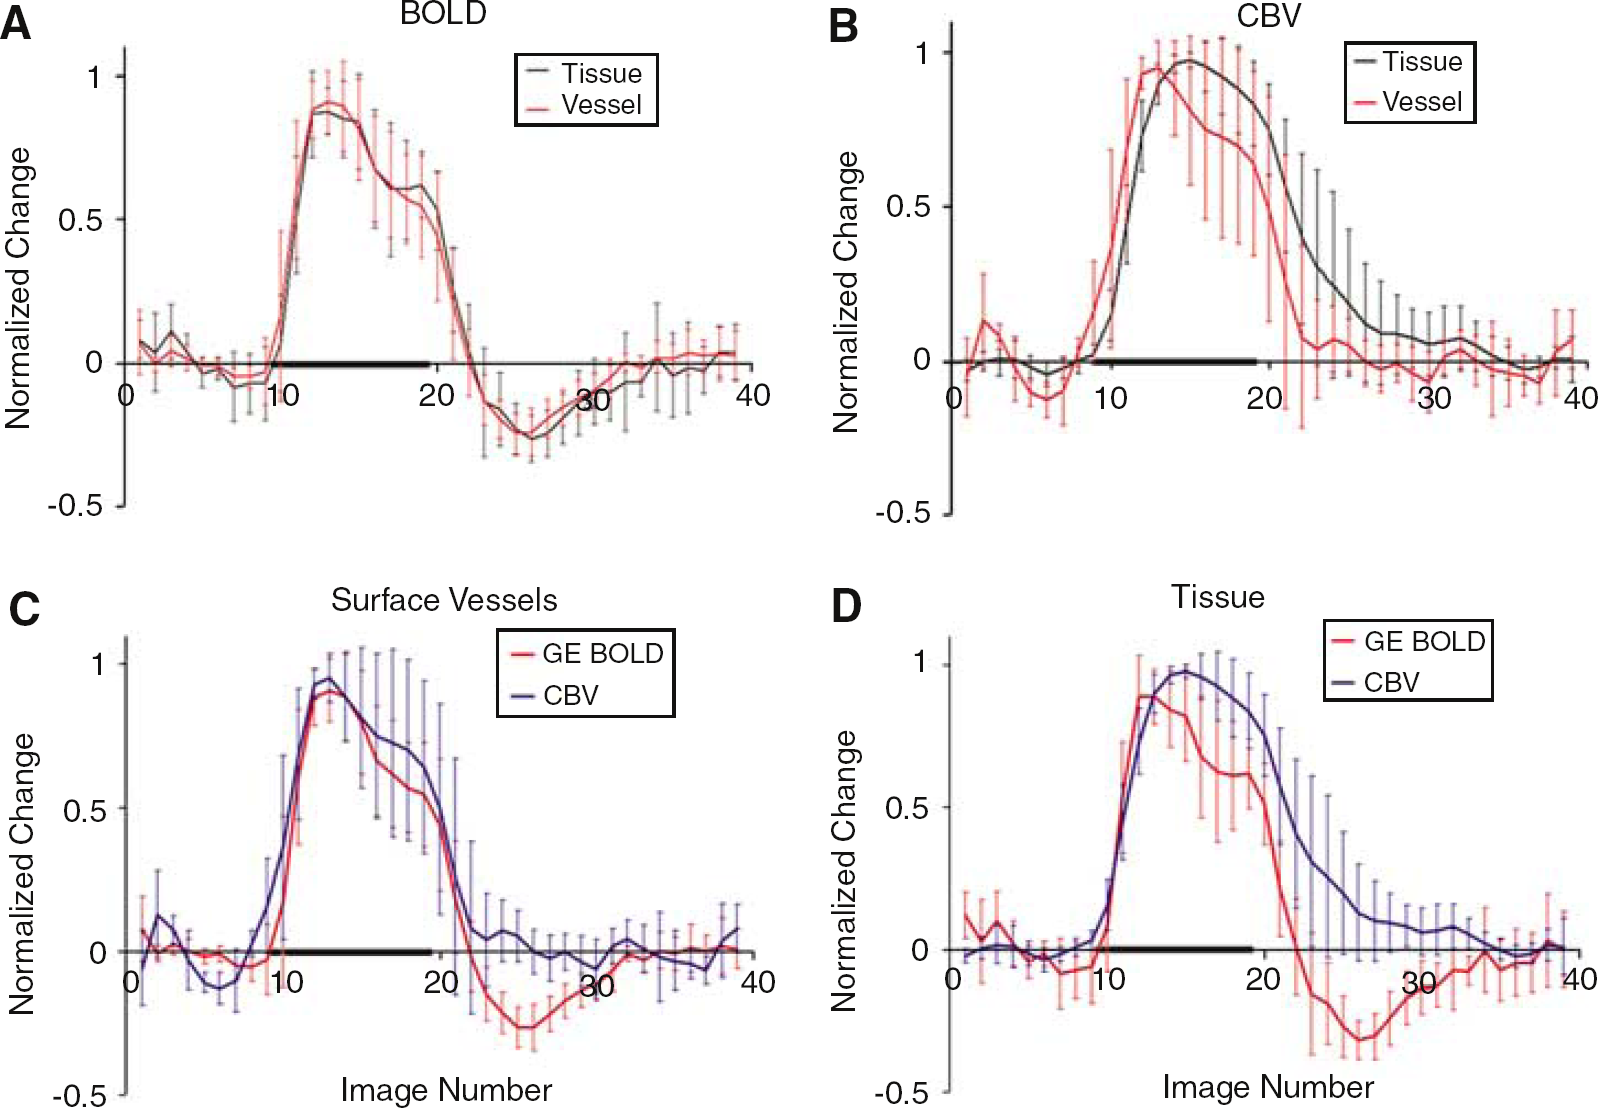
Plots showing data from the normalized average of all cats. Tissue versus vessel timecourses are compared in (
In the surface vessel ROI (Figure 3C), when averaged over all animals, the GE BOLD signals again display a retreat below the baseline levels and a slow recovery to the baseline, while the CBV-weighted MION signals appear to return to baseline levels much sooner than CBV signals originating from the tissue regions (P < 0.002). In the tissue region (Figure 3D), the GE BOLD signal drops below baseline once the stimulus is turned off and then slowly recovers to baseline levels, while the CBV-weighted signal from the tissue remains elevated and returns to baseline at roughly the point where the GE BOLD signal returns to baseline.
The HSE BOLD data were similar to the GE data. Both the surface vessel and tissue areas showed similar temporal profiles, with differences only evident in the magnitudes. A positive BOLD response was followed by a poststimulus negative response. Figure 4 shows the spatio-temporal profiles of the HSE BOLD data from an individual cat (Figure 4A) (same cat as in Figure 2) and the normalized average of all cats (Figure 4B). Note that the vessel response from a single cat in the HSE BOLD data is quite noisy. Many of the pixels in this ROI would not pass statistical significance for activation, and a functional map would be dominated by tissue signals as expected.
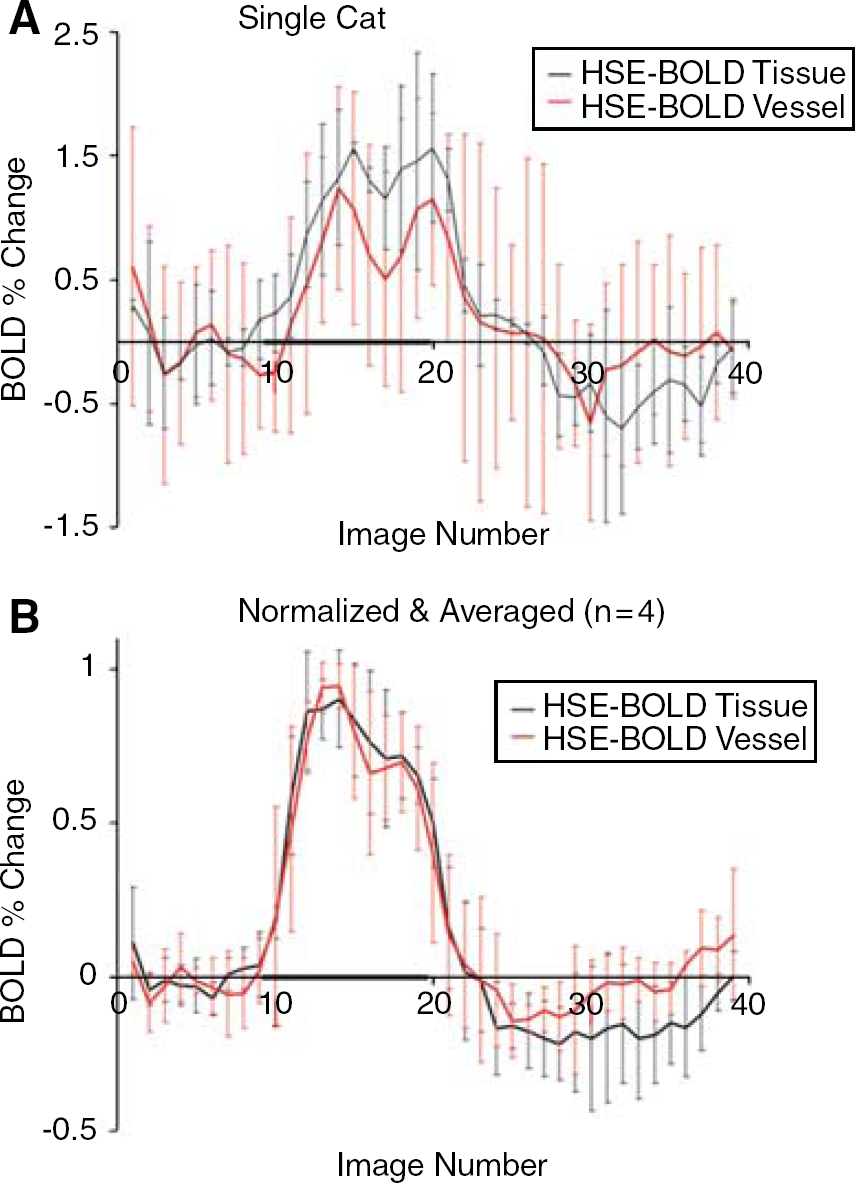
Hahn spin echo BOLD plots from a single cat (
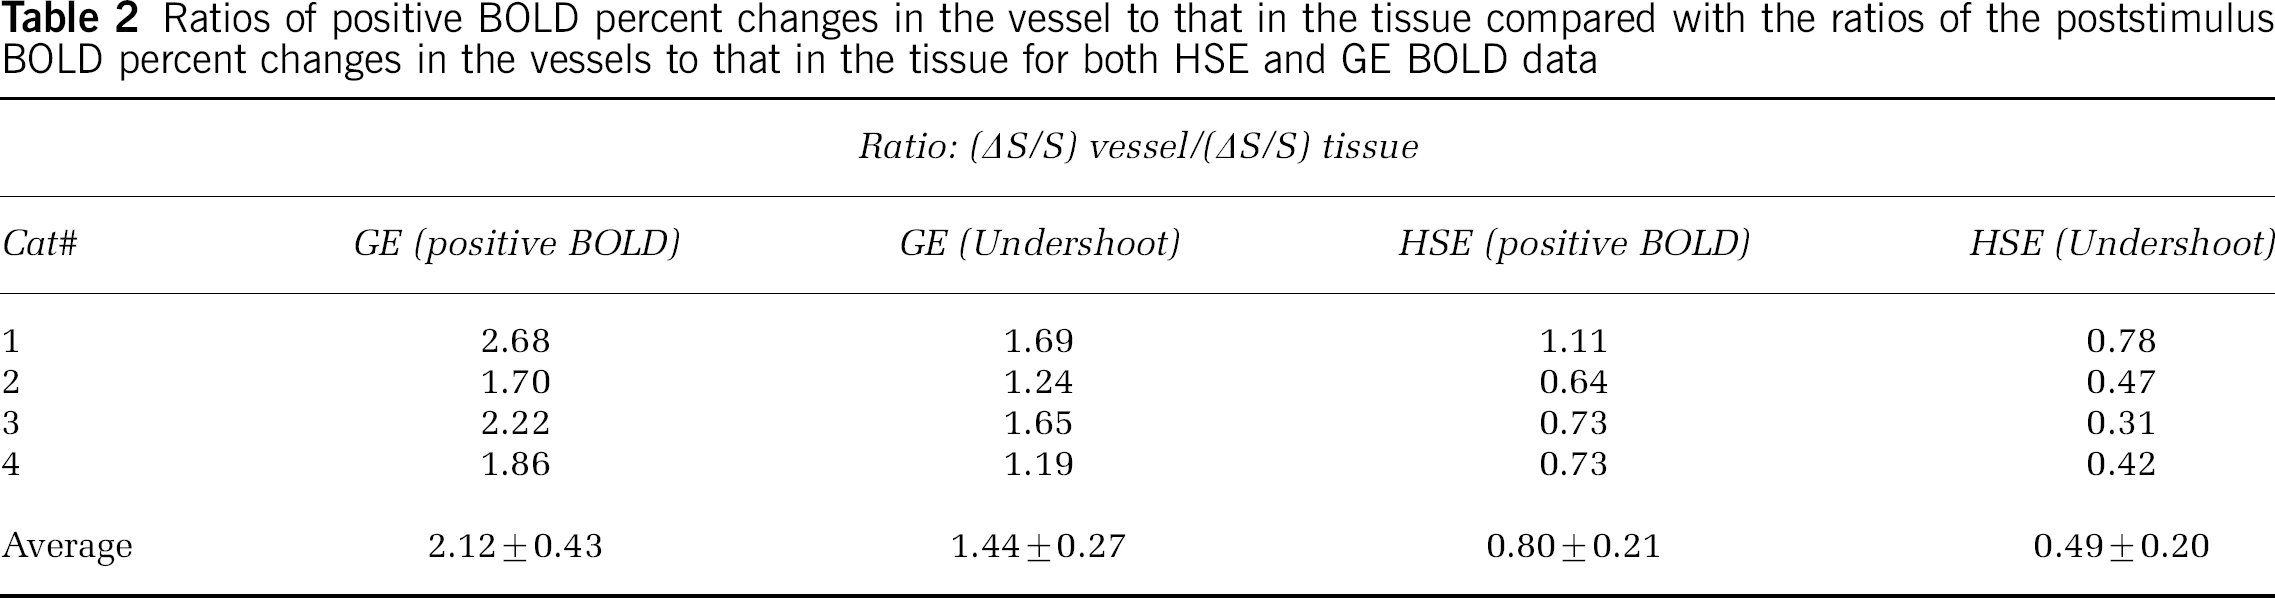
Finally, when the ratios of the positive BOLD response (vessel areas over tissue) are compared with the ratios of the poststimulus response (vessel areas over tissue) in four cats, a statistically significant difference is observed between them.
More explicitly,
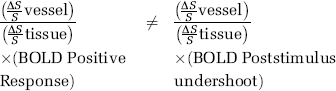
These ratios in the GE and HSE BOLD data are summarized in Table 2. This difference in the ratios is more significant in the HSE BOLD data (P < 0.01), as opposed to (P < 0.06) in the GE data (see Table 2). The BOLD percent signal changes in the tissue are similar in the GE and HSE data (∼5% larger in GE), however the signal changes in the surface vessel areas are almost 3 times larger in the GE data (data not shown) for the echo times used in this study (20 and 40 ms for GE and HSE fMRI, respectively).
Ratios of positive BOLD percent changes in the vessel to that in the tissue compared with the ratios of the poststimulus BOLD percent changes in the vessels to that in the tissue for both HSE and GE BOLD data
Discussion
In this work, we investigated the spatial temporal characteristics of BOLD and CBV-weighted MION signals in the cat visual cortex during and after visual stimulation. The study was conducted with high spatial resolution and allowed for a clear distinction between tissue regions, areas containing mainly capillary size vessels, versus the cortical surface, areas containing mainly large pial vessels. The BOLD signal reflects changes in the local concentration of deoxyhemoglobin on the venous side, and can originate from changes in blood flow, oxygen consumption or blood volume, while MION-based data reflect changes in total CBV (venous and arterial). Despite these different sensitivities in the imaging methods employed, our CBV and BOLD data analyzed either independently and/or together clearly show that hemodynamic changes in the cortex subsequent to the termination of a stimulus are spatially dependent.
There are conflicting explanations in the literature regarding the physiological mechanisms associated with the poststimulus undershoot in the BOLD signal. One theory proposes an uncoupling between oxygen metabolism and blood flow (Davis et al, 1994a, 1998; Frahm et al, 1996; Kruger et al, 1996), and suggests that CBF returns to baseline, while CMRO2 remains elevated once the stimulus is turned off, causing an undershoot in the BOLD signal. This was not based on direct measurements of CMRO2; rather, it was a possible mechanism that could explain the BOLD time course. The balloon model (Buxton et al, 1998) and the delayed compliance model (Mandeville et al, 1999b) assign the mechanism of the poststimulus BOLD undershoot to the delayed blood volume recovery and assumes that CBF is tightly coupled to oxygen metabolism. Additional studies have added to this model a poststimulus undershoot in CBF as a possible contributor to the BOLD undershoot (Friston et al, 2000; Hoge et al, 1999; Jasdzewski et al, 2003; Obata et al, 2004). Most recently, a study by Lu et al (2004), using vascular space occupancy (VASO) fMRI to measure CBV and ASL (arterial spin labeling) to measure CBF, suggested that CBV and CBF both return to baseline relatively quickly and therefore CMRO2 must presumably remain elevated and uncoupled from CBF, causing the poststimulus undershoot in the BOLD response.
In summary, the fMRI literature regarding the poststimulus undershoot is inconclusive. Some of the discrepancies, however, might be explained by the use of different imaging methods, which have different signal sources. In addition, in this work, we shed new light on this confusion by adding spatial information to the observed changes after stimulation.
Spatio-Temporal Characteristics of the Poststimulus Cerebral Blood Volume Response
The central conclusion that can be reached from our results is that the temporal dynamics of blood volume, subsequent to cessation of a stimulus, are distinctly different for blood vessels located on the cortical surface versus the microvasculature in the mid-cortical layer. While the large surface vessels display a rapid return of the CBV response to near-baseline levels at the termination of the stimulus, the stimulus-induced elevation in CBV of the microvasculature has a much slower decay to basal values. This difference in dynamics may serve as a signature to delineate the vascular components contributing to CBV-based imaging methods, where the resolution is not sufficient to distinguish between different parts of the vascular tree. For example, our data and the human data obtained using the VASO technique (Lu et al, 2004) would be consistent only if the signal changes monitored with the VASO technique at the resolutions used were dominated by surface vessels, since they report temporal dynamics that are identical to ours for the surface vessel ROI, but not for the intra-cortical ROI. Furthermore, our data would also be consistent with that of Mandeville et al (1998), which used MION-based CBV measurements and the corresponding theoretical models (Buxton et al, 1998, 2004; Mandeville et al, 1999b), if only the tissue areas are considered.
Spatial Dependence of the BOLD Undershoot
Irrespective of whether the measured CBV changes display a slow or a fast return to baseline, BOLD signal undershoots persist in the tissue as well as in the surface vessel regions. One potential confound in comparing MION-based CBV signal changes with BOLD data is that the former is expected to reflect total changes in blood volume (i.e. arterial, capillary and venous volumes together), while CBV changes that contribute to the BOLD signal can only originate from the capillaries and the venous side. However, in the surface vessel ROI, total CBV measured by the MION technique recovers to basal levels rapidly, while the BOLD undershoot persists. This implies that the CBV component relevant to BOLD signals must also have returned to basal values despite the presence of the BOLD undershoot. Therefore, at the surface region, CBV effects can be excluded as the dominant mechanism in the poststimulus BOLD undershoot; instead, the poststimulus CMRO2/CBF (see note) ratio must be elevated relative to baseline after the cessation of the stimulus, recovering to basal levels slowly. This ratio is, of course, affected by either changes in CMRO2 or CBF alone, or appropriate changes in both parameters.
In the tissue region, the ambiguity in the CBV signal changes regarding contributions from different parts of the vasculature remain and is further discussed later on. Nevertheless, our data indicate that CBV is a potential contributor to the poststimulus undershoot in the tissue region. Of course, based on our data obtained from the tissue ROI alone, possible CMRO2/CBF effects in the poststimulus BOLD undershoot cannot be ruled out in the tissue region.
Fractional deoxyhemoglobin content in blood (i.e. deoxyhemoglobin/total hemoglobin) is directly proportional to the CMRO2/CBF ratio and is set in the tissue region, where the oxygen consumption occurs. Once past the capillaries, the total deoxyhemoglobin content of blood remains virtually unaltered as blood drains into the surface veins. Therefore, an ‘activated’ tissue ROI and surface ROI adjacent to it will report the same stimulus-induced or poststimulus deoxyhemoglobin changes, provided the surface ROI does not experience significant blood flow originating from inactivated areas. If CBV effects are ignored, the tissue versus vessel ROI ratio (Table 2) for the stimulus-induced positive BOLD response and for the poststimulus BOLD undershoot should be the same. However, they are not (Table 2), indicating that the dynamics of CBV contributions to BOLD must be different between the tissue and surface vessel regions. Thus, the BOLD data alone show the presence of distinctly different physiological mechanisms regulating the poststimulus response in the tissue versus the surface vessel regions.
Possible Mechanisms of the BOLD Undershoot
Elevated Cerebral Blood Volume: In the tissue ROI, the poststimulus undershoot in the BOLD signal can in part be explained by the sustained CBV response above baseline, provided postarterial vessels undergo stimulus-invoked volume changes. Magnetic resonance studies of activation using arterial spin-labeling techniques have shown CBF, and hence by implication CBV, regulation at the columnar level (Duong et al, 2001). This was confirmed in a recent study (Vanzetta et al, 2005), where significant and active changes in blood volume at the capillary level were directly observed, and were even noted to be more pronounced than those on the venous side, which showed the lowest amplitude. Thus, CBV changes are known to exist in the postarterial microvasculature (capillaries and venules), and their slow return to basal levels can be the source of the poststimulus undershoot. However, in the surface vessel areas, our data clearly indicate that the BOLD undershoot persists without any significant changes in CBV.
An alternative possible explanation for an insignificant net change in the total CBV in the large-vessel areas as measured by MION-based fMRI is a cancellation of arterial blood volume changes and venous blood volume changes. In other words, after stimulation, arteries may constrict, causing arterial CBV levels to dip below baseline levels, while at the same time venous CBV levels remain elevated (as in the tissue), resulting in a net zero change in total CBV, as measured by MION-based signals. This situation is highly unlikely because, first, it would require a large net decrease in poststimulus arterial blood volume, to cancel any small venous changes, since the total blood volume is approximately 80% on the postarteriole side (Mchedlishvili, 1986; Mellander and Johansson, 1968; Tomita et al, 1983) and, second, the active and rapid mechanism on the arterial side would need to be perfectly aligned in both time and space, with the slow and passive changes on the venous side for a time period on the order of 20 to 30 secs (see Figure 3C), all the while being mediated by the slow-flowing capillaries. Finally, even if per chance this cancellation occurred in the large-vessel regions, spatially dependent mechanisms regulating the poststimulus response would still be present, as this would not (proportionally) explain what is occurring in the tissue areas where a ‘cancellation’ does not occur.
Elevated Cerebral Oxygen Consumption: If the presence of an elevated CMRO2/CBF ratio (either elevated CMRO2 and/or an undershoot in CBF) subsequent to the termination of stimulation is the cause of the poststimulus undershoot in the BOLD signal in the surface ROI, as is indicated from our data, then an elevated CMRO2/CBF ratio must also be present in the tissue region and contribute to the BOLD effect as well. This is because, as discussed above, the fractional deoxyhemoglobin content of blood, which is directly proportional to the CMRO2/CBF ratio, is set in the tissue areas where CMRO2 takes place.
Cerebral oxygen consumption after stimulation has been suggested by Frahm et al (1996) and others (Davis et al, 1994a, 1998; Lu et al, 2004) as the controlling mechanism for the poststimulus undershoot observed in the BOLD response. These MR studies do not provide a direct measure of CMRO2. However, the concept of possible persistent elevation in CMRO2 after the termination of the stimulus is supported by other observations. Tissue pO2 levels measured with oxygen electrodes were shown to fall below baseline levels (Ances et al, 2001; Thompson et al, 2003), after the termination of the stimulus (Thompson et al, 2003), while CBF had returned to baseline levels (Ances et al, 2001). In optical studies, it was found that deoxyhemoglobin levels remained elevated after the cessation of the stimulus (Devor et al, 2003; Jasdzewski et al, 2003), while total hemoglobin and oxygenated hemoglobin, reflecting CBV and CBF, respectively, had returned close to (Devor et al, 2003) or even below (Jasdzewski et al, 2003) baseline levels. In view of the fact that the majority of the energy in the brain is utilized by the Na+–K+ ATPase to support action potentials, such persistent CMRO2 elevation might be needed for restoration of ionic gradients which can last up to 40 secs after the stimulus has been turned off (Brockhaus et al, 1993; Koch and Barish, 1994). The largest contribution to such elevated CMRO2 is expected to occur in layer 4 (Vanduffel et al, 1995), which is sampled in our mid-cortical ROI. Layer 4 has the highest capillary density, and, in biologic tissues, capillary density and mitochondrial density and energy demand are tightly correlated (Hoppeler and Kayar, 1988; Vanduffel et al, 1995).
Reduced Cerebral Blood Flow: Poststimulus decreases in CBF below baseline levels will lead to an increase in the parameter relevant to BOLD, namely the CMRO2/CBF ratio, and result in the observed BOLD undershoot. Cerebral blood flow undershoots have generally not been observed in CBF-based fMRI studies, possibly due to the limited signal-to-noise ratios in these techniques; however, there are examples in the literature (Hoge et al, 1999; Obata et al, 2004). Laser Doppler flowmetry (Irikura et al, 1994; Kannurpatti and Biswal, 2004), Doppler ultrasound studies (Conrad and Klingelhofer, 1989) and optical studies (monitoring oxyhemoglobin levels) (Jasdzewski et al, 2003) have also presented data implicating undershoots in CBF subsequent to stimulation. In addition, evidence exists for a potential decrease in CBF at the capillary level (Chaigneau et al, 2003).
According to our data, a poststimulus decrease in CBF in the tissue (i.e. at the capillary level), if present, must be accompanied with a slowly decaying elevated CBV in the tissue areas as well. Hypothetically, there can be a scenario where initially, during activation, CBF and CBV both increase and, once the stimulus is off, upstream control mechanisms (e.g. at the level of arterioles) close, reducing CBF to prestimulus levels (or below), while CBV changes at the capillaries and postcapillary venules remain elevated until blood passively drains into the venous system.
As in the tissue areas, decreases in CBF below baseline levels may contribute to the BOLD undershoot in the surface vessel areas. As discussed above, we know that CMRO2 effects in the surface vessel areas must be coupled to changes in the tissue areas and that CBV changes might be spatially uncoupled. What we cannot distinguish is whether any decreases in CBF in the surface vessels after the stimulus are coupled to CBF alterations in the tissue areas. In addition, the surface vessels might be sensitive to significant blood flow originating from inactivated areas. In any case, potential decreases in CBF in the surface vessels may result in an undershoot in the BOLD signal. Significant decreases in CBF below baseline levels in large vessels has been shown using Laser Doppler imaging (Kannurpatti and Biswal, 2004).
Changes in Hematocrit: An assumption that is often made with CBV measurements during activation is that there are little or no changes in hematocrit (Jasdzewski et al, 2003). However, changes in hematocrit during and after stimulation have been shown (Kleinfeld et al, 1998; Vanzetta et al, 2005), and could be the source of the poststimulus undershoot in the BOLD signal (Jasdzewski et al, 2003). A decrease in hematocrit may cause an increase in the oxygen extraction fraction, leading to increases in the deoxyhemoglobin concentration and therefore decreases in the BOLD signal.
Differences between Hahn Spin Echo and Gradient-Echo BOLD Undershoot Signals
The spatial dependence of the physiological mechanism regulating the poststimulus undershoot in the BOLD signal is observed in both HSE and GE BOLD fMRI data. The significance of the spatial dependence is more pronounced in the HSE data (P < 0.01), versus the GE data (P < 0.06). This is not a surprise as the HSE BOLD signal at high magnetic fields has been shown to be highly sensitive to microvascular signals as opposed to the GE BOLD signal, which still contains significant contributions from large-vessel areas (Yacoub et al, 2003, 2005b). Our data implicate this as well, since the percent changes in the tissue areas are similar in GE and HSE BOLD data, while the percent changes in the surface vessel areas are three times larger in the GE data. Furthermore, the selected ‘tissue’ ROIs in the GE images are subject to residual effects from these surface vessel areas, thus, diminishing any potential spatial differences (Harel et al, 2005; Yacoub et al, 2005a). However, the surface vessel ROIs in the HSE BOLD images are also expected to be somewhat contaminated as T′2, inflow and partial voluming effects with tissue regions are all reflected in the data. In any case, as shown in Figure 4A, the signals from the ‘vessel’ areas in the HSE BOLD data are extremely noisy (and weak), suggesting little statistical significance with activation in this region. Ultimately, different vascular sources contribute to the poststimulus undershoot in the BOLD signal in GE versus HSE data. In addition, the undershoot in the HSE BOLD data from the tissue ROI, like the positive response, is dominated by microvascular effects, while the same regions in the GE BOLD data may contain significant contributions from both large and small vessels.
Conclusions
In this work, we showed the spatial dependence of poststimulus hemodynamic signals in the cat visual cortex at 9.4 T. Previous MR studies suggested that CBV levels slowly return to baseline and cause the BOLD poststimulus undershoot (Buxton et al, 1998; Mandeville et al, 1998, 1999a), while others suggested that CBV levels return to baseline quickly and do not play any role (Lu et al, 2004) in the BOLD undershoot. We show for the first time that both mechanisms are operative, but at spatially distinct locations of the cortex. Tissue CBV levels remain elevated once the stimulus is turned off, while in the surface vessel areas CBV levels return to baseline quickly. Consequently, CBV changes might be in part responsible for the poststimulus BOLD undershoot in the tissue, but do not likely significantly affect the surface vessel areas; other BOLD contributing mechanisms (CMRO2, CBF) likely contribute in the surface vessel areas and might also be operative in the tissue areas. The relative contributions of these physiological parameters to the BOLD poststimulus undershoot cannot be ascertained from the present data. Further studies, measuring CBF changes at high spatial resolution, are needed to determine the relative contributions of the different mechanisms.
Note
Fractional deoxyhemoglobin content of blood is directly proportional to CMRO2/CBF ratio and the MR signal intensity in a BOLD contrast image is inversely proportional to the deoxyhemoglobin content in tissue. Thus, MR signal intensity in a BOLD contrast image is directly proportional to: [(CBVbold) (CMRO2/CBF)]−1, where CBVbold is the blood volume component that enters the BOLD effect (e.g. see (Ugurbil et al, 2000)).
Footnotes
Acknowledgements
The authors would like to thank Drs Peter Andersen and Gregor Adriany for hardware support.