
Abstract
This study was designed to assess that mouse pial and cortical microcirculation can be monitored in the long term directly in the area of focal ischemia, using in vivo fluorescence microscopy. A closed cranial window was placed over the left parieto-occipital cortex of C57BL/6J mice. Local microcirculation was recorded in real time through the window using laser-scanning confocal fluorescence microscopy after intravenous injection of fluorescent erythrocytes and dextran. The basal velocity of erythrocytes through intraparenchymal capillaries was 0.53 ± 0.30 mm/sec (n = 121 capillaries in 10 mice). Two branches of the middle cerebral artery were topically cauterized through the window. Blood flow evaluated by laser-Doppler flowmetry in two distinct areas indicated the occurrence of an ischemic core (15.2% ± 5.9% of baseline for at least 2 h) and a penumbral zone. Magnetic resonance imaging and histology were used to characterize the ischemic area at 24 h after occlusion. The infarct volume was 7.3 ± 3.2 mm3 (n = 6). Microcirculation was repeatedly videorecorded using fluorescence confocal microscopy over the next month. After the decrease following arterial occlusion, capillary erythrocyte velocity was significantly higher than baseline 1 week later, and attained 0.74 ± 0.51 mm/sec (n = 76 capillaries in six mice, P<0.005) after 1 month, while venous and capillary network remodeling was assessed, with a marked decrease in tortuosity. Immunohistochemistry revealed a zone of necrotic tissue into the infarct epicenter, with activated astrocytes at its border. Such long-term investigations in ischemic cortex brings new insight into the microcirculatory changes induced by focal ischemia and show the feasibility of long-term fluorescence studies in the mouse cortex.
Introduction
The study of cerebral blood flow has been considerably facilitated by in situ investigations of cerebral blood vessels using epifluorescence microscopy through a closed cranial window. Fluorescently labeled erythrocytes were used to measure blood flow velocity in rat cerebral capillaries (Hudetz et al, 1992), while fluorescent dextrans and beads were used to measure blood flow in single surface arterioles and venules on the mouse neocortex (Rovainen et al, 1992, 1993). In vivo laser-scanning confocal microscopy was employed to produce a three-dimensional reconstruction of the rat cortical vascular tree (Dirnagl et al, 1991). A method based on the combined use of fluorescent intravascular tracers and laser-scanning confocal fluorescence microscopy was then developed for real-time in vivo investigations of cerebral microcirculation in the rat (Seylaz et al, 1999). This method was used in both global (Pinard et al, 2000) and focal ischemic conditions (Pinard et al, 2002; Belayev et al, 2002). But these were all acute studies. Very recently, capillary circulation was studied in gerbils during reperfusion after global cerebral ischemia, also in acute conditions (Hauck et al, 2004).
We have now developed a method for long-term investigations in mice and for direct recording of microcirculatory changes in real time in and around an ischemic focus in the mouse. Indeed, little is known about the extent to which perfusion to small regions of ischemia recovers in the mouse cortex. The present study shows that murine focal ischemia, topically induced through the closed cranial window, creates an ischemic core surrounded by a penumbral zone, whose evolution in the long term (at least 1 month) can be repeatedly explored in vivo by fluorescence microscopy, especially using video-recording of fluorescent erythrocytes through capillaries. Complementarily, edema, tissue damage, neuronal death, and glial reactions were evaluated by magnetic resonance imaging (MRI) and histology to characterize the ischemic lesion. C57BL/6 mice were used, because this is the reference strain for genetically modified mice.
Our data show that in vivo confocal fluorescence microscopy can be extensively used in the mouse to videomonitor local cerebral microcirculation under control and ischemic conditions, and that the induction of focal ischemia through the cranial window leads to reproducible injury, including a zone of incomplete ischemic damage, which can be easily explored several times in the long term. Such long-term investigations of microcirculation under ischemic conditions may provide important information on ischemic pathophysiology, angiogenesis, and vessel remodeling.
Part of this work was published in abstract form (Kubis et al, 2003)
Materials and methods
Animal Preparation
Male C57BL/6J mice (23 to 28 g, Janvier Breeding Center, France) were studied according to the National Institute of Health guide for the care and use of laboratory animals. Experiments were performed under Permit Number 02934 from the French Ministry of Agriculture.
A total number of 61 mice were studied (Table 1). All sham mice were studied for the whole 30-day period, while two mice of the ischemic group had been excluded from the study due to their weakness in the fourth week after insult.
Groups of animals
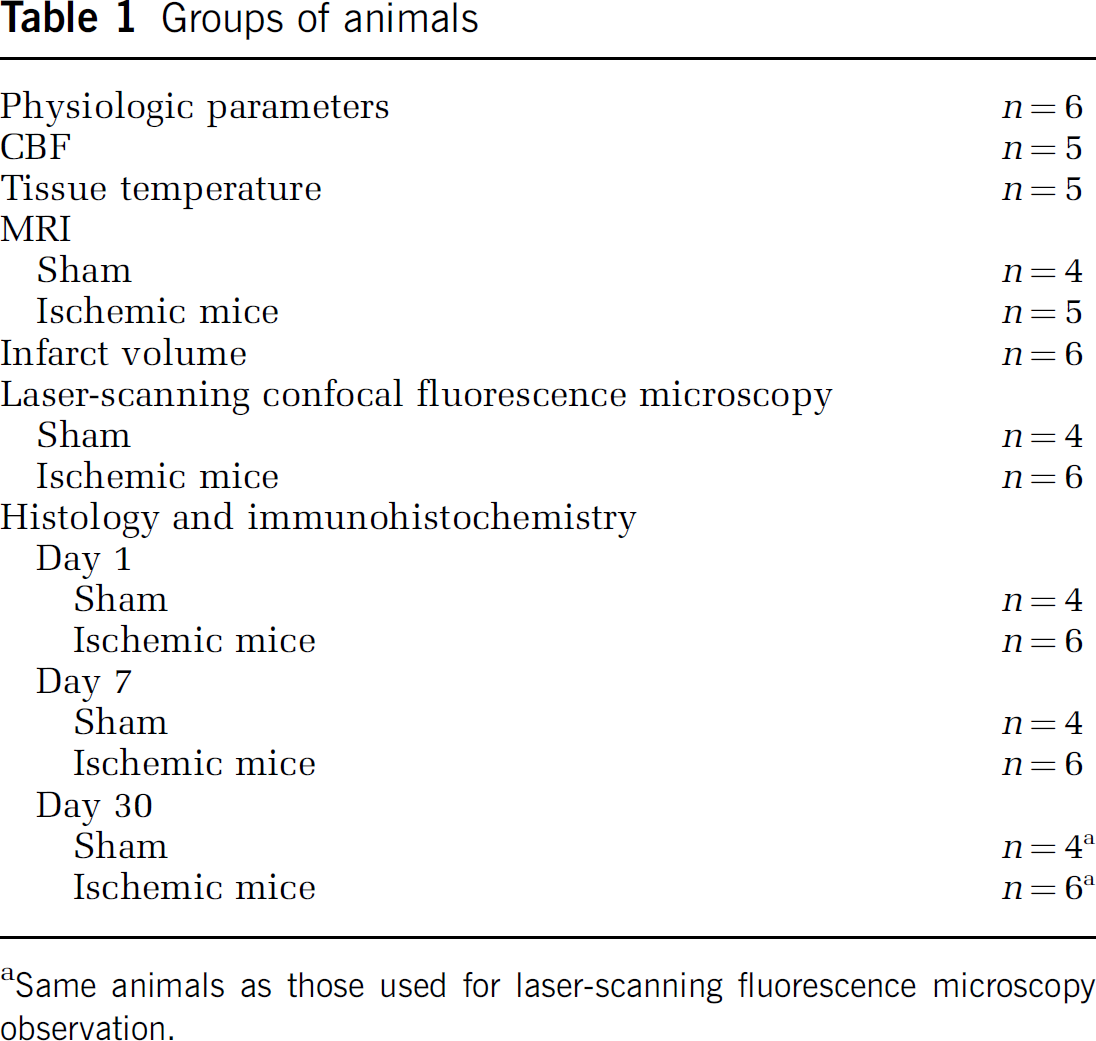
Same animals as those used for laser-scanning fluorescence microscopy observation.
Most experimental procedures were performed using a special custom-built system equipped for delivering anesthetic gas, fixing the mouse head, placing a stereotaxic device for maintaining a laser-Doppler probe or a thermistor, and stabilizing the ensemble under a confocal microscope. This system enabled us to place the mouse in the same position for all investigations and rapidly change experimental tools. In all experiments and surgical approaches (except transcardiac perfusion for histology processes), anesthesia was induced by 1.8% to 2.0% isoflurane and maintained with 1.4% to 1.6% isoflurane in a mixture of O2 and N2O. Rectal temperature was maintained at 37°C using a retro-controlled homeothermic blanket (Harvard Apparatus, Holliston, MA, USA).
Chronic cranial window: All surgery was performed under an operating micoscope (S21, Carl Zeiss, Oberkochen, Germany). The protocol was similar to that used in the rat (Seylaz et al, 1999), but the size and location of the cranial window were different, and the dura was kept intact. A 3-mm hole was drilled above the left parieto-occipital cortex, 2.5 mm posterior to the bregma and 2.5 mm lateral to the midline (Franklin and Paxinos, 1997). A circular 140-μm thick quartz coverslip was sealed to the bone with dental cement (Ionosit, DMG, Hamburg, Germany), making the preparation waterproof. The area under the window corresponded to a distal territory of the middle cerebral artery (MCA).
Only mice whose cranial window was without any bleeding or inflammatory process were included in the study. This represents approximately 75% of all mice.
Focal ischemia: Focal ischemia was induced 1 week after window implantation, under the same experimental conditions, by topical cauterization of two distal branches of the left MCA through the cranial window, as shown in Figure 1. To check the decrease of flow after arterial occlusion, and its persistence for at least 2 h, local blood flow was continuously recorded at two places over the window: one between the two MCA branches corresponding to the core, and the other one distantly corresponding to the penumbra (Figure 1) as previously defined in pilot experiments on the basis of blood flow changes. Blood flow measurements were performed using a laser-Doppler flowmeter (MBF 3D, Moor Instruments, Axminster, UK) in a group of five mice. Successful occlusion was also indicated by blanching of the underlying cortex.
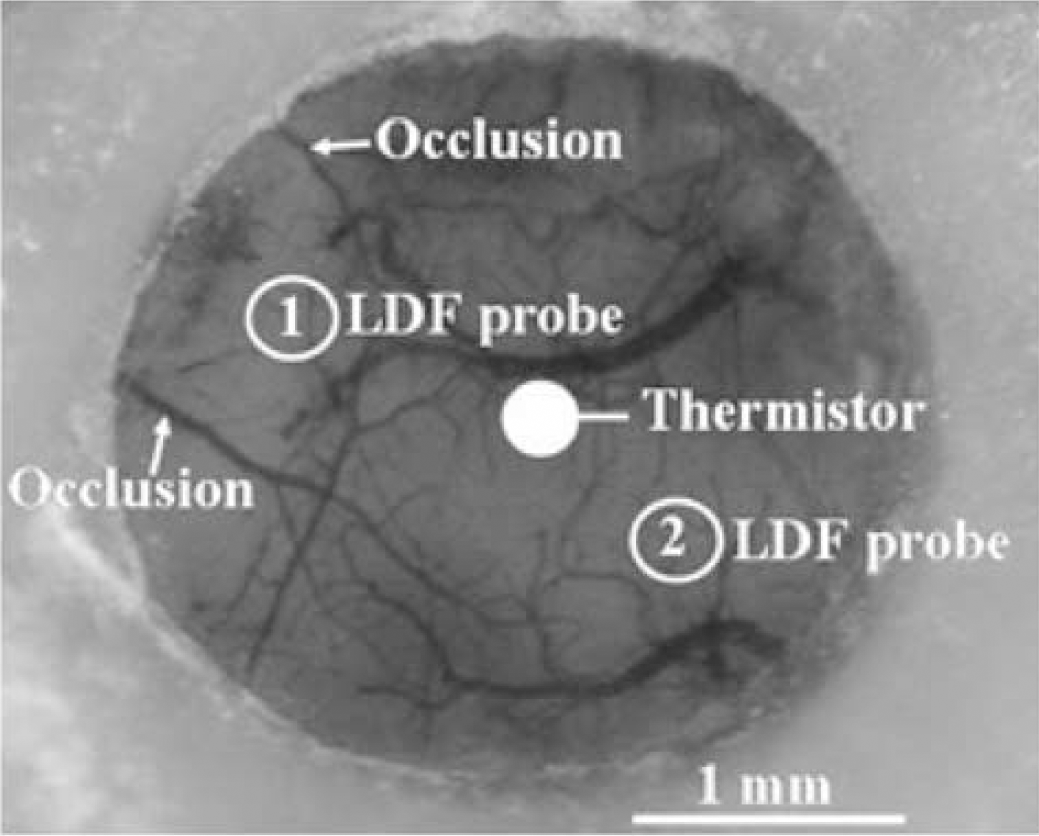
Typical closed cranial window in a mouse. Arrows indicate the two coagulation sites of the distal MCA branches originating on the left edge of the window. The location of laser-Doppler probes and thermistor, for blood flow and tissue temperature measurements respectively, is also schematically indicated. These variables were recorded in two different groups of mice (n = 5 in each group).
In a separate group of mice (n = 5), a thermistor (0.7 mm OD) was implanted into the cortex via a small hole previously created in the center of the window. The thermistor was placed at 1.5-mm depth, close to the arterial segments that were cauterized (Figure 1), for continuous evaluation of tissue temperature during the coagulation process.
In Vivo Experimental Procedures
Laser scanning confocal fluorescence microscopy: All in vivo investigations started 1 week after cranial window implantation. Sham-operated (n = 4) and ischemic mice (n = 6) underwent a series of investigations just before sham-operation or arterial occlusion (Day 0), just after surgery, and 1 day (Day 1), 1 week (Day 7), and 1 month later (Day 30). An image of the vascular field was obtained at each time via the surgical microscope and a digital camera (Coolpix 950, Nikon, Japan).
Dynamic microscopy: The local microcirculation of each mouse was repeatedly monitored through the closed cranial window using a Viewscan DVC-250 confocal laser-scanning unit (BioRad, UK) attached to an Optiphot-2 fluorescence microscope (Nikon, Japan). The light source was an argon/krypton laser whose wavelengths were 488, 568, and 647 nm. The objective was either a Nikon dry lens (x 10) or a Nikon water immersion lens (x 20 and x 40). The numerical apertures were 0.40 and 0.55, and the working distances were 1.8 and 2.0 mm, respectively. The particularity of this microscope comes from its linear pinhole, allowing rapid 2D image acquisition. The focus on parenchymal capillaries was performed manually. For every analysis in each mouse, fluorescent tracers were injected via the left tail vein. A tracer dose (50 μl) of rhodamine B isothiocyanate-dextran (RITC-dextran, molecular weight = 71,200 Da; 20 mg/mL, Sigma, France) was used to label the microvascular network. Erythrocytes, from the blood of a different animal and labeled with fluorescein-isothiocyanate (FITC, Sigma, France) as previously described (Seylaz et al, 1999), were then injected to clearly visualize all microvessels to a depth of approximately 200 μm in the cortex. Appropriate filters were used. Images from one single plane were recorded at video speed (50 frames/sec) with an SIT camera (C-2400, Hamamatsu Photonics, Japan) and a digital videorecorder (DSR-25 DVCAM, Sony, Japan). The images were stored on a PC using an 8-bit frame grabber card LG-3 (Scion Corp Inc., MA, USA). The velocity of fluorescent erythrocytes through capillaries was then measured offline before ischemia and at various times after arterial occlusion. Capillary erythrocyte velocity being highly heterogeneous and depending on many parameters, attention was paid to focusing each time at the same brain depth and in the same area of the window.
Static microscopy: The superficial vessels were also repeatedly visualized with a higher definition using a classical laser-scanning confocal fluorescence microscope (MRC 600, BioRad, UK) whose microscope, laser, and lenses have the same characteristics as those of the dynamic confocal microscope but whose diaphragm is a pinhole. The channel specific for rhodamine was used. Conversely to Viewscan confocal microscope, several planes can be summed when using MRC 600, which makes possible the visualization of a volume, up to 200 μm beneath the brain surface. The quality of static images is higher than that of dynamic images because: (a) a pinhole serves as diaphragm, instead of a slot; (b) the speed of image sampling is much slower (1 frame every 2 secs, instead of 50 frames/sec); (c) the same image can be acquired several times and then summed.
Magnetic resonance imaging: All imaging was performed on five ischemic and four sham-operated mice at 1 day (Day 1) after arterial occlusion using a 7.0 T magnet (Oxford Instrument, Oxford, UK) equipped with actively shielded gradient sets of 120 mT/m and an INOVA consol (Varian, Palo Alto, CA, USA). Magnetic resonance (MR) images were recorded using a bird-cage resonator (35 mm internal diameter). Body temperature was kept at 37°C by feedback-controlled warm air ventilation.
Sagittal and transversal scout scans were performed using a gradient echo MRI sequence, to ensure correct head position. T2-weighted imaging (T2WI) and diffusion-weighted imaging (DWI) were then performed using a multislice spin echo sequence. Nineteen 0.5-mm thick transversal slices were obtained with the following parameters: (a) for T2-weighted images: echo time (TE) = 50 ms, repetition time (TR) = 2 secs, image matrix = 512 × 512, field of view (FOV) = 3.5 cm x 3.5 cm (acquisition time = 17 mins), (b) for DWI: TE = 82 ms, TR = 2 secs, matrix = 128 × 128, FOV = 3.5 cmx 3.5 cm with a gradient strength G = 20 mT/m, b = 993 sec/mm2 (acquisition time = 17 mins).
The area corresponding to signal changes, indicative of the injured area, was calculated using Image J 1.25s (National Institute of Health, USA) software. The use of MRI at Day 1 after insult aimed at determining the size and reproducibility of the lesion to characterize the present ischemia model and to compare the results of MRI with those of cresyl violet histology.
Physiologic parameters: An elongated polyethylene catheter (Biotrol, Paris, France) was placed in the right femoral artery in a subset of animals (n = 6) to monitor arterial blood pressure and to sample arterial blood for gas partial pressure analysis (PaO2, PaCO2) and pH (Ciba Corning Diagnostics Corp., Medfield, MA, USA) under isoflurane anesthesia, in the same experimental conditions as for all studies, to define the physiologic state of mice.
Histology and Immunohistochemistry
The histologic procedures were performed at 1 day, 1 week, and 1 month after the arterial occlusion (n = 4 sham-operated and 6 ischemic mice at each time point). The mice used for the 1-month histologic study were those used for in vivo measurements.
Mice were deeply anesthetized with halothane and transcardially perfused with heparinized saline, followed by 4% paraformaldehyde in 0.1 M phosphate buffer at 4°C, pH 7.4. Brains were removed, postfixed overnight in paraformaldehyde and cryoprotected in 20% sucrose in phosphate buffer. Coronal sections (45 μm) were cut in a cryostat (CM3050S, Leica, Germany).
Every 10th section was stained with cresyl violet. Adjacent free-floating sections were incubated overnight at 4°C with antibodies against the neuronal nuclear antigen (NeuN, Chemicon, Temecula, CA, USA, 1/400), or the glial fibrillary acidic protein (GFAP, Santa-Cruz Biotechnology, CA, USA, 1/50). The reaction products were revealed using peroxidase avidin-biotin (Vectastain ABC Kit, Vector Lab, Burlingame, CA, USA) with diaminobenzidine as substrate (DAB kit, Vector Lab). Specificity was checked on additional sections by omitting the primary antibody.
Infarct volume measurement: The volume of cerebral injury was measured by computer-assisted image analysis (Leica, Qwin, UK) in a group of six mice. Each cresyl violet-stained section of ischemic brains at 24 h after occlusion was evaluated with a x 2.5 lens. The areas of the ipsilateral and contralateral hemispheres were measured, as was the damaged area. The volume (mm3) was determined by integrating the appropriate areas with the section interval thickness (450 μm). The infarct volume was corrected for edema with the following formula: corrected infarct volume = measured infarct volume (unlesioned hemisphere volume)/lesioned hemisphere volume) as previously described (Golanov and Reis, 1995).
Statistical analysis
Data are means ± s.d. Repeated-measures ANOVA was used to compare vessel diameters over 1 month and laser-Doppler flow values over 120 min. Bonferroni/Dunnett and Fisher tests were, respectively, used to identify the group differences that accounted for the significant overall ANOVA. Student's paired t-test was used to compare the infarct volumes on MR images. Two-factor ANOVA was used to compare the mean capillary erythrocyte velocity between groups, and Student's unpaired t-test for subsequent analysis within each group. A value of P<0.05 was considered significant.
Results
All physiologic parameters were within normal range, except PaO2, which indicated hyperoxic conditions. Their mean values before inducing ischemia were as follows: MABP = 82.0 ± 9.7 mm Hg, PaO2 = 332.0 ± 19.5 mm Hg, PaCO2 = 41.5 ± 5.1 mm Hg, pH = 7.30 ± 0.06. No variable changed significantly following arterial occlusion and over long experiments. Mice body weights did not significantly vary over the whole study. No animals died or suffered a marked neurologic deficit.
Microcirculation and Local Blood Flow
Sham-operated mice: The entire pial network under the cranial window, including some terminal branches of the MCA, was clearly visible from Day 0 to Day 30 (Figure 2A) and even over 4 months in pilot experiments. The mean diameter of the two major branches of the MCA was 29.8 ± 5.1 μm and that of major pial veins under the window was 70.4 ± 22.9 μm. The diameters of the same vessels at the same place were not significantly modified (30.3 ± 5.4 and 72.7 ± 24.2 μm respectively) at the end of the 1-month study. Each intravenous injection of rhodamine-dextran also revealed parenchymal vessels, and the whole superficial network did not vary along this period (Figure 2B). Tortuous capillary networks were clearly visible in the parenchyma after each intravenous injection of FITC-labeled erythrocytes (Figure 3). The mean velocity of fluorescent erythrocytes through deep tortuous capillaries was 0.57 ± 0.23 mm/sec (n = 48 capillaries in four mice) on Day 0, and it was not significantly different 1 month later (0.65 ± 0.31 mm/sec, n = 51 capillaries in four mice). The general features of capillary circulation (tortuosity and heterogeneity) were still present on Day 30.
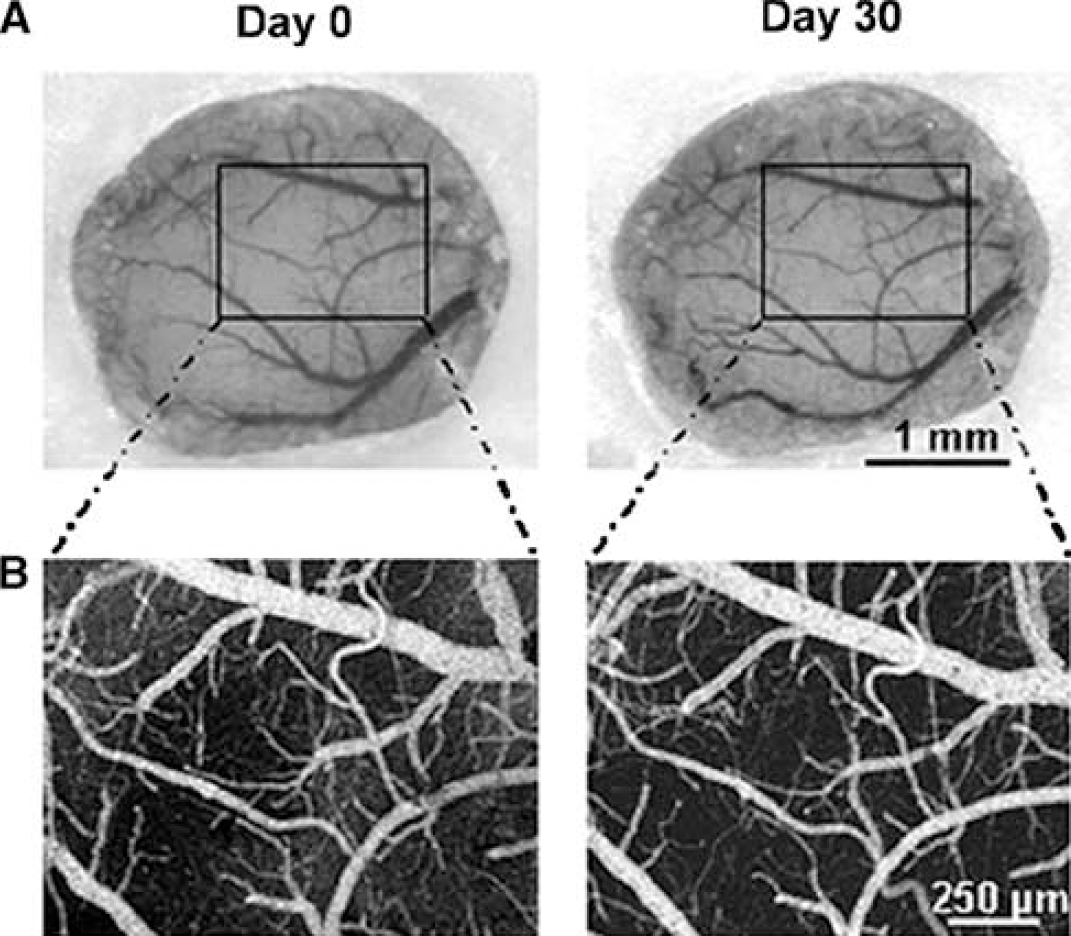
Superficial vascular network over the cranial window in a sham-operated mouse, 1 week after window implantation (Day 0), and 1 month later (Day 30): (
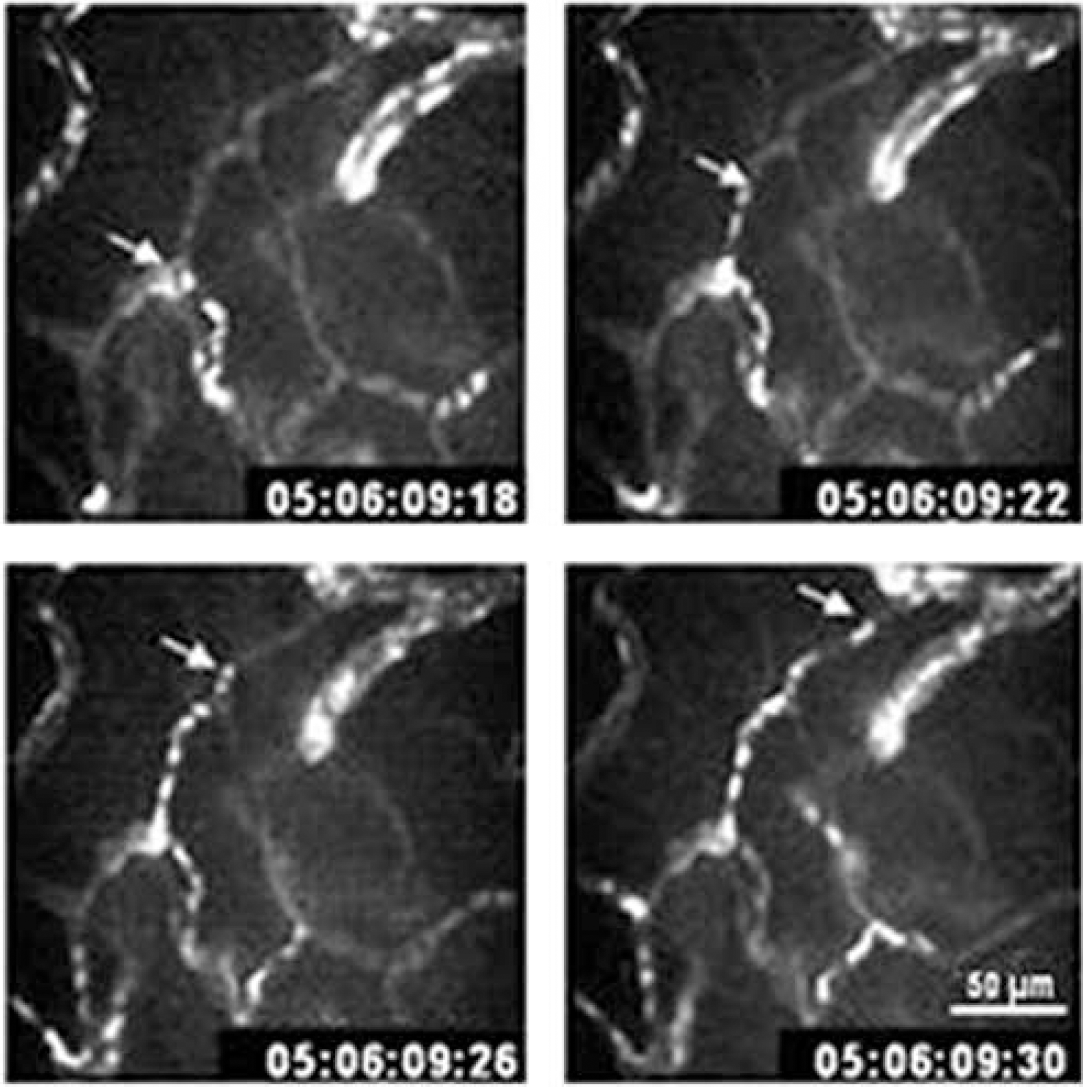
Typical sequence of four videoframes (every 40 ms) captured by dynamic confocal microscopy (x 40 lens) at 50 μm below the brain surface. White dots are moving erythrocytes labeled with FITC flowing through a cortical capillary network in a mouse under basal conditions. The arrow indicates an erythrocyte that can be followed on all frames.
Ischemic mice: Day 0: Before arterial occlusion, the vascular network was similar to that of sham-operated mice. The mean diameters of the two MCA branches and of the major pial veins were, respectively, 31.0 ± 3.9 and 93.1 ± 24.1 μm. The mean fluorescent erythrocyte velocity through capillaries was 0.53 ± 0.36 mm/sec (n = 73 capillaries in six mice). All these parameters were not significantly different from those of sham-operated mice.
The topical thermocoagulation of the two major MCA branches across the window induced a thrombus in each arterial branch whose length was 0.9 ± 0.2 mm (n = 8), and stopped blood flow in most vessels. The occluded arteries constricted maximally, while the arterial anastomoses dilated and became functional. The local temperature was maximally increased by 2.4 ± 0.5°C (n = 5), being significantly higher than its basal level for 35 secs (P<0.05, Figure 4). The mean blood flow in the ischemic area, that is, between the two MCA branches, was significantly reduced to 15.2% ± 5.9% of baseline within minutes (P< 0.0001), and remained at this low level for at least 2 h (Figure 5), indicating the occurrence of deep ischemia in this part of the window. In parallel, blood flow measured in the periphery of the window was significantly reduced to a mean value of 49.0% ± 4.9% of baseline (P<0.0001), and did not significantly change thereafter (Figure 5).
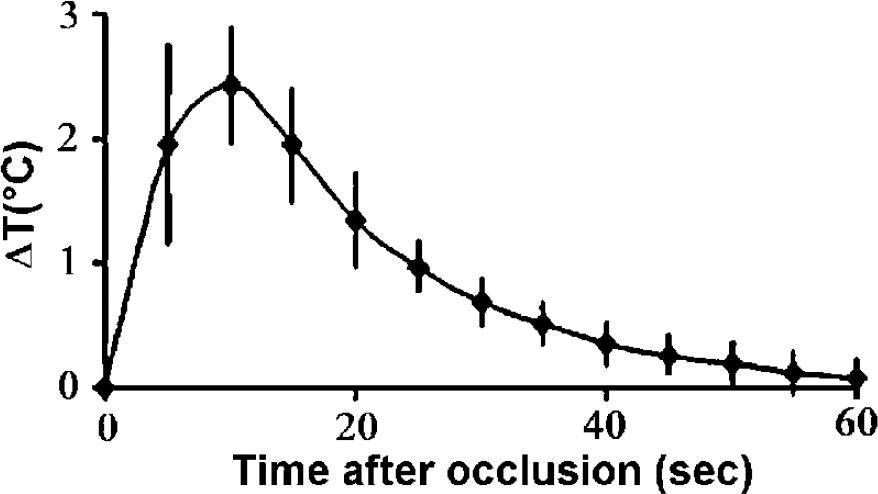
Time course of mean changes (± s.d.) in cortical temperature expressed in °C, measured by a thermistor during the first minute of distal MCA coagulation (n = 5). Statistically significant differences from the baseline were observed during the first 35 secs.
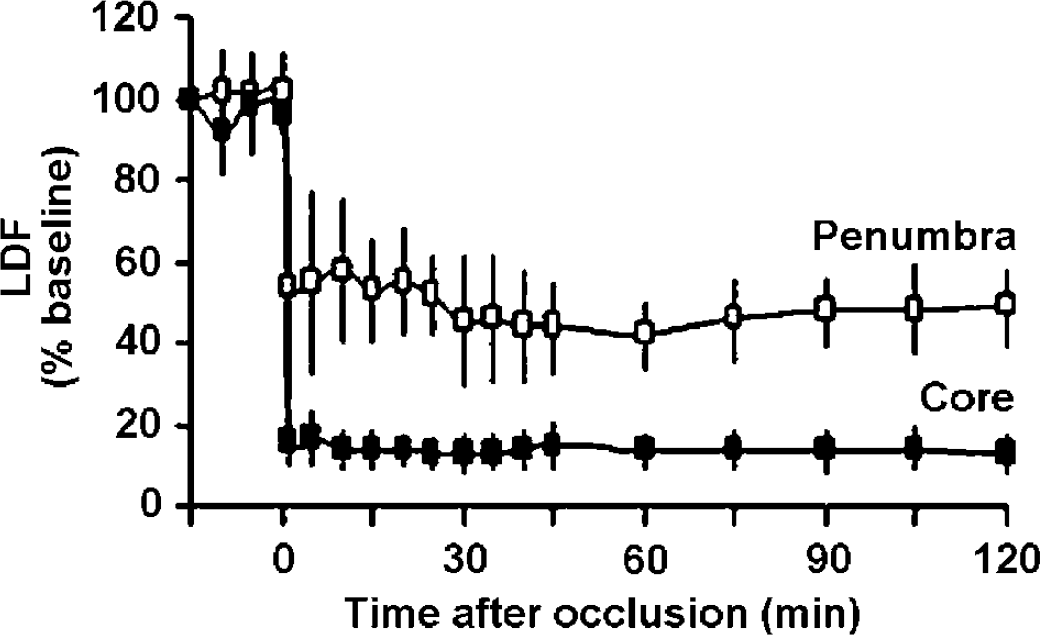
Mean changes (± s.d.) in cortical blood flow in per cent of baseline, measured across the window by laser-Doppler flowmetry at the sites indicated in Figure 1, during the first 2 h after occlusion of the distal MCA branches performed at time 0. All blood flow values after occlusion are statistically different from preischemic baseline values. CBF in the ischemic core (■) abruptly decreased to 15.2% ± 5.9% of baseline. Penumbral CBF (□) decreased to 49.0% ± 4.9% of baseline.
A heterogeneous stop of fluorescent erythrocyte perfusion through capillaries was observed by confocal microscopy. A major increase in the blood-brain barrier (BBB) permeability to RITC-dextran occurred, preventing any detailed analysis of microcirculation by confocal fluorescence microscopy.
Day 1: The MCA branches and small veins were no longer directly visible. The fluorescent markers injected on Day 0 were still present in most pial vessels and in intraparenchymal capillaries, indicating that blood was stagnant. However, in all mice, blood flow was clearly visible through vessels at the border of the window, except close to the proximal part of MCA. A few fluorescent erythrocytes also moved slowly through capillaries.
Day 7: The vascular network was almost entirely visible. Fluorescence microscopy showed reperfusion of pial arterioles and venules in most animals. Blood flowed again through the previously occluded MCA branches in five out of six mice. Fluorescent erythrocyte velocity through capillaries was 0.71 ± 0.40 mm/sec (n = 54 in five mice), significantly higher than in basal conditions (P<0.005), but erythrocytes did not flow in all capillaries perfused with plasma. Some vessels were focally permeable to RITC-dextran, indicating persistent damage to endothelial cells.
Day 30: Although the general pattern was readily recognized, intravascular fluorescence revealed marked microvascular remodeling: some regions lacked vascularization, whereas others had vessels with new shape and size and persistent vascular perfusion. Substantial venous remodeling occurred principally in the periphery. However, the mean diameter of major pial venules (86.3 ± 27.0 μm) was not significantly different from control conditions. The main feature of the network was the presence of many parallel, straight long thin vessels (Figure 6). The proximal MCA diameter (19.3 ± 4.7μm) was significantly smaller than preischemic values (P<0.001), indicating persistent constriction at the point of occlusion.
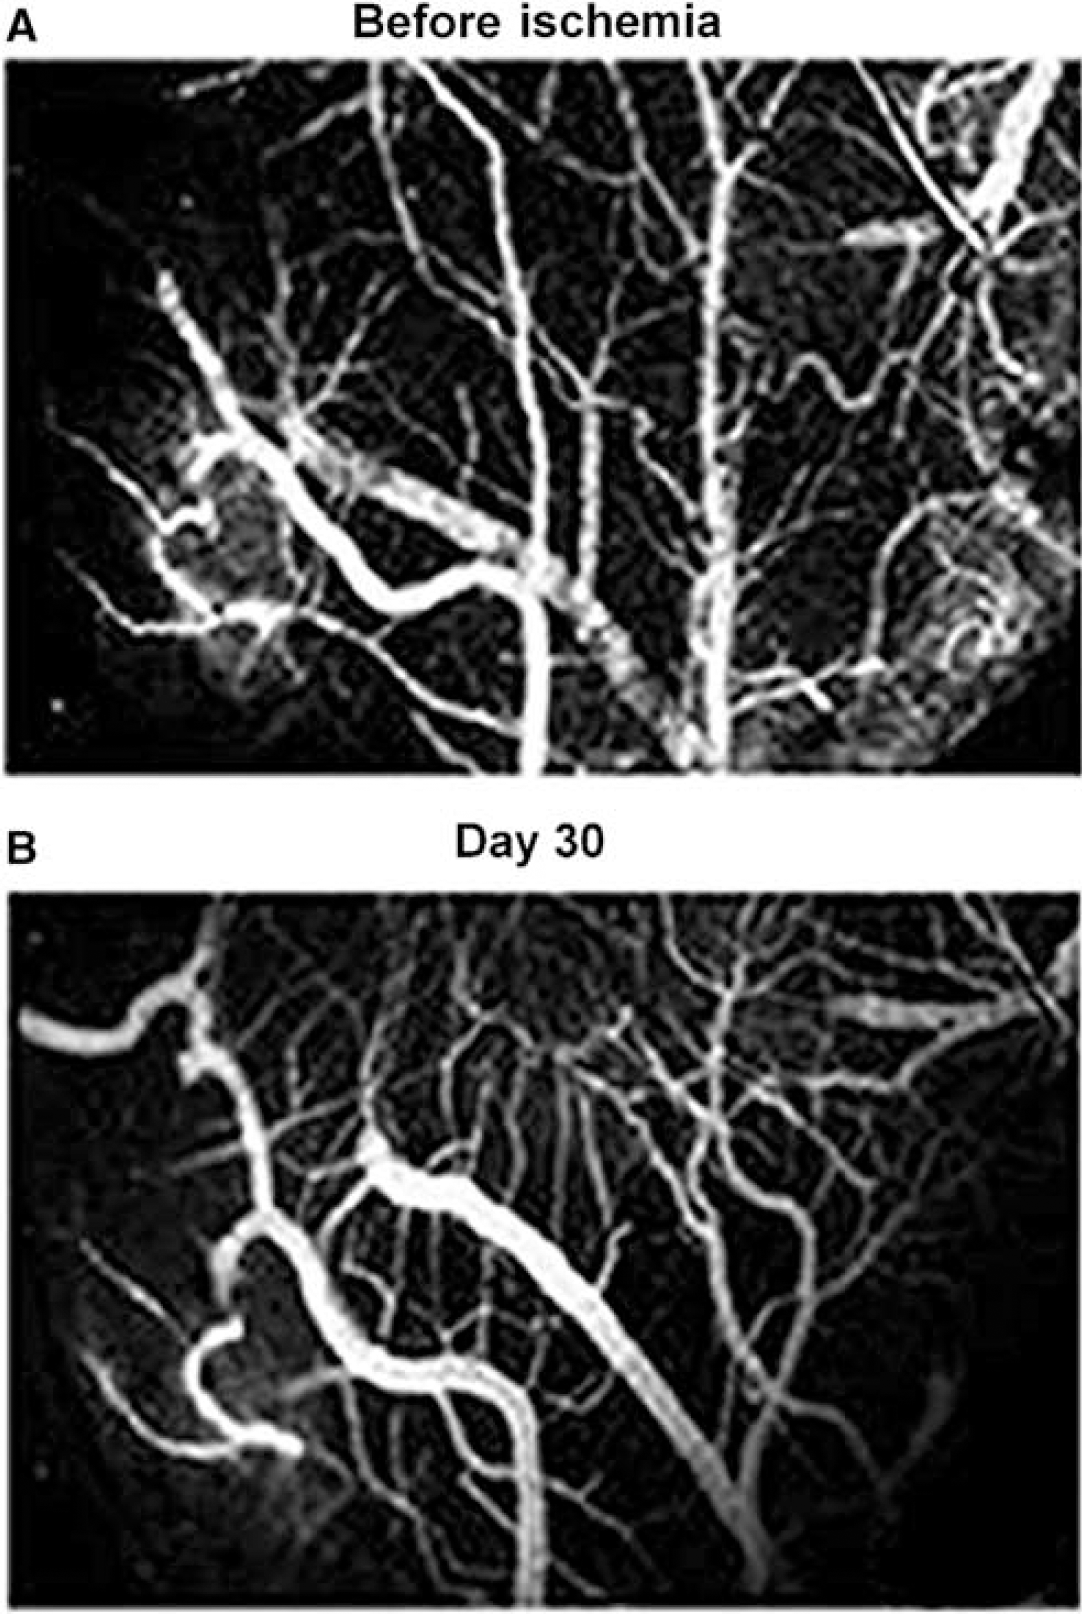
Typical images collected in vivo through a closed cranial window, using static confocal fluorescence microscopy after intravenous injection of RITC-dextran into a mouse, before (
The fluorescent capillary network was heterogeneously distributed, evidencing perfusion defect in some areas, but many linear capillary-like vessels were intricated as in a mesh. Most capillaries with flowing erythrocytes were present at the periphery of the window, but many capillaries were filled with plasma only. They exhibited a decrease in tortuosity (Figure 7), associated with a significantly higher velocity of fluorescent erythrocytes (0.74 ± 0.51 mm/sec, n = 76 capillaries in six mice, P<0.05) than at baseline. Diffuse fluorescence invaded small focal zones, indicating that the BBB was still heterogeneously permeable to RITC-dextran.

Typical video frame (average of two images) capturing cortical microvessels labeled with RITC-dextran in the area where MCAO was performed 1 month earlier. Arrows indicate FITC-labeled erythrocytes flowing through capillaries. Note the decrease in capillary tortuosity compared with basal conditions presented in Figure 3. Same characteristics of confocal microscopy as in Figure 3.
Magnetic Resonance Imaging
Sham-operated mice: DWI and T2-WI showed no modification or brain deformation under the cranial window (n = 4) (data not shown).
Ischemic mice: All the ischemic mice had a hyperintense cortical area under the cranial window on DW and T2-weighted images (Figure 8) at 24 h after occlusion. The tissue volume corresponding to the hyperintensity signal was 8.4 ± 2.3 mm3, when evaluated by DWI, and 7.4 ± 2.2 mm3 by T2-WI (n = 5). Paired comparison of these volumes showed no significant difference. DWI provides a higher contrast than T2-WI, and thus seems more suitable for determining the limit of the edematous areas at this time after ischemia.
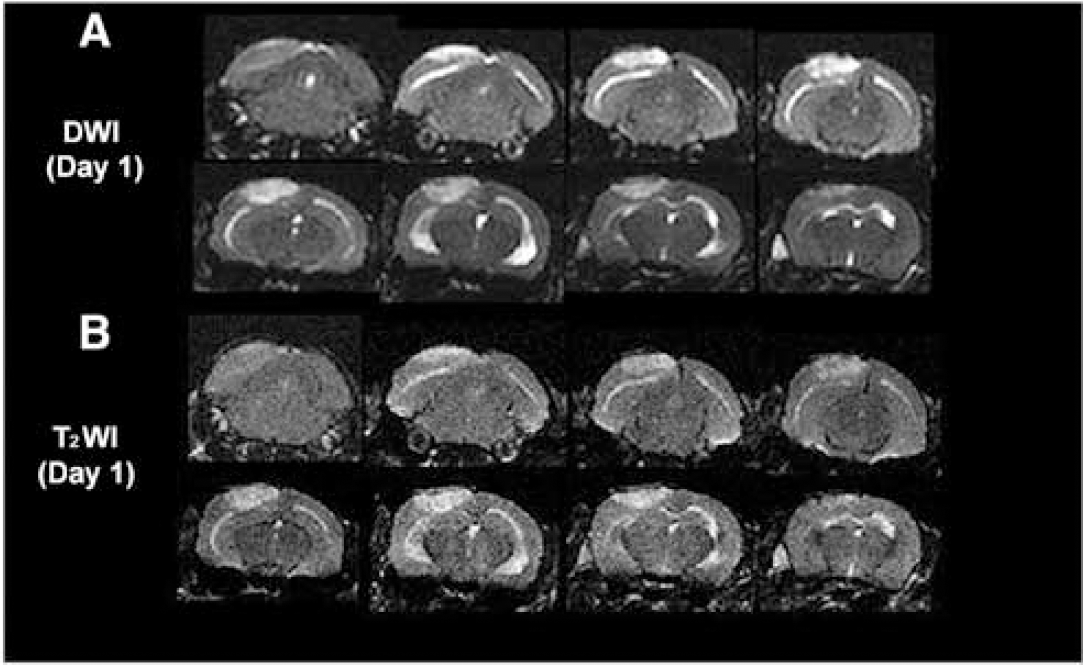
Transverse MR images of a mouse brain 1 day after occlusion of the distal MCA branches: (
Histology and Immunohistochemistry
Sham-operated mice: The two hemispheres were identical in terms of their NeuN expression, but there was a slight, rather persistent inflammatory reaction ipsilaterally. GFAP labeling was present in all superficial cortical layers over the upper two-thirds of the cortex on Day 1 and only in the superficial cortex below the window on Day 7. In contrast, there was very little GFAP labeling at the edges of the window on Day 30.
Ischemic mice: Day 1: Cresyl violet staining showed an injured zone, with shrunken, pyknotic nuclei, edematous vacuolated neuropil, and a mixture of normal and necrotic neurons at the periphery (Figure 9A). All mice had lesions and the size, location, and geometry were reproducible. The mean infarct volume was 8.0 ± 3.3 mm3 before correction, and 7.3 ± 3.2 mm3 (n = 6) after correction for edema.
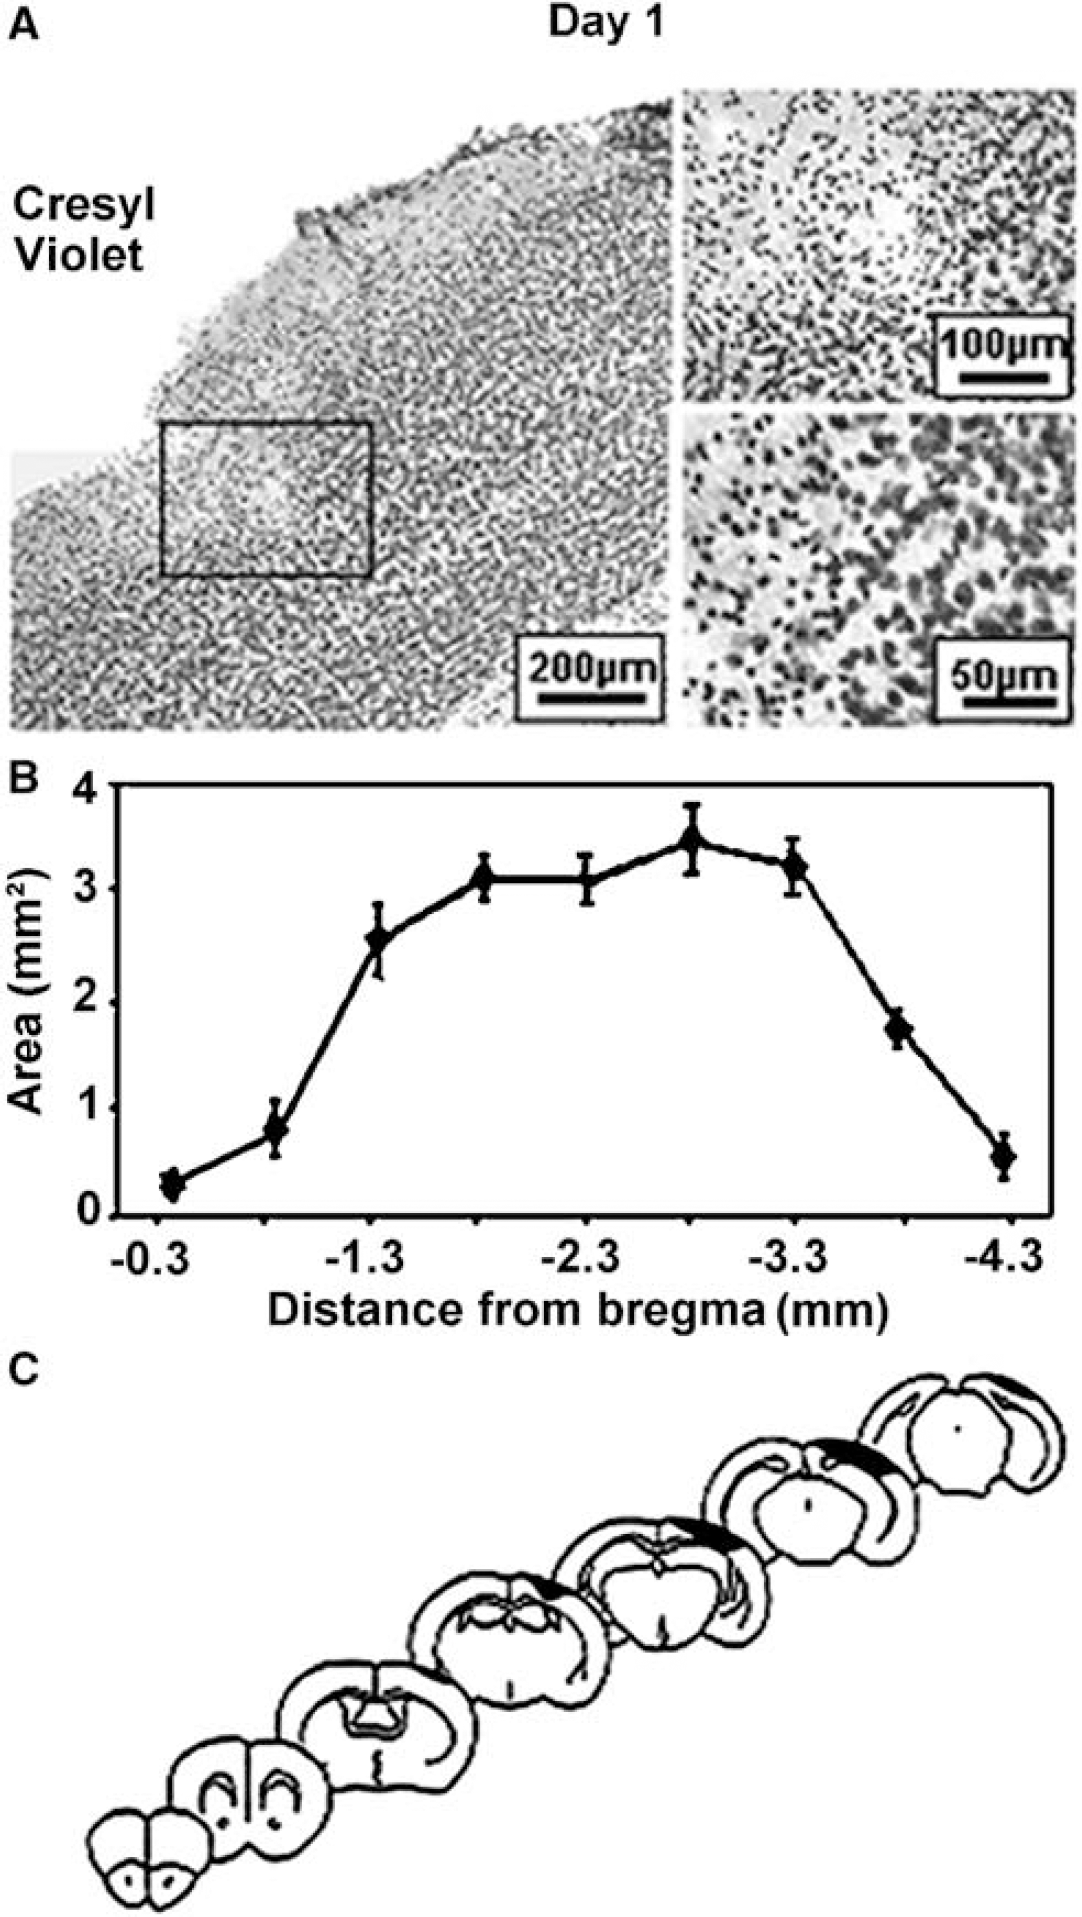
Characterization of the infarct performed 1 day after occlusion of the distal MCA branches, using cresyl violet staining after intracardiac perfusion of mice with paraformaldehyde (4%). (
The injured area was purely cortical and extended from 0.3 to 3.8 mm posterior to bregma (Figure 9B), that is, from the end of striatum to the end of the hippocampus (Figure 9C). This corresponds to somatosensory and visual areas (Franklin and Paxinos, 1997). Neuron loss was indicated by a marked reduction in NeuN immunostaining. There was intense GFAP immunostaining, indicating glial activation, throughout all cortical layers and beyond the lesion, invading approximately 70% of the neocortex.
Day 7: The lesion had entered a classic wound-healing phase, with a connective tissue matrix, glial scarring, and atrophy of the affected superficial neocortical layers (Figure 10A). Astrocytes infiltrated the infarct and GFAP was present in all cortical cell layers of approximately 70% of the ipsilateral neocortex (Figure 10C).
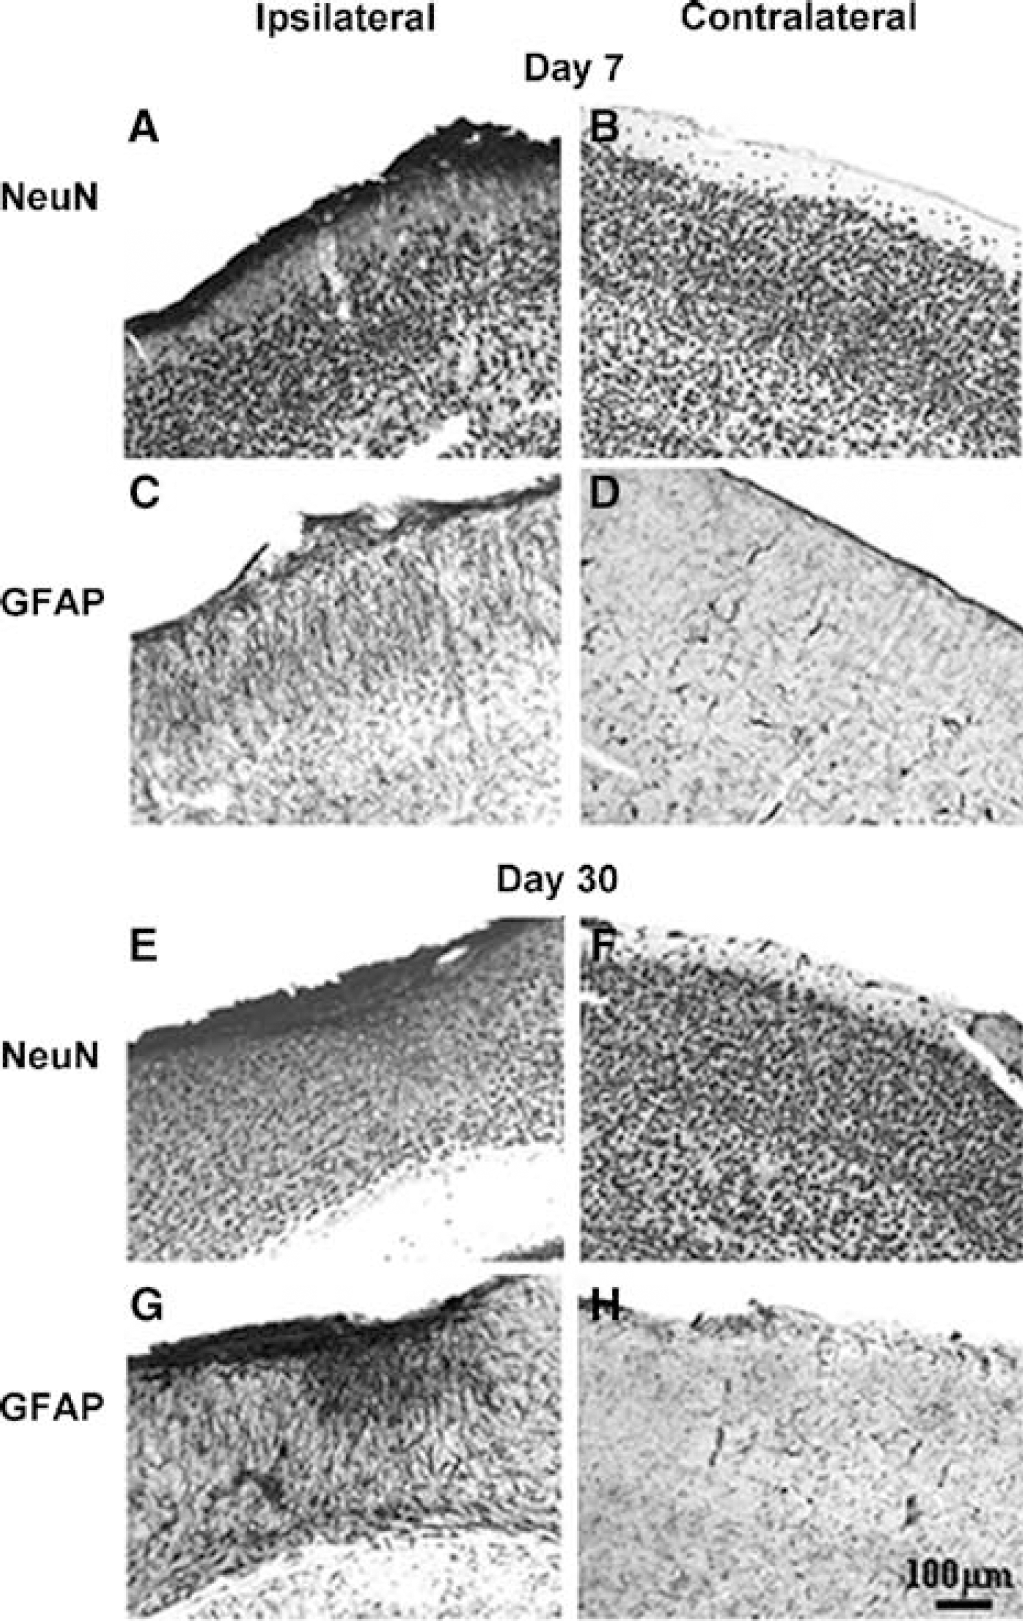
Maturation of the cortical infarct as revealed by immunostaining for NeuN (
Day 30: There was a small zone of necrotic tissue in the infarct epicenter, invaded by connective tissue (Figure 10E). The boundary region of the lesion contained well-defined astrocytes with long processes (Figure 10G).
Discussion
The present data show that microcirculation of the mouse neocortex can be extensively explored in vivo and in real time in basal and ischemic conditions using laser-scanning confocal fluorescence microscopy. The repeated measurement of fluorescent erythrocyte velocity through parenchymal capillaries in the mouse brain offers a dynamic and quantitative approach of murine cerebral microcirculation. Furthermore, the focal occlusion of distal MCA branches through the cranial window allows direct long-term in vivo investigation of the spatial and temporal evolution of microcirculation in ischemic and peri-ischemic areas for at least 1 month. Another advantage of this method is the repeated visualization by fluorescence microscopy of the respective pial and parenchymal vascular networks, and thus the possibility of following remodeling processes in vivo because of ischemia, avoiding the killing of animals at various time points.
To our knowledge, this is the first study to report capillary erythrocyte velocity in the mouse brain. Although it is highly heterogeneous because it is dependent on many parameters, the basal value of erythrocyte velocity under isoflurane anesthesia is of the same order of magnitude as that in rats (Seylaz et al, 1999) and in gerbils (Hauck et al, 2004) anesthetized with halothane. The large standard deviation indicates the heterogeneity of capillary circulation initially shown in the rat brain by Hudetz et al (1992). The heterogeneity of erythrocyte velocity may be as much marked between several capillaries of the same area at a given time as between mice, which makes its mean value of limited physiologic significance. Interestingly, the mean basal value of capillary erythrocyte velocity measured 1 month later was not significantly different from the first measurement in sham-operated animals and neither was the geometry of the microvascular network. This is good evidence that the mouse cranial window can be explored in the long term without disturbing cortical microcirulation.
The present approach for ischemia induction shares some features with that developed in rats (Wei et al, 1995), using ligation of arterial segments before cranial window implantation, although not affecting the same cortical territory. It can also be compared with laser-induced photothrombosis. The resulting damage closely resembles the infarcts induced by laser irradiation in terms of location and size at 1 day after occlusion (Eichenbaum et al, 2002; Schroeter et al, 2002), but with the advantage of not using photosensitive dyes.
The present approach is also in the line of the embolic focal cerebral ischemia created in mice by a fibrin-rich clot placed at the origin of the MCA (Zhang et al, 1997), because thrombosis is the first step in ischemia. It is relevant to thromboembolic stroke in humans, also because spontaneous reperfusion of arteries occurred in most experiments. Another recently developed comparable approach includes distal ligation of the MCA and subsequent mapping of blood flow changes by laser speckle flowmetry through a cranial window in the mouse (Ayata et al, 2004), but this was for acute blood flow investigations only. The major advantage of the present procedure is to induce a reproducible focus of infarction surrounded by nonischemic tissue that can be explored directly and repeatedly in real time through the window for at least 1 month. The use of isoflurane is compatible with repeated fluorescence microscopy investigations. It was shown that isoflurane did not significantly influence physiologic parameters during and after ischemia in mice (Kapinya et al, 2002).
Because distal branches of the MCA were occluded, and local blood flow changes indicated the rapid creation of an infarct core bordered by a penumbral zone, essentially the same cell responses as focal ischemia induced by MCA occlusion (MCAO) (Connolly et al, 1996) were obtained, although the resulting lesion was smaller. The volume of consistent reproducible cortical infarction assessed by histology 24 h after occlusion was similar to the volume of hyperintensity signal assessed by DWI or T2WI, indicating major contributions by cytotoxic and vasogenic edema. The agreement between the tissue damage found by MRI and cresyl violet staining indicates that the vasogenic edema caused no great dilation of the tissue. The two imaging modalities (T2WI and DWI) were equally effective for determining the extent of ischemic injury, as found in focal ischemia in rats (Gill et al, 1995) and mice (Weber et al, 1993). One week later, a small area of necrotic tissue was surrounded by incomplete ischemic damage and persistent glia activation, as also shown in a mouse model of photothrombotic cerebral infarction (Schroeter et al, 2002). One month later, there was glial scarring with atrophy of the affected cortex. No major neurologic deficit resulted from the lesion, but the reproducible size and location within the somatosensory and visual cortex should stimulate the development of a behavioral approach to the in vivo evaluation of damage. Any direct effect of thermocoagulation on neurons and glia can be excluded, because the increase in local tissue temperature was rather low (2.4°C ± 0.5°C) and lasted 35 secs, which is far from being detrimental. Consequently, arterial thrombosis was solely responsible for the damage.
Although this study was not designed to quantitatively evaluate the endothelial permeability, we can draw some conclusions with regard to the long-term use of the cranial window and to microcirculation in ischemic conditions. Rather importantly, the presence of a chronic cranial window plus several injections of fluorescent tracers over 1 month did not significantly alter endothelial barrier proteins since the impermeability of the BBB to RITC-dextran did not change over time in sham-operated mice. After arterial occlusion, there was a rapid increase in BBB permeability, but its transient nature achieved that subsequent fluorescence imaging was not precluded. In addition, the inhomogeneous recovery of BBB impermeability within 1 month shows the interest of delivering potential drugs at a relatively long time after arterial occlusion. A specific time-related quantitative evaluation of BBB permeability to various sized fluorescent molecules, as that described in rats by Mayhan and Heistad (1985), would be another step in the characterization of the present model of focal ischemia in the long term.
An additional advantage of the present approach is its suitability to in vivo study vascular remodeling, although it was not the main purpose of this study. The changes seen under the window 1 month after ischemia are in agreement with results obtained in rats (Wei et al, 2001). The increased density of long straight microvessels (part of them being only filled with plasma) suggests their involvement in the postischemic ‘clean-up’ of necrotic debris (Manoonkitiwonga et al, 2001). These microvessels included rather straight capillaries, in which erythrocyte velocity was higher than in nonischemic tortuous capillary network. Such capillaries may be likened to the so-called thoroughfare channels described in rats (Hudetz et al, 1996) and more recently in gerbils (Hauck et al, 2004).
In conclusion, long-term in vivo imaging of pial and cortical microcirculation in an ischemic area in C57BL/6 mice using laser-scanning confocal microscopy opens the way to long-term pathophysiologic and pharmacologic studies of stroke in knocked out mice, with direct visualization of events through the window. It may also be useful for showing the time-related microcirculatory consequences and the tissue influence of arterial occlusion in mice with late reperfusion, to explore directly any possible vascular remodeling, angiogenesis, or to follow migration, proliferation, and phenotypic changes of exogenously administered fluorescent cells.