
Abstract
Hemostasis factors may influence the pathophysiology of stroke. The role of brain hemostasis in ischemic hypertensive brain injury is not known. We studied ischemic injury in spontaneously hypertensive rats in relation to cerebrovascular fibrin deposition and activity of different hemostasis factors in brain microcirculation. In spontaneously hypertensive rats subjected to transient middle cerebral artery occlusion versus normotensive Wistar-Kyoto (W-K) rats, infarct and edema volumes were increased by 6.1-fold (P < 0.001) and 5.8-fold (P < 0.001), respectively, the cerebral blood flow (CBF) reduced during middle cerebral artery occlusion (MCAO) by 55% (P < 0.01), motor neurologic score increased by 6.9-fold (P < 0.01), and cerebrovascular fibrin deposition increased by 6.8-fold (P < 0.01). Under basal conditions, brain capillary protein C activation and tissue plasminogen activator activity were reduced in spontaneously hypertensive rats compared with Wistar-Kyoto rats by 11.8-fold (P < 0.001) and 5.1-fold (P < 0.001), respectively, and the plasminogen activator inhibitor-1 antigen and tissue factor activity were increased by 154-fold (P < 0.00001) and 74% (P < 0.01), respectively. We suggest that hypertension reduces antithrombotic mechanisms in brain microcirculation, which may enhance cerebrovascular fibrin deposition and microvascular obstructions during transient focal cerebral ischemia, which results in greater neuronal injury.
Hypertension is a major factor that increases the risk of cardiovascular disease and ischemic stroke (Bots et al., 1992; Cortellaro et al., 1991; Sobel et al., 1989). It has been suggested that immunohematologic abnormalities in plasma, impaired systemic fibrinolysis, and procoagulant blood profile may play a role in the development of cerebrovascular ischemic disease and thromboembolic occlusions in stroke patients (Catto and Grant, 1995; De Stefano et al., 1998; Fisher, 1995; Folsom et al., 1999; Grau et al., 1998; Levine et al., 1997; Zlokovic, 1997; Zlokovic et al., 1995a). Prolonged clot lysis time, increased platelet aggregation, elevated plasma fibrinogen, alterations in circulating components of the fibrinolytic system, i.e., lower plasma tissue plasminogen activator (tPA) activity and increased plasma plasminogen activator inhibitor-1 (PAI-1), and a link between cerebrovascular disease and deficiency in anticoagulant protein C have been documented in patients with mild essential hypertension and carotid artery occlusion (Anzola et al., 1993; Landin et al., 1990; Lebedev et al., 1991; Macko et al., 1999; Winther et al., 1991).
Recent studies on brain hemostasis indicated that cerebrovascular pathways including clot preventing (i.e., anticoagulant), clot dissolving (i.e., fibrinolytic), and clot forming (i.e., procoagulant) might critically influence the neuropathologic outcome after focal ischemic stroke (Schreiber et al., 1998; Thomas et al., 1994; Tran et al., 1996; Wang et al., 1998; Zlokovic et al., 1995a, b ). An imbalance in brain capillary hemostasis between anticoagulant (i.e., protein C–thrombomodulin [protein C–TM]), fibrinolytic (i.e., tPA-PAI-1), and procoagulant (i.e., tissue factor [TF]) pathways may lead to a significant loss of antithrombotic functions in brain microcirculation, which in rodent models for stroke risk factors, is associated with reduced ischemic and/or postischemic cerebral blood flow (CBF) and enhanced brain injury (Kittaka et al., 1996; Wang et al., 1997a). Brain endothelial antithrombotic function is also reduced by cytokines (e.g., interleukin-1β and tumor necrosis factor α) that are pathogenic mediators of ischemic stroke (Hallenbeck, 1997; Wang et al., 1997b). It has been shown that microvascular brain fibrin deposition correlates with microvascular obstructions, CBF reductions, and the extent of brain injury caused by a transient focal ischemia in nonhuman primates (Okada et al., 1994) and in tPA-deficient mice (Tabrizi et al., 1999).
Limited information is available on brain hemostasis and ischemic neuronal injury in hypertensive patients or in experimental hypertension models. It has been observed that fibrin-rich emboli dissolve slowly in spontaneously hypertensive rats (SHR) (Kimata et al., 1991). SHR may also develop brain microvascular thrombosis after a provocative dose of Escherichia coli lipopolysaccharide (Hallenbeck et al., 1988). Whether ischemic brain damage in SHR (Brosnan et al., 1999; Duverger and MacKenzie, 1988; Prado et al., 1996; Tagami et al., 1999) is related to enhanced cerebrovascular thrombosis and alterations in brain hemostasis is not known. We hypothesized that specific vascular alterations in hemostasis factors are responsible for changes in intravascular coagulation during an ischemic stress in SHR versus genetically matched normotensive Wistar-Kyoto (W-K) rats, and this, in turn, could be related to accelerated fibrin formation, ischemic microvascular obstructions, and larger brain injuries in SHR. In this study, a transient middle cerebral artery occlusion (MCAO) (Lavine et al., 1998) was used in SHR and W-K rats to determine ischemic hypertensive brain injury, cerebrovascular fibrin deposition, and microvascular obstructions in relation to the activity profile of brain anticoagulant, fibrinolytic, and procoagulant pathways.
MATERIALS AND METHODS
The studies were performed using male SHR and control normotensive W-K rats that weighed 260 to 300 g and were obtained from Taconic Farms, Inc. (Germantown, NY. U.S.A.). The animals were housed under diurnal light conditions with unlimited access to food and water. All procedures were performed in accordance with the Animal Care Guidelines at the University of Southern California and approved by the National Institutes of Health.
Focal ischemia studies
Rats were deprived of food 12 hours before surgery. Reversible MCAO was performed by using an intraluminal thread technique (Zea Longa et al., 1989) as modified in our laboratory (Kittaka et al., 1996; Lavine et al., 1998) in SHR (n = 6), and control W-K (n = 5) rats. The procedure involved initial anesthesia with metofane and maintenance with 50 mg/kg pentobarbital intraperitoneally. Atropine methyl nitrate (0.18 mg/kg) was given intraperitoneally as premedication to prevent airway obstruction by mucus formation. The animals were allowed to breath spontaneously. Rectal temperature was maintained at 37°C by a thermostatically regulated heating pad. A PE-50 catheter was introduced into the right femoral artery for continuous monitoring of the mean arterial blood pressure (MABP), as well as for repeated sampling of blood for serial measurements of Pao2, Paco2, pH (ABL 30 Acid-Base Analyzer; Radiometer, Copenhagen, Denmark), hematocrit, and blood glucose.
In brief, the surgical technique was as follows: Under the operating microscope, the right carotid complex was exposed through a ventral midline incision, and the external carotid artery and its branches ligated. Temporary ligatures were placed around the common carotid artery and internal carotid artery to prevent bleeding. Through a transverse incision in the artery, a 3–0 monofilament nylon suture with a rounded tip was introduced into the external carotid artery lumen, and gently advanced 17.5 mm into the internal carotid artery to occlude the MCA at its origin from the circle of Willis. After 1 hour of occlusion, the thread was pulled out, the external carotid artery permanently tied at the level of bifurcation, and the common carotid artery and internal carotid artery sutures removed to allow reperfusion.
Blood flow and head temperature measurements
Cortical CBF was monitored in a separate study before and during occlusion and for 90 minutes of reperfusion by a laser Doppler flowmetry tissue-perfusion monitor (BLF21; Transonic Systems, Ithaca, NY, U.S.A.) with the probe (0.8 mm diameter) positioned 0.1 mm above the dura over the cortical surface. In the hemisphere ipsilateral to the MCA occlusion, coordinates of point A were 1 mm posterior to the bregma and 5.4 mm lateral to the midline; point B, in the contralateral hemisphere, was 1 mm posterior to the bregma and 5.4 mm from the midline. At each point, a small burr hole was drilled in the skull and the bone carefully removed to prevent damage to the cortex. Steady-state baseline values were recorded before occlusion and CBF during occlusion and reperfusion expressed as a percentage of the baseline values.
Head temperature was monitored with a 36-gauge thermocouple temperature probe in the temporalis muscle connected to a digital Thermometer/Thermoregulator model 9000 (Omega, Stanford, CT, U.S.A.).
Motor neurologic behavioral score
Neurologic examination was performed after 23 hours of reperfusion, just before the rats were killed. Neurologic outcome was scored on the following 6-point scale as previously reported (Lavine et al., 1998): a score of 0 indicated no neurologic deficit (normal); a score of 1 (failure to extend left forepaw fully), a mild focal neurologic deficit; a score of 2 (circling to the left), a moderate focal neurologic deficit; a score of 3 (falling to the left), a severe focal deficit; rats with a score of 4 did not walk spontaneously and had a depressed level of consciousness; and a score of 5 was stroke-related death.
Measurement of volume of injury
The area of injury was delineated by incubation of unfixed 2-mm coronal brain slices in 2% triphenyltetrazolium chloride (TTC; Sigma Chemical, St. Louis, MO, U.S.A.) in 0.173 mol/L sucrose, 50 mmol/L K+ phosphate buffer (pH 7.4) for 20 minutes at 37°C and then stored in 10% formalin. Serial coronal sections were displayed on a digitizing video screen with the use of an imaging system (Jandel Scientific, San Rafael, CA, U.S.A.), and the areas of nonstaining tissue were determined in each section. The volume of injury was calculated by summing up affected areas from each coronal section and multiplying by the thickness of each section. The volumes of the control and lesioned hemispheres were calculated, and the amount of injury was expressed as a percentage of lesioned hemisphere and in absolute terms (expressed as cubic millimeters). The edema volume was calculated by subtracting the volume of the normal gray matter in the control hemisphere from the volume of gray matter in the lesioned hemisphere (Swanson et al., 1990). The total injury volume of gray matter corrected for edema was calculated by subtracting the edema volume from the volume of injury in the lesioned hemisphere (Swanson et al., 1990). Measurements of the volume of injury were performed separately for the pallium and striatum. A coronal section from each brain was obtained at the level of the optic chiasm.
Histopathology
Detection of fibrin by immunostaining was performed on brain tissue sections previously treated with TTC as described (Tabrizi et al., 1999). Tissue fixed in 10% buffer formalin was processed and 4-μm-thick paraffin coronal sections from each block cut and stained. Fibrin was localized by using the following grading scale (Tabrizi et al., 1999): 1, fibrin deposition limited to intravascular space; 2, fibrin deposition in the intravascular lumen and the perivascular space; and 3, fibrin lattices in the extravascular or parenchymal tissue only. For immunostaining, antihuman fibrinogen/fibrin antibody (DAKO Corporation, Carpinteria, CA, U.S.A.) (1:1,000 dilution) that crossreacts with rodent fibrin was used. Routine control sections included deletion of primary antibody, deletion of secondary antibody, and the use of an irrelevant primary antibody. All analyses assessed visually were performed by one observer blinded to the specimen source and timing.
Detection of fibrin in brain tissue sections by quantitative Western blot
In brief, after TTC staining, a 2-mm section of brain tissue was divided into contralateral and ipsilateral hemisphere. Tissue was homogenized in 10 mmol/L sodium phosphate buffer, pH 7.5, 0.1 mol/L ε-aminocaproic acid, 5 mmol/L trisodium EDTA, 10 U of aprotinin/mL, 10 U of heparin/mL, and 2 mmol/L phenylmethylsulfonyl fluoride. The homogenate was agitated for 14 hours at 4°C, and the particulate material was sedimented by centrifugation at 10,000 × g for 10 minutes, resuspended in extraction buffer without phenylmethylsulfonyl fluoride, sedimented again, and finally dispersed in 3 mol/L urea. The suspension was agitated for 2 hours at 37°C, vigorously vortex mixed, and centrifuged at 14,000 × g for 15 minutes. The supernatant was aspirated and the sediment dissolved at 65°C in reducing sodium dodecyl sulfate buffer, subjected to sodium dodecyl sulfate–polyacrylamide gel electrophoresis (8%), and transferred to a polyvinylidene difluoride membrane (Immobilon-P; Millipore Corp., Bedford, MA, U.S.A.) by electroblotting. Fibrin was visualized with the same antihuman fibrinogen/fibrin antibody (DAKO) and enhanced chemiluminescence system (Amersham Corp., Arlington Heights, IL, U.S.A.). Fibrin standards were prepared by clotting a known amount of murine fibrinogen (Sigma, St. Louis, MO, U.S.A.) with an excess of thrombin in the absence of calcium. The films were scanned with a Hoefer GS 300 scanning densitometer interfaced to an IBM PC computer with a DT 2805 analog and digital system (Data Translation, Marlboro, MA, U.S.A.) and data were converted to micrometers of fibrin per 0.1 g of tissue.
Electron microscopy
Brains were immediately removed from the skull and fixed in Karnovsky's solution (glutaraldehyde and paraformaldehyde) and sections examined by transmission electron microscopy.
Isolation of brain capillaries
Brain capillaries were isolated from SHR (n = 6) and control W-K rats (n = 6) rats by a modified mechanical homogenization technique (Zlokovic et al., 1993). In brief, brains were immediately removed from the skull and immersed in ice-cold buffer B (103 mmol/L NaCl, 4.7 mmol/L KC1, 2.5 mmol/L CaCl2, 1.2 mmol/L KH2PO4, 1.2 mmol/L MgSO4, 15 mmol/L HEPES, pH 7.4). The cerebral cortical mantles were rapidly freed of meninges (i.e., pial vessels), the arteries of the circle of Willis, veins and choroid plexi were discarded, and cerebral cortices used to isolate the capillaries. Brain homogenization in buffer A (buffer B + 25 mmol/L HCO3, 10 mmol/L glucose, 1 mmol/L sodium pyruvate, and 1 g/100 mL dextran, Mr = 64,000) with a handheld Teflon homogenizer was followed by dextran-density centrifugation at 5,800 × g at 4°C. The pellet was resuspended in buffer A and passed over an 85-mm nylon mesh. Arterioles and venules remained on top of the mesh, and the capillaries, red cells, nuclei, and other debris were collected in the filtrate passing through the mesh. This filtrate was then passed over a 3 × 4-cm glass bead column (0.45-mm glass beads), with 44-mm nylon mesh at the bottom, and the column washed with buffer B. The brain capillaries adhere to the glass beads while the other contaminants pass unimpeded. Capillaries were recovered by repeated gentle agitation of the glass beads in buffer A, the supernatant with capillaries was decanted and spun at 500 × g for 5 minutes to obtain the final pellet. The purity of the cerebral capillary preparation was checked by light and phase microscopy. The cerebral capillaries were free of adjoining brain tissue, and preparations consisted primarily of capillaries but also contained minor amounts (5% to 10%) of small arterioles, as described (Zlokovic et al., 1993, 1995b). Capillary-depleted brain homogenates were centrifuged again at 5,800 × g at 4°C (second centrifugation) to obtain a final capillary-free brain supernatant. The presence of no more than minimal detectable activity of a specific cerebrovascular marker, γ-glutamyl transpeptidase, was used to confirm the absence of contamination of capillary-depleted brains with microvessels but not to demonstrate that the microvascular preparations are capillaries only.
Protein C activation
Capillaries were washed with phosphate-buffered saline three times (centrifugation at 10,000 rpm for 5 minutes), the microvascular pellet sonicated, resuspended in phosphate-buffered saline and spun at 10,000 g for 5 minutes three times. Microvascular homogenate samples were assayed for protein content by the method of Lowry et al. (1951). A standard amount of microvascular proteins from each sample was incubated in 100 μL of assay buffer containing 50 mmol/L Tris-HCl (pH 8.0), 2 mmol/L CaCl2, 0.1 mol/L NaCl, 0.1% bovine serum albumin (BSA), 0.6% Triton X-100, and 2.2 nmol/L bovine thrombin (Enzyme Research Laboratories, South Bend, IN) and 65 nmol/L bovine protein C (Enzyme Research) for 60 minutes at 37°C, as described (Wang et al., 1997b). The reaction was terminated by adding antithrombin III (5 μg) and heparin (5 U), and the reaction mixture was centrifuged at 10,000 rpm for 5 minutes. Equal volumes of the reaction mixture and a chromogenic substrate (S-2366; Kabi Pharmacia, Franklin, OH, U.S.A.) were added to a 96-well microtiter plate. Optical densities were measured with a spectrophotometer (EL-311SX; BioTek Instruments, Burlington, VT, U.S.A.) at 405 nm.
tPA/PAI-1 assay
PAI-1 antigen and tPA antigen concentration in brain microvascular homogenates was assayed by enzyme immunoassay using TintElize assay kit from Biopool (Ventura, CA, U.S.A.). In brief, the antigen in the sample was bound quantitatively to specific antibodies coated on the walls of the microtest strips. A second horseradish peroxidase–coated antibody against the same antigen was then added to the antigen–antibody complex followed by an horseradish peroxidase substrate (OPD/H2O2). The breakdown of the substrate yields a yellow product whose absorbance was measured at 492 nm on a microtest plate reader and calibrated against known antigen concentrations. The tPA fibrinolytic enzyme activity was determined by a chromogenic assay, using Chromolize tPA assay kit from Biopool, as described (Yu et al., 1999).
TF activity assay
This was determined by using a modified method of Fakuda et al. (1989). A standard amount of protein from microvascular homogenates was incubated in 300 μL of 0.2 mol/L Tris buffer, pH 7.3, containing 15 mmol/L CaCl2 for 5 minutes at 37°C. Next, 150 μL of the prothrombin complex PPSB (factor II, VII, IX, and X) (Nippon Pharmaceutical Co., Tokyo, Japan), diluted 2-fold with a 120 mmol/L solution of NaCl, was added to the mixture for 10 minutes at 37°C, and a 100 μL aliquot mixed with 600 μL of Tris buffer (700 mmol/L, pH 8.4) containing 2.5 mmol/L EDTA (37°C) to terminate this reaction. S-2222 100 μL was added to the mixture for 3 minutes at 37°C. The reaction was terminated by adding 300 μL of acetic acid diluted in an equal volume of water. The p-nitroaniline released from the substrate was measured with a spectrophotometer (EL-311SX; BioTek Instruments) at 405 nm.
Reverse transcription polymerase chain reaction
Total RNA was extracted from rat cerebral capillaries with Trizol reagent (GibcoBRL). cDNA was synthesized by reverse transcription (RT), using 4 μg of total RNA in 20 μL of reaction buffer containing 1 mmol/L each dNTP, 25 mmol/L Tris-HCl (pH 8.3), 1 μg of oligo(dT), 25 mmol/L KC1, 5 mmol/L MgCl2, 5 mmol/L dithiothreitol, 0.25 mmol/L spermidine, 10 U of RNAse inhibitor (Boehringer Mannheim), and 10 U of avian myeloblastosis virus reverse transcriptase (Promega). The reaction was performed at 42°C for 1 hour and terminated at 52°C for 40 minutes. The cDNA was stored at −20°C until use. Polymerase chain reaction (PCR) was performed with 2 μL of the reverse transcriptase reaction mixture, 50 mmol/L KCl, 10 mmol/L Tris-HCl (pH 8.3), 200 μmol/L each dNTP, and 1.0 U of Taq polymerase (Boehringer Mannheim) in a final volume of 50 μL. Varying concentrations of MgCl2 were used for the different reactions, i.e., 1 mmol/L for TM primers and PAI-1 primers, 4 mmol/L for TF primers, and 2 mmol/L for tPA primers. Amplification was performed in a DNA thermal cycler 480 (Perkin-Elmer, Norwalk, CT, U.S.A.). A hot start PCR method was used. After an initial denaturation at 95°C for 5 minutes, 0.5 mmol/L of primer (TM, TF, tPA, or PAI-1) was added and sample was subjected to 30 cycles (95°C, 1 minute; 58°C, 1 minute; and 72°C, 2 minutes). PCR products (10 μL) were analyzed by the use of electrophoresis on a 1% agarose gel.
The rat TM primers (National Biosciences Inc.) were designed from conserved cystine residue sites from the rat TM brain capillary sequence as reported (Wang et al., 1998). TM sense primers were 5′-TCCTGGCTCCTATGAGTGCA-3′ (nucleotides 1023–1042) and antisense primers were 5′-ACACCAGAGTGCATTGGTCTTG-3′ (nucleotides 1186–1208). The rat TF primers (National Biosciences Inc.), designed from published rat TF cDNA sequence, corresponded to nucleotides 184–206 (sense primer, 5′-TGGATATCAACTGATTTCAAGAC-3′) and 686–704 (antisense primer, 5′-TTTTCCACGTCAATCAAGA-3′) (Taby et al., 1996). The rat tPA primers corresponded to nucleotides 699–727 (sense primer, 5′-TGGCACCCACAGCTTTACCACATCCAAGC-3′) and nucleotides 1540–1568 (antisense primer, 5′-CTCCTGAGTCACCTGGCACGCGTCATGG-3′) taken from the sequence of rat tPA as reported (Zlokovic et al., 1995b). The rat PAI-1 primers corresponded to nucleotides 320–337 (sense primer, 5′-GGTCATGGAACAAGAATG-3′) and nucleotides 1083–1102 (antisense primer, 5′-CTGAGACTAGAATGGCTG-3′) taken from a highly conserved region of the published rat PAI-1 cDNA sequence (Zeheb and Gelehrter, 1988). β-Actin primers (forward primer, 5′-TGACGGGGTCACCCACACTGTGCCCATCTA-3′; reverse primer, 5′-CTAGAAGCATTTGCGGTGGACGATGGAGG-3′; Stratagene) were used to amplify β-actin mRNA as a housekeeping nonchanging control for gene expression.
RT-PCR analysis was performed by comparing the changes in TM, TF, tPA, or PAI-1 mRNA expression relative to β-actin mRNA. The amplification reaction for each cDNA prepared from brain capillaries and/or no reverse transcriptase blank was monitored by varying cycle numbers (cycle titration, 20, 30, 40, and 45), and 10 μL of the PCR product was analyzed by electrophoresis on 1% agarose gel (data not shown). For all studied transcripts, the number of cycles was within the linear range of the amplification response. Gels were visualized with ethidium bromide staining and ultraviolet transillumination. Photographs were taken with positive/negative type 55 film (Polaroid Corp.), and the negatives were scanned with a Hoefer GS 300 scanning densitometer interfaced to an IBM PC computer with a DT 2805 analog and digital system (Data Translation).
Statistical Analysis
Physiological variables, infarction and edema volumes, the amount of deposited fibrin, protein C activation, and tPA and TF activities were compared between groups by using a Student's t-test and analysis of variance. Nonparametric data (neurologic outcome scores) was subjected to the Kruskal-Wallis test. P < 0.05 was considered statistically significant.
RESULTS
Physiologic variables
There were no significant statistical differences in Pao2, Paco2, pH, hematocrit, head and body temperature, and blood glucose between the control W-K and SHR groups before MCA occlusion and during occlusion and reperfusion (Table 1). Mean arterial blood pressure was significantly higher in SHR versus W-K rats by 52%, and 48% and 49% before MCAO, during occlusion and reperfusion, respectively.
Physiologic variables
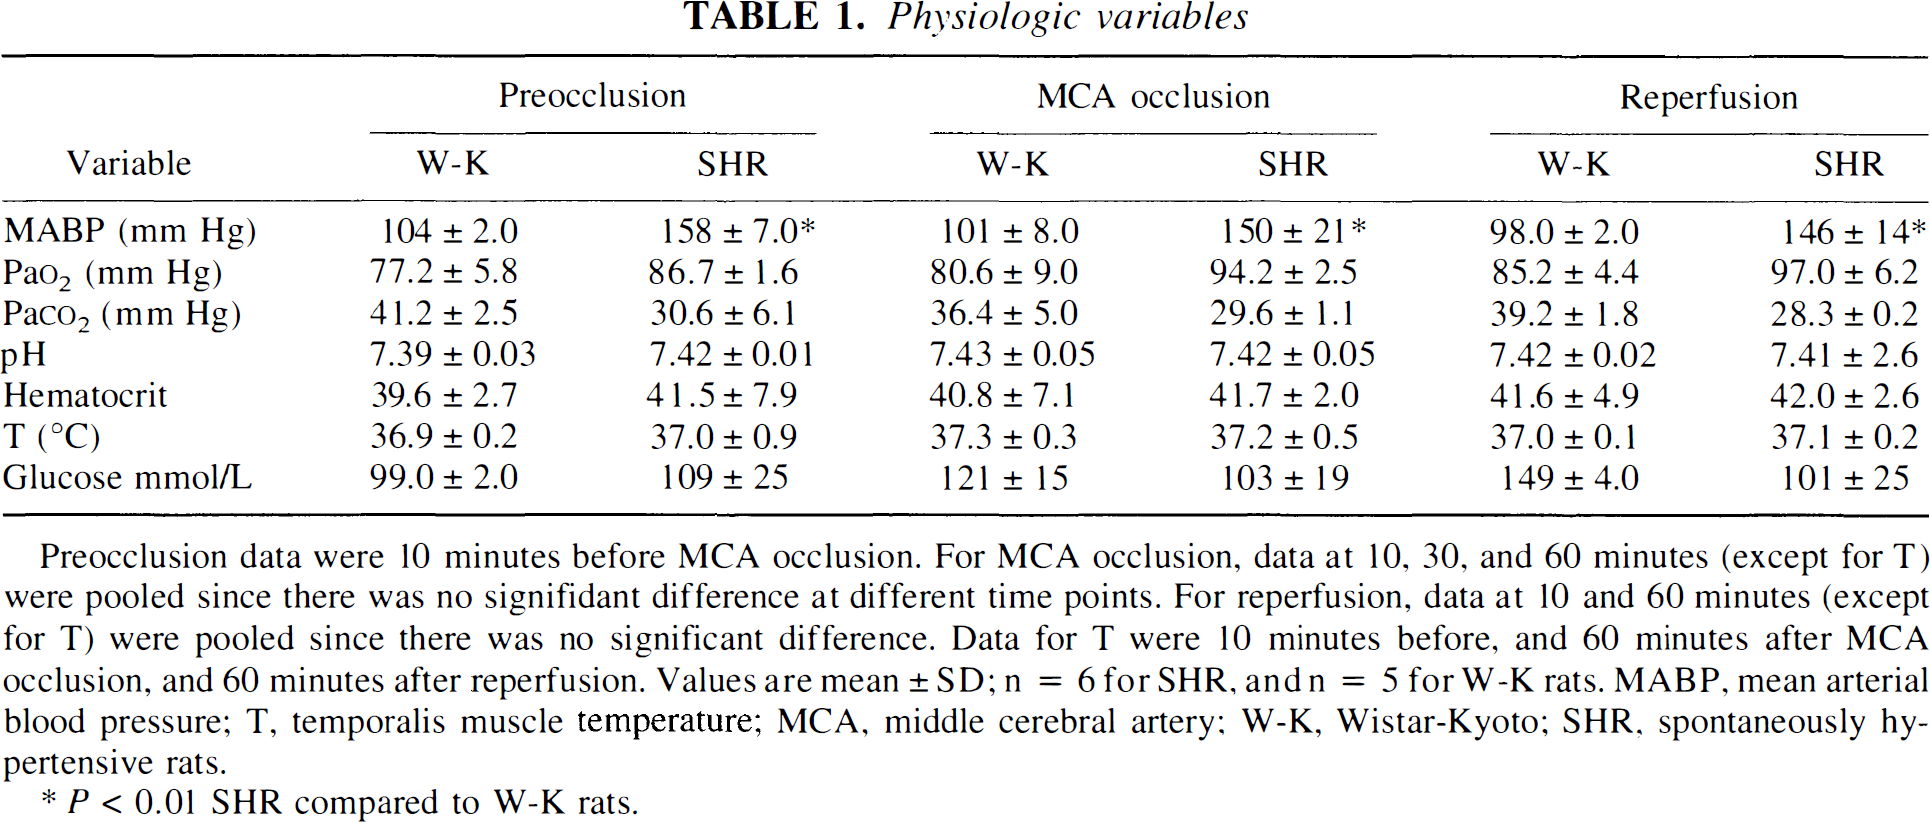
Preocclusion data were 10 minutes before MCA occlusion. For MCA occlusion, data at 10, 30, and 60 minutes (except for T) were pooled since there was no signifidant difference at different time points. For reperfusion, data at 10 and 60 minutes (except for T) were pooled since there was no significant difference. Data for T were 10 minutes before, and 60 minutes after MCA occlusion, and 60 minutes after reperfusion. Values are mean ± SD; n = 6 for SHR, and n = 5 for W-K rats. MABP, mean arterial blood pressure; T, temporalis muscle temperature; MCA, middle cerebral artery; W-K, Wistar-Kyoto; SHR, spontaneously hypertensive rats.
P < 0.01 SHR compared to W-K rats.
During MCAO, the reductions in CBF in the ischemic center (point A) were significantly higher in the SHR group, declining to a critical 14.8% of baseline values, compared with 33.4% in the W-K group (Fig. 1; Table 2). Relative reduction in CBF during MCAO in SHR versus W-K rats was 55%. During the first 30 minutes of reperfusion, there was a transient increase in CBF in the SHR group by 52% compared with the W-K group. This increase was, however, not statistically significant because of large individual variations between SHR animals. Between 30 and 90 minutes of reperfusion, the CBF in both groups was comparable.
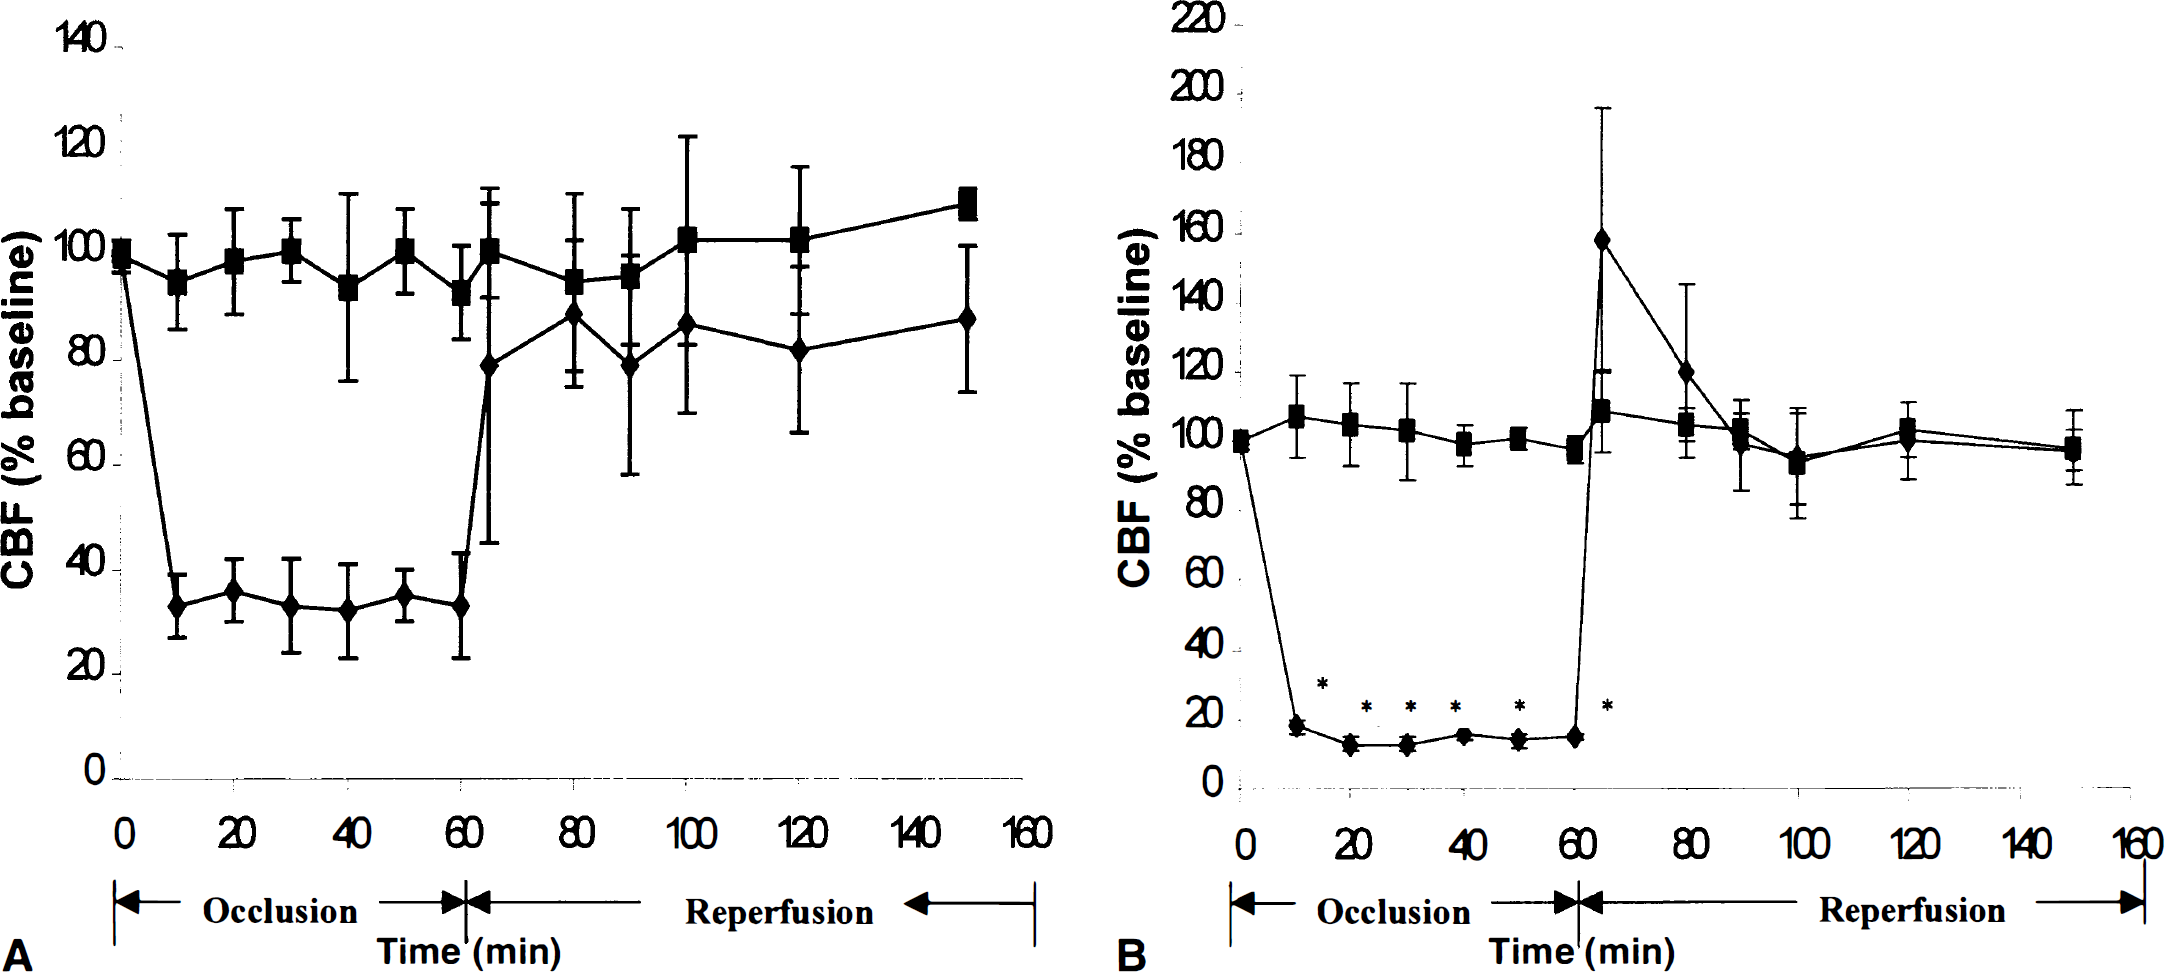
Changes in cerebral blood flow (CBF) during middle cerebral artery (MCA) occlusion and reperfusion in normotensive W-K rats
Cerebral blood flow during MCA occlusion and reperfusion in SHR and W-K rats
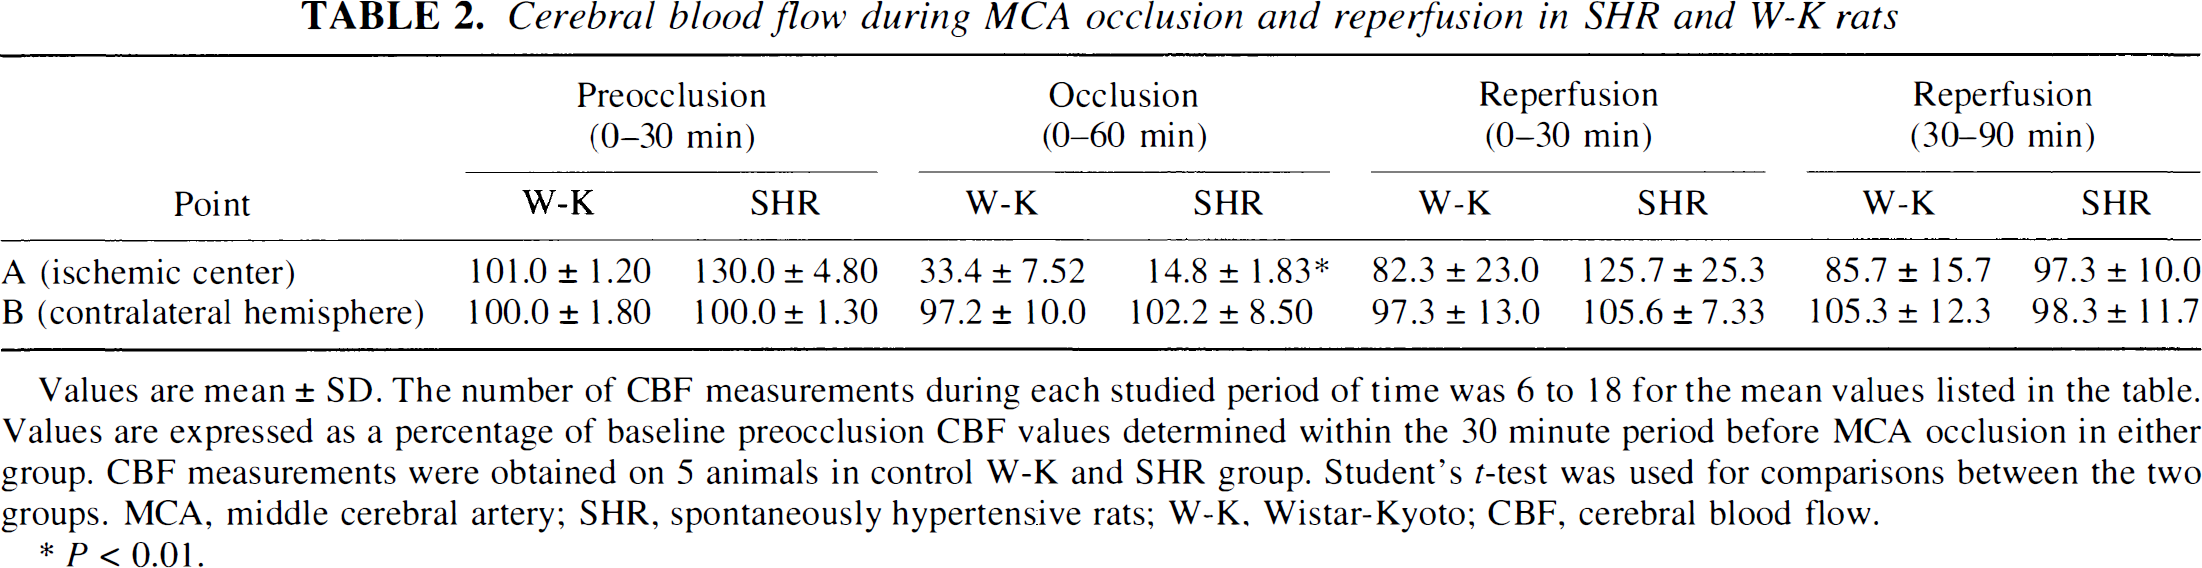
Values are mean ± SD. The number of CBF measurements during each studied period of time was 6 to 18 for the mean values listed in the table. Values are expressed as a percentage of baseline preocclusion CBF values determined within the 30 minute period before MCA occlusion in either group. CBF measurements were obtained on 5 animals in control W-K and SHR group. Student's r-test was used for comparisons between the two groups. MCA, middle cerebral artery; SHR, spontaneously hypertensive rats; W-K, Wistar-Kyoto; CBF, cerebral blood flow.
P < 0.01.
Motor neurologic score
After 23 hours of reperfusion, the control W-K group had a mean neurologic score of 0.42 ± 0.18, and the SHR group had a score of 2.92 ± 0.52, an increase by 6.9-fold (P < 0.01, by Kruskal-Wallis test).
Neuropathology
The volume of injury corrected for edema volume, i.e., total infarct volume, was significantly increased in the SHR group by 6.1-fold relative to control W-K rats (Table 3). Total edema volume was increased by 5.8-fold in the SHR. These increases were caused primarily by significant increase in injury volume in the pallium by 28.3-fold, and by a more modest 1.8-fold increase in injury volume in the striatum (Table 3). Total area of brain injury determined at the level of optic chiasm and expressed as a percentage of the coronal sectional area was increased by 3.3-fold in SHR versus W-K rats.
Neuropathologic outcome
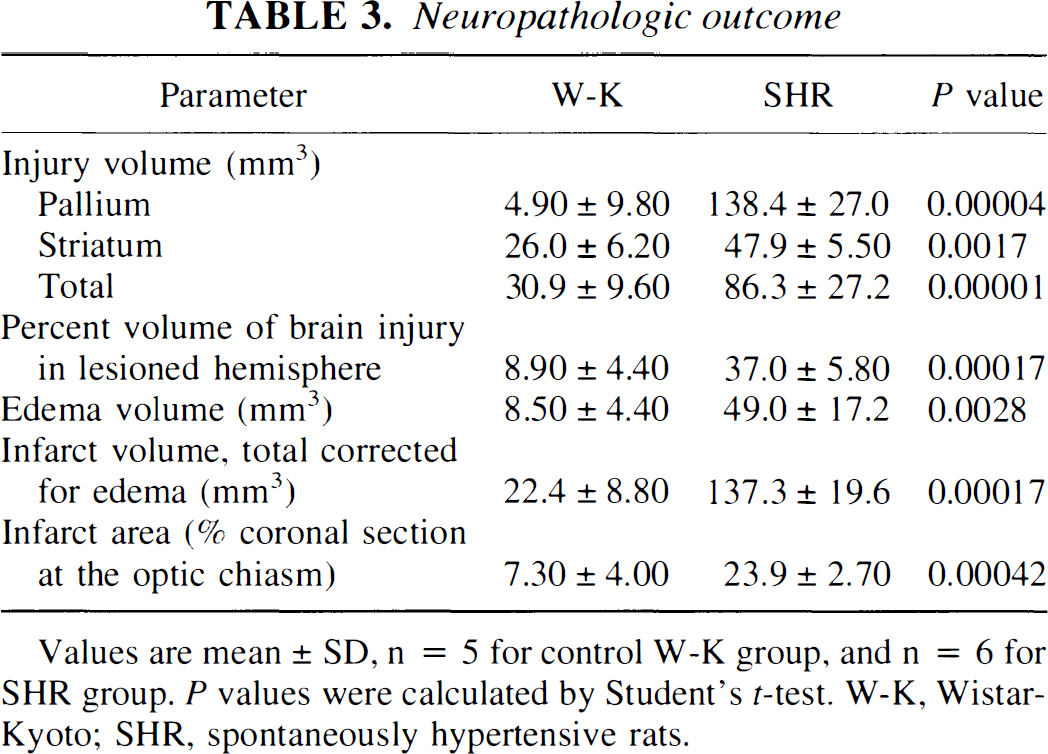
Values are mean ± SD, n = 5 for control W-K group, and n = 6 for SHR group. P values were calculated by Student's t-test. W-K, Wistar-Kyoto; SHR, spontaneously hypertensive rats.
Fibrin deposition
Figure 2 shows fibrin deposits in the ischemic lesioned hemisphere in the SHR. Immunostaining for fibrin was performed after TTC staining. Several small arterioles, venules, and capillaries contained intraluminal fibrin deposits (Fig. 2A) of grade I, using the scale for fibrin localization in an MCA model. Figures 2B and 2C show fibrin deposits in a large and a smaller parenchymal venule, and intraparenchymal leakage and extravascular deposition of fibrin grade II from a small arteriole, respectively. In contrast, no significant fibrin deposits or fibrin-rich thrombi were found after 23 hours of reperfusion in W-K control rats (Fig. 2D).
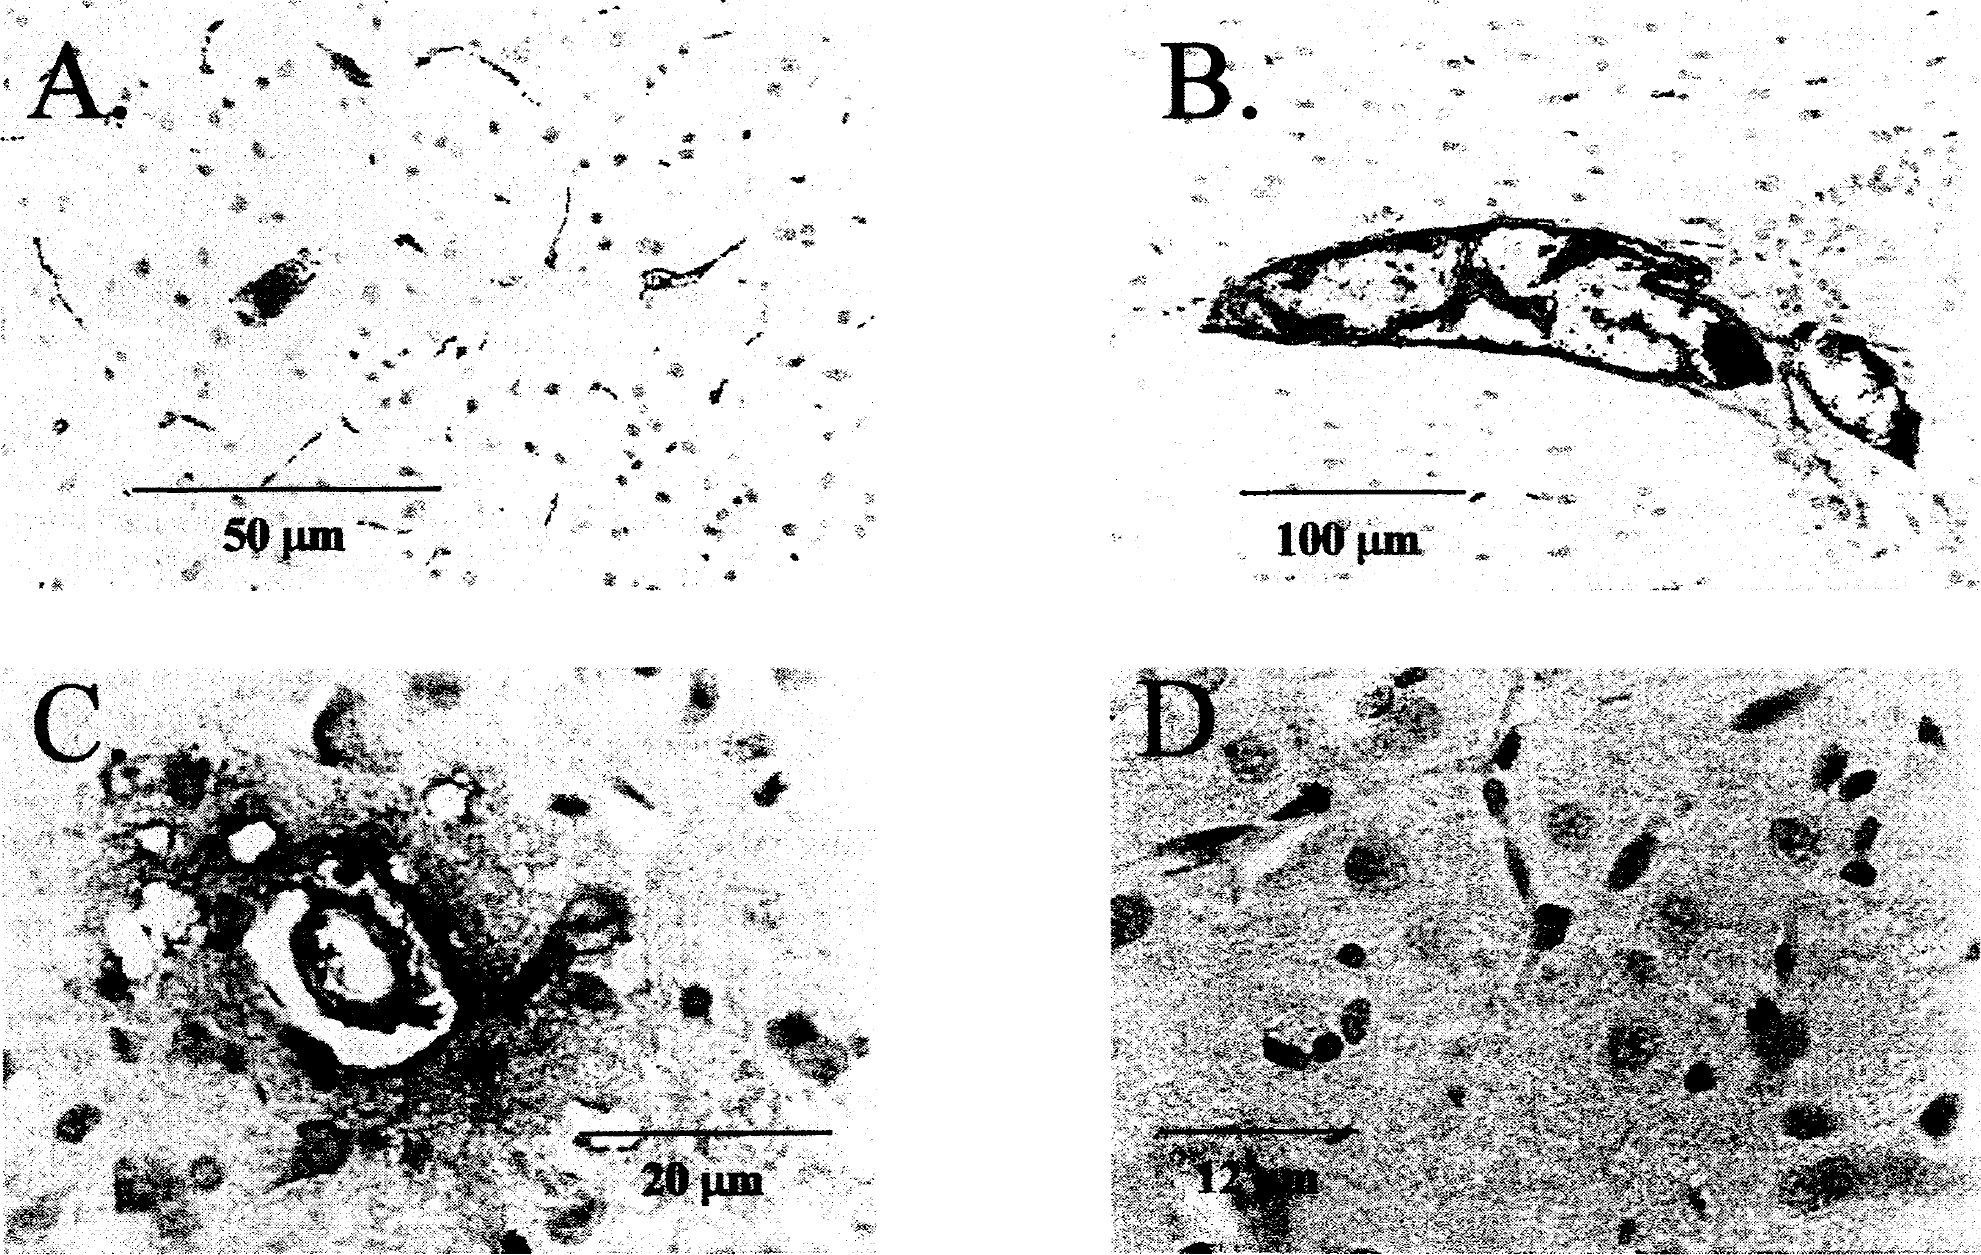
Immunohistologic detection of fibrin deposits in the ipsilateral lesioned ischemic hemisphere in SHR
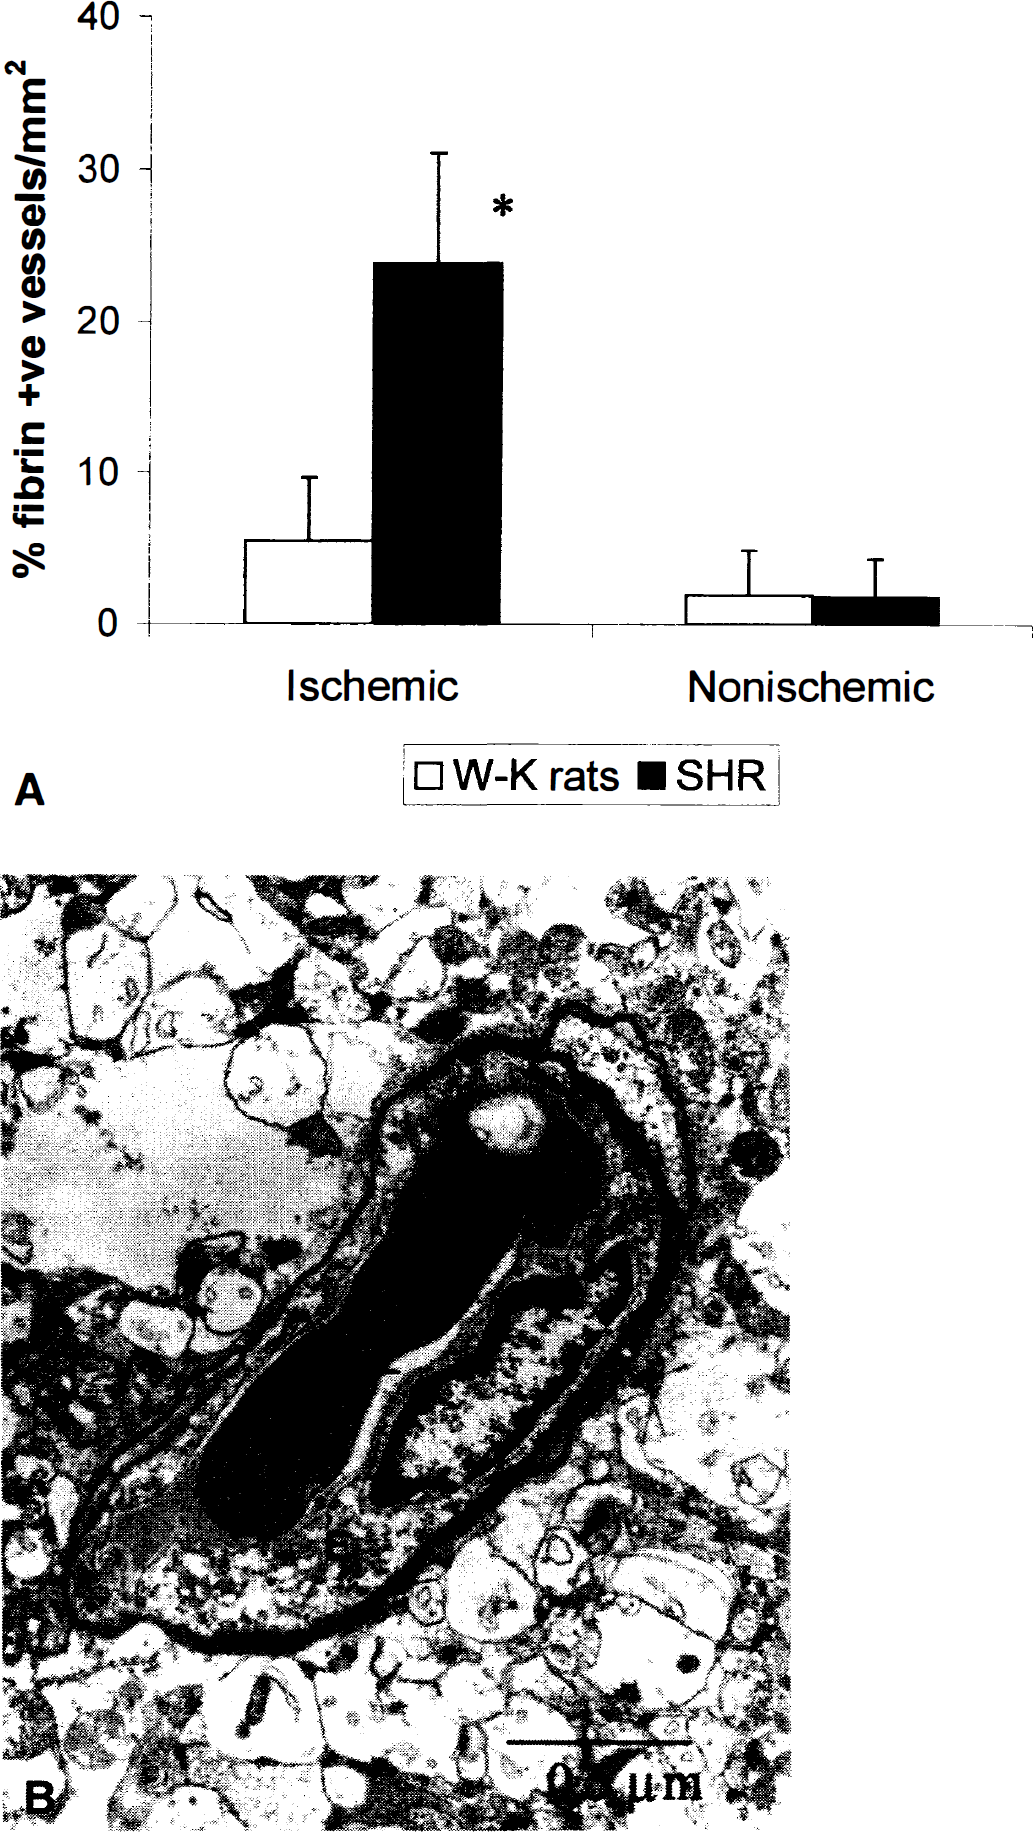
Quantitative Western blot analysis for fibrin on 2-mm-thick TTC brain sections confirmed the immunohistologic observations by demonstrating significant fibrin deposition in ischemic brain areas in the SHR group versus barely detectable levels of fibrin in the W-K control rats (Fig. 3). The relative increase in amount of fibrin in brain section IV (the level of optic chiasm) was about 6.1-fold based on Western blot analysis, whereas more moderate increases, between 52% and 98%, were found in sections II, III, and V. In the absence of ischemic challenge, there were no fibrin deposits in the brain under basal conditions in either the SHR or W-K groups. Figure 4A illustrates that about 24% of microvessels in the ischemic hemisphere in SHR contained fibrin deposits, whereas only 5% of vessels in the ischemic hemisphere in W-K rats were positive for fibrin. The amount of fibrin deposits determined by either Western blots or by counting positive vessels correlated well with the edema formation and brain injury in the two strains. No differences in endothelial lining, such as denudation that could precipitate fibrin deposition, were observed in SHR group (Fig. 4B), and fibrin deposition in control nonischemic hemisphere was undetectable in either group.
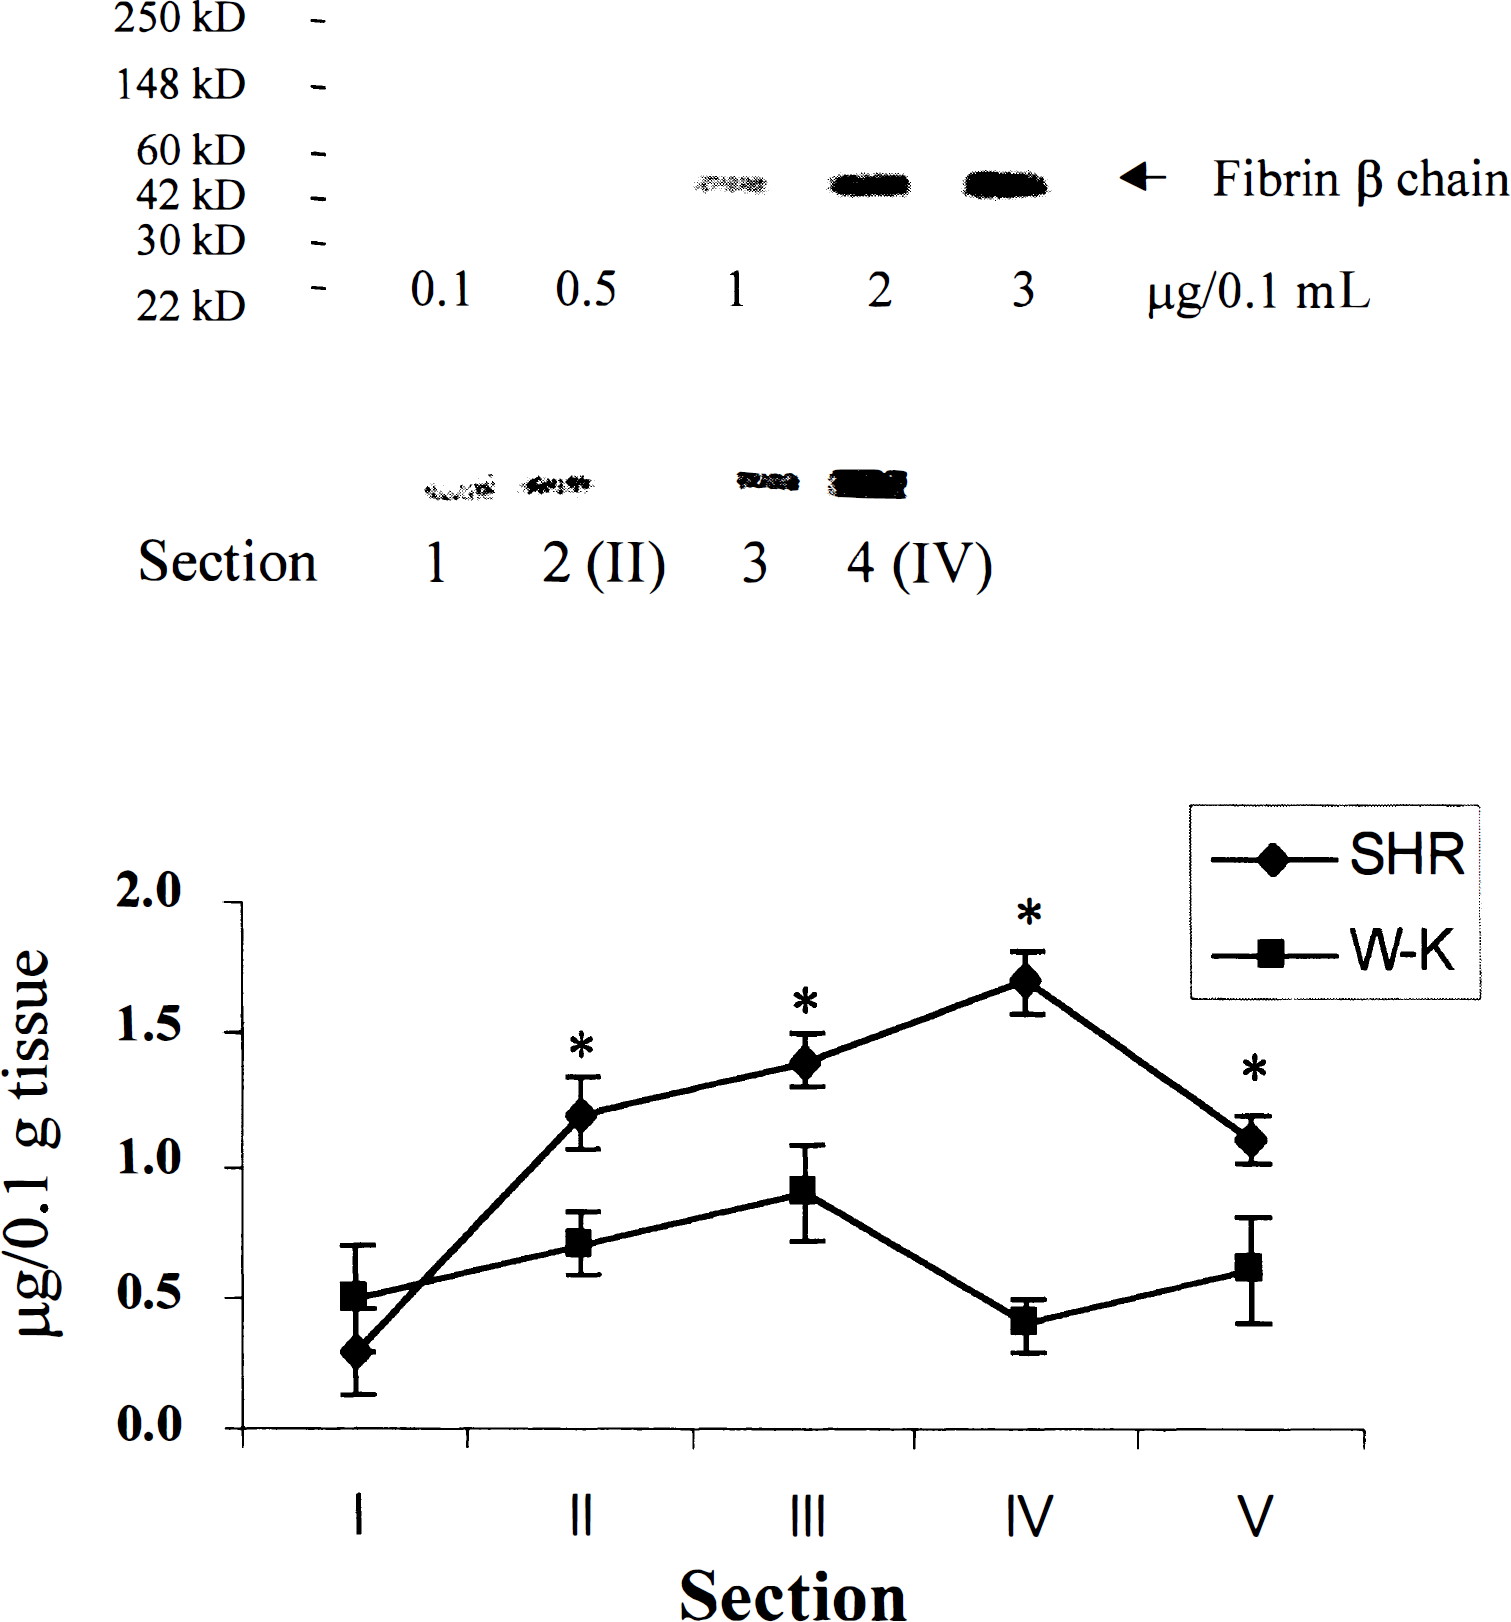
Western blot detection of fibrin in brain sections of SHR and W-K rats with antihuman fibrin antibodies specific for β-fibrin chain that cross-react with rat β-fibrin.
(
Brain capillary activity of hemostasis factors
As illustrated in Fig. 5A, protein C activation in the brain capillaries in the SHR group was low, and there was 11.8-fold decrease in comparison with the W-K group. In contrast, TF activity was increased by 74% (Fig. 5B). The tPA antigen levels in the brain capillaries of the SHR were 1.5 times higher than those in W-K rats (Fig. 5C); however, the tPA activity was reduced by 5.1-fold (Fig. 5D). Correspondingly, the PAI-1 antigen levels in SHR were extremely high (i.e., 2.09 ± 0.40 ng/mg of protein); there was a 154-fold increase in the PAI-1 antigen in the SHR, compared with the levels in W-K rats, which were barely detectable (Fig. 5E).
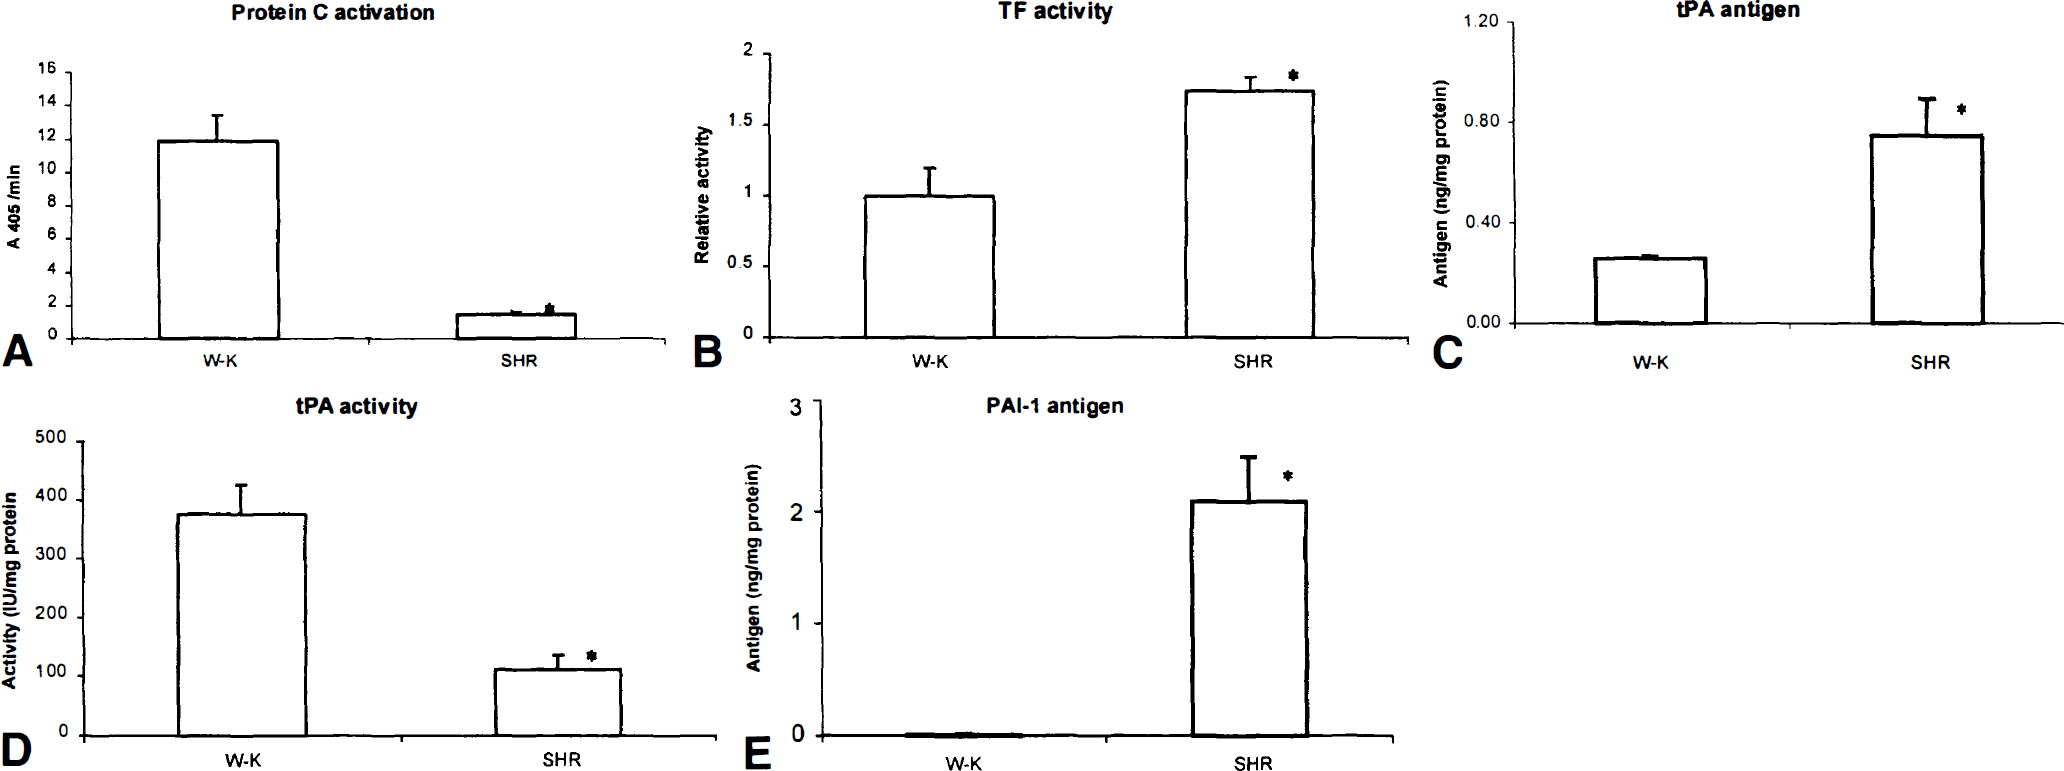
The activity of anticoagulant, fibrinolytic, and procoagulant pathways under basal conditions in cerebral microvessels (90%–95% capillaries) isolated from SHR and W-K rats.
Brain capillary mRNAs for hemostasis factors
RT-PCR analysis followed by scanning densitometry of bands revealed that brain capillary TM mRNA relative to β-actin mRNA was decreased by 31 % in SHR versus W-K rats (Fig. 6A). In contrast, tPA mRNA was increased 4.6 times in the SHR versus the W-K rats (Fig. 6B), whereas the PAI-1 mRNA was almost undetectable in the SHR (Fig. 6C). The TF mRNA, relative to β-actin mRNA, was decreased 7.4-fold in the SHR versus the W-K rats (Fig. 6D). After RT-PCR, the β-actin mRNA band density was similar in capillary samples from SHR and W-K rats. Sequences of the mRNA in the bands obtained corresponded to published sequences of the respective mRNAs.
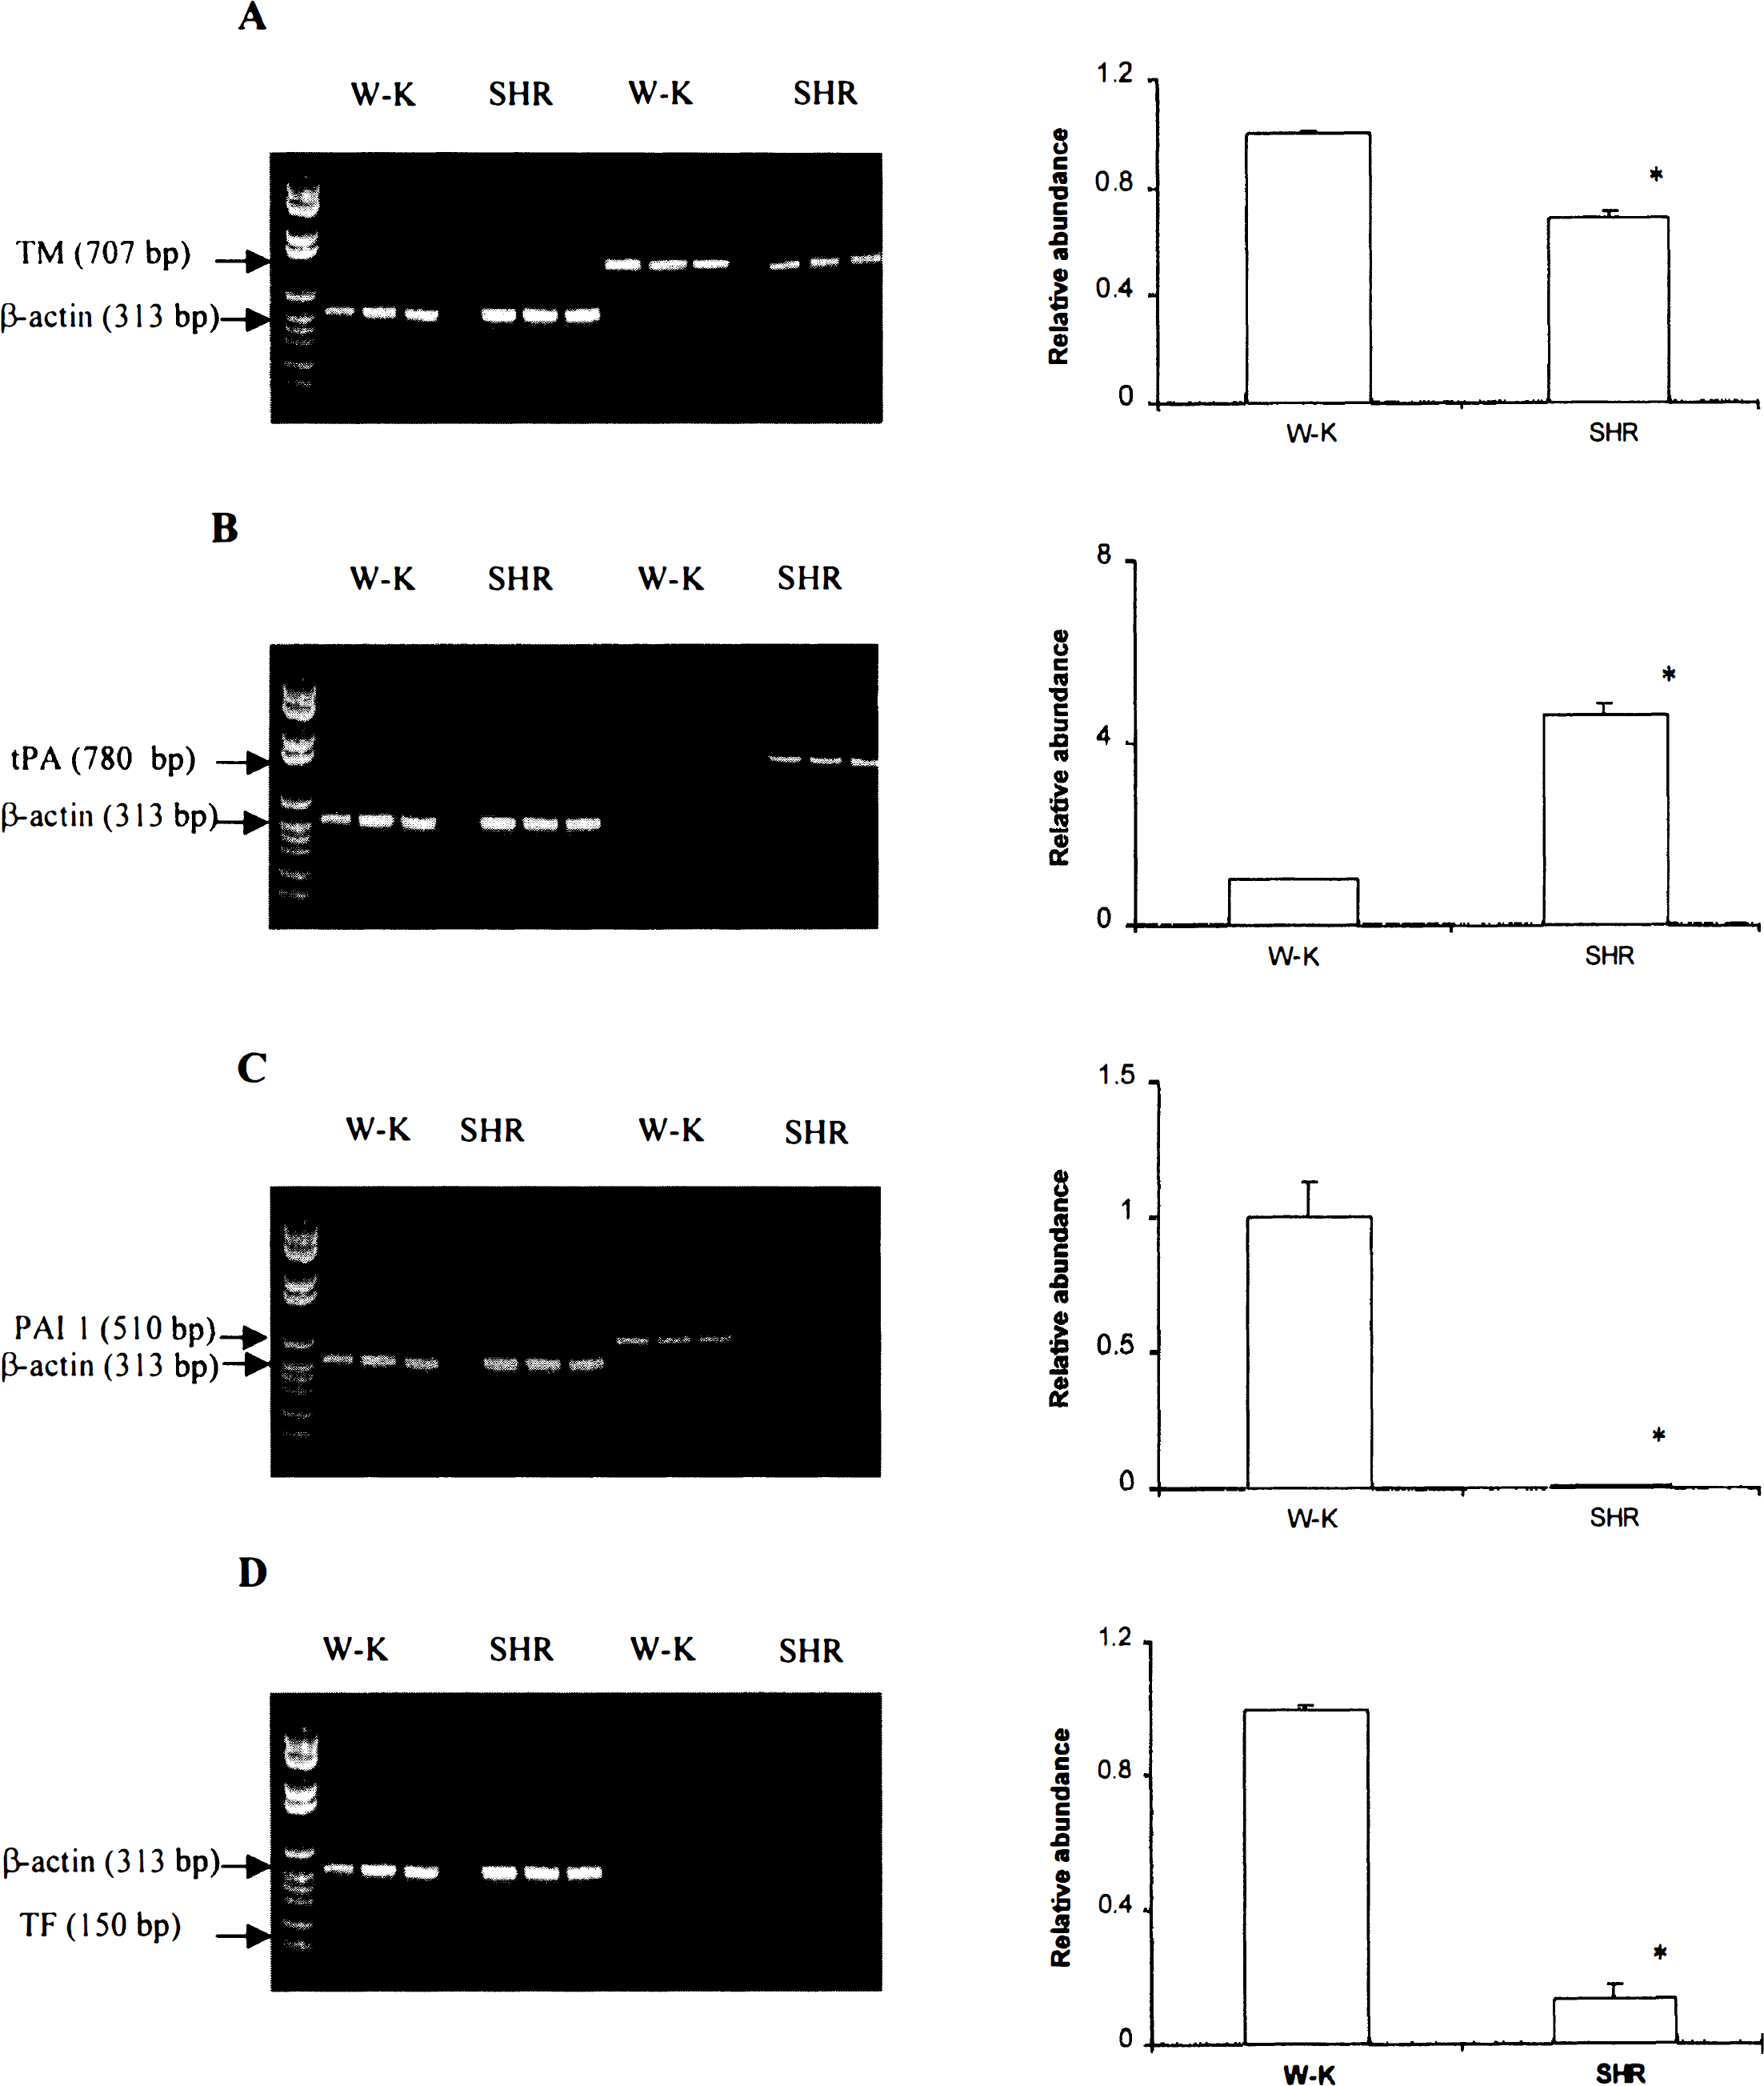
Comparison of hemostasis factor mRNA between SHR and W-K rats. Whole RNA was extracted from freshly isolated cortical brain capillaries of SHR and W-K rats, and RT-PCR was performed using the respective primers. β-actin primers were amplified as internal controls for nonchanging gene expression.
DISCUSSION
The present study has demonstrated that antithrombotic mechanisms in brain microcirculation, including protein C activation and tPA activity, are significantly reduced in the SHR. In contrast, there was a pronounced increase in PAI-1 antigen in brain capillaries in the SHR and a moderate increase in the activity of the procoagulant TF pathway. An imbalance between local cerebrovascular anticoagulant, fibrinolytic, and procoagulant pathways may exacerbate cerebrovascular fibrin deposition and microvascular obstructions during focal ischemic insult in the SHR, which predisposes to greater brain injury compared with genetically matched normotensive rats.
Previous studies indicated significant differences in the extent of ischemic brain injury, neuronal damage, and neurological deficit between the SHR and the genetically matched W-K normotensive rats (Brosnan et al., 1999; Carswell et al., 1999; Duverger and MacKenzie, 1988; Grabowski et al., 1988; Olsson et al., 1989; Prado et al., 1996; Tagami et al., 1999; Yao et al., 1997). Present findings suggest that fibrin formation may contribute to the extent of ischemic brain injury in the SHR, may be unusual in the W-K rats, and, therefore, may represent a strain difference. Previous studies in nonhuman primates indicated that fibrin formation and deposition relate to the extent of microvascular obstructions and ischemic parenchymal injury (Okada et al., 1994). Cerebrovascular fibrin deposition also correlated with ischemic brain injury in tPA-deficient mice (Tabrizi et al., 1999). In the SHR, fibrin deposits were found in brain capillaries, venules and arterioles, as well as in brain parenchyma around some vessels in ischemic lesioned hemisphere. Fibrin immunostaining in SHR brains was restricted to the areas of parenchymal brain injury. In contrast, fibrin was barely detectable in normotensive W-K rats that developed much smaller infarctions with the present occlusion technique. Enhanced formation of endogenous fibrin during cerebral ischemia in SHR fits well with previous observations that showed that spontaneous dissolution of fibrin clots injected into cerebral microcirculation was reduced in the SHR compared with the W-K rats (Kimata et al., 1991).
A leakage of fibrinogen into brain parenchyma around some microvessels suggests a breakdown of the blood–brain barrier during reperfusion (Okada et al., 1994; Tabrizi et al., 1999). Faulty induction of blood–brain barrier functions by astrocytes in the SHR may favor disruption of the blood-brain barrier and widespread cerebral lesions in the SHR, because the formation of brain endothelial tight junctions in the SHR is not as good as in normotensive rats (Yamagata et al., 1997). In addition, genetically altered astrocytes in the SHR may produce enormous quantities of lactic acid when cerebral ischemia develops (Yamagata et al., 1997). This, in turn, may exacerbate brain edema and hypoperfusion during MCAO in the SHR. Our results indicate that CBF decreases during MCAO by 55% in the SHR in comparison with normotensive rats. This important reduction in CBF could exacerbate massive intravascular coagulation (Hossmann and Hossmann, 1977; Kilic et al., 1999) as a consequence of complement activation (Bottiger et al., 1995) and the absence of significant brain antithrombotic mechanisms and enhanced procoagulation pathway in cerebral microvessels (Zlokovic et al., 1995a) as well. The formation of platelet plug or leukocyte-endothelial interactions (Palabrica et al., 1992) may favor fibrin deposition in ischemic brain and impair significantly microcirculatory perfusion in acute stroke in the SHR even during early phases of MCAO (Dawson et al., 1996). In fact, a significant contribution of leukocyte activation and platelet activation to microvascular occlusion formation could not take place without coincident fibrin deposition (del Zoppo et al., 1991). However, it is also true that fibrin deposition may occur independent of the other two cellular activations (Okada et al., 1994).
During blood recirculation, CBF values in the SHR and normotensive rats were comparable except at the onset of reperfusion when CBF was elevated above control values in the SHR. These relatively higher CBF reperfusion values in the SHR could be related to higher cerebral perfusion pressure in the SHR caused by hypertension. It has been reported that a transient elevation of blood pressure in acute stroke is not associated with an increase in morbidity or mortality (Rordorf et al., 1997). In the present model, a transient CBF increase in the SHR did not produce petechial hemorrhages as shown by histological inspection of brain tissue. The reperfusion injury and oxygen radical generation may significantly damage the neurons in SHR (Tagami et al., 1999). However, it has been demonstrated that reperfusion injury is not seen in the SHR when hypoperfusion during the MCAO was profound (Aronowski et al., 1997). In addition, the CBF reactivity in the SHR is lost in the permanent prothrombotic MCAO model because the thrombotic process is superimposed on cerebral ischemia (Prado et al., 1996). Pronounced prothrombotic changes in different hemostasis factors in the SHR showed little interanimal variability (Fig. 5), which correlated well with almost no interanimal variability in CBF reduction during the occlusion phase in the SHR when the thrombotic process was initiated. Thus, critically low CBF during MCAO in SHR could be of major importance for parenchymal injury.
Impaired protein C activation in brain capillaries in the SHR may favor development of brain thrombosis during ischemia. On endothelial cells in cerebral microcirculation (Tran et al., 1996; Wang et al., 1997b, 1998), TM-bound thrombin converts zymogen protein C to activated protein C, a serine protease that, with its nonenzymatic cofactor, protein S, inactivates coagulation factors V, Va, and VIIIa by highly specific proteolysis, which yields inactive (i) factors Vi and VIIIi (Griffin, 1995). Low levels of activated protein C in brain microcirculation may fail to inactivate factors V, Va, and VIIIa during an ischemic event in the SHR, thereby predisposing to massive intravascular coagulation. Plasma protein C is regarded as an inverse factor for ischemic stroke (Folsom et al., 1999), and low plasma protein C levels and/or lower brain-specific protein C activation were related to poor neurologic outcome after stroke and/or during carotid occlusion in humans (Macko et al., 1996, 1999; Martinez et al., 1993).
Suppressed fibrinolytic tPA activity in the SHR and other rodent models for stroke, including diabetes, smoking, and tPA deficiency, correlate with reduced CBF, larger brain infarcts (Kittaka et al., 1996; Wang et al., 1997a), and significant microvascular deposition of fibrin-rich thrombi (Tabrizi et al., 1999). In contrast to other stroke models in which the brain capillary pool of free tPA antigen is absent (Kittaka et al., 1996; Tabrizi et al., 1999; Wang et al., 1997a), although the PAI-1 antigen remains unchanged (Wang et al., 1997a), in the SHR, a remarkable increase in the PAI-1 antigen in brain capillaries seems to outweigh a modest increase in the tPA antigen and is, therefore, primarily responsible for significant reduction in tPA activity. The present study also demonstrated a moderate increase in procoagulant TF microvascular activity in the SHR. TF is normally associated with the abluminal side of brain microvessels (del Zoppo et al., 1992) and is a key factor for initiation of the coagulation cascade in brain (Zlokovic, 1997). The experiments with anti-TF antibodies suggest that TF was responsible for intravascular fibrin formation, which was, in turn, partially responsible for occlusion (Okada et al., 1994; Thomas et al., 1994). Blockade of TF, however, did not eliminate extravascular fibrin formation (Okada et al., 1994). It is conceivable that enhanced TF microvascular activity may contribute to fibrin formation after an ischemic insult in SHR.
Little is known about cellular events that regulate cerebrovascular hemostasis in the SHR. In an attempt to determine whether changes in the activity of hemostasis factors in the SHR are regulated at the transcriptional level, we performed semiquantitative RT-PCR analysis of brain capillary mRNA for hemostasis factors relative to β-actin mRNA. Except for tPA where changes at the transcriptional and protein level correlated well, there was either poor correlation between the mRNA and protein levels or activity for other hemostasis factors, or changes were in the opposite direction, which suggests independent regulations of the protein and mRNA, as shown for many proteins (Hengts and Reed, 1996), or possibly the inhibitory action of the protein at the transcriptional level. For example, low activated protein C or TM activity in brain capillaries (Wang et al., 1997b) was accompanied by relatively modest downregulation of brain endothelial TM mRNA. The mRNA for PAI-1 was barely detectable in the presence of significantly elevated PAI-1 antigen, and the changes in the TF mRNA and activity were in the opposite direction. Whether a decrease in polyribosomes and changes in protein synthesis and calcium homeostasis during focal ischemia in the SHR (Watanabe et al., 1998) could also be implicated in brain hemostasis imbalance is not known. The importance of genetic influences in SHR sensitivity to ischemic brain injury has been reported (Carswell et al., 1999), and it is possible that genetic factors could be involved in the regulation of brain thrombosis in the SHR, thus increasing their susceptibility to focal cerebral ischemia.
Footnotes
Acknowledgments
The authors thank Dr. M. Fisher for critically reading the manuscript and Ms. Gabriela Gutierrez for her help with the preparation of the manuscript.