
Abstract
Protein kinase C (PKC) isozymes have been known to mediate a variety of complex and diverse cellular functions. δPKC has been implicated in mediating apoptosis. Using two models of cerebral ischemia, cardiac arrest in rats and oxygen glucose deprivation (OGD) in organotypic hippocampal slices, we tested whether an ischemic insult promoted δPKC cleavage during the reperfusion and whether the upstream pathway involved release of cytochrome c and caspase 3 cleavage. We showed that cardiac arrest/OGD significantly enhanced δPKC translocation and increased its cleavage at 3 h of reperfusion. Since δPKC is one of the substrates for caspase 3, we next determined caspase 3 activation after cardiac arrest and OGD. The maximum decrease in levels of procaspase 3 was observed at 3 h of reperfusion after cardiac arrest and OGD. We also determined cytochrome c release, since it is upstream of caspase 3 activation. Cytochrome c in cytosol increased at 1 h of reperfusion after cardiac arrest/OGD. Inhibition of either δPKC/caspase 3 during OGD and early reperfusion resulted in neuroprotection in CA1 region of hippocampus. Our results support the deleterious role of δPKC in reperfusion injury. We propose that early cytochrome c release and caspase 3 activation promote δPKC translocation/cleavage.
Introduction
The mechanisms of cell death after brain ischemia are complex. It has been postulated that delayed cell death after brain ischemia may result from two different mechanisms: apoptosis and/or necrosis (Martin et al, 1998). However, in both processes mitochondrial dysfunction appears to play a central role (Fiskum et al, 1999; Friberg and Wieloch, 2002). Generation of reactive oxygen species and release of cytochrome c, and their consequent effects on mitochondrial dysfunction, are considered key factors for the induction of cerebral ischemic injury (Fiskum et al, 1999). Earlier we showed that postischemic hyperoxidation of respiratory chain components may result from loss of electron carriers, such as cytochrome c and NADH, from mitochondria after ischemia (Perez-Pinzon et al, 1997a, 1998). However, the precise mechanisms that contribute to mitochondrial dysfunctions after brain ischemia/reperfusion have not been fully elucidated.
Recently, a novel aberrant signal transduction pathway has been suggested to play a role in apoptosis after mitochondrial dysfunction (Basu, 2003). Anantharam et al (2002) showed that exposure of dopaminergic cells to methylcyclopentadienyl manganese tricarbonyl (MMT), a pesticide believed to cause Parkinson's disease, induced apoptosis, in a pathway that involved cytochrome c release from mitochondria via caspase 3-dependent proteolytic cleavage of one of the protein kinase c isozymes (δPKC). In fact, derangement in PKC signal transduction has been postulated to occur in the pathophysiology of neurologic diseases, including cerebral ischemia, Alzheimer's disease, Parkinson's disease, Huntington's disease, and amyotrophic lateral sclerosis among others (Battaini, 2001). However, the specific PKC isozyme(s) involved in these pathologic conditions remain undefined. Based on findings that δPKC is cleaved during apoptosis of dopaminergic cells (Anantharam et al, 2002; Kanthasamy et al, 2003) and that δPKC is proapoptotic (Basu, 2003; Brodie and Blumberg, 2003), it can be surmised that this PKC isozyme may be a leading pathological mediator in these neurologic disorders. This contention is supported by findings that δPKC plays a central role in the regulation of cell apoptosis in response to a large and diverse array of apoptotic stimuli (Brodie and Blumberg, 2003). For example, during the initiation of apoptosis, δPKC has been shown to translocate from cytosol to a variety of cellular organelles including mitochondria (Mochly-Rosen, 1995; Sawai et al, 1997; Chen et al, 1999; Dal Pra et al, 1999; Li et al, 1999; Dempsey et al, 2000; Majumder et al, 2000). Also, we recently demonstrated in an in vitro study that increased δPKC translocation correlated with neuronal death in CA1 region of hippocampus, implying a definite role of δPKC in neuronal death (Bright et al, 2003, 2004).
In general, activation of δPKC occurs in three ways: (1) translocation to subcellular sites, (2) tyrosine phosphorylation, and (3) by proteolytic cleavage. According to Kanthasamy et al (2003), δPKC activation by proteolytic cleavage plays a key role in promoting apoptotic cell death in various cell types, including neuronal cells. Thus, in the present study, we aimed to define whether an ischemic insult promoted δPKC cleavage during the reperfusion phase and whether the upstream pathway involved release of cytochrome c and caspase 3 cleavage. Experiments were conducted using two well-established models of global cerebral ischemia: (1) cardiac arrest in rat and (2) oxygen glucose deprivation (OGD) in rat organotypic hippocampal slice culture.
Materials and methods
Protocols for cardiac arrest/resuscitation and preparation of organotypic slice cultures were approved by the Animal Care and Use Committee of the University of Miami.
Cardiac Arrest
The asphyxial cardiac arrest model was described previously (Katz et al, 1995). Sprague—Dawley rats weighing 250 to 350 g were anesthetized with 4% isofluorane and a 30 : 70 mixture of oxygen and nitrous oxide followed by endotracheal intubation. Isoflurane was subsequently lowered to 1.5% to 2% for endovascular access. The femoral vein was cannulated using a 20 gauge dual-lumen polyethylene catheter, which was advanced 8 cm toward the heart. The femoral artery was cannulated using a single-lumen (PE-50) catheter for continuous blood pressure monitoring and blood gas analysis.
Electrocardiographic leads were attached to the limbs. Vecuronium (2 mg/kg) was injected intravenously followed by mechanical ventilation (60 breaths/min) and isoflurane concentration was reduced to 0.5%. Physiologic variables, including, pCO2, pO2, pH, HCO3− and arterial base excess, were maintained within normal limits by adjusting the ventilator volume settings. Mean arterial blood pressure (MAP) and electrocardiogram (ECG) were continuously monitored and the head and body temperatures were maintained at 36.5°C to 37°C using heating lamps. To initiate asphyxial cardiac arrest, apnea was induced by disconnecting the ventilator from the endotracheal tube. Eight minutes after asphyxia, resuscitation was initiated by administering a bolus injection of epinephrine (0.005 mg/kg, intravenously) and sodium bicarbonate (1 meq/kg, intravenously) followed by mechanical ventilation with 100% oxygen at a rate of 80 breaths/minute and manual chest compressions at a rate of 200/min until MAP reached 60 mm Hg and was maintained by a spontaneously beating heart for more than 10 secs. After 10 mins of restoration of spontaneous circulation (ROSC), the ventilator rate was decreased to 60 breaths/min and the oxygen lowered to 30% in a mixture with N2O. Arterial blood gases were then measured. If any corrections in acid—base status were necessary, sodium bicarbonate was administered and/or the ventilator settings were adjusted. Once the animal was hemodynamically stable and spontaneously breathing, usually by 10 to 15 mins after ROSC, the catheters were removed and the animal extubated, and 100% O2 was delivered via face mask. Head and body temperatures were maintained at 37°C using heating lamps for 1 h. Rats were then placed in a humidified incubator that maintained an ambient temperature of 29°C. Sham-operated animals underwent surgical procedure similar to CA animals except induction of cardiac arrest. The resuscitation fluids were not used; however, sham animals received isoflurane exactly as experimentals. Cardiac arrest animals with different reperfusion time points were compared with sham-operated animals with respective reperfusion time points.
Histopathology
Histopathologic assessment was performed in rats subjected to 8 mins of asphyxial cardiac arrest. At the end of 7 days of reperfusion, rats were anesthetized with isoflurane and perfused with FAM (a mixture of 40% formaldehyde, glacial acetic acid, and methanol, 1 : 1 : 8 by volume) for 19 mins after a 1 min initial perfusion with physiologic saline. The perfusate was delivered into the root of the ascending aorta at a constant pressure of 110–120 mm Hg as previously described (Perez-Pinzon et al, 1997b). The head was removed and immersed in FAM at 4°C for 1 day. The brains were then removed from the skull, and coronal brain blocks were embedded in paraffin; coronal sections of 10-μm thicknesses were stained with hematoxylin and eosin. Stained sections were visualized at × 40 magnification with a Nikon Microphot-SA microscope equipped with a Sony 3 CCD camera interfaced to a MCID image analyzer (Imaging Research, St Catherines, Ontario, Canada). An investigator masked to the experimental conditions in both the sham and cardiac arrest groups counted ischemic neurons, 18 fields per sections, along the medial to lateral extent of the CA1 region of the hippocampus 3.8 mm posterior to bregma. The ischemic neuronal changes consisted of severe cellular shrinkage, cytoplasmic eosinophilia, pyknotic triangular-shaped nucleus with dark basophilic staining, and eosinophilic staining nucleolus.
Immunohistochemistry
An immunohistochemical procedure was performed as described previously (Olive et al, 1997; Olive and Hodge, 2000). Briefly, rats were perfused transcardially with 4% paraformaldehyde in 0.1 mol/L phosphate-buffered saline (PBS, pH 7.4), coronal sections (hippocampus at the level of 3.8 mm from posterior to bregma) were cut at 30 μm on a cryostat, and staining was performed on free-floating sections in PBS+0.8% Triton X-100 (PBST). After preblocking with 10% goat serum, sections were incubated for 24 h at 4°C with rabbit polyclonal antisera to δPKC (1 : 500) (Santa Cruz Biotechnology, CA, USA) in combination with mouse monoclonal antibody NeuN (1 : 500) (Chemicon, CA, USA). After overnight washing with PBST, the sections were then incubated with the fluorescent secondary antibodies, fluorescein-labeled anti-rabbit (Santa Cruz Biotechnology, CA, USA) and rhodamine-labeled anti-mouse (Santa Cruz Biotechnology, CA, USA), for 24 h at 4°C temperature. The sections were rinsed in PBST, mounted onto microscope slides, and coverslipped using Prolong Antifade kit (Molecular Probes, Inc, OR, USA). Sections were viewed on a Carl Zeiss Laser Scanning Microscope 510. The images of the sections were analyzed using (LSM 5 image browser).
Preparation of Organotypic Slice Cultures
Neonatal (9 to 11 days old) Sprague—Dawley rats were anesthetized by intraperitoneal injection of ketamine (1.0 mg/pup). Animals were decapitated and the brains quickly removed. Organotypic hippocampal slice cultures were prepared as described previously (Xu et al, 2002; Raval et al, 2003). In brief, transverse slices (400 μm) were dissected from the hippocampi and placed in Gey's Balanced Salt Solution (Sigma, St Louis, MO, USA) supplemented with 6.5 mg/mL glucose at 4°C. After 1 h, 2 slices were placed onto one 30 mm diameter membrane insert (Millicell-CM, Millipore, Bedford, MA, USA) and inserts were transferred to 6-well culture plates with 1 mL of culture medium per well. Culture medium consisted of 50% minimum essential medium, 25% Hank's balanced salt solution, 25% heat-inactivated horse serum (all Sigma, St Louis, MO, USA) supplemented with 6.5 mg/mL glucose and 1 mmol/L glutamine. Slice cultures were incubated (equilibrated at 36°C, 5% CO2, humidity 100%) for 14 to 15 days before experiments were performed.
Induction of Ischemia (Oxygen/Glucose Deprivation)
Our ischemia protocols have been described in previous studies (Xu et al, 2002; Raval et al, 2003). For OGD, slices were washed three times with aglycemic Hank's balanced salt solution (AHBSS) (pH 7.4) of the following constitution: CaCl2·2H2O 1.26 mmol/l, KCl 5.37 mmol/L, KH2PO4 0.44 mmol/L, MgCl2 0.49 mmol/L, MgSO4·7H2O 0.41mmol/L, NaCl 136.9 mmol/L, NaHCO3 4.17 mmol/L, Na2HPO4·7H2O 0.34 mmol/L, sucrose 15 mmol/L (all Sigma, St Louis, MO, USA). The slices were then transferred into an airtight chamber that was equilibrated with 95% N2/5% CO2 gas (preheated to 37°C and water saturated) blown through the chamber for 5 mins (4 L/min) to achieve anoxic conditions. Then the chamber was sealed and remained incubated for 35 mins (for a total of 40 mins—ischemic insult). For sham OGD, slices were incubated for 40 mins in HBSS solution supplied with an equimolar concentration of glucose instead of sucrose. After OGD, slices were placed back in the incubator in plates containing the normal culture medium.
Inhibitor Treatment
The cell-permeable caspase 3-specific inhibitor DMQD-CHO (Calbiochem, La Jolla, CA, USA) or the δPKC isozyme-specific inhibitor δV1-1 was used. The δV1-1 peptide was synthesized at Stanford's Protein and Nucleic Acid Facility and conjugated to Tat (carrier peptide) via a cysteine—cysteine bond at their N termini, as previously described (Chen et al, 2001) to allow delivery into cells (Souroujon and Mochly-Rosen, 1998). Our previous study clearly showed efficacy of these peptides in the organotypic slice cultures (Raval et al, 2003). The organotypic hippocampal slices were superfused with inhibitor of either caspase 3 (50 μmol/L) or δPKC/Tat carrier (500 nmol/L) only during OGD or during OGD followed by 2/3 h of reperfusion. The slices were used to carry out quantification of cell death or frozen at end of 3 h of reperfusion at −80°C for Western blot analysis.
Assessment of Neuronal Cell Death
To determine the extent of neuronal damage after OGD and various inhibitor treatments, we used the propidium iodide (PI) method (Xu et al, 2002; Raval et al, 2003). Slices were incubated in culture medium supplemented with 2 μg/mL PI (Sigma, St Louis, MO, USA) for 1 h. Images were taken using an inverted fluorescence microscope (Olympus IX 50) equipped with a light intensifying SPOT CCD camera (Diagnostic Instruments Inc., Sterling Heights, MI, USA) and SPOT Advanced software. Images of the cultured slices were taken (1) as baseline before the ‘test’ ischemia procedure, (2) 24 h after the ‘test’ ischemic insult to assess ischemic damage, and (3) 24 h after NMDA treatment to assess maximum damage to neuronal cells. The hippocampal CA1 subfield was chosen as the region of interest, and quantification was performed using Scion Image software. The percentage of relative optical intensity (ROI) served as an index of neuronal cell death. Relative cell death was calculated from each ROI as follows: Relative% cell death=(Fexp−Fmin)/(Fmax−Fmin)100, where Fexp is the fluorescence of the test condition, Fmax is the maximum fluorescence (100 μmol/L NMDA treatment for 1 h), and Fmin is the background fluorescence (before OGD). In all groups, experiments (except Western blot analysis) were terminated by superfusing slices with an overdose of NMDA (100 μmol/L) 24 h after the end of the experiments to determine total number of neurons using the PI technique (Fmax above).
Cell Fractionation and Western Blot Analysis
Hippocampus of rats subjected to 8 mins of cardiac arrest was removed at 4 different reperfusion time points (30 mins, 1, 3, and 6 h), and was frozen in liquid nitrogen and stored at −80°C until the analysis. Western blot analysis was also performed on organotypic slices at 3 h following OGD and/or after various inhibitor treatments as described previously (Mackay and Mochly-Rosen, 2001; Raval et al, 2003). Hippocampal organotypic slices were frozen in liquid nitrogen and stored at −80°C until the analysis. At the time of Western blot analysis, the hippocampal organotypic slice cultures were separated from the supporting membrane. For one sample, 32 slices were pooled. Thus, n=1 for Western blot analysis represents 32 slices. Also, each slice was obtained from different pups. At the time of Western blot analysis, the hippocampus or pooled organotypic hippocampal slices were washed once with cold PBS. Ten percent homogenate was prepared in homogenizing buffer (4 mmol/L ATP, 100 mmol/L KCl, 10 mmol/L imidazole, 2 mmol/L EGTA, 1 mmol/L MgCl2, 20% glycerol, 0.05% Triton X-100, 17 μg/mL PMSF, 20 μg/mL soybean trypsin inhibitor, 25 μg/mL leupeptin, 25 μg/mL aprotinin) using an all glass homogenizer. The homogenate was then centrifuged at 4°C at 1,000g for 10 mins. The supernatant was carefully removed and recentrifuged at 16,000g for 15 mins to get rid of any contaminating pellet material. The resulting supernatant is the soluble/cytosolic fraction. The soluble/cytosolic fraction was analyzed for protein contents using the Bio-Rad protein assay kit, based on the method of Bradford (1976). The proteins were separated by 12% SDS-PAGE. Equal amounts of protein from each group were run on the same gel and analyzed at the same time. Protein was transferred to Immobilon-P (Millipore, MA, USA) membrane and incubated with the primary antibody anti-δPKC (1 : 800) (Calbiochem, La Jolla, CA, USA), anti-caspase 3 (1 : 500) (Santa Cruz, CA, USA), anti-β-actin (1 : 1,000) (Sigma, MO, USA), and anti-cytochrome c (1 : 800) (PharMingen, CA, USA) for the detection of δPKC, caspase 3, β-actin, and cytochrome c, respectively. Immunoreactivity was detected using enhanced chemiluminescence (ECL Western blotting detection kit, Amersham-Pharmacia Biotech, UK). Western images were digitized at 8-bit precision by means of a charge-coupled-device-based (CCD) camera (8-12 bit, Xillix Technologies Corp., Vancouver, Canada) equipped with a 55 mm Micro-Nikkor lens (Nikon, Japan). The camera was interfaced to an advanced image-analysis system (MCID Model M2, Imaging Research, Inc., St Catherines, Ont., Canada). The digitized immunoblots were subjected to densitometric analysis using MCID software.
Statistics
All data are expressed as mean±s.d. Statistical comparison of the data from more than two groups was performed using ANOVA test, followed by Bonferroni's post hoc test, while comparison of the data from two groups was performed using Student's t-test. A P-value of <0.05 was considered significant.
Results
Physiologic variables (pH, pCO2, and plasma glucose concentration) remained unchanged throughout the surgical procedure in cardiac arrest and sham group. As during resuscitation animals were mechanically ventilated with 100% oxygen, 10 mins after resuscitation pO2 was higher by 43% as compared with baseline (before cardiac arrest). These data are given in Table 1. An immediate bradycardia was observed when apnea was induced, followed by hypotension to 50 mmHg. Within approximately 3 to 4 mins, MAP decreased to 0 mm Hg and the heart rate was further decreased (Figure 1). On resuscitation, MAP returned to 60 mm Hg within 2 mins. The ECG pattern was restored to normal within the first 5 mins of ROSC.
Physiologic variables
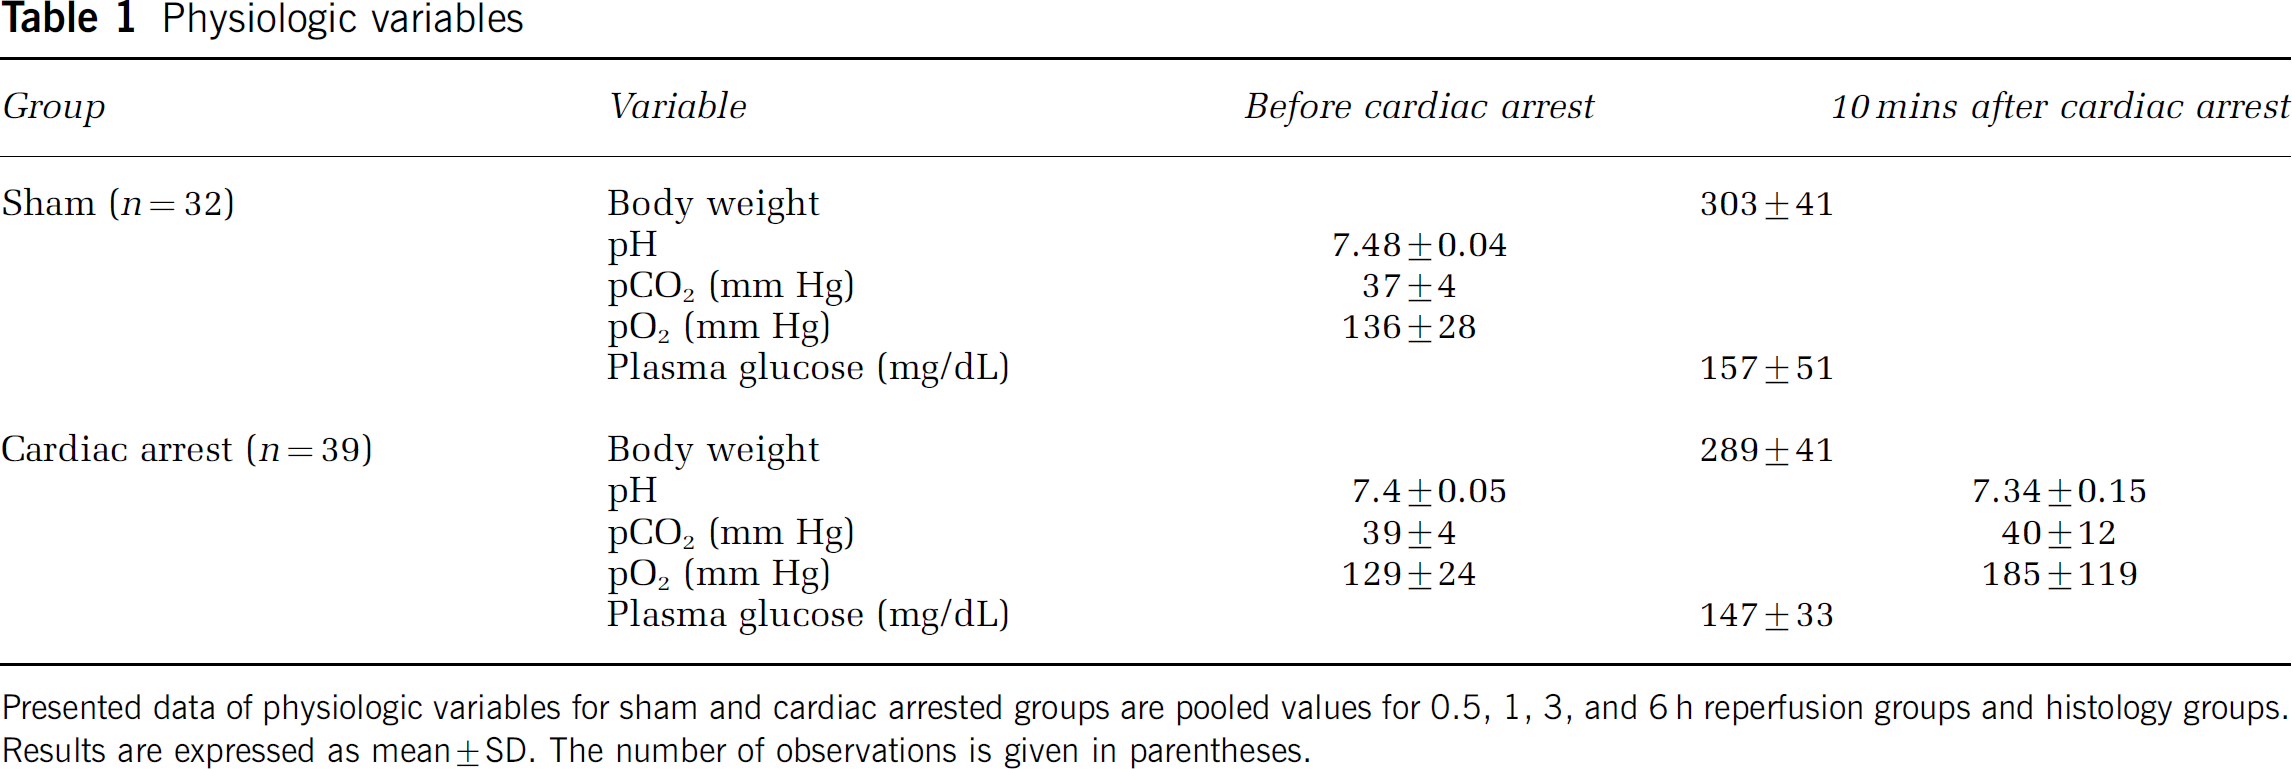
Presented data of physiologic variables for sham and cardiac arrested groups are pooled values for 0.5, 1, 3, and 6 h reperfusion groups and histology groups. Results are expressed as mean±SD. The number of observations is given in parentheses.
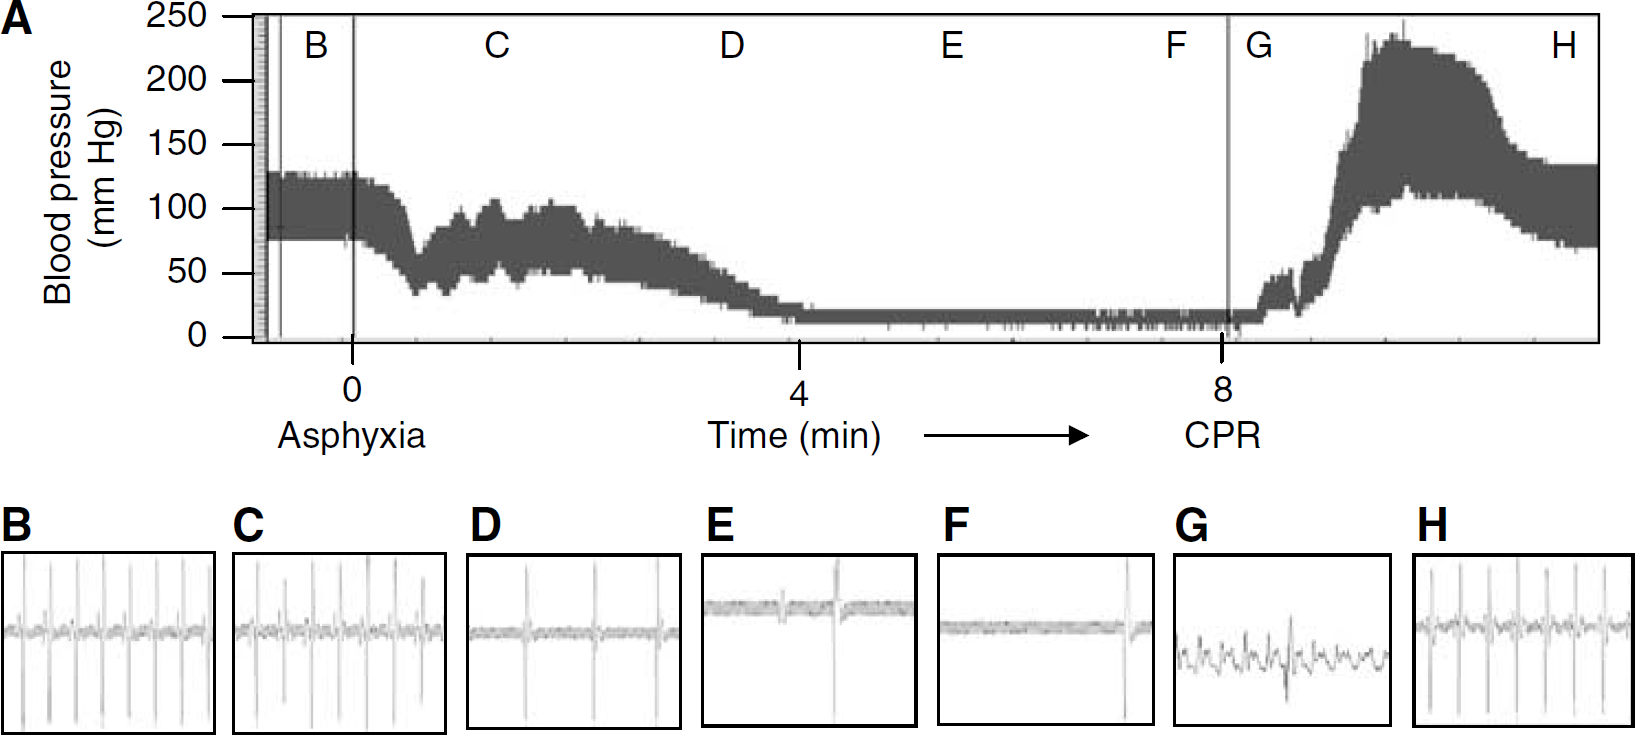
Representative blood pressure tracing (
Neuronal death in the CA1 region of the hippocampus was determined by histological assessment. Neurons exhibiting ischemic cell change were present throughout the forebrain and hindbrain. These changes consisted of: (1) eosinophlic cytoplasm, (2) dark staining triangular-shaped nucleus, and (3) eosinophilic-staining nucleolus (Figures 2A and 2B). The ischemic cell numbers in the CA1 hippocampal region at 7 days after sham-arrest and 8 mins cardiac arrest were 13±8 (n=5) and 308±76 (n=8), respectively (Figure 2C).
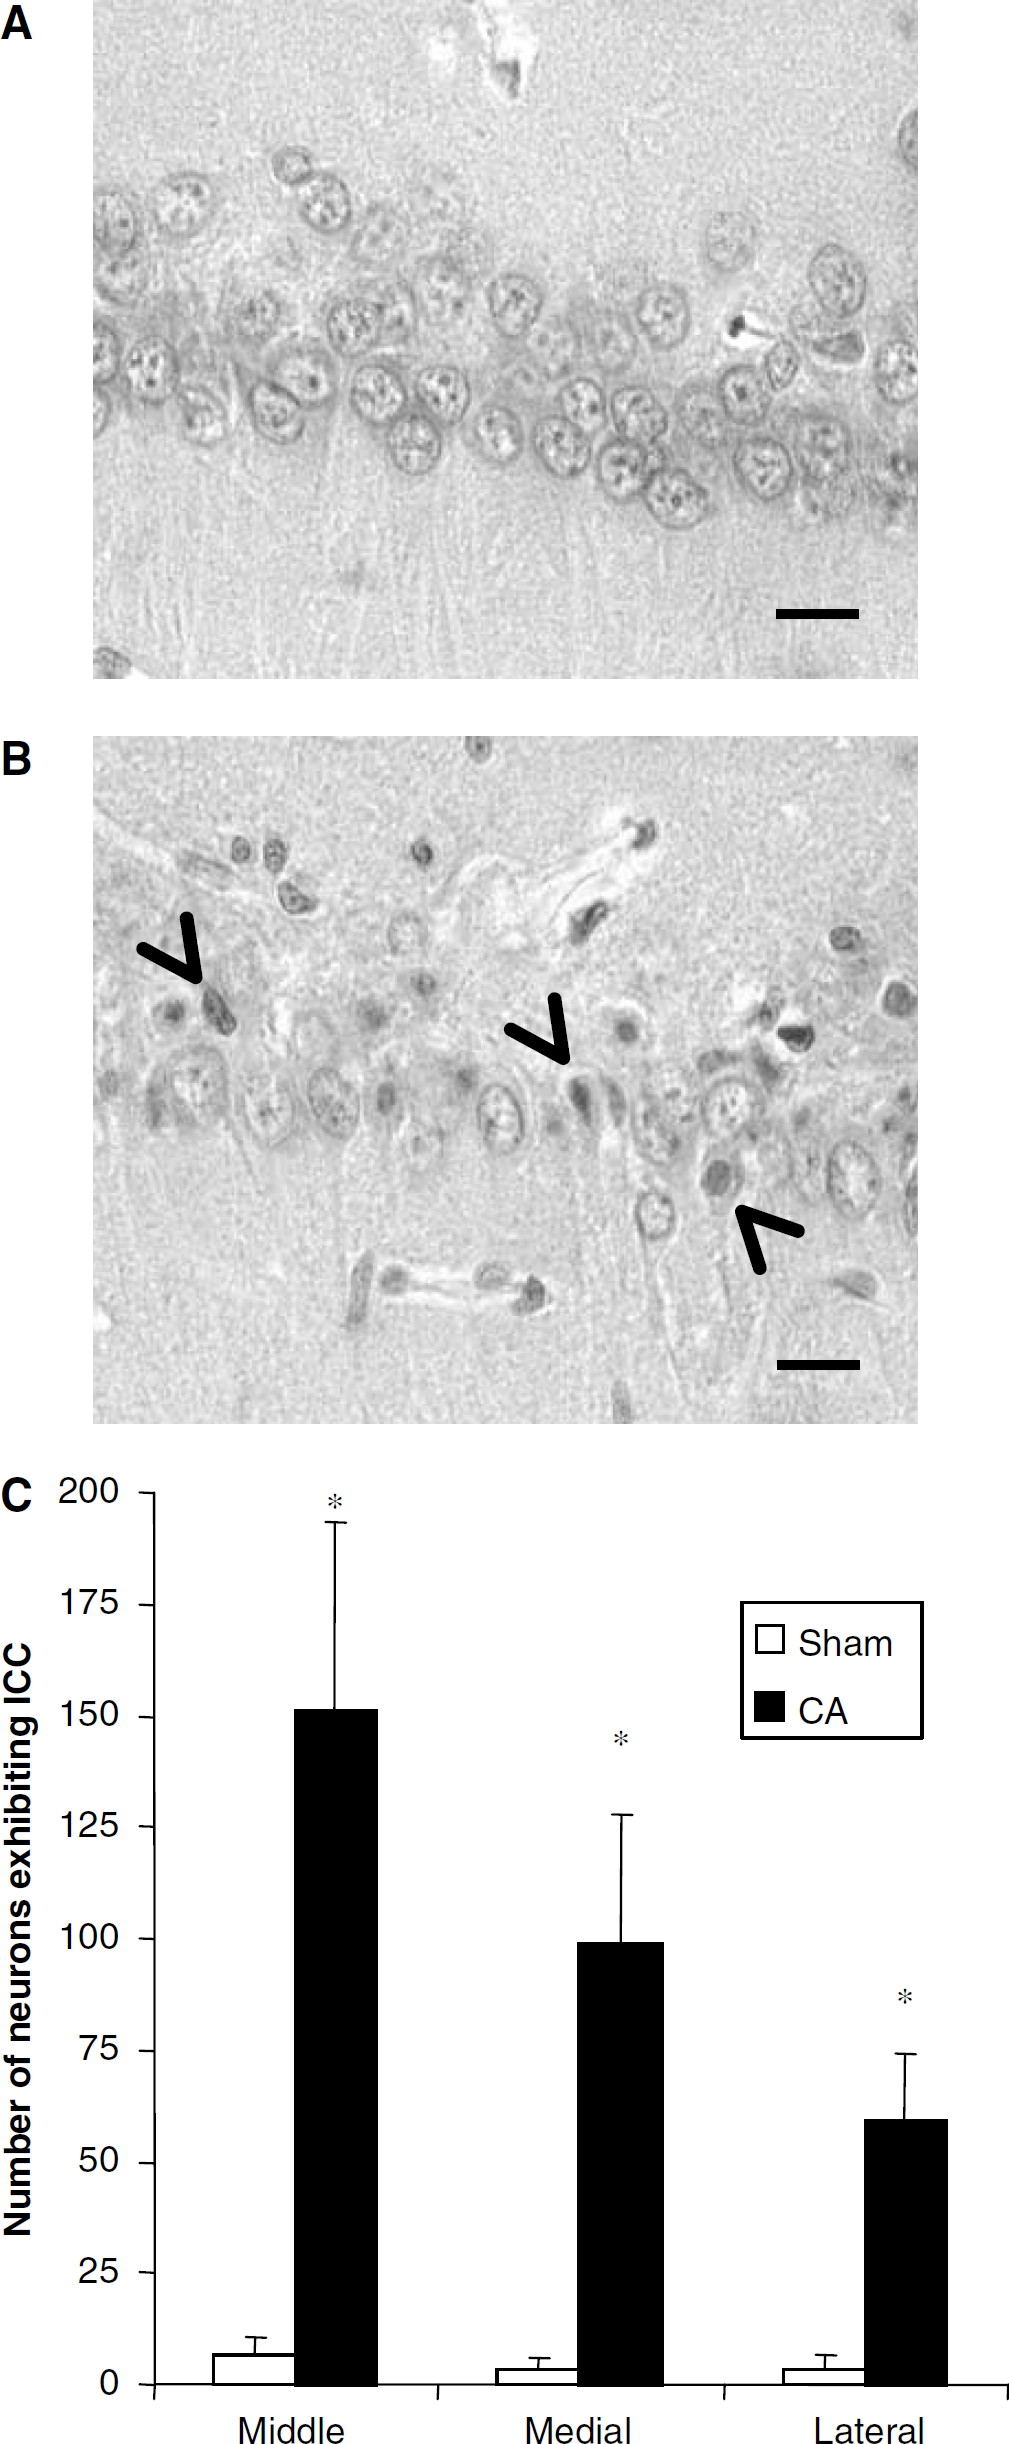
Histologic assessment in hippocampus 7 days after (
One of the main goals of the present study was to determine the translocation of δPKC in hippocampus during reperfusion after cardiac arrest. First, we confirmed the presence of δPKC in CA1 region of hippocampus by immunohistochemically colocalizing presence of δPKC in pyramidal neurons (Figure 3). The δPKC in soluble fraction was similar in both sham and the cardiac arrested groups up to 1 h of reperfusion. Thereafter, δPKC in the soluble fraction decreased by 30% (n=7) and 49% (P<0.05) (n=8) after 3 and 6 h of reperfusion after cardiac arrest, respectively when compared with the sham groups (3 h, n=7; 6 h, n=7) (Figure 4). These results agree well with our previous findings in hippocampal organotypic slice culture (Bright et al, 2003, 2004).
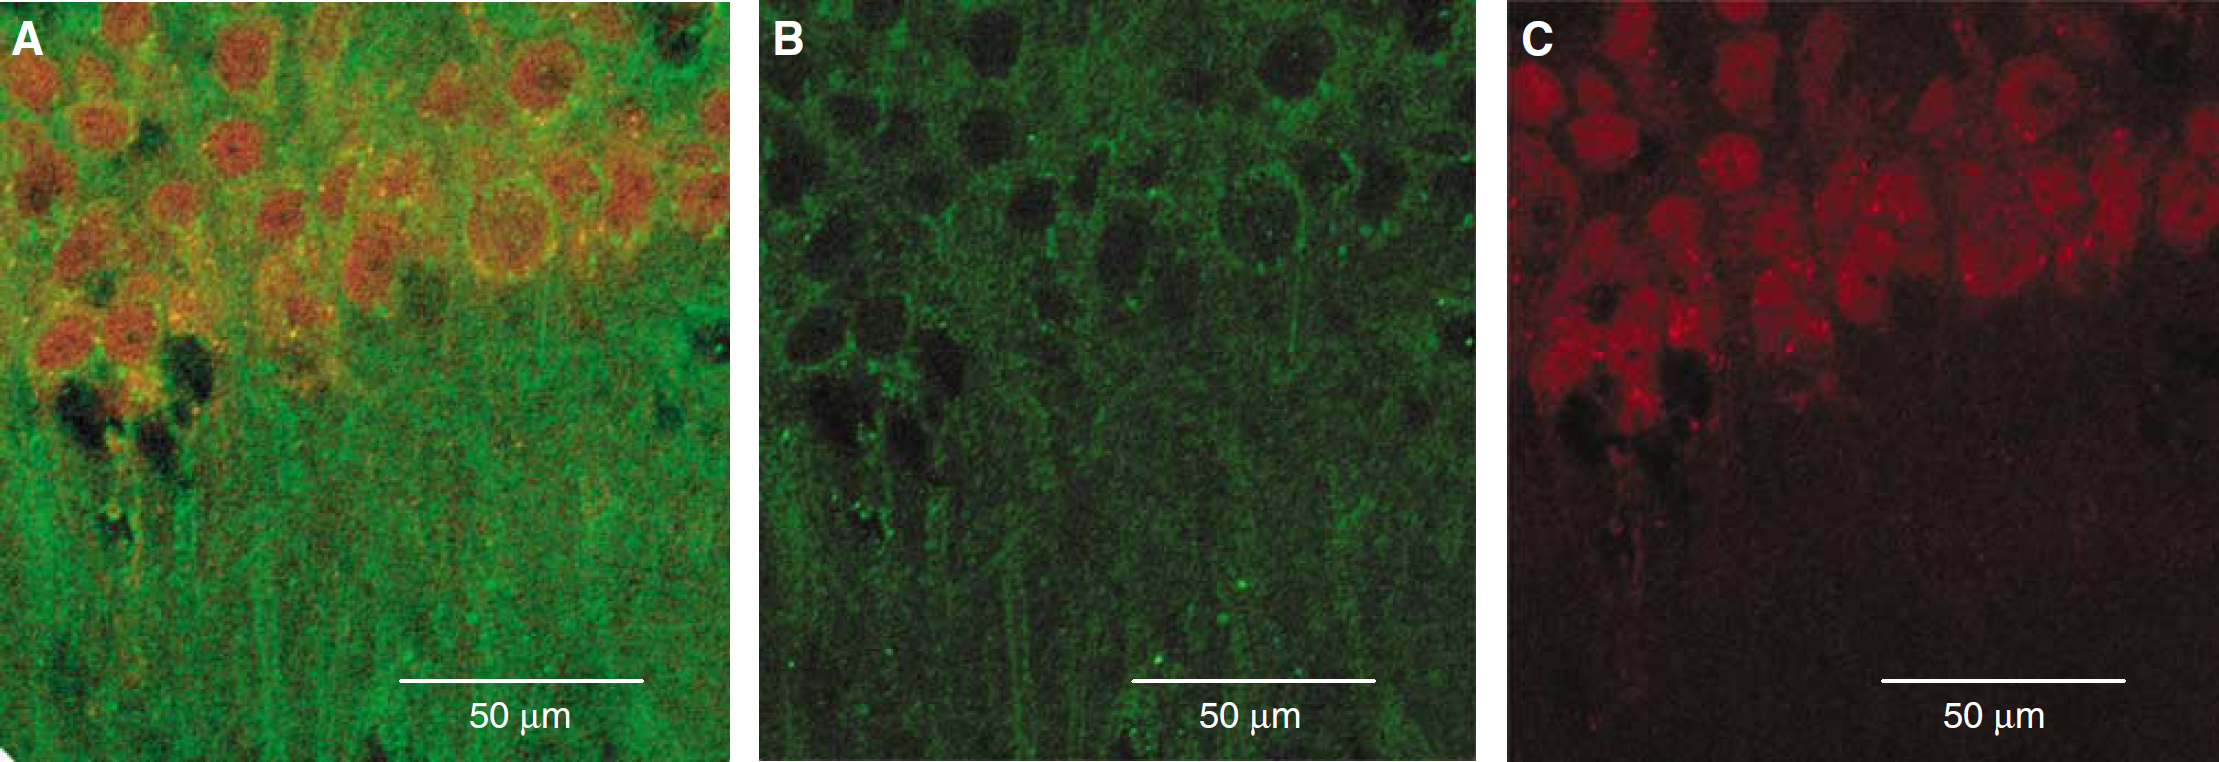
Confocal microscopic images of the hippocampal CA1 region depicting colocalization of immunoreactivities for neuronal marker NeuN (red) and δPKC (green). (
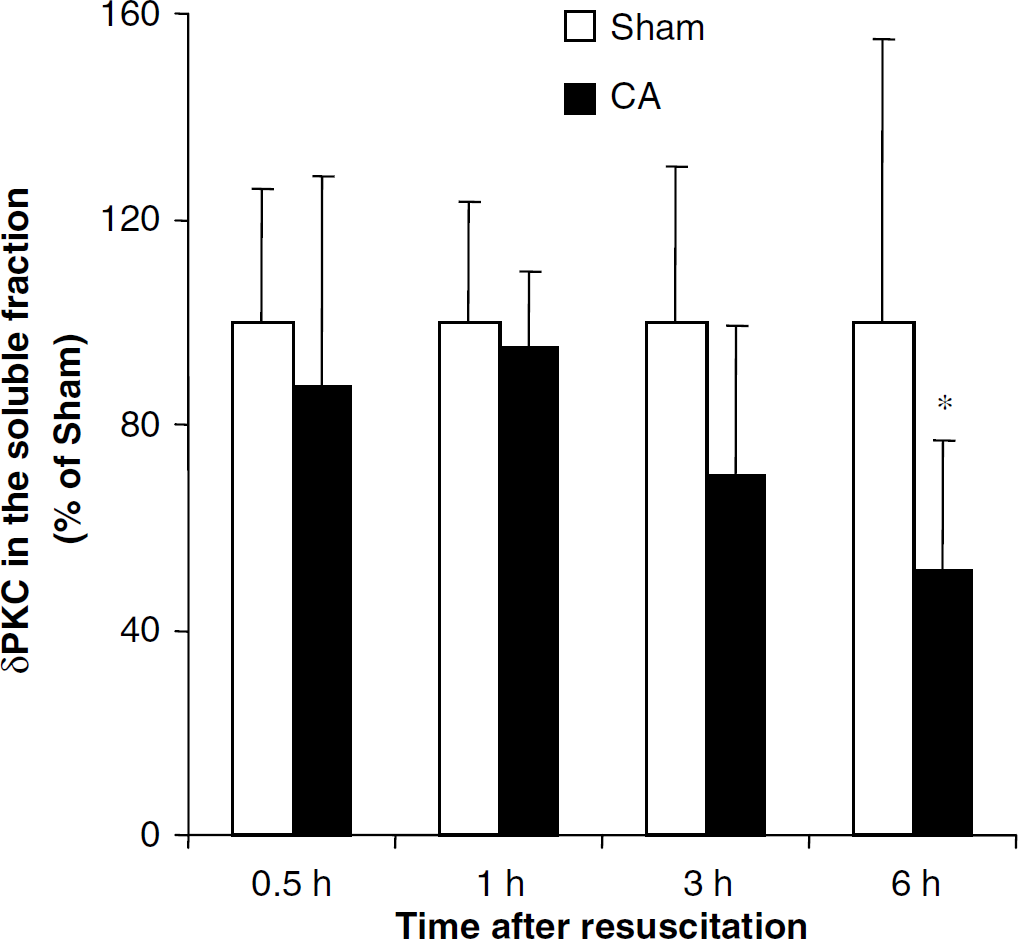
δPKC in soluble fraction of hippocampus during reperfusion following cardiac arrest. *P<0.05 as compared with the corresponding control.
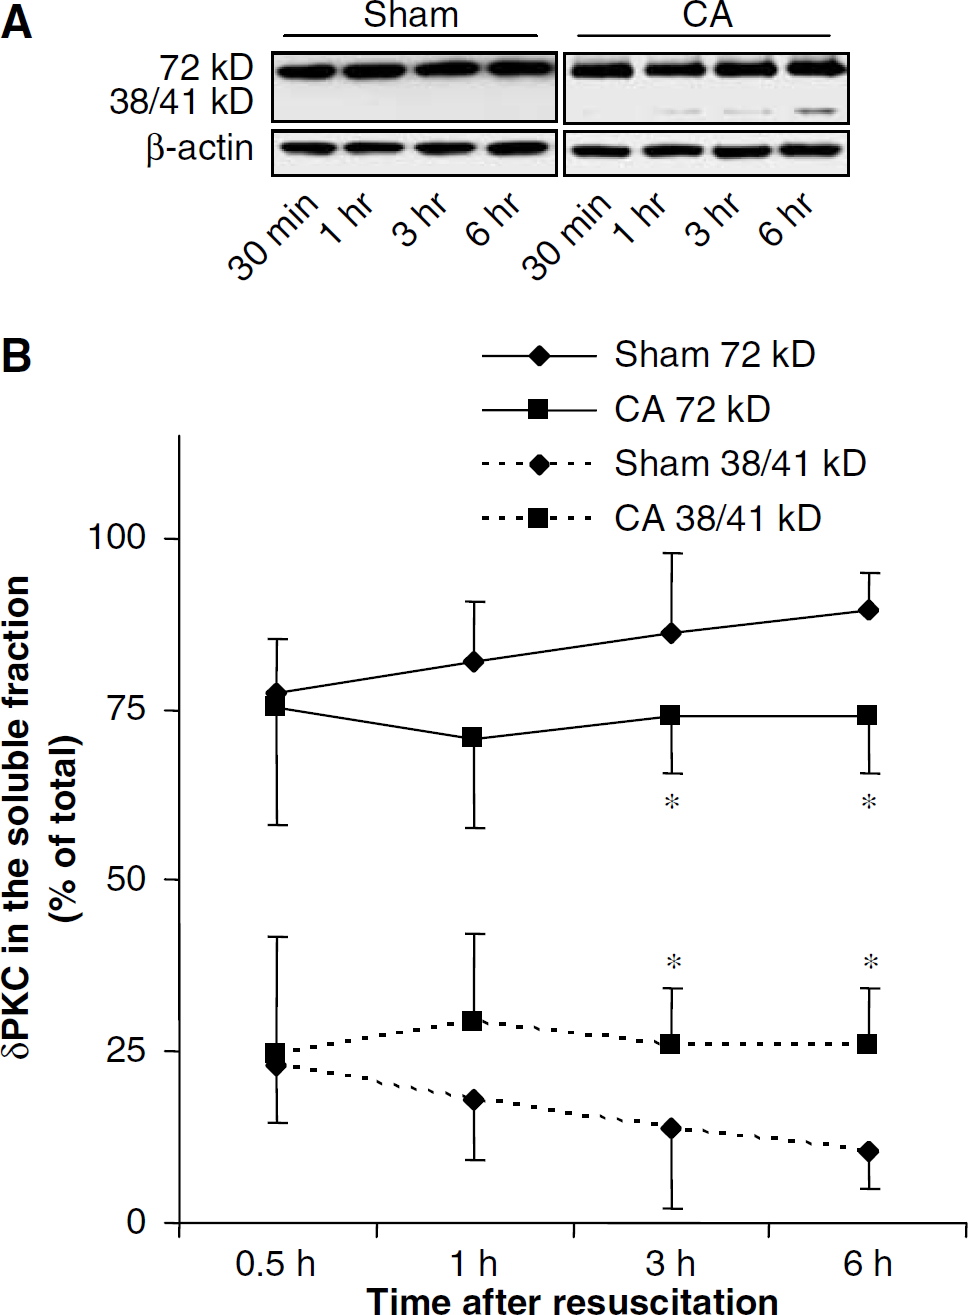
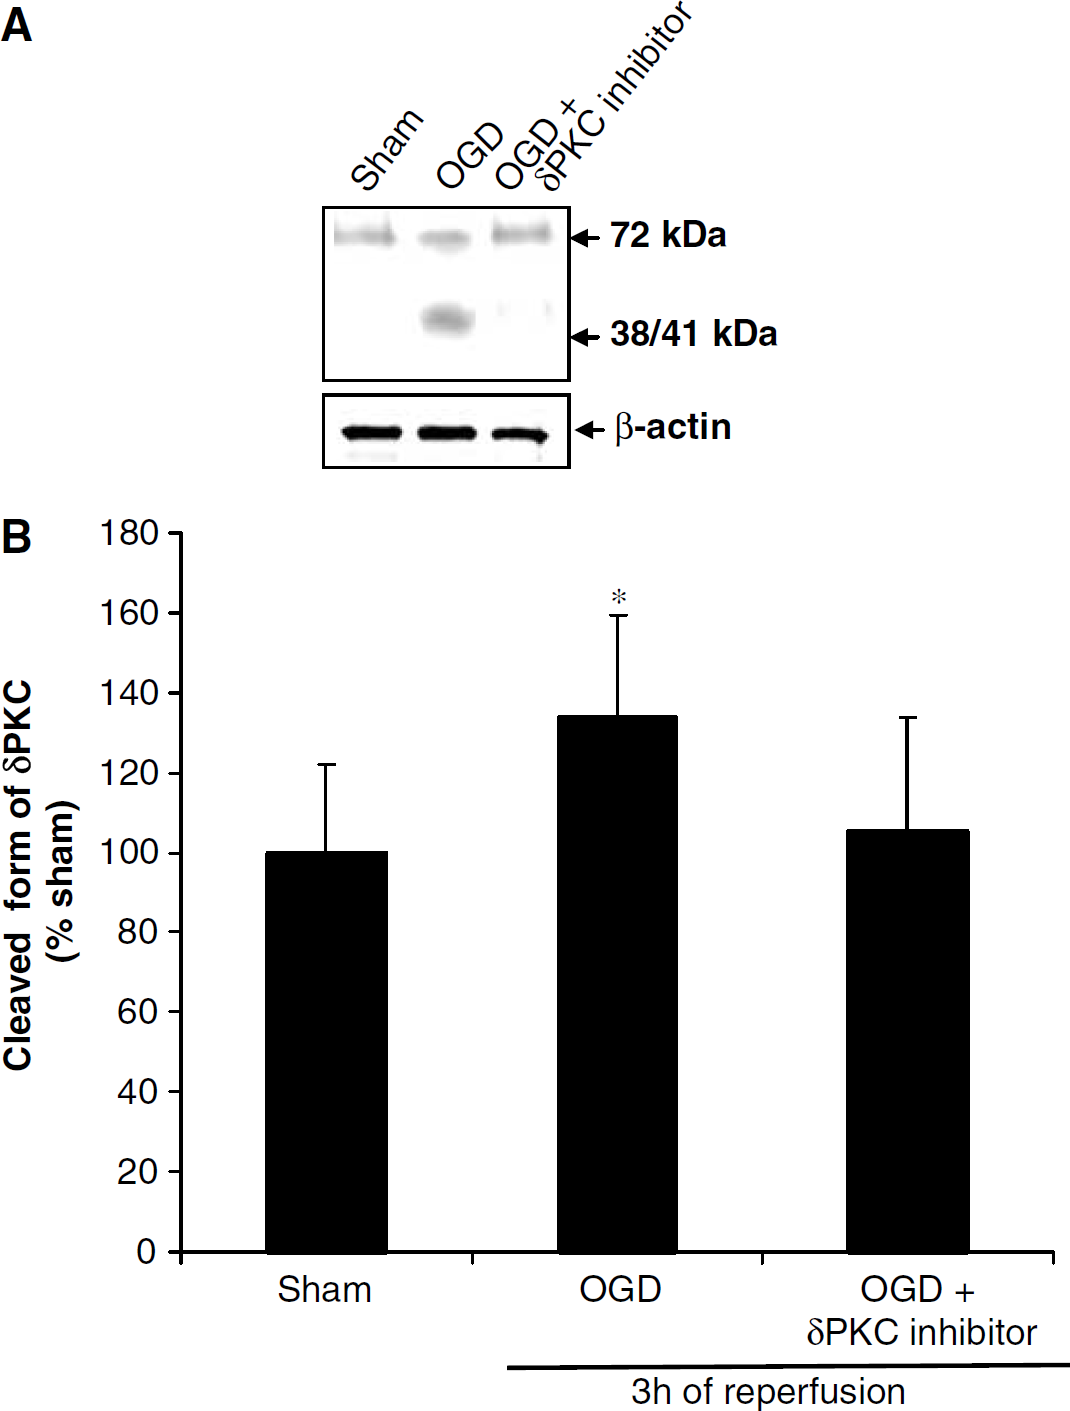
To test the hypothesis that the decrease in δPKC in soluble fraction was because of cleavage of δPKC, we determined the δPKC isozyme cleavage during reperfusion after cardiac arrest. In sham-operated animals belonging to 30 mins, 1, 3, and 6 h reperfusion periods, 23% (n=8), 18% (n=8), 14% (n=8), and 11% (n=7) of δPKC was in cleaved form, respectively. At 30 and 60 mins of reperfusion after cardiac arrest, the amount of δPKC in cleaved (38/41 kDa) and uncleaved (72 kDa) forms were similar in cardiac arrest (30 mins, n=8; 1 h, n=8) and corresponding sham groups (30 mins, n=8; 1 h, n=8). However, after 3 and 6 h of reperfusion following cardiac arrest, the distribution of the cleaved form of δPKC was significantly higher by 86% (P<0.05) (n=8) and 145% (P<0.05) (n=8) after cardiac arrest, respectively, when compared with the corresponding sham animals (3 h, n=8; 6 h, n=7) (Figure 5). Similar experiments were performed in organotypic slice cultures to determine cleavage of δPKC. We showed 33% δPKC cleavage 3 h after OGD when compared with corresponding sham (P<0.05) (n=5). However, δPKC isozymes specific inhibitor δV1-1 (500 nmol/L) reduced the δPKC cleavage to almost sham levels (Figure 6). These results clearly suggest cleavage of δPKC during reperfusion in both models.
(
(
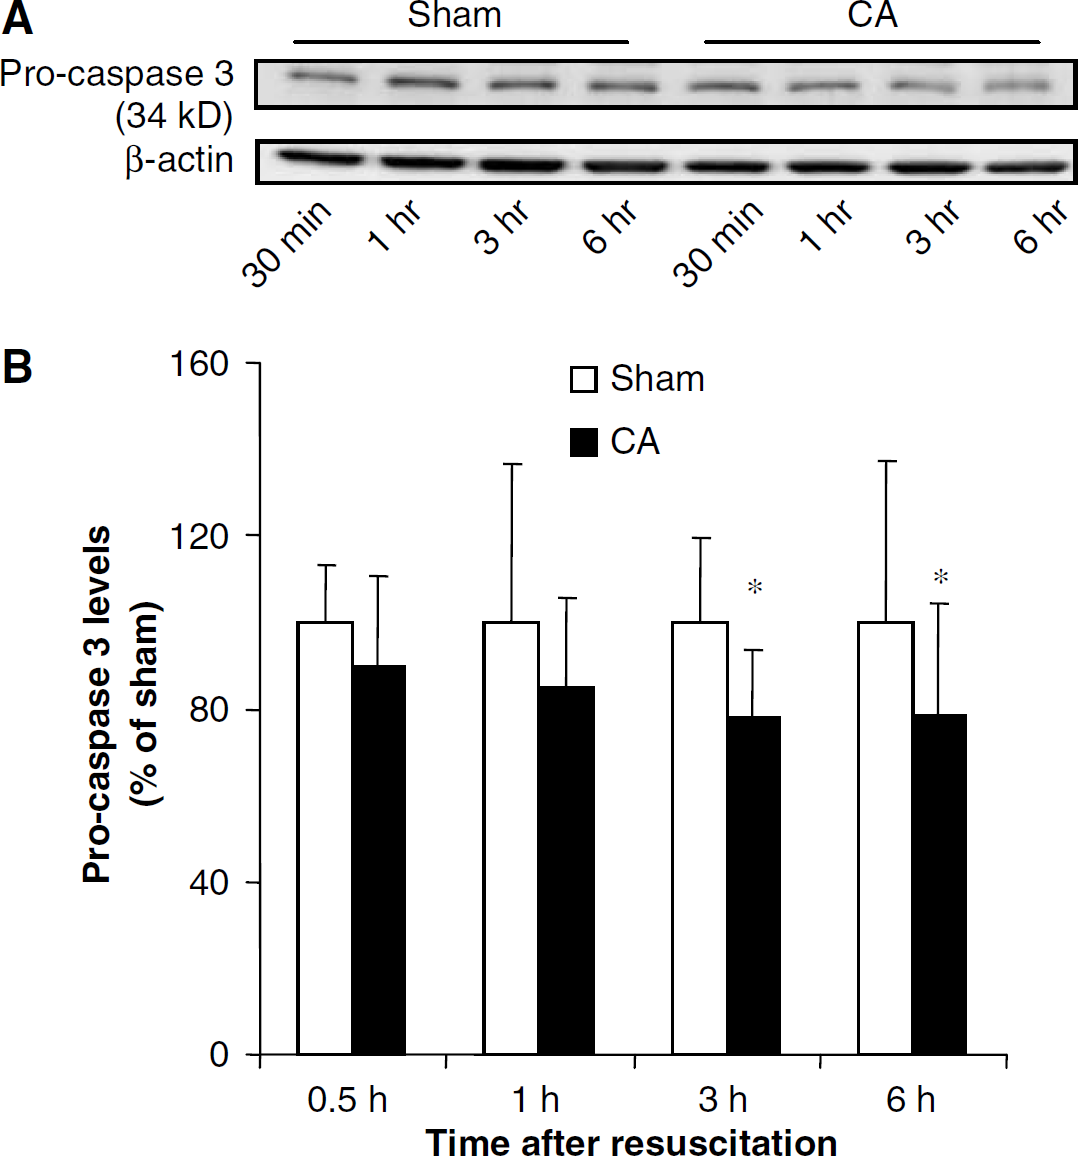
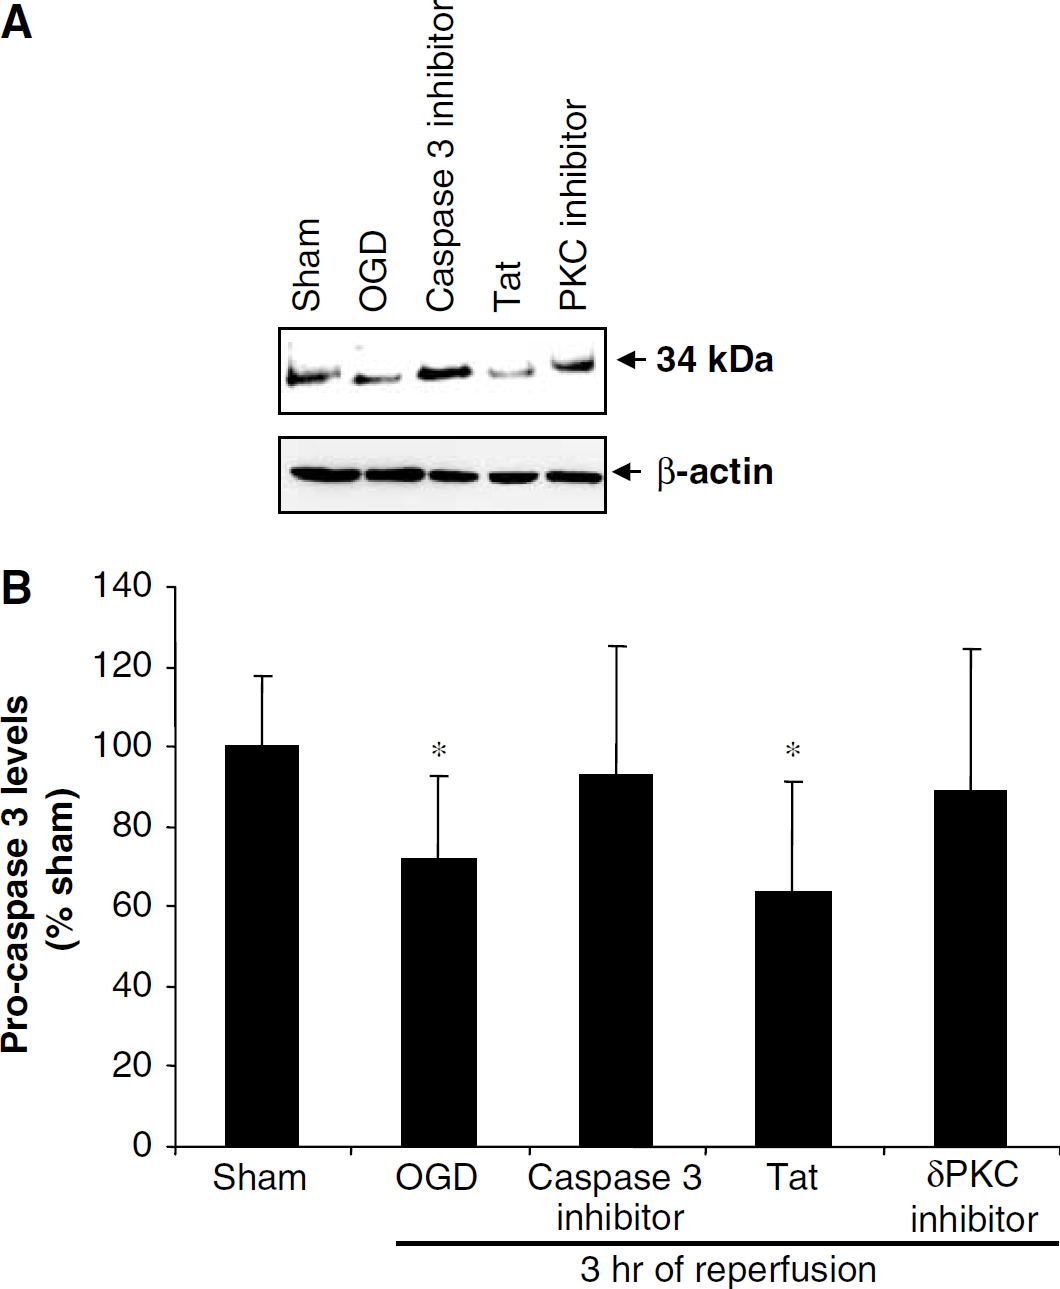
Since caspase 3 is an upstream activator of δPKC, we assessed activation of caspase 3 by measuring procaspase 3 (34 kDa) levels in the hippocampus during reperfusion after cardiac arrest (Figure 7). Decreases in procaspase 3 levels indicate activation. The differences in the levels of procaspase 3 (34 kDa) in sham (30 mins, n=6; 1 h, n=8) and cardiac arrest groups at 30 mins (n=8) and 1 h (n=8) of reperfusion were not statistically significant. Thereafter, significant decreases in the levels of procaspase 3 were observed at 3 h (22%, P<0.05) (sham, n=7; cardiac arrest, n=8) and 6 h (21%, P<0.05) (sham, n=5; cardiac arrest, n=8) of reperfusion after cardiac arrest when compared with the sham groups.
(
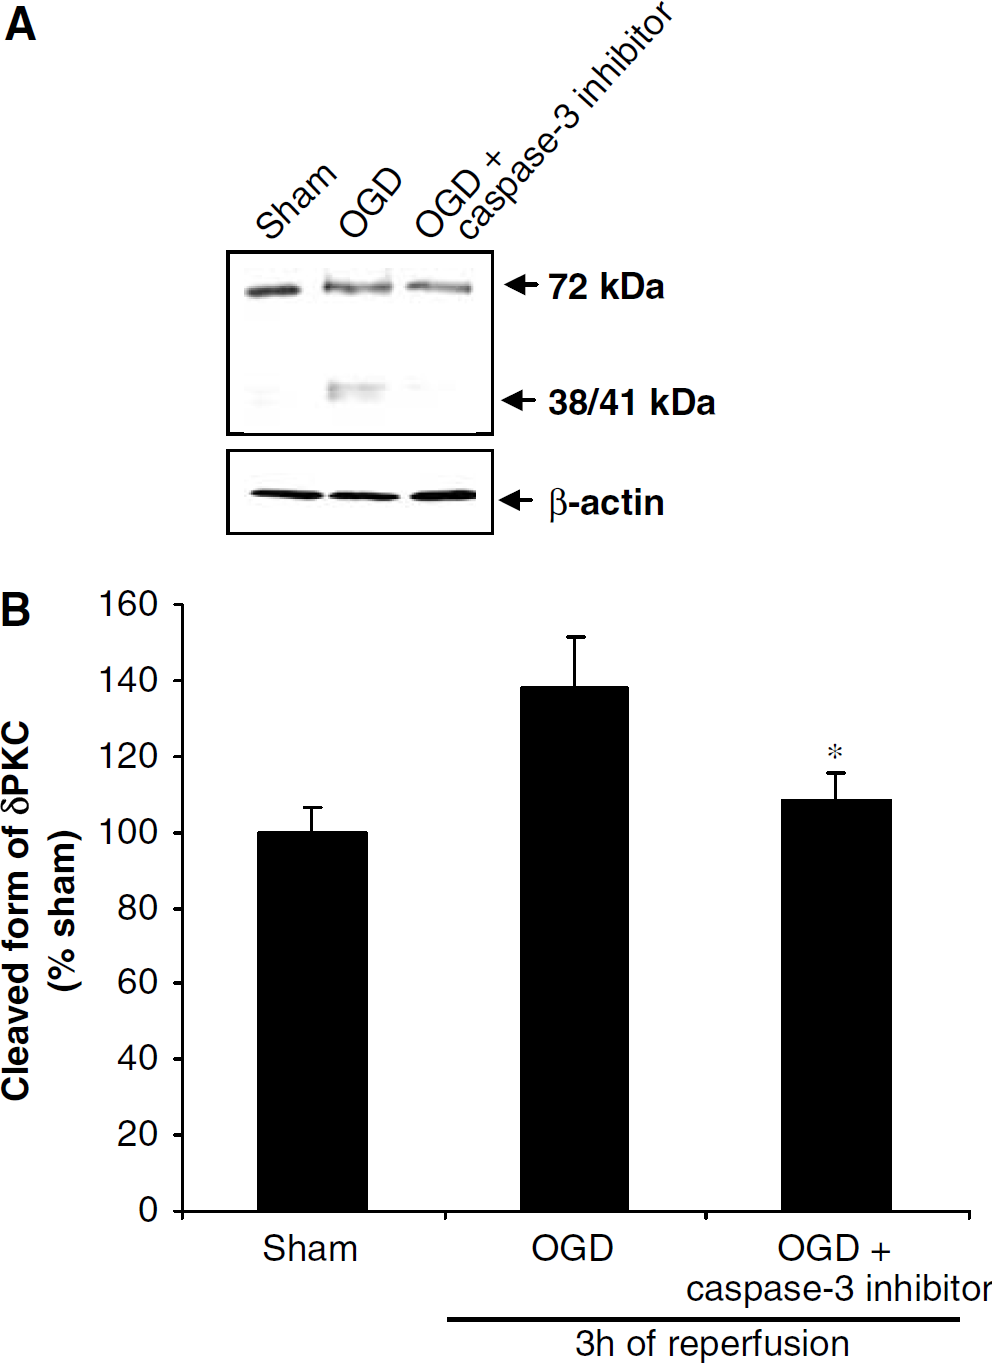
The hypothesis that caspase 3 is an upstream activator of δPKC after ischemia and reoxygenation was also tested in organotypic slice cultures. In the soluble fraction of organotypic slice cultures, there was a 28% decrease in procaspase 3 level after 3 h of reperfusion compared with sham (P<0.05) (n=5) (Figure 8). Caspase 3 inhibition with DMQD-CHO (50 μmol/L) was reflected in Western blot analysis, since procaspase 3 levels were similar to sham values. Since our previous study showed that inhibition of δPKC induced neuroprotection in organotypic hippocampal slices (Bright et al, 2004), we performed experiments to examine whether δPKC further activated caspase 3 as was suggested by Anantharam et al (2002). Inhibition of δPKC during OGD and 3 h of reperfusion decreased caspase 3 activation, suggesting δPKC in a positive feedback regulation of caspase 3 activation (Figure 8). To further confirm our hypothesis that caspase 3 is as upstream activator of δPKC, we blocked caspase 3 activation during OGD and early reperfusion. The OGD increased δPKC cleavage by 37% after 3 h of reperfusion compared with sham (P<0.05) (n=3), whereas 22% reduction in δPKC cleavage was observed after caspase 3 inhibitor treatment compared with the OGD group (P<0.05) (n=3). These results clearly show caspase 3 activation as an upstream regulator of δPKC cleavage (Figure 9).
(
(
To further test the hypothesis that the inhibition of caspase 3 activation could ameliorate cell death after OGD, we superfused organotypic slices with caspase 3 inhibitor DMQD-CHO (50 μmol/L). Neuronal death was quantified by using the PI technique (as described in the Materials and methods section). Inhibition of caspase 3 only during OGD or for 2 h of reperfusion was not neuroprotective (Figure 10). However, caspase 3 inhibition during OGD and for 3 h of reperfusion was neuroprotective in the CA1 region of hippocampus. Propidium iodide fluorescence values were 22.71%±4.39% (slices treated with the caspase 3 inhibitor) (n=9) and 62.58%±9.55% (nontreated) (n=6) (P<0.001).
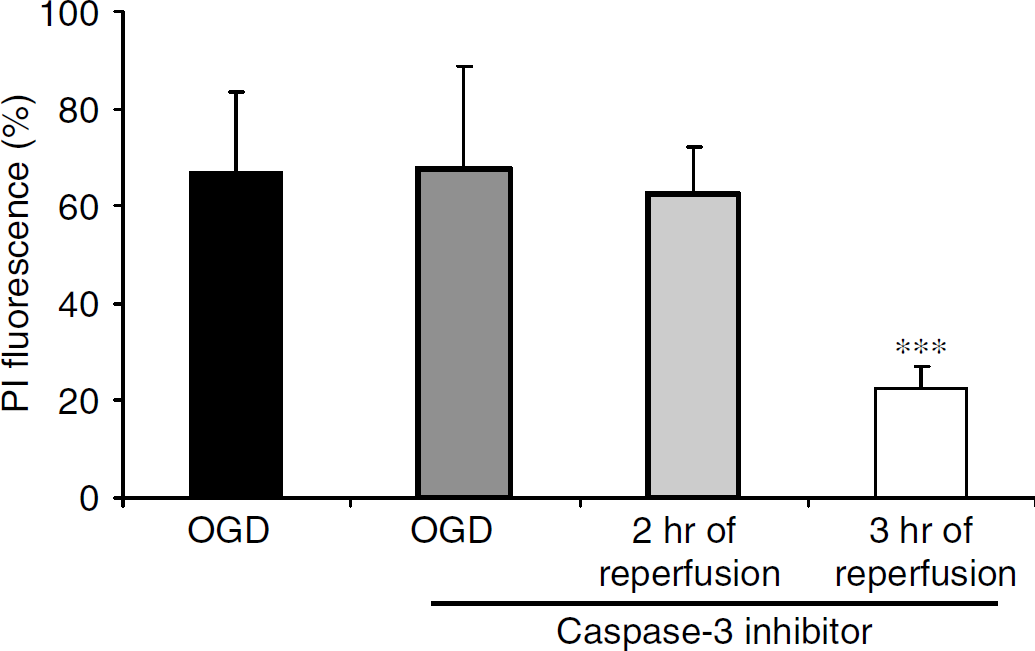
Propidium iodide (PI) fluorescence values measured in the CA1 pyramidal cells in rat organotypic hippocampal slices 1 day after after oxygen glucose deprivation (OGD). The cell-permeable selective caspase 3 inhibitor induced neuroprotection when applied during OGD and 3 h of reperfusion. Significance when compared with OGD group (*P<0.05).
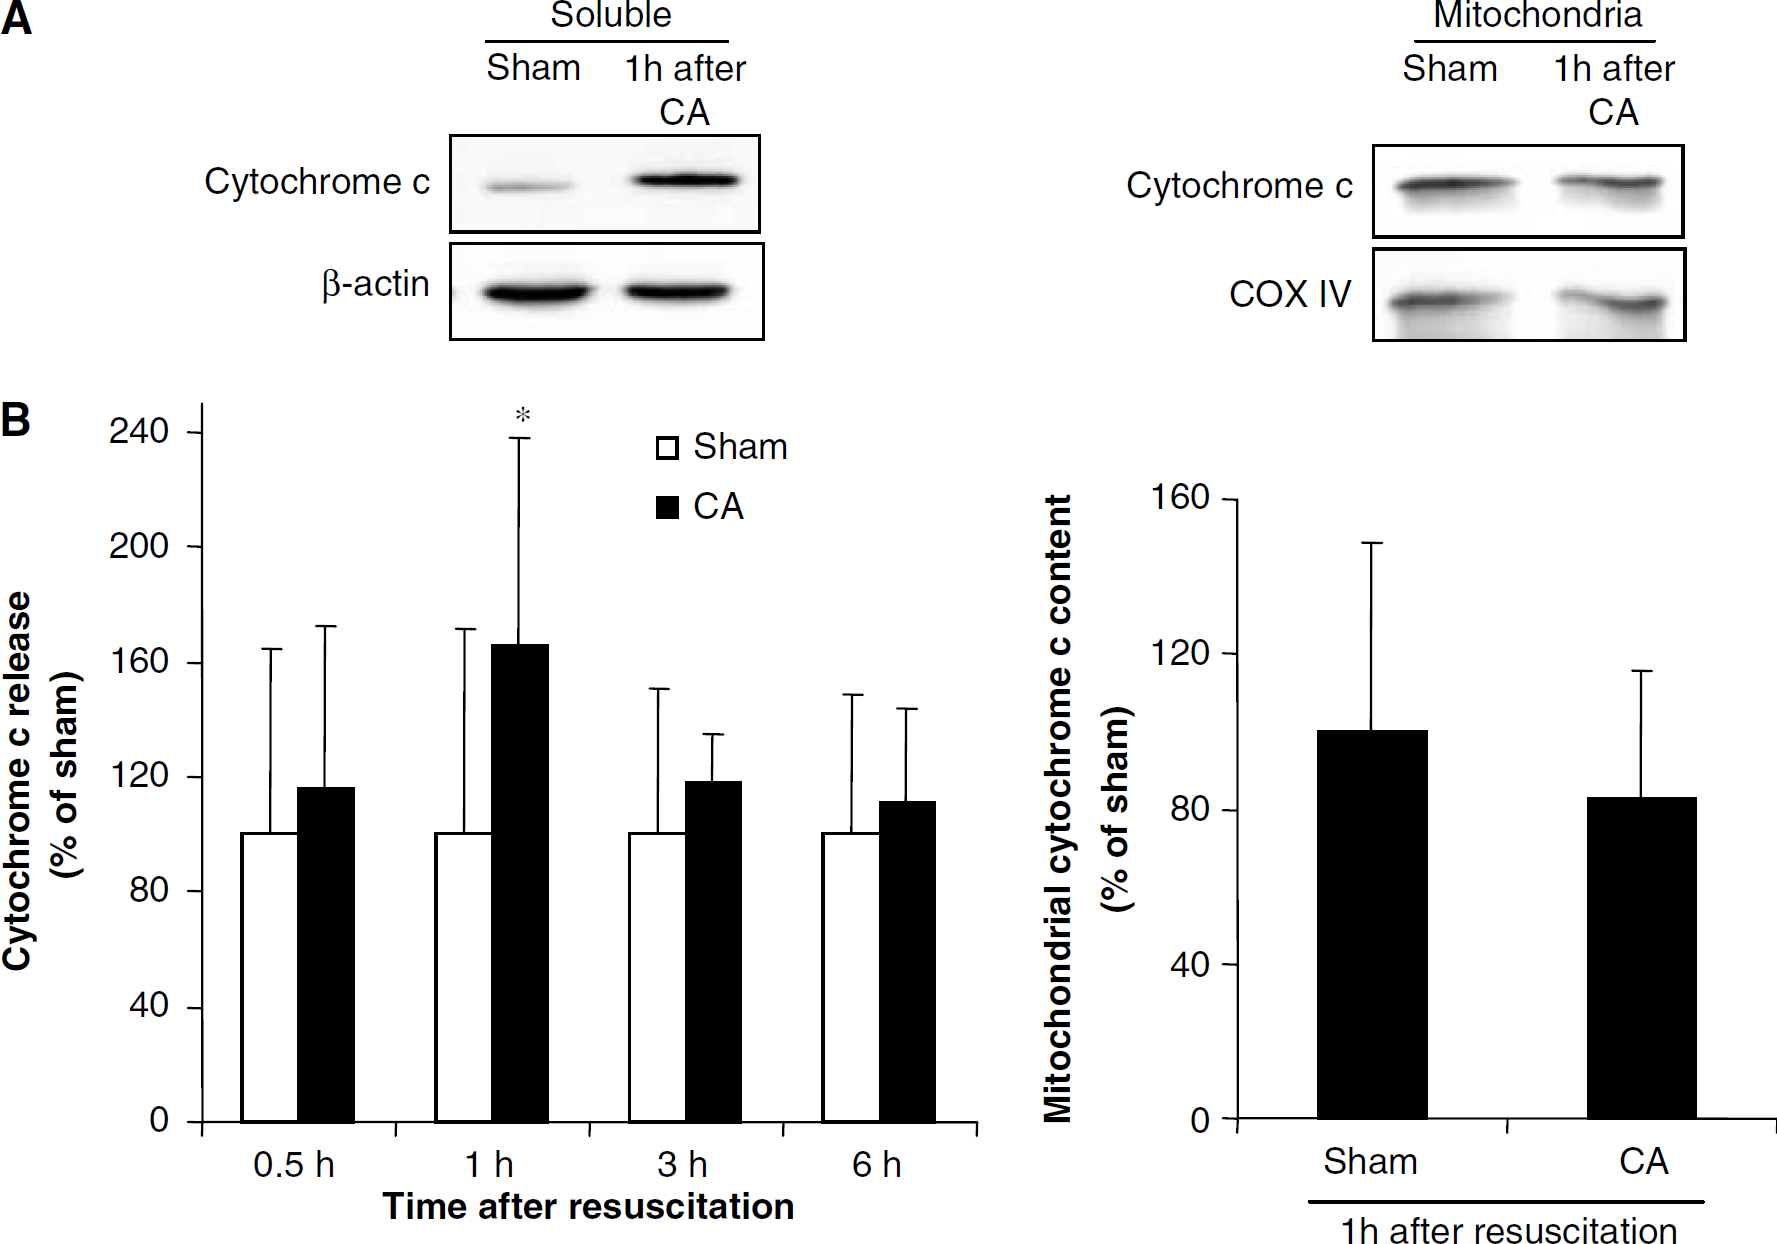
Since cytochrome c release promotes caspase 3 activation, we also determined cytochrome c release into the cytosol in hippocampus during reperfusion after cardiac arrest. Cytochrome c levels in the cytosol increased by 66% (P<0.05) at 1 h of reperfusion after cardiac arrest (n=6) as compared with the corresponding sham (n=6) (Figure 11). Cytosolic cytochrome c content returned to baseline levels at 3 and 6 h reperfusion after cardiac arrest (n=8) when compared with the corresponding sham (n=8). We also showed cytochrome c release after OGD in organotypic slice culture. Cytochrome c in the cytosol increased by 65% (n=5) at 1 h of reperfusion after 40 mins of OGD as compared with the corresponding sham (Figure 12).
(

(
Discussion
In this study, we showed activation of δPKC by translocation, and δPKC translocation correlated with its cleavage during the early reperfusion phase after ischemia. The observed δPKC activation occurred at a time after caspase 3 activation, which in turn is preceded by mitochondrial cytochrome c release. Further support for the link between caspase 3 and δPKC comes from our results that inhibition of δPKC reduced caspase 3 activation, indicating an existence of a possible feedback mechanism.
Protein kinase C is a multifunctional protein kinase that phosphorylates serine and threonine residues in many target proteins (Webb et al, 2000; Newton, 2001). Protein kinase C represents a structurally homologous group of proteins of which, at present, 12 isozymes have been identified (Battaini, 2001). Protein kinase C is a key signaling enzyme implicated in many cellular functions such as proliferation, differentiation, secretion, chemotaxis, development, memory, carcinogenesis, and apoptosis (Ashendel, 1985; Nishizuka, 1988; Alkon, 1989; Otte et al, 1991; Hug and Sarre, 1993; Tanaka and Nishizuka, 1994). Multiplicity of this enzyme, together with variation in cellular and tissue distribution and abundance, may be responsible for PKCs pivotal position in cellular signal processing (Gschwendt, 1999; Webb et al, 2000). Among all PKC isozymes, δPKC is actively involved in cell apoptosis in a stimulus- and tissue-specific manner. δPKC regulates the expression and function of apoptosis-related proteins. In addition δPKC is a target for caspases (Brodie and Blumberg, 2003).
Various groups have showed the involvement of δPKC in apoptosis using in vitro as well as in vivo models (Koponen et al, 2000; Brodie and Blumberg, 2003). Involvement of caspase 3-dependent proteolytic cleavage of δPKC in the apoptotic pathway was shown to occur in dopaminergic cells of a pesticide-induced Parkinsonian model (Anantharam et al, 2002). Coherent to this finding, a recent study by Bright et al (2004) showed very early activation (10 mins) of δPKC after focal cerebral ischemia in rat. The results of our study showed a time course of events that may start with the release of cytochrome c from mitochondria, leading in turn to activation of caspase 3 and δPKC cleavage during reperfusion after cardiac arrest/OGD. It is also possible that δPKC translocates to mitochondria and promotes the release of cytochrome c. This suggests the involvement of a novel aberrant δPKC signal transduction pathway in neuronal cell death after global cerebral ischemia initiated by δPKC activation.
It is well documented that one major factor involved in neuronal cell death after ischemia is the release of apoptogenic factors and the generation of reactive oxygen species from mitochondria because of persistent calcium overload (Fiskum et al, 1999; Murphy et al, 1999; Friberg and Wieloch, 2002). However, the exact postischemic mitochondrial dysfunction and the effect of the signal transduction pathway that ensues from this dysfunction are not well understood. In an earlier study, we reported a decreased rate of respiration in isolated hippocampal mitochondria at the level of complex IV (in presence of ascorbate+TMPD as the substrates) at 30 mins of reperfusion after 10 mins of global cerebral ischemia (Perez-Pinzon et al, 2002). The decreased rate of respiration at the level of complex IV and postischemic hyperoxidation of respiratory chain components may result from loss of cytochrome c from mitochondria after ischemia (Perez-Pinzon et al, 1999). These findings are supported by our current results that an early release of cytochrome c is observed within 1 h after global cerebral ischemia. We hypothesize that these early mitochondrial abnormalities may exacerbate mitochondrial dysfunction after many hours of reperfusion. This contention is supported by our findings that mitochondrial respiration is further affected 24 h after global cerebral ischemia (Dave et al, 2001), where complex I and II were also hindered. It is possible that the early release of mitochondrial cytochrome c activates the caspase cascade, leading in turn to δPKC activation and/or cleavage, which in a negative feedback loop, further hampers mitochondrial function. δPKC translocation to the mitochondria from the cytoplasm has been observed in human U-937 cells when treated with H2O2 (Majumder et al, 2000). This study also hypothesized that mitochondrial targeting by δPKC is required, at least in part, for the apoptotic response of cells to oxidative stress. Overexpression and activation of δPKC affect mitochondrial functions, leading to a decrease in the mitochondrial membrane potential and release of cytochrome c (Brodie and Blumberg, 2003). It is possible that binding of activated δPKC to mitochondria may regulate activities of some of the pro- and/or anti-apoptotic proteins. For example, it has been shown that the activities of several Bcl-2 family proteins are regulated by phosphorylation (Haldar et al, 1995, 1998). Recently, our study also showed reduced translocation of the Bcl-2 family member BAD protein from the cytosol after δPKC inhibitor treatment in focal ischemia model (Bright et al, 2004). This reduced BAD translocation from the cytosol correlates with neuroprotection.
Thus, we propose that secondary damage to hippocampal mitochondria during the late reperfusion phase may be linked to an aberrant δPKC signal transduction pathway. The severe mitochondrial dysfunctions reflected showed by cytochrome c release in the present study after OGD/cardiac arrest may further cause damage to the cell via caspase activation. The present study also confirms this hypothesis as neuroprotection was achieved after caspase 3 inhibition in organotypic slice cultures. Further support for this hypothesis emerges from our recent study that suggested that δPKC mediates neuronal damage during the reperfusion phase after focal cerebral ischemia and OGD in the organotypic hippocampal slices (Bright et al, 2002, 2004). In those studies, we showed that the δPKC inhibitor peptide decreases infarct size when administered during the reperfusion phase in organotypic slice culture and in vivo animal models (Bright et al, 2002).
Besides cleavage of δPKC by caspase 3, other studies also showed that δPKC itself can positively regulate the activation of caspase 3. Denning et al (2002) showed involvement of δPKC activation in potentiating caspase 3 activation and disrupting mitochondrial function during UV-induced apoptosis. They also showed that the active δPKC translocated to the mitochondria where it greatly potentiated caspase 3 activation, setting up a positive feedback loop between caspase activation and δPKC cleavage/activation. We also showed that δPKC is upstream of caspase 3 in an in vivo acute myocardial infarction model in pigs (Inagaki et al, 2003) In addition, the interaction of δPKC with mitochondria and caspases, as well as interactions of δPKC with other protein kinases and phosphatases involved in cell apoptosis have also been identified (Gschwendt, 1999; Brodie and Blumberg, 2003).
We conclude from these results that early release of cytochrome c into the cytosol after reperfusion from cardiac arrest activates the caspase cascade, which in turn may activate δPKC by proteolysis. Activation of δPKC in turn mediates ischemic injury by putatively acting on caspase 3 and causing secondary mitochondrial dysfunctions. This aberrant signal transduction via δPKC might be a novel pathological pathway involved in delayed neuronal death followed by cardiac arrest (Figure 13). Novel therapeutic strategies targeting δPKC activation may provide neuroprotection after cardiac arrest.
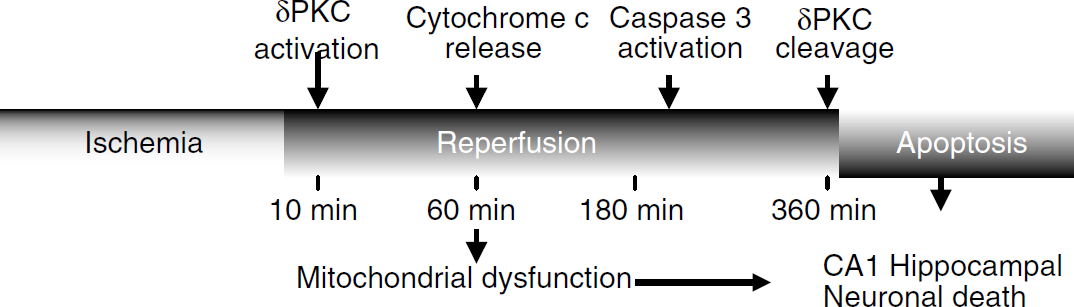
Putative scheme of signal transduction cascade initiated after cardiac arrest in hippocampus inducing activation/cleavage of δPKC leading to neuronal death.
Footnotes
Acknowledgments
The authors thank Dr Beata Frydel, Miami Project Core Facilities for her encouraging guidance on use of confocal microscope.