
Abstract
How the human brain functions under conditions of acute hypoglycemia remains a complex question by virtue of the potential simultaneous shifts in processes of perfusion, metabolism, and changing demand. We examined this issue by measuring cerebral blood flow (CBF) and oxidative metabolism (CMRO2) in insulin-induced hypoglycemic (HG) and euglycemic (EG) conditions at rest and during motor activation in normal human subjects using magnetic resonance (MR). Experiments were performed on 12 subjects (9M, 3F). The protocol consisted of insulin-induced hypoglycemia (targeting a HG of 60 mg/dL) followed by euglycemia, or in reverse order, each phase lasting approximately 1.5 h. Euglycemia was performed with the same insulin infusion rate so as to match the hypoglycemic phase. Magnetic resonance data were acquired 30 mins after the target plasma glucose was achieved so as to minimize any acute effects. Although the depth of hypoglycemia achieved in the present study was relatively small, the present data found a significant increase in flow in motor cortex with mild hypoglycemia, from 56.4±13.6 mL/100 g min (euglycemia) to 64.3±7.6 mL/100 g min (hypoglycemia). Using the Renkin-Crone exponential model of oxygen extraction with MR models of susceptibility-based relaxation, analysis of the flow measurements, relaxation and BOLD data also implied that throughout the studies, metabolism and flow remained coupled. Elementary motor task activation was not associated with any consistent larger activated flows. Thus it remains that although mild hypoglycemia induced an increase in basal flow and metabolism, a similar increase was not seen in task activation.
Introduction
How the human brain responds to hypoglycemia has consistently been an important question because it is continually dependent on plasma glucose as a source of oxidative fuel for neuronal function. Studies of cerebral blood flow (CBF) and physiology in humans under conditions of acute insulin-induced hypoglycemia have suggested that there is relatively little change in blood flow until plasma glucose concentrations decline to the 2.0 mmol/L range. At this level, Tallroth et al (1992) used 133Xe studies to report a rapid (within 10 mins of hypoglycemia) 25% increase in cerebral blood flow, which persisted 15 mins beyond normalization. At a more moderate hypoglycemia (2.8 to 3.4 mmol/L plasma glucose), Powers et al (1996) used 15O water Positron emission tomography (PET) to report no differences in flow compared with euglycemia (∼5 mmol/L), and no differences in the amount of blood flow increase provoked by vibrotactile stimulation between the various plasma and insulin levels. The recent work of Teves et al (2004), however, has suggested that blood flow responses are sensitive to decreases in plasma glucose to 3 mmol/L, and that they vary regionally. These data may compare to cognitive testing studies that reported changes in performance- and event-related potentials (Jones et al, 1990; Heller and MacDonald, 1996) at levels of approximately 3.0 mmol/L. Several processes may be contributing to these differing observations. First, as suggested by Teves et al (2004), it is possible that the observed differences in glucose sensitivity may result from differences in measurement accuracy. Second, interindividual variation at baseline and in response to glucose decline may make detection of the effect difficult. Finally, it is possible that neurovascular or ‘neurometabolic’ coupling (normally hypothesized to relate flow and metabolism increases with task activation) is close to the margin of fuel adequacy so that the lowered plasma glucose, in the face of normal blood flow responses, results in an overall decrement in performance.
Measurements of brain metabolism in insulin-induced hypoglycemia could contribute towards a better understanding of these observations. For example, Powers et al (1996) interpreted the observation of no change in task-activated flow increases in hypoglycemia to be that blood flow is uncoupled with metabolism and neural activity in hypoglycemia. However, while such metabolism studies have provided variable results by methods of FDG PET (Horinaka et al, 1997; Wienhard, 2002), the methods of functional magnetic resonance (MR) imaging can provide an alternative approach. Therefore, in this study, we used high-field MR perfusion, R2′ and BOLD imaging to evaluate perfusion and oxidative metabolism in normal adult volunteers. We compared euglycemia (plasma glucose, 5.3 mmol/L) with mild hypoglycemia (plasma glucose 3.5 mmol/L) under resting and task-activated conditions.
Methods
Subjects
In all, N=12 healthy volunteers (9M, 3F, mean age 29.6±8.5 years, all right handed) were recruited for study. Two subjects were studied twice (separated by 3 months) for a total of 14 studies. None of the participants have first-degree relatives with diabetes. The mean body mass index (BMI) was 23.4±1.7 kg/m2. All subjects were overnight fasted before the study, which started at 0800. The bioethics committee at the Albert Einstein College of Medicine (Committee on Clinical Investigations) had approved this protocol and volunteers provided informed consent before participation in the study.
On the morning of the study, volunteers were admitted to the MRRC, catheters placed, and insulin/glucose infusions started. The bolus insulin infusion used 1.6 mU/kg min × 10 mins, followed by 0.8 mU/kg min for the remainder of the study. A variable 20% glucose infusion was used to clamp the glucose at either 90 to 100 mg% (euglycemia) or 60 mg% (hypoglycemia). For each study, both euglycemic and hypoglycemic phases were performed, with the order (euglycemia–hypoglycemia study A, n=7 or hypoglycemia–euglycemia, study B, n=7) randomized to account for any acclimation effects. (Two of the volunteers were studied twice, 3 months apart, euglycemia–hypoglycemia and hypoglycemia–euglycemia.) In both studies, A and B, the volunteer was taken out of the magnet during the plasma glucose shift to increase tolerability of the study. All data were acquired at least 30 mins after stabilization of plasma glucose at either the hypoglycemic or euglycemic levels. The entire duration of hypoglycemia was approximately 60 to 75 mins, and the entire study was performed between 0800 and 1300.
Throughout the study, plasma glucose and lactate concentrations were determined at 5 to 10 mins intervals using a YSI 2300 Stat-Plus glucose-lactate analyzer. Venous blood pH was determined with a Radiometer ABL-5.
Magnetic Resonance
All studies were performed with a Varian Inova 4T human MR system equipped with a head insert gradient coil (5.8 g/cm). and volume TEM 1H head coil. High contrast scout images were obtained using T1 inversion recovery gradient echoes to identify the plane of interest through the primary motor cortex (Figure 2). Studies acquired were perfusion, BOLD and quantitative R2′ acquisitions. All physiologic imaging studies were performed with FOV 192 × 192, spatial resolution of 64 × 64 in-plane, 3 mm slices, resulting in an isotropic 3 mm resolution. In all acquisitions, automated slice shimming was performed, achieving a typical line width of 11 to 15 Hz over the plane.
(
The BOLD-EPI acquisition was performed using a gradient echo acquisition, TE=31 ms. Task activation was performed using bilateral finger tapping (40 secs duration), repeated twice in 80 secs ON/OFF cycles (total BOLD duration, ∼3 mins). Quantitative R2′ data were calculated from 16 field echoes prepared by either a 50 or 80 ms spin echo. These acquisitions were also used to calculate a two-point R2 and Bo map (used to correct the data for homogeneity losses, which were minimal in the selected plane). The corrected R2′ relaxation rate was calculated from the field echo and spin echo data, using a linear gradient correction derived from the field maps (An, 2002). The R2′ and R2 data were acquired under nonactivated conditions, euglycemia, and hypoglycemia.
The perfusion study was performed using the subtraction method of FAIR-EPI in conjunction with T1 measurements. The inversion time was 1.8 secs and the mean transit time was taken to be 0.65 secs (Yen et al, 2002; Yang et al, 1998). Data were acquired under the two glycemic levels, and under activated and nonactivated conditions. In the activated condition, volunteers were asked to perform sustained finger tapping over a 2-mins period.
Analysis of the BOLD data was performed to identify regions of interest in the motor and supplementary cortices. For each volunteer, 105±15 pixels were identified in the activated regions. This was consistently performed in the bilateral motor cortices and in the supplementary motor cortex. Additionally, quantitative T1 images were segmented into CSF, gray, and white matter pixels. Three categories of pixels were therefore described, motor (activated), gray matter, and white matter.
Analysis
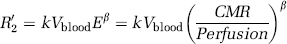
The flow and transverse relaxation data have been incorporated into a model of deoxyhemoglobin concentration, oxygen extraction, and consumption by numerous workers (Ogawa et al, 1993; Davis et al, 1998; Hoge et al, 1999; Oja et al, 1999) expressed in equation (1). The blood susceptibility-induced transverse relaxation rate, R2′, is calculated from the time reversible gradient echo relaxation rate, R2*, and time irreversible spin echo intrinsic relaxation rate, R2intrinsic, corrected by the loss of signal from Bo homogeneity (An and Lin, 2002; Yablonskiy, 2002). CMR is the oxygen consumption rate, E is the oxygen extraction fraction, and Vblood the volume fraction of blood in a given pixel.
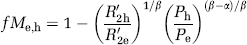
We used the Grubb approximation for relating fractional changes in blood perfusion and blood volume (α=0.37; Grubb et al, 1974), given that the physiologic manipulations in this study are well within normal range. The value of β ranges from 1 to 2 depending on field strength and vessel size, and in the present data, we used β=1.5 (Ogawa et al, 1993; Hoge et al, 1999) as determined by previous experimental data and Monte Carlo simulations which account for subvoxel contributions from venules and capillaries (Davis et al, 1998). Equation (1) can readily be modified to calculate the fractional change in basal CMR (fMe,h) between euglycemia and hypoglycemia as shown in equation (2) (R2h′, R2e′ are the relaxation rates in hypoglycemia, and euglycemia respectively; Ph and Pe are the perfusion rates in hypoglycemia and euglycemia):
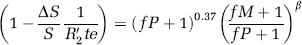
Finally, the BOLD data (ΔS/S) can be incorporated into this model, ΔS/S≅(R2′−R2act′)te, and thus the fractional BOLD signal change with task activation can be related to fractional changes in flow (fP) and metabolism (fM) as
In the grouped data, a paired t-test analysis was used with P<0.05 for significance. In the flow measurements, statistical analysis was performed using either a repeated measures ANOVA (multiple comparisons corrected with Holm–Sidak test) or a linear regression analysis. All data were demonstrated to be normally distributed before regression and significance was taken at P<0.05.
Results
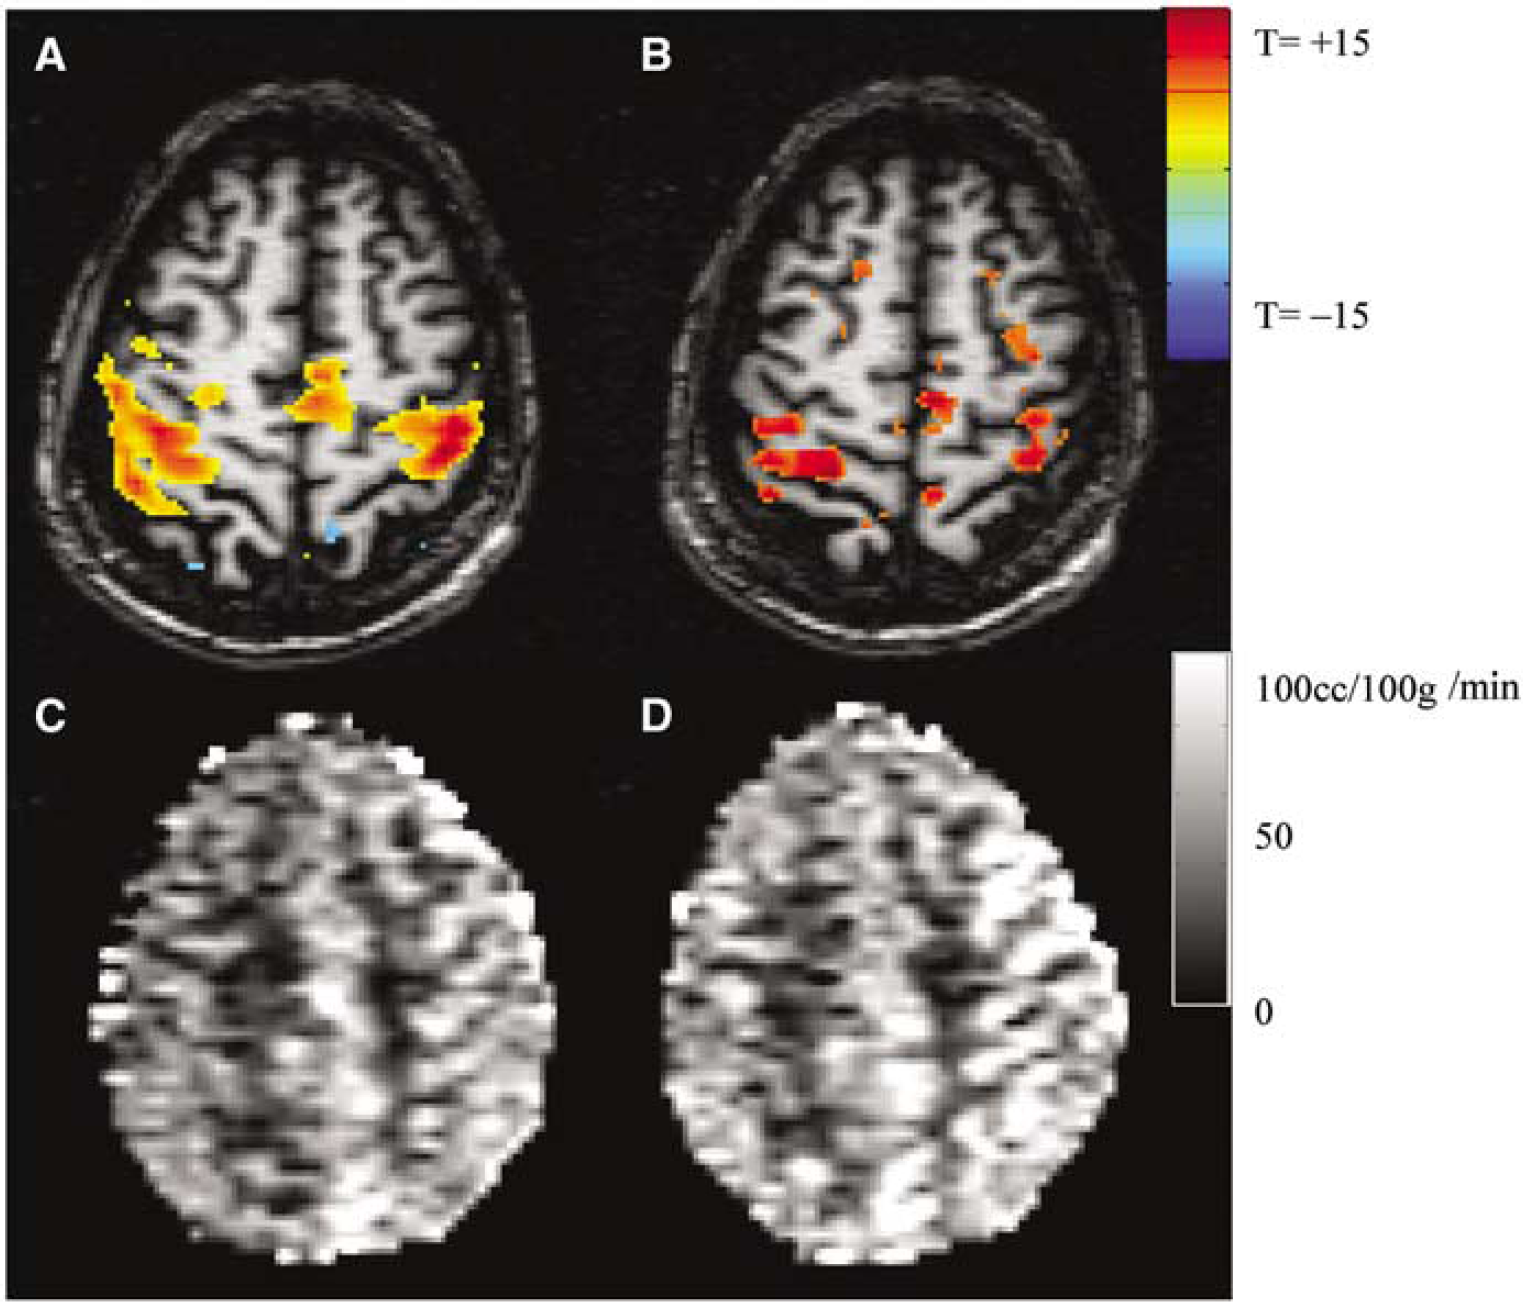
The protocol achieved relatively stable glucose levels. During the euglycemic (EG) phase, the plasma glucose concentrations attained were 5.78±0.03 mmol/L and in hypoglycemia, the concentrations were 3.56±0.02 mmol/L. Figure 1 displays a typical plasma glucose time course, indicating the maintenance of plasma glucose at the desired levels for a period of ∼1 to 1.25 h. Venous blood pH did not change (data not shown). Figures 2A and 2B displays the euglycemic- and hypoglycemic (HG)-activated BOLD data from a volunteer, demonstrating the plane of interest and typical areas of activation through the primary and supplementary motor cortices. Quantitative CBF maps in euglycemia and hypoglycemia are also shown, demonstrating the increased basal flow in hypoglycemia (Figures 2C, 2D). Perfusion data are tabulated in Table 1, showing highly significant increases (P<0.0001) in blood flow between basal and activated states (either euglycemic or hypoglycemic). There was also a significant increase (P<0.015) in blood flow between the EG resting state (nonactivated) at 56.4±13.6 mL/100 g min and hypoglycemic (nonactivated) state at 64.3±7.6 ml/100 g min. There was variability in the extent of HG-activated flow; however, a significant difference was seen between the EG and HG-activated blood flows (Holm–Sidak corrected comparisons testing). An ad hoc evaluation of the delta-activated flows (i.e., activated–resting) found no significant difference between euglycemia and hypoglycemia.
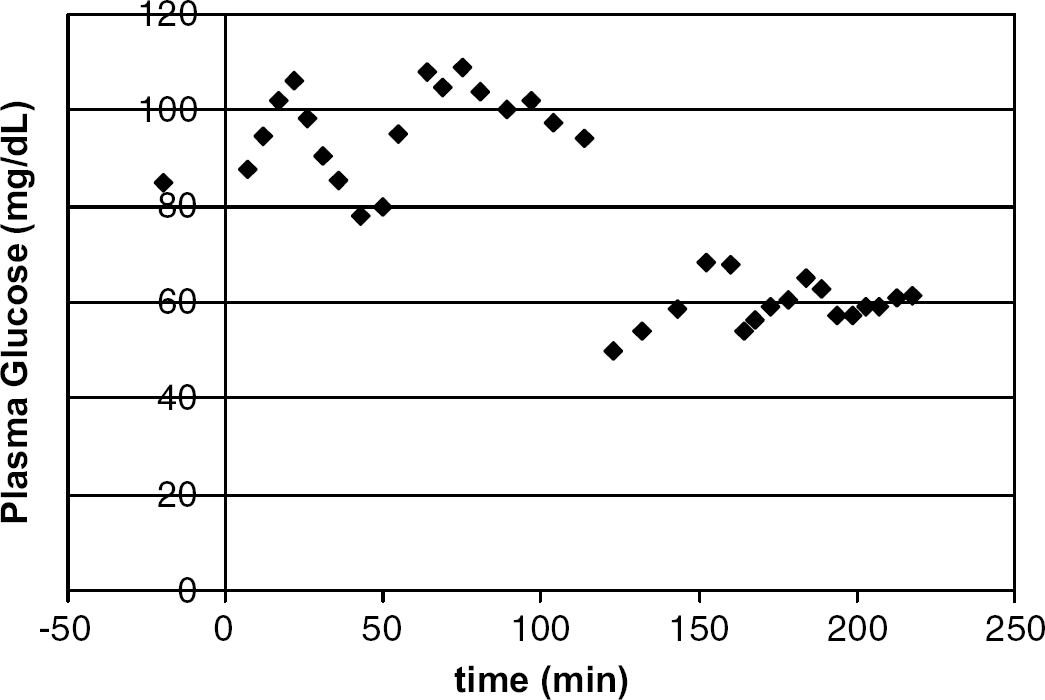
Plasma time course of glucose over a euglycemic–hypoglycemic study.
Perfusion values in n=12 volunteers (14 total studies)
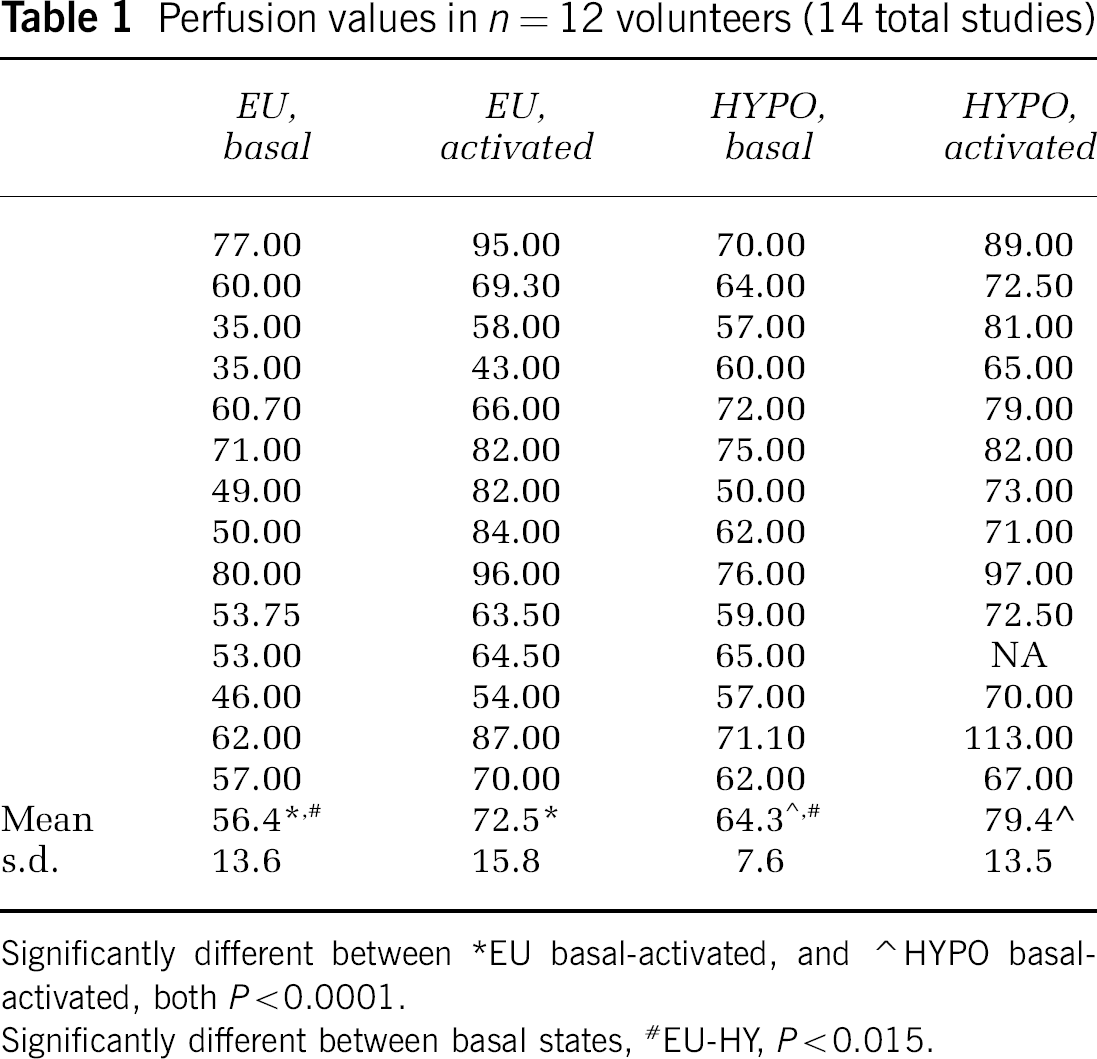
Significantly different between *EU basal-activated, and ⁁ HYPO basal-activated, both P<0.0001.
Significantly different between basal states, #EU-HY, P<0.015.
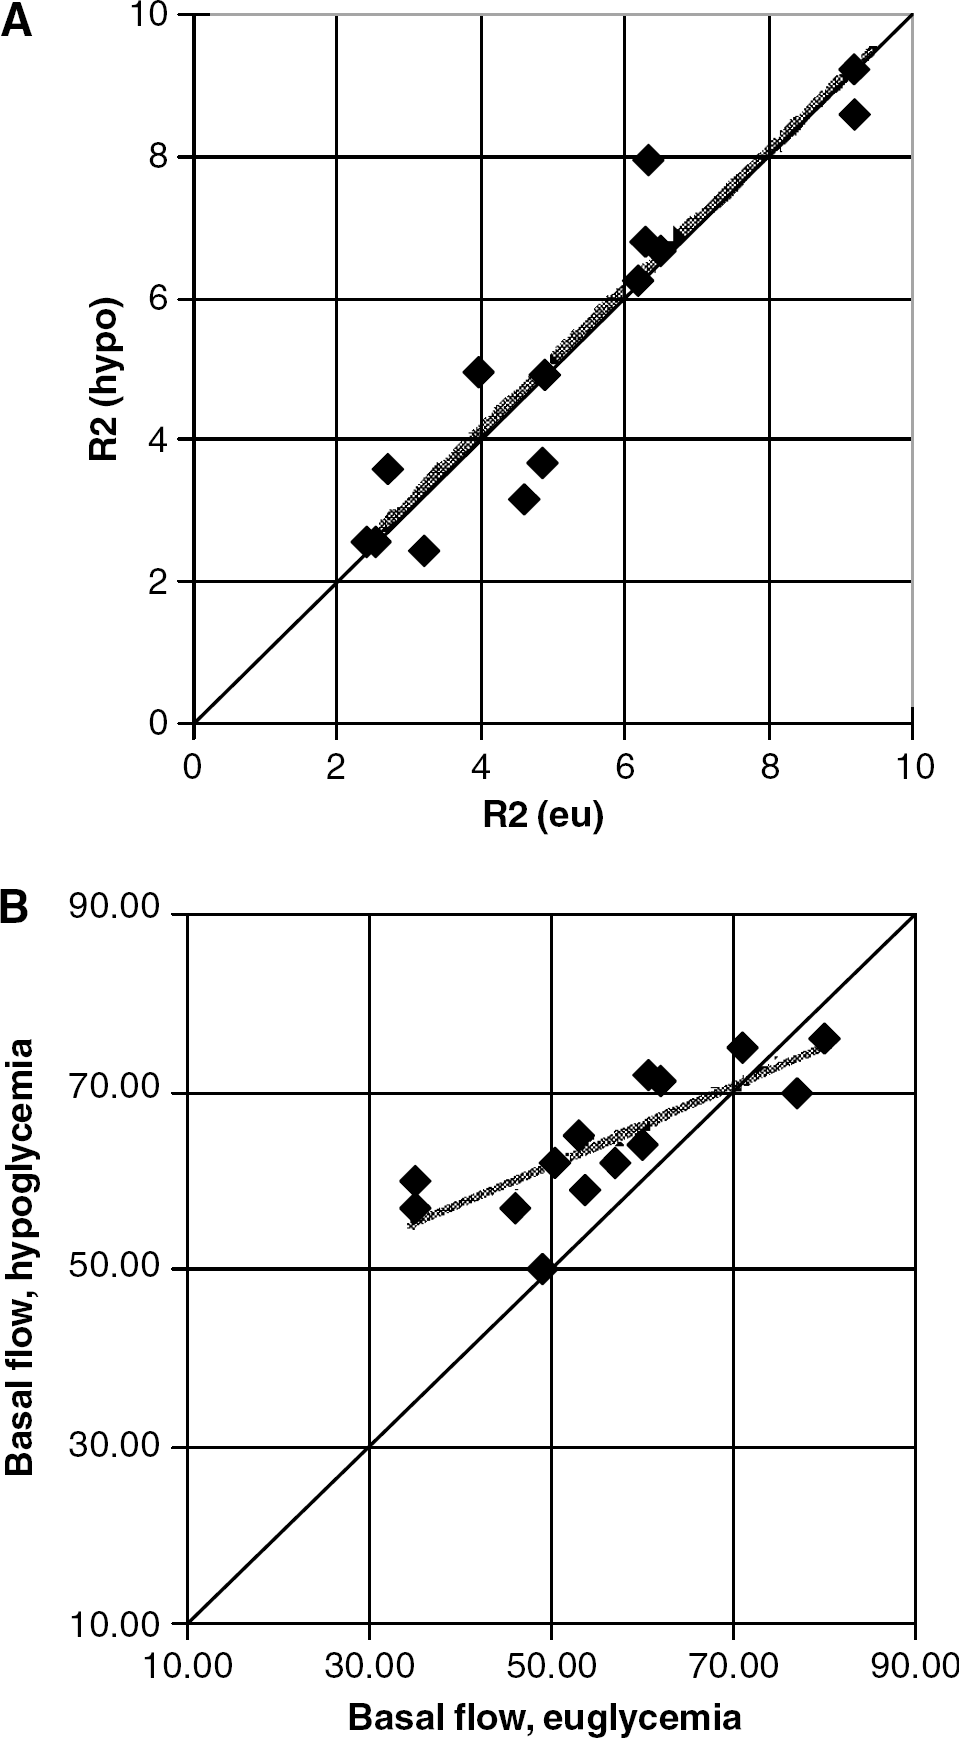
A comparison of basal (nonactivated) susceptibility-based relaxation rates R2′ in euglycemia and hypoglycemia is shown in Figure 3A, showing that there was no effective change in the R2′ under the two glycemic conditions. The equality line and linear regression lines (R=+0.93, P<2 × 10⁻⁶, slope of 0.98) are shown. The mean susceptibility R2hypo′ and R2eu′ were 5.21±2.31 and 5.18±2.19 secs−1 respectively. Similarly, plotting the basal flow data from Table 1 readily shows the significant increase in flow with hypoglycemia (Figure 3B). Linear regression between the EG and HG perfusion values was significant, R=+0.80, P<5 × 10⁻³. Notably, the measurements of R2′ and perfusion show that there are considerable interindividual differences in these measurements, but between euglycemia and hypoglycemia, none were consistently detected. Combining the R2′ and perfusion measurements, Equation (2) was used to calculate the fractional increase in basal (nontask-activated) metabolism (fMe,h) in hypoglycemia. For gray matter and motor cortex (defined from the finger tapping paradigm), the fMe,h significantly related to the fractional increase in perfusion, fPe,h, with a linear correlation coefficient of R=+0.635 (P<0.011) and R=+0.56 (P<0.013), respectively. There was a significant amount of variability in the white matter such that with the lower amplitude values in white matter, the correlation was not significant, R=0.502 (P<0.057).
(
The activation paradigm introduced variability in the flow and metabolism measures. In euglycemia, the fractional increase in blood flow associated with task activation (finger tapping paradigm) was 31±21%, while in hypoglycemia, this was 24±16% (not statistically different from euglycemia). Nonetheless, whether in euglycemia or in hypoglycemia, there was a statistically significant relationship between the task-activated perfusion response with R2′ (Figure 4). In both cases, the dependence appears nonlinear and rank Spearman correlations for euglycemic and hypoglycemia data were similar, with R=−0.66, P<0.01 and R=−0.69, P<0.01, respectively. These data are consistent with the Renkin–Crone model (see Discussion, footnote) where small changes in perfusion are exponentially governed by tissue susceptibility.
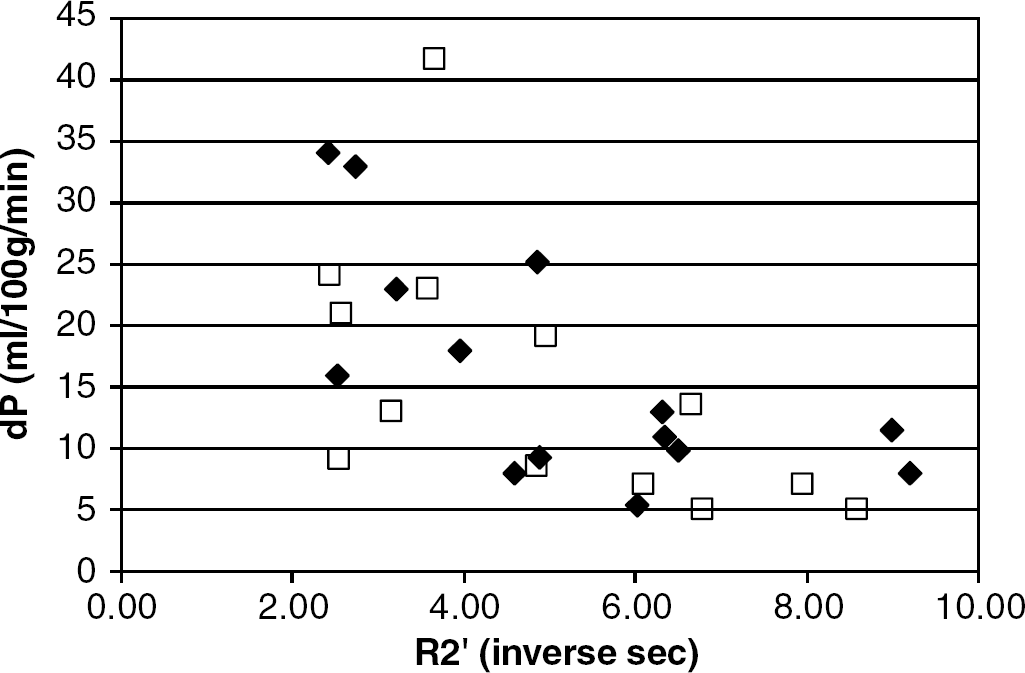
Plot demonstrating the dependence of task-activated perfusion responses with basal (nonactivated) R2′ in euglycemia (diamonds) and in hypoglycemia (squares). Rank Spearman correlations of these raw data are both significant, R=−0.66, P<0.01 (euglycemia), R=−0.69, P<0.01 (hypoglycemia).
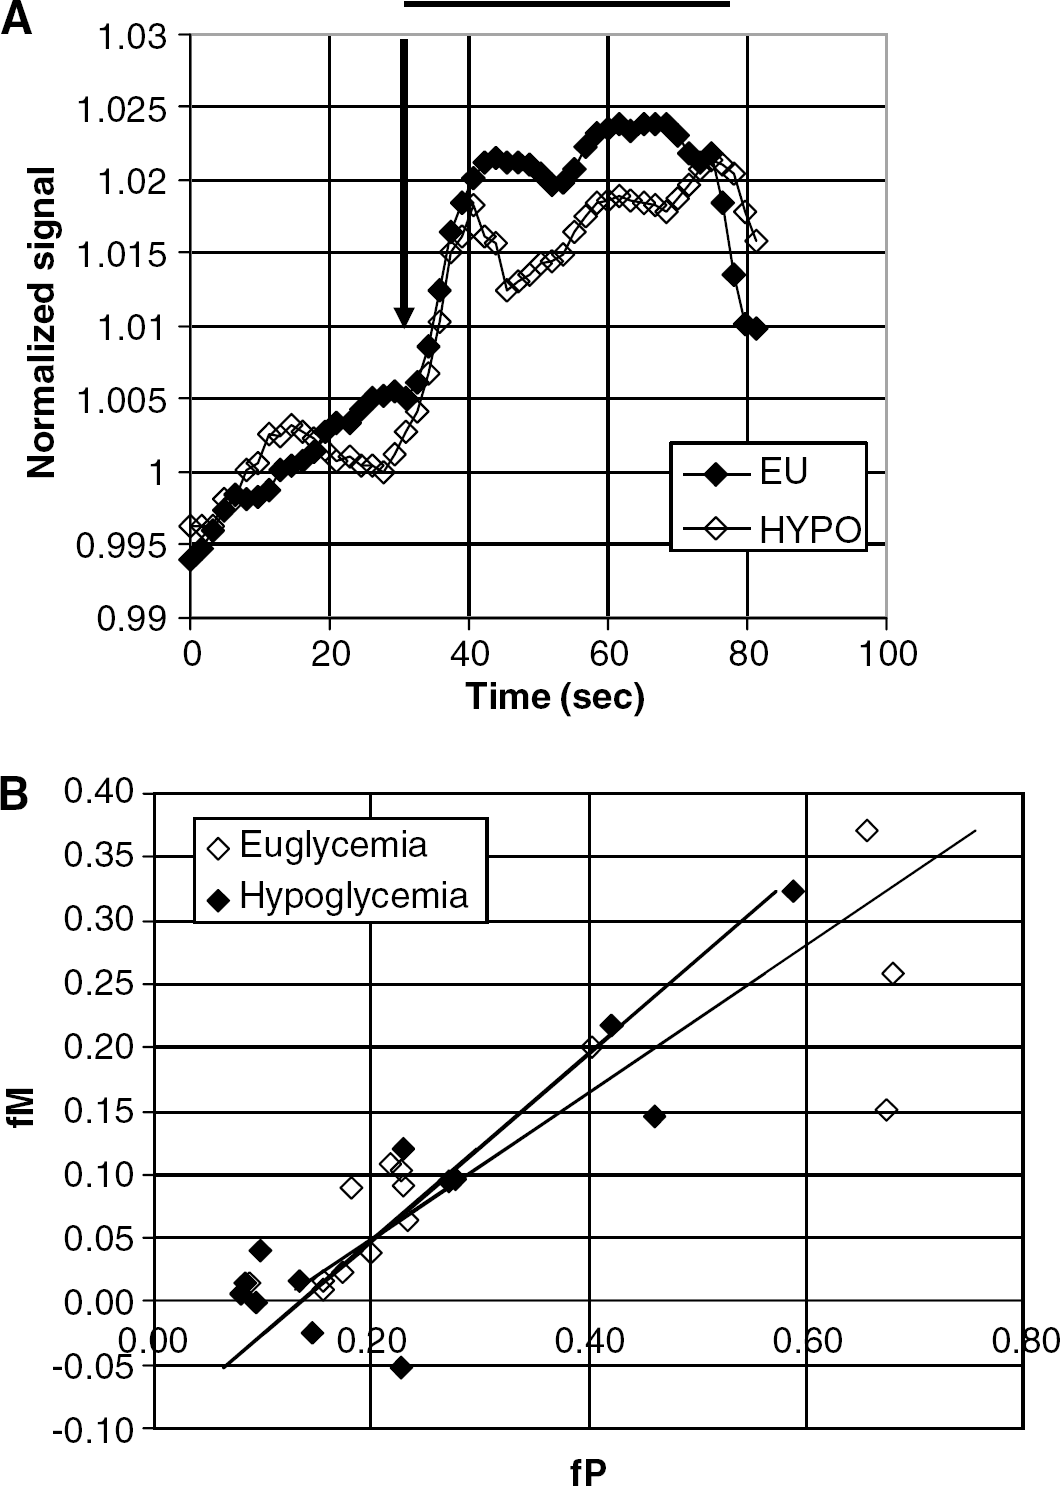
Figure 5A demonstrates the averaged time course of the BOLD fMRI data from a single volunteer. While there is variability in the extent of fractional signal change ΔS/S, the euglycemic case is significantly larger (1.79%±0.60%) in comparison with the hypoglycemic case (1.55%±0.60%). The decrease in BOLD activation during hypoglycemia is statistically significant (P<0.02). Analysis of the R2′ data consistently demonstrated that the calculated metabolism increment associated with the finger tapping remained well coupled to flow (Figure 5B) in all subjects studied. Data are shown using β=1.5, and a linear regression gave a slope of 0.44±0.16 (95% CI), R=+0.87, P<10−4. Similarly, metabolism remained coupled to flow in hypoglycemia, as the calculated metabolism increment correlated with the flow increment with a slope of 0.57±0.20 (95% CI), R=+0.88, P<10−4. The two slopes (relating fP, fM) between euglycemia and hypoglycemia were not significantly different. Consistent with models of flow and positive BOLD response (Buxton and Frank, 1998), the coupling of metabolism to flow (fM/fP) is less than unity.
(
Pooling the data, the average ratio of fM to fP is 0.32±0.17 during euglycemia and 0.23±0.26 during hypoglycemia. These coupling ratios are consistent with several recent estimates of flow metabolism coupling during task activation. For example, using MR, Hoge et al (1999) reported fM/fP ratio of 0.52 for graded visual stimulation while Davis et al (1998) reported an fM/fP ratio of 0.35 using a 12 Hz visual stimulation paradigm. Using PET, Marrett and Gjedde (1997) report an fM/fP ratio of 0.37 with a 4 Hz visual stimulation protocol, while Fox and Raichle (1986) report an fM/fP ratio of 0.1 using somatosensory stimulation in their early PET studies.
Discussion
Cerebral Blood Flow and Metabolism in (Resting) Euglycemia and Hypoglycemia
At baseline, there is considerable variability in flow and metabolism, which is likely a combination of interindividual differences and measurement accuracy. Nonetheless, the present data clearly find an increase in flow in the motor and supplementary motor cortices with mild hypoglycemia, from 56.4±13.6 mL/100 g min (euglycemia) to 64.3±7.6 mL/100 g min (hypoglycemia). As a group, the fractional cerebral perfusion fPe,h increases by 18±23% (P<0.01). Although this is a modest change, it is significant and consistent with the data of Tallroth et al (1992), who reported a 25% increase in perfusion at 2.0 mmol/L plasma glucose levels.
There was no significant difference between the calculated susceptibility contributions to relaxation in nonactivated conditions between euglycemia and hypoglycemia in motor cortex. Given the model of deoxyhemoglobin levels relating to relaxation values (equation (1)), this implies that metabolism and flow remain coupled in the nonactivated hypoglycemic condition, that is, that any HG induced change in metabolism is accompanied by a similar change in flow. Calculation of the group fractional change in oxidative metabolism between the EG and HG state similarly demonstrated interindividual variability, with a mean fractional increase fMe,h of 12.5%±13.8% (t=3.3, P<0.01).
Cerebral Blood Flow and Metabolism in Activated Euglycemia and Hypoglycemia
We found significant increases in blood flow in these motor areas under activated conditions in both euglycemia and hypoglycemia. Notably, there are significant relationships between activated flow and R2′ in both euglycemia and hypoglycemia. That these parameters are experimentally interrelated, provides support for the Renkin–Crone model of oxygen extraction (Renkin, 1959; Crone, 1963; Buxton and Frank, 1998) and the MR-based interpretation of R2′ (from equation (1)). 1 In this model, R2′ would be at least inversely proportional to the change in perfusion, thus characterizing the nonlinear appearance of Figure 4. (Notably, assuming that the activation-provoked perfusion changes are small, an analysis of the perfusion changes with R2′ demonstrates a value for β of 1.86±0.5 (s.e.) in both hypoglycemia and euglycemia, consistent with reported β values (4,5) and that with which we calculated the metabolism changes in Figure 5B.) There was no significant difference in the activated flows between euglycemia and hypoglycemia. Given the increase in basal flow in hypoglycemia, the fractional increase in activated perfusion in hypoglycemia was ∼87% that in euglycemia.
Importantly, the BOLD signal (ΔS/S) measurement is a separate raw experimental value from that of the perfusion. However, as seen in Equation (1), the BOLD signal can be related to basal blood flow and activated flow changes, and thus it is consistent that (in comparison with the perfusion changes) the BOLD signal change between the two conditions was also significantly different (P<0.02). The BOLD signal change measured in hypoglycemia was approximately 13% less than that measured during euglycemia. This decrease is consistent with earlier animal studies of Kennan et al (2000). who used a forepaw stimulation paradigm in hypoglycemia to report a 57% drop in BOLD signal with hypoglycemia at 2.8 mmol/L plasma glucose. With the present measurements of activated and basal perfusion in hypoglycemia, our data suggest that the BOLD signal drop in hypoglycemia is largely a result of the increased basal perfusion (and therefore, decreased fP). The activated perfusion, although suggestive of a decrease with hypoglycemia, was not significantly different in comparison with euglycemia. This is consistent with the report of Powers et al (1996), who observed no change in activated flow in more severe hypoglycemia. Notably, given our measurements and calculations for metabolism changes, the fM was similarly decreased in hypoglycemia. However, because the BOLD signal is heavily dependent on the perfusion signal, the fP dominates giving rise to the significantly decreased BOLD signal.
Possible Caveats
The most relevant caveat present with this study is the use of gradient echoes in the BOLD acquisitions. Much discussion has centered on the potential bias a field echo has on the BOLD signal, with the suggestion that these images are more sensitive to large vessel signal rather than parenchyma. At 4 T, the contribution towards the 31 ms gradient echo signal is a combination of intravascular and extravascular signal (Duong et al, 2003). Thus, although the response of perfusion and metabolism may be difficult to interpret for individual pixels (e.g., located within a large vessel where intravascular BOLD signal contribution may be high yet metabolic effects are small), over a region of interest (ROI), this effect will average to the tissue mean. In this study, the 105±15 pixels were defined by the BOLD-activated territory (see Figure 2) and specifically avoided large visible vessels, but did include parenchyma, venules and surrounding tissue. Nonetheless, it is possible that with spin echo BOLD acquisitions, that the activation provoked ΔS/S may be different, with the calculated pM being uncoupled to pF. In this case, the etiology of the presently reported ΔS/S and pF represents an integrated response over a larger ROI, characterizing average tissue physiology.
Another caveat may be the inclusion of EU → HYPO and HYPO → EU in these data. Tallroth et al (1992) reported that antecedent hypoglycemia results in a prolonged period of increased perfusion, lasting at least 15 mins after restoration of euglycemia. In this context then, the HYPO → EU protocol may be expected to show less of a perfusion difference than the EU → HYPO study. This was not borne out in the present limited dataset (no significant difference between the two groups). Furthermore, the differences between the present protocol and that of Tallroth et al are in the extent of hypoglycemia reached (2.0 versus 3.5 mmol/L) and the duration of the study. The performance of the EU and HYPO phases were spaced by at least 30 mins, more typically 45 mins. The alternative caveat is that magnet acclimation may be affecting the volunteer's cerebral physiology. All volunteers were previously studied in the MR system such that magnet novelty should not be a major issue. Additionally, because all volunteers were withdrawn from the magnet between the two phases of the study, all the data were acquired at roughly the same time after positioning within the magnet, whether in euglycemia or in hypoglycemia. No significant differences were seen between the EU → HYPO and HYPO → EU groups and thus separation of these two groups was not experimentally warranted.
What Changes in Hypoglycemia?
Although the depth of hypoglycemia achieved in the present study was relatively small, we were able to detect a consistent increase in perfusion with hypoglycemia. This may very well be a stress response (Nye et al, 2001). However, in this context, it is also worthwhile to consider the physiology of glucose transport. At ∼17%, the extraction fraction of glucose Eg is neither extremely small nor large (Hasselbalch et al, 1995; Redies et al, 1989), but is close to values where perfusion may become relevant, particularly when plasma glucose is low. Thus, the inward flux rate of glucose Ki may best be described as including both flow and transport components, that is, Ki=Flow Eg=Flow(1−exp(PS/Flow)), where PS is the permeability–surface area product for glucose. In hypoglycemia, as has been suggested by Gomez et al (1992), the increase in blood flow may be regarded as a neuroprotective response to maintain glucose inward flux, which may be effectively similar to a stress response. This response may be regionally dependent, as a very recent report by Teves et al using 15O water PET in mild hypoglycemia (3.0±0.3 mmol/L plasma glucose) indicated that although overall blood flow may have decreased, in the medial prefrontal cortex, blood flow increased, similar to the present data.
The flow measurements, together with the relaxation and BOLD data also imply that throughout the studies, metabolism and flow remain coupled. Notably, elementary task activation was not associated with any consistent larger flow values (which may be hypothesized, given the decrease in plasma glucose). Thus it remains that although hypoglycemia induces an increase in basal perfusion and metabolism, a similar increase was not seen in task activation. It may be that the glucose needs for such an elemental task activation are minimal and that we are unable to detect a specific decrease in activated flow and metabolism, particularly with such mild hypoglycemia. In this case, the physiologic explanation for performance declines may need to be answered by using more demanding activation tasks and will await further study. However, these data do provide a mechanism that may contribute to performance declines in mild to moderate hypoglycemia.
Footnotes
1
The Renkin–Crone model of oxygen extraction E, defining sensitivity to perfusion P is: E(P)=1−1−Eo)Po/P. Basal states are Eo and Po. From ![]() , R2′=kVEβ (V is deoxyhemoglobin blood volume, and β is the magnetic field and capillary sensitive value of 1.5). Thus, R2′=V(1−(1−EoPo/P)β and for small changes in perfusion P (fractional perfusion changes, fP), R2′∼−VK/(1+fP)
β
or −VK(Po/Po+ΔP)
β
where K=ln(1−Eo)
β
.
, R2′=kVEβ (V is deoxyhemoglobin blood volume, and β is the magnetic field and capillary sensitive value of 1.5). Thus, R2′=V(1−(1−EoPo/P)β and for small changes in perfusion P (fractional perfusion changes, fP), R2′∼−VK/(1+fP)
β
or −VK(Po/Po+ΔP)
β
where K=ln(1−Eo)
β
.