
Abstract
The authors previously provided evidence of synchrotron radiation computed tomography (SRCT) efficacy for quantitative in vivo brain perfusion measurements using monochromatic X-ray beams. However, this technique was limited for small-animal studies by partial volume effects. In this paper, high-resolution absolute cerebral blood volume and blood–brain barrier permeability coefficient measurements were obtained on a rat glioma model using SRCT and a CCD camera (47 × 47 μm2 pixel size). This is the first report of in vivo high-resolution brain vasculature parameter assessment. The work gives interesting perspectives to quantify brain hemodynamic changes accurately in healthy and pathological small animals.
Keywords
Introduction
Brain perfusion parameters are highly related to cerebral hemodynamic changes observed in many brain diseases, including brain tumors. Glioma is the most frequent primary brain tumor, with an incidence of 5 to 10 new cases/year per 105 inhabitants (Legler et al, 1999; Wrensch et al, 2002). These tumors are still incurable, despite advances in molecular biology and emerging novel therapies (Behin et al, 2003). Any step further in the comprehension of the tumor mechanisms is crucial for developing new therapeutic approaches. Angiogenesis plays a critical role in tumor growth processes (Folkman, 1995; Reijneveld et al, 2000). The structure and function of tumor neovessels lead to chaotic architecture, irregular and altered blood flow (Carmeliet and Jain, 2000), blood volume, and capillary permeability (Miles, 1999). Cerebral blood volume (CBV), cerebral blood flow (CBF), and blood–brain barrier (BBB) permeability parametric maps provide a powerful tool for assessing glioma grade and focal activity (Aronen et al, 1994), and thus are a key issue in understanding the tumor growth process.
Most of the medical imaging methods have been used to quantify these parameters in vivo. We have recently shown that synchrotron radiation computed tomography (SRCT), using high-flux monochromatic and parallel X-ray beams, is useful for in vivo CBV and CBF assessment (Adam et al, 2003a). The limits of conventional scanners in quantifying attenuation coefficients, and thus contrast agent concentrations in tissues, are mainly due to characteristics of the X-ray tube itself (i.e., source size and shape, intensity variations, limited flux, and wide energy spectrum), leading to intensity drift, scattering of radiation, and beam hardening effects: the three major sources of errors in concentration measurements despite correction methods. It has been demonstrated theoretically and experimentally that monochromatic and parallel X-ray beams presently available only at synchrotron radiation facilities can manage to measure accurately quantitative contrast agent concentrations (Dilmanian et al, 1997; Elleaume et al, 2002). The temporal evolution of the contrast agent concentration, in each voxel of a head slice, is the basic information necessary to derive absolute CBV, CBF, and permeability coefficient values, by using tracer kinetic theories such as bolus injection methods (Meier and Zierler, 1954; Zierler, 1962; Lassen and Perl, 1979). However, the detector spatial resolution is crucial in the plasma tracer concentration appraisal, especially when small animals are imaged, because partial volume effects (PVEs) occur, leading to significant underestimation of concentration values. Partial volume effect correction methods were developed (Cenic et al, 1999; Adam et al, 2003a); however, CBV and CBF measurement accuracy is intrinsically affected by this correction process because of its lack of precision. The weak points of the correction methods are the in vivo measurements of the artery diameters, using a Gaussian fit of the concentration profiles, with a few sampling points. Typically, an error of 0.13 mm for the measurement of a 1.1-mm-diameter vessel leads to slightly more than 25% uncertainty on the PVSF (partial volume scaling factor) and thus on the arterial concentrations. It is even worse for smaller diameters, especially when they are surrounded by structures containing iodine (Adam et al, 2003a).
Preclinical studies are usually carried out on small rodents; thus, important efforts are made by the medical imaging community to obtain high-resolution morphological and functional images in small animals (Kennel et al, 2000; Vaquero et al, 2001; Lewis et al, 2002). Compared with the conventional techniques used in clinical practice, improved spatial resolutions have been achieved.
Our study shows that in vivo accurate CBV and BBB permeability coefficient K1 maps are achievable using a synchrotron X-ray source coupled with a high-resolution CCD detector.
Materials and methods
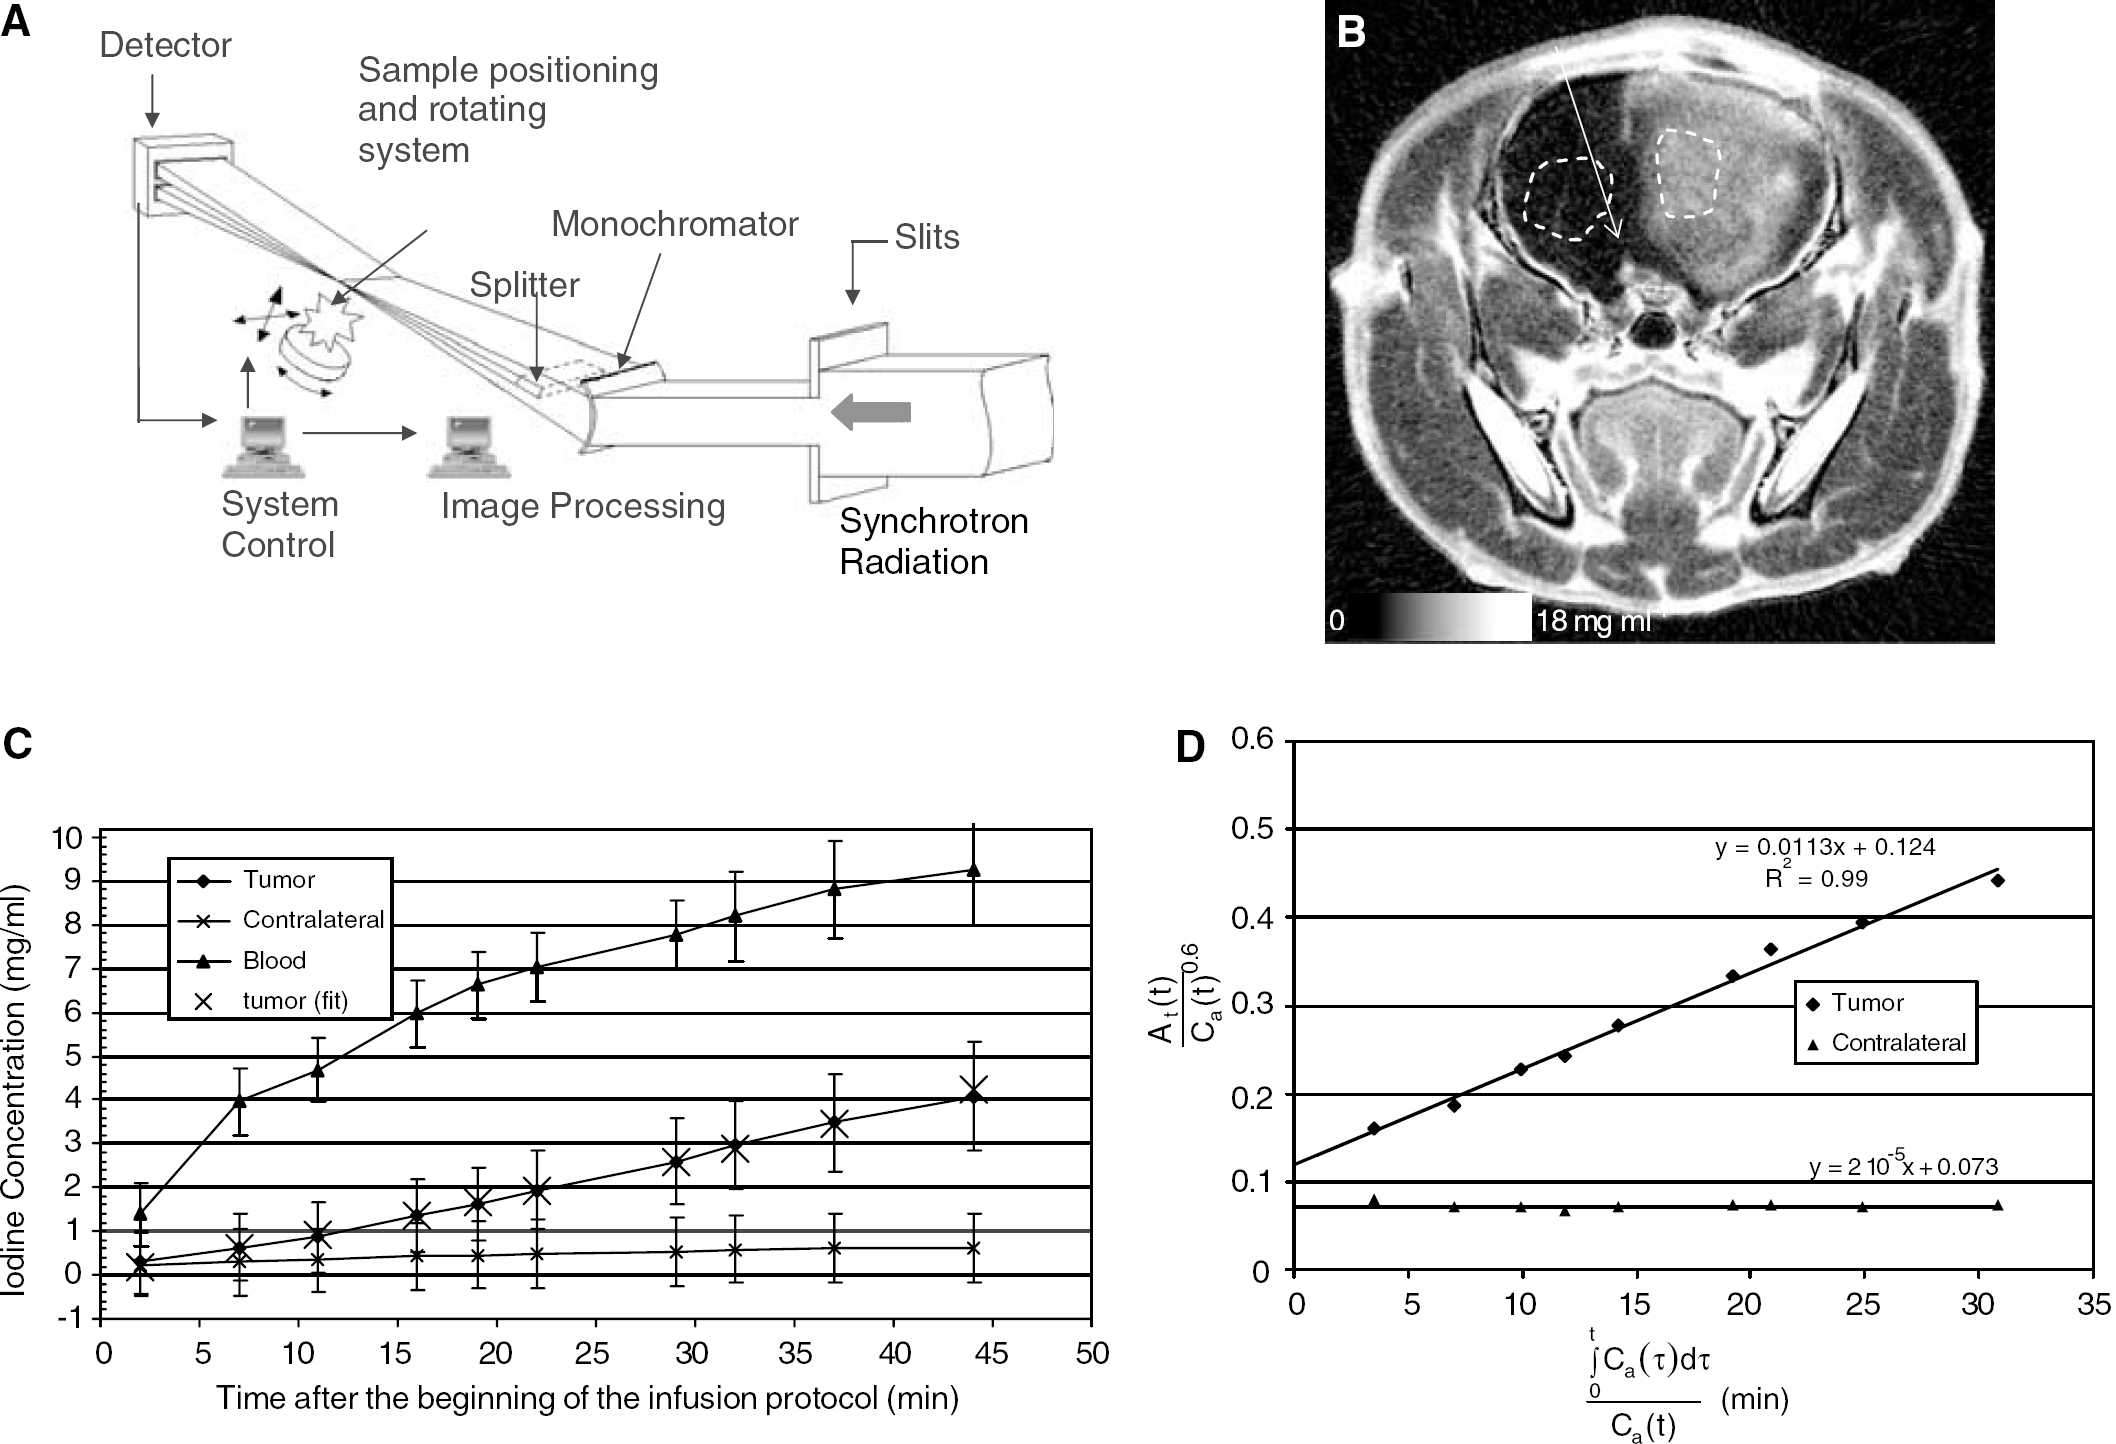
The experiments were performed at the medical beamline of the European Synchrotron Radiation Facility (ESRF). An extensive description of its instrumentation is available in Elleaume et al (1999). The delivered beam intensity was five orders of magnitude higher than the one provided by conventional X-ray sources (Charvet et al, 1998; Elleaume et al, 1999). A monochromator (Suortti et al, 1993) produced a beam bracketing the iodine K-edge energy (33.169 keV). The beam was then split into two beams (150 eV bandwidth), above (33.3 keV) and below (33.0 keV) the iodine K-edge. These beams converged to the positioning system, crossed at the center of the sample (they can be considered as superimposed over the whole sample width), and diverged after the sample to match two distinct lines on the detector, allowing the simultaneous acquisition of attenuation profiles at these two energies (Figure 1A). Synchroton radiation computed tomography slices resolved in accurate and precise absolute iodine concentrations were derived from the logarithmic subtraction of the attenuation profiles acquired simultaneously at two energies above and below the iodine K-edge before filtered backprojection reconstruction. This method has been extensively described elsewhere (Graeff and Engelke, 1991; Dilmanian, 1992; Dilmanian et al, 1997; Elleaume et al, 2002).
(
The detector was a Fast REadout LOw Noise (FRELON) CCD camera developed at the ESRF for applications where high spatial resolution is required. At the active 94 × 94 mm2 input surface, the incoming X-rays were converted to visible light by a standard phosphorus screen. The light was then guided by tapered fiber optics onto the CCD array (2048 × 2048 pixels, reduction factor 3.2:1). By this technique, an effective pixel size of 47 × 47 μm2 was achieved (Bravin et al, 2003).
The F98 tumor model was classified as an anaplastic or undifferentiated glioma and has been described in detail by Barth (1998). One thousand F98 cells in 5 μl of culture medium without fetal calf serum were implanted in the right caudate putamen of an anesthetized male Fisher rat. The imaging procedure was performed at an advanced stage of the glioma. The left jugular vein was catheterized for contrast agent infusion. After the surgical procedures, the rat was installed on a vertical stereotactic frame, which was screwed on a rotation stage and aligned along the axis of rotation in order to perform axial SRCT of the rat head (9 mm above the interaural line). All operative procedures and animal care are in conformity with the Guidelines of the French Government (decree 87-848 of October 19, 1987, license 7593 and A38071).
One SRCT slice was acquired in 18 secs (20°/s), corresponding to 720 projections (1 projection/0.5°; skin entrance X-ray dose 8 cGy/slice). The acquisition protocol was chosen in order to keep the skin entrance dose as low as possible. This dose (8 cGy/slice) is close to the conventional head CT scan dose delivery of 3 to 7 cGy/slice (Nickoloff and Alderson, 2001). After the first image acquisition, a remote-controlled injector (Mark 5®, Medrad Pittsburgh, USA) perfused 6 mL of an iodinated contrast agent (Iomeron®, Bracco, Milan, Italy, C=350 mg/mL) via the left jugular vein in 1 hour (0.1 mL/min). Ten images were acquired during the infusion procedure. This contrast agent was not metabolized and remained in the plasma in the case of an intact BBB or in both the plasma and the extracellular space in the case of a disrupted BBB (Lorusso et al, 1994).
Image reconstruction was performed using a filtered backprojection algorithm. The spatial resolution of the CT slice was 47 × 47 μm2 with a 0.5 mm slice thickness. Because of beam monochromaticity, and after K-edge subtraction, the images were directly expressed in absolute iodine concentration (Dilmanian et al, 1997; Elleaume et al, 2002). The temporal evolution of the contrast agent concentration in each voxel was the basic information necessary to derive brain perfusion maps. The model used for CBV and BBB permeability measurements was a bicompartmental model (Patlak et al, 1983; Groothuis et al, 1990, 1991). Under continuous perfusion during the whole study, the blood iodine concentration remained higher than that present in the tissue; thus, k2 (tissue-to-blood constant) can be neglected (Groothuis et al, 1990). The Patlak unidirectional model (Patlak et al, 1983) was used, considering only K1 (blood-to-tissue constant) and Vp (plasma volume):
At is the tissular iodine concentration in a given voxel and Cp is the plasma iodine concentration in a chosen reference arterial input.
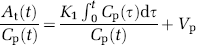
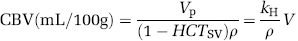
At and Ca, the arterial input concentration, are known quantitatively by SRCT. Figure 1B is an SRCT coronal slice of the rat head (9 mm above the interaural line) expressed in absolute iodine concentration, obtained with the FRELON CCD camera 45 mins after the beginning of the infusion protocol. Figure 1C represents the iodine concentration curves in three regions of interest (ROIs) of the brain: tumor, healthy contralateral, and reference arterial input. The associated standard deviations (s.d.s) are also represented in Figure 1C. The s.d.s remain roughly constants (0.6 to 0.8 mg/mL) for low iodine concentrations. For high iodine concentrations (>7 mg/mL), the s.d. increases at 1.2 to 1.4 mg/mL. The reference arterial input chosen in this study has a diameter of approximately 0.6 mm. The concentration measurements in the input should not be affected by PVE in this case because a 4 × 4 pixel ROI can be selected in the artery (which has a diameter 12 times larger than the spatial resolution), with an s.d. on the average ROI concentration value remaining in the noise level.
Iodine is a plasmatic tracer; thus Cp is underestimated by a factor 1−HCTLV, the hematocrit in large vessels, and we have Cp(t)=Ca(t)/(1−HCTLV).
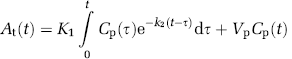
Thus, K=K1/(1−HCTLV) and V=VP/(1−HCTLV) are derived from the linear fit of the At(t)/Ca(t) versus ∫0 t Ca(τ) dτ/Ca(t) curve (Figure 1D).
Finally K1 is obtained by multiplying the slope value obtained by the Patlak plot fit by the factor 1−HCTLV∼0.58. CBV is computed with
where ρ=1.08 g/cm3, kH=(1−HCTLV)/(1−HCTSV)=0.83 is the factor correcting for the haematocrit value; HCTLV and HCTSV are the hematocrit values in large and small vessels, 42% and 30%, respectively (Bereczki et al, 1993a, 1993b), and K1 and CBV are computed for each brain pixel (≈9 × 104 pixels) to build the parametric maps; average values are computed in two ROIs, located in the tumor and in the contralateral brain (Figure 1B).
The bicompartmental bidirectional BBB permeability model (equation (3)) of A(t) is computed for the tumoral ROI and compared with the results obtained with the unidirectional model to verify the reliability of this last model in the present study.
The downhill simplex method was used to solve this three-parameter model by fitting the time activity data, and to find the unknown K1, k2, and Vp values (Press et al, 1988).
Histologic studies were also performed on the F98 rat glioma. Hematoxylin erythrosin safran (HES) histologic slices were used for mitotic activity studies, whereas immunohistologic studies were performed for neovasculature and BBB disruption studies. An anti-type IV collagen antibody (Southern Biotechnology Associates, Birmingham, AL, USA) was used for staining blood vessel basal lamina and thus studying blood vessel architecture and repartition. Another immunolabeling was also performed using a monoclonal antibody to rat endothelial barrier antigen (SMI-71, Sternberger Monoclonals Incorporated, Lutherville, MD, USA). This label is representative of an intact BBB. Detailed explanations on the immunohistologic methods used here (vessels and BBB) can be found in Hsu and Raine (1984).
Results and Discussion
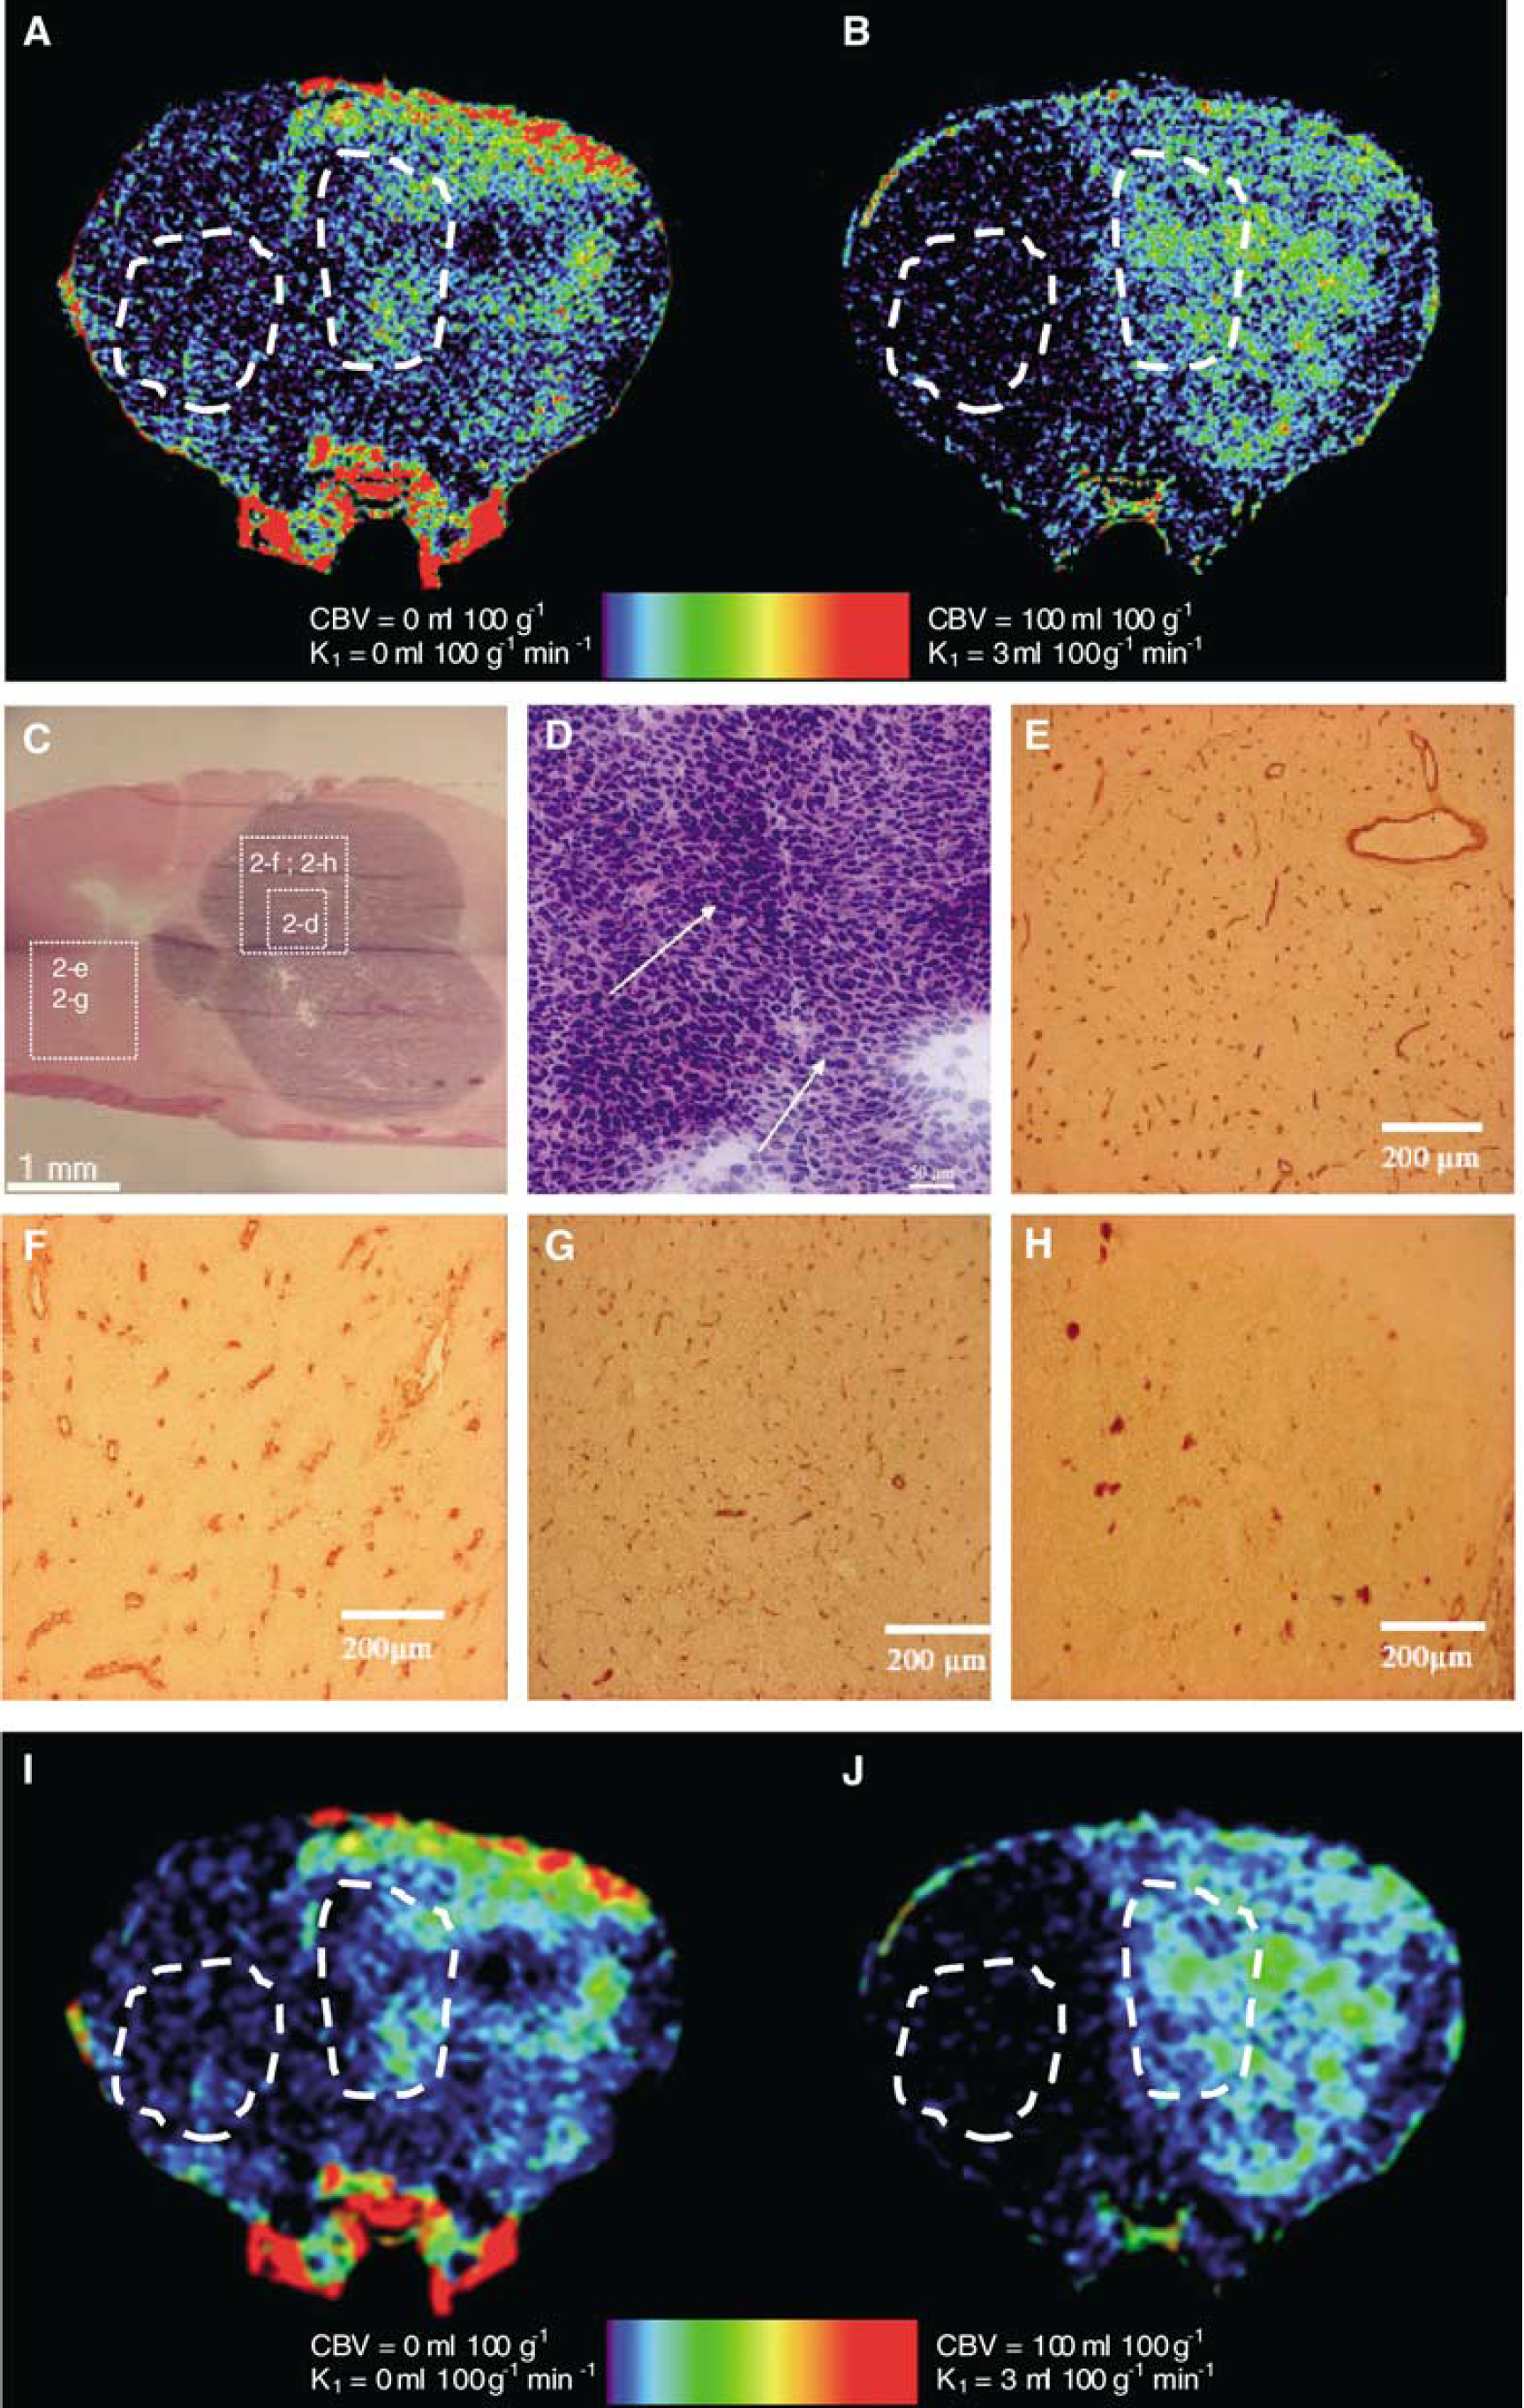
The Patlak curves for the tumoral and contralateral ROI are represented in Figure 1D with the fitted straight lines (R2=0.99 in the tumoral ROI, R2∼0 in the contralateral ROI because K1∼0), suggesting that the unidirectional model is sufficient. The CBV and the K1 quantitative parametric maps are shown in Figures 2A and 2B. Averaged CBV values of 9.22 and 5.6 mL/100 g are found in the tumor and in the contralateral gray matter, respectively. Region of interest K1 values of 0.638 and 0.0012 mL/100 g per min are found in the tumor and in the contralateral gray matter, respectively. The following values were found, using the bi-directional model, confirming the reliability of the unidirectional approximation: K1=0.62 mL/100 g per min; k2=3 × 10⁻⁵/min, and CBV=9.6 mL/100 g. The CBV was measured in seven large vessels and blood sinuses of the skull basis and of the rat head, outside the rat brain, where vessels are large enough to contain 30 to 100 pixel ROIs. Theoretically, the CBVs in these areas are clearly 100% (∼93 mL/100 g, because ρ∼1.08 g/cm3), provided there are no PVEs. However, due to the hematocrit correction factor, which is uniformly applied on the parametric maps, considering tissue voxels and capillary hematocrit, the CBV in pixels fully located in a large vessel becomes 77 mL/100 g. However, one can manually select these pixels and put their value at 100% by manually identifying the large vessels. The measured values in the seven ROIs range between 63 and 77 mL/100 g (mean±s.d.: 71±0.05 mL/100 g). The error (8%) is lower than the noise on concentration measurements (around 15% of the signal).
(
Tumoral CBV values are more than 1.6 times higher compared with the contralateral brain (Figure 1C). These modifications are associated with high mitotic activity and significant vasculature modifications as pointed out by Aronen et al (1994) and are certainly the result of neoangiogenesis (Folkman, 1995; Reijneveld et al, 2000). Histologic studies performed on the F98 glioma model support these assumptions (Figures 2C, 2D). Moreover, type IV collagen immunolabeling on a contiguous slice exhibits important modifications in the vasculature shape when compared with the contralateral brain (Figures 2E, 2F). These histologic modifications are consistent with those previously described in the literature on the F98 glioma model (Seitz et al, 1988; Arosarena et al, 1994; Barth, 1998): a huge increase in vessel size accompanied by a decrease in vessel density (∼100 vessels/mm2 compared with 400 vessels/mm2 in the healthy part of the brain). Increased BBB permeability in the tumor area is shown by the high K1 values, whereas it is negligible elsewhere (Figure 2B). The BBB disruption observed inside the tumor is also consistent with the immunohistologic approach (Figures 2G, 2H) using SMI-71 (Sternberger Monoclonals Incorporated, Lutherville, MD, USA), an antibody directed against rat endothelial barrier antigen (EBA), which is a protein found only when the BBB is intact. A significant decrease in immunoreactivity is observed in the tumor area compared with the healthy contralateral brain: approximately 40% of the vessels are labeled in the tumoral ROI compared with almost 100% in the healthy contralateral ROI (Figure 2C). This labeling decrease, specific to the tumoral area in the brain, is representative of a nonnegligible BBB disruption. Arosarena et al (1994) have found, in a similar immunohistologic approach on the same glioma model, that 35% to 65% of the vessels were labeled. These results are well correlated with the 40% value found in this study.
Cerebral blood volume values lead to controversies in the literature and there is a lack of quantitative values in dynamic CT or magnetic resonance imaging (MRI), especially for small animals. For gray matter in healthy rat brains, quantitative MRI CBV values range from 1.65 to 4.1 mL/100 g, whereas SRCT values are around 2 mL/100 g (Adam et al, 2003a). Dynamic CT healthy gray matter mean CBV values are 1.95 mL/100 g (Cenic et al, 2000) and 4.5 mL/100 g (Hamberg et al, 1996) for rabbits and 5.3 mL/100 g (Muizelaar et al, 1997), 3.7 mL/100 g (Bouma et al, 1998) or 6.8 mL/100 g (Yeung et al, 1992) for humans. The values found in this study for the ‘healthy’ contralateral brain (∼5.6 mL/100 g) are in this order of magnitude, but higher than those found in previous SRCT studies on healthy rats (Adam et al, 2003a) or in dynamic CT on rabbits (Cenic et al, 2000). This may be due to the poor signal-to-noise ratio (SNR) in places where the iodine concentration is low such as in healthy gray matter. Moreover, it raises the question of the ‘healthy’ aspect of the contralateral brain of a glioma that invades the whole right hemisphere. Concerning the absolute quantification of CBV in high-grade gliomas with dynamic CT, the literature is meager; in particular, no CBV data on the F98 glioma were found. Cenic et al (2000) reported a CBV equal to 5.6±1.03 and 3.15±0.85 mL/100 g, respectively, in the center and in the periphery of the rabbit VX2 tumor model. Roberts et al (2000) reported, using the MRI technique, a CBV equal to 5.7±3.5 and 7.4±4.5 mL/100 g, respectively, in grade III and grade IV human brain tumors. Our values (∼9 mL/100 g) are consistent with these values. However, this comparison of absolute values is slightly hazardous because the tumor and the hosts are different, which could explain the differences. When studying the increase of the CBV in the tumor regarding the contralateral brain, we found a ratio of 1.68. This is consistent with high-grade glioma literature values, which vary from 1.5 to 2.8, depending on the tumor, host, and area studied.
Concerning K1, it is difficult to compare our values with quantitative data obtained with autoradiography or in vivo techniques, because the molecular weight of the molecules used is different from one study to another and so are the K1 values. There is also a lack of data for the F98 glioma model. However, K1 (0.63 mL/100 g per min) values obtained in the tumoral ROI in this study fit well with those measured with MRI (1.1 to 1.5 mL/100 g per min) with a similarly sized molecule (Iomeron, ∼700 Da; Gd-DTPA, ∼500 Da) (Schmiedl et al, 1991; Kenney et al, 1992) for the 36B-10 rat glioma model. The difference could be explained by either the molecule size difference or the tumor model, which is not the same. Permeability measurements using 14-C[AIB] (size ∼104 Da) autoradiography, published by Groothuis et al (1983) and Molnar et al (1999) on the RG2 rat glioma model, show K1 values of around 4 mL/100 g per min, but the molecule is significantly smaller than the Iomeron.
The SNR is a delicate issue in high-resolution perfusion studies using SRCT. The background noise level was assessed as the interpixel s.d. in large ROIs (105 pixels) located outside the rat head, on each image, where no signal is detected. This noise (0.6 to 0.8 mg/mL of iodine) is 10 times higher than in previous absolute perfusion measurement studies using SRCT at lower resolution (0.35 mm, noise ∼60 μg/mL) (Adam et al, 2003a). This additional noise is mainly due to the rotation axis wobbling (wobbling noise), which is detected because of the small pixel size, and to the readout noise of the CCD camera. These two issues have to be addressed for lowering the noise to the level of the lower-resolution studies. The wobbling noise could be reduced by using a high-precision rotation stage, whereas the readout noise could be significantly reduced by using a high-speed rotating chopper allowing stroboscopic imaging with the CCD illuminated only during the integration time. The common part of the noise in high- and lower-resolution SRCT imaging is mainly due to the photonic noise and the filtered backprojection reconstruction process. The photonic statistical counting can also be optimized to reduce the noise in the images, by either increasing the exposure time (slow rotation speed) or the photon flux, resulting in an increased X-ray dose delivered to the rat brain. In this study, we wanted to show that absolute CBV values are achievable at very high resolution and with a relatively low X-ray dose (skin entrance X-ray dose equal to 8 cGy/slice). For radiation therapy preclinical studies using this method, this aspect is essential (Adam et al, 2003b).
Even if the noise is high, in areas where the SNR is >3 (i.e., the iodine concentration is >2.4 mg/mL), this resolution is useable. In particular, the high resolution is crucial for measuring Cp in the reference arterial input, without suffering from PVE. In the arterial input, SNR > 3 from the sec sampling point to the end of the sampling protocol. The uncertainty in the concentration measurements is in the range 10% to 24% (average: 15%) for concentrations higher than 5 mg/mL, which is usually the case in blood vessels. The uncertainty decreases as the concentration increases. This error is lower than when using correction methods, and could be significantly decreased by using higher X-ray doses and by set-up optimizations as discussed previously. The high resolution is also useable in high-contrast areas, such as those observed in the tumor, where the BBB is disrupted. Another way of improving the SNR is to increase the signal. It is possible by using a bolus technique for measuring the perfusion, since the iodine concentrations reached during the first passage are higher. For this, another technical step has to be addressed: the acquisition time of the detector. A smoothed version of the parametric maps is added (Figures 2I and 2J). Both maps were smoothed with a Gaussian filter (7 × 7 kernel, Gaussian standard deviation: 1.7) to retrieve 350 μm pixel size equivalent images. On these images, the noise level is equivalent to that present in lower-resolution parametric maps (Adam et al, 2003a). However, by smoothing the images, the benefit of high resolution for avoiding PVE is lost and the identification of fine structures (Figures 1B, 2A and 2B) is more difficult.
There are ongoing efforts to build devices dedicated to in vivo small-animal imaging: micro-PET (Myers, 2001), micro-MRI, and micro-CT scanners (Kennel et al, 2000; Vaquero et al, 2001). Despite the fact that PET is the gold standard for quantitative brain perfusion imaging (Phelps et al, 1982), the micro-PET resolution is still unsatisfactory (1 × 1 mm2). Micro-MRI and micro-CT provide a higher spatial resolution (0.8 × 0.8 mm2 and 70 × 70 μm2, respectively) but are not quantitative for perfusion imaging (Adam et al, 2003a). Moreover, more than 6 mins per image are needed for micro-CT acquisitions (X-ray dose: 60 cGy).
Synchrotron radiation high-flux CT allows a higher spatial resolution for in vivo imaging (47 × 47 μm2), within a shorter acquisition time and a reduced X-ray dose: 18 secs, 8 cGy. Beam monochromaticity and the K-edge subtraction technique provide precise and accurate in vivo contrast agent concentration measurements (Elleaume et al, 2002) even for organs in movement such as lungs (Bayat et al, 2001) or heart (Elleaume et al, 2000).
The feasibility of high-resolution CBV and BBB permeability measurements on rats bearing glioma using quantitative SRCT is shown here. This study (n=1) provides no information on the run-to-run variability of the method. The run-to-run variability measured at lower spatial resolution on 7 rats is less than 25% for the CBV values and less than 15% for the CBF values (Adam et al, 2003a). One cannot predict the run-to-run variability in high-resolution SRCT. The statistical variability in the low-resolution imaging protocols is mainly due to errors induced by the PVE corrections and the artery diameter measurements imprecision. The high-resolution images should avoid PVE, but the noise is 10 times larger than in low spatial resolution. However, the errors on arterial concentration measurements are lower in high-resolution SRCT than when using PVE correction methods, so we can expect a lower run-to-run variability. Moreover, replication would lead to a study of the F98 glioma model itself in terms of blood volume and permeability, and the variability of the method could be hidden behind the intrinsic tumor model variability. Statistical analysis of brain vasculature parameters for a given tumor model is another complete study and not in the scope of this one, showing a complete new set-up to measure CBV and BBB permeability. To our knowledge, this is the first report of in vivo CBV and K1 imaging with such a spatial resolution, opening interesting perspectives for small-animal morphological and functional imaging. This technique is particularly useful for pathophysiologic brain studies involving hemodynamic changes, such as new treatment follow-up, where preclinical trials are usually performed on small rodents.
Footnotes
Acknowledgements
The authors are indebted to the ESRF medical beamline for providing the necessary beamtime and technical assistance in all the steps of the experimental studies. Special thanks to C Rémy and R Farion (INSERM U594) for the help with histological studies.