
Abstract
This study aimed at combining an iron-based, steady-state, vessel size index magnetic resonance imaging (VSI MRI) approach, and a gadolinium (Gd)-based, dynamic contrast-enhanced MRI approach (DCE MRI) to characterize tumoral microvasculature. Rats bearing an orthotopic glioma (C6, n=14 and RG2, n=6) underwent DCE MRI and combined VSI and DCE MRI 4 h later, at 2.35 T. Gd-DOTA (200 μmol of Gd per kg) and ultrasmall superparamagnetic iron oxide (USPIO) (200 μmol of iron per kg) were used for DCE and VSI MRI, respectively. C6 and RG2 gliomas were equally permeable to Gd-DOTA but presented different blood volume fractions and VSI, in good agreement with histologic data. The presence of USPIO yielded reduced Ktrans values. The Ktrans values obtained with Gd-DOTA in the absence and in the presence of USPIO were well correlated for the C6 glioma but not for the RG2 glioma. It was also observed that, within the time frame of DCE MRI, USPIO remained intravascular in the C6 glioma whereas it extravasated in the RG2 glioma. In conclusion, VSI and DCE MRI can be combined provided that USPIO does not extravasate with the time frame of the DCE MRI experiment. The mechanisms at the origin of USPIO extravasation remain to be elucidated.
Keywords
Introduction
Assessing angiogenesis is of considerable interest when determining tumor grade and prognosis (Burger et al, 1985; Daumas-Duport et al, 1997). In clinical practice, angiogenesis is assessed in terms of microvessel density as determined on surgical biopsies (Takei et al, 2007). This approach is limited by how accurately the biopsy can sample a highly heterogeneous vascular environment commonly found in high-grade tumors. Necrotic areas exhibit sparse and degraded vessels, whereas angiogenic areas are characterized by high vessel density (Carmeliet and Jain, 2000), large vessel diameters (Brown et al, 2001), and increased permeability. In vivo imaging methods that enable noninvasive, three-dimensional monitoring of microvasculature, therefore, present a major interest for tumor management (Hou et al, 2006). Also, there is currently a strong need for imaging surrogate markers of angiogenesis (Gagner et al, 2005).
Magnetic resonance imaging (MRI) is one of the most promising techniques to provide such markers. It is considered the method of choice for diagnosing brain tumors, providing information about tumor size and location, extent of edema, relative blood volume fraction (BVf), and blood–brain barrier (BBB) status. For characterization of brain microvasculature, the most widely used MRI method is dynamic susceptibility contrast imaging. With this method, the first pass of an intravenous injected bolus of a gadolinium (Gd)-based contrast agent (CA) is monitored (Barbier et al, 2001). Then, information on blood volume, blood flow, vessel size, and CA arrival and transit times can be derived. If extravasation of the CA is monitored using dynamic contrast-enhanced MRI (DCE MRI), the status of the BBB can be evaluated (Tofts et al, 1999). With brain tumors, the accuracy of the parameters derived from dynamic susceptibility contrast MRI may be affected because of alterations of the BBB (Schmainda et al, 2004). Steady-state methods to characterize blood volume are an alternative to dynamic susceptibility contrast MRI. They rely on the changes in the transverse relaxation times because of an intravascular iron-based CA (ultrasmall superparamagnetic iron oxide, USPIO) and do not require the estimation of the arterial input function (AIF). With this approach, it is possible to estimate BVf and to obtain information on the distribution of microvessel radii (Dennie et al, 1998; Kiselev et al, 2005; Pathak et al, 2001; Schmainda et al, 2004; Troprès et al, 2004). The latter information—an approximation of the mean vessel radius—can be expressed in terms of vessel size index (VSI, in μm) (Kiselev et al, 2005; Troprès et al, 2004). Magnetic resonance imaging mapping of VSI has been validated in various animal models (Ferretti et al, 2005; Troprès et al, 2004; Valable et al, 2008). In humans, VSI and BVf have been mapped using Gd chelates rather than USPIO (Batchelor et al, 2007; Kiselev et al, 2005; Schmainda et al, 2004).
Because steady-state MRI acquisitions do not require rapid temporal sampling, BVf and VSI maps can be obtained with high spatial resolution. Moreover, the steady-state approach does not require measuring the AIF, and it is relatively insensitive to alterations of the BBB. These features render the steady-state method particularly suited to characterizing microvasculature during tumor growth and to assessing the efficacy of antiangiogenic or antivascular or both therapies in animals. However, the steady-state approach does not provide an estimate of the BBB permeability, a key parameter in brain tumor characterization and in monitoring therapeutic effects (Batchelor et al, 2007; Gossmann et al, 2002). We, therefore, addressed the question of whether we could combine a steady-state approach—to assess BVf and VSI using an iron-based CA—with a DCE MRI approach—to evaluate the BBB status using a Gd-based CA.
In designing this study, we had two objectives: (1) to combine the two approaches into a single imaging protocol, and (2) to assess to what extent the intravascular presence of an iron-based CA affects parameters derived from DCE MRI.
We evaluated two glioma models (C6 and RG2) using both the combined protocol (USPIO and Gd) and the DCE MRI-only protocol (Gd).
Materials and methods
Animal Preparation
Experiments were performed under permits no 380521 (for one of the researchers involved), A3851610004 (for the experimental facility), and B3851610003 (for the animal care facility) from the French Ministry of Agriculture. All experiments were performed under anesthesia with the following parameters: 5% isoflurane for induction, 2% for maintenance in 60% air/40% oxygen. Rectal temperature was maintained at 37.0°C±0.5°C throughout the experiments using a water blanket.
C6 and RG2 glioma models were used as orthotopic brain tumor models. Male Wistar rats (175 to 200 g, n=14) for the C6 model and male Fischer 344 rats (150 to 175 g, n=6) for the RG2 model were placed onto a stereotactic head holder and a scalp incision was performed along the median line. A 1 mm diameter burr hole was drilled in the skull, 3 mm laterally to bregma. A 5 μL cell suspension (1.105 C6 cells (ATCC, CCL-107) or 5.103 RG2 cells (ATCC, CRL-223) in phosphate-buffered saline complemented with 2% of glutamine and 1% of penicillin streptomycin) was injected in 5 mins into the right caudate nucleus, at a depth of 6 mm under the skull, using a Hamilton syringe. The needle was slowly removed 5 mins after the injection and the burr hole was plugged with vegetal wax. Mean survival times were 28±5 and 22±3 days for the C6 and RG2 models, respectively (Valable et al, 2008).
For each imaging session, a catheter was inserted into the tail vein for CA administration. At the end of the second imaging session (cf. MRI), each animal was killed and the brain was excised and frozen for histologic study.
Magnetic Resonance Imaging
Experiments were performed on a 2.35 T, 40 cm diameter horizontal bore magnet (Bruker, Wissenbourg, France) equipped with a 20 cm diameter actively shielded gradient system (Magnex Scientific Ltd, Oxford, UK) and interfaced with an SMIS console (SMIS Ltd, Guildford, UK). Maximum gradient strength and slew rate were 96 mT/m and 128 T/m per sec, respectively. The MR probes (RAPID Biomedical GmbH, Rimpar, Germany) consisted in a volume coil for emission and a surface coil for reception. Both coils were linearly polarized; they were both geometrically and actively decoupled. Each imaging session started with tumor localization, using a T2-weighted spin-echo sequence (TR/TE=2,000/80 ms, field of view=30 mm, matrix=256 × 192, 19 slices, slice thickness (ST)=1 mm). The slice containing the largest homogeneous tumor (i.e., without necrotic cores to avoid Gd-DOTA encapsulation) area was selected for imaging with ensuing sequences.
Experiment A: Does the Presence of USPIO Affect DCE MRI Estimates?
The plasmatic half-life of Gd-DOTA (∼30 mins in rats) is significantly shorter than that of USPIO (∼4 h 30 mins in rats). If DCE MRI were performed before BVf/VSI MRI, the intravascular and tissular concentrations of Gd-DOTA would not be stable enough during the 25-min-long BVf/VSI protocol. Conversely, the plasmatic concentration of USPIO can be considered stable during the realization of a 30-min-long DCE MRI protocol. Thus, in the combined protocol, the BVf/VSI measurements were performed before the DCE measurements.
Each animal was imaged twice a day, 14 days after tumor implantation. During the first session, only the DCE MRI protocol was performed. During the second session, the animal underwent first the BVf/VSI protocol and then the DCE MRI protocol (combined protocol; Figure 1). A 4 h delay between the two imaging sessions allowed clearance from the tumor of the Gd-DOTA injected during the first session (Fonchy et al, 2001).
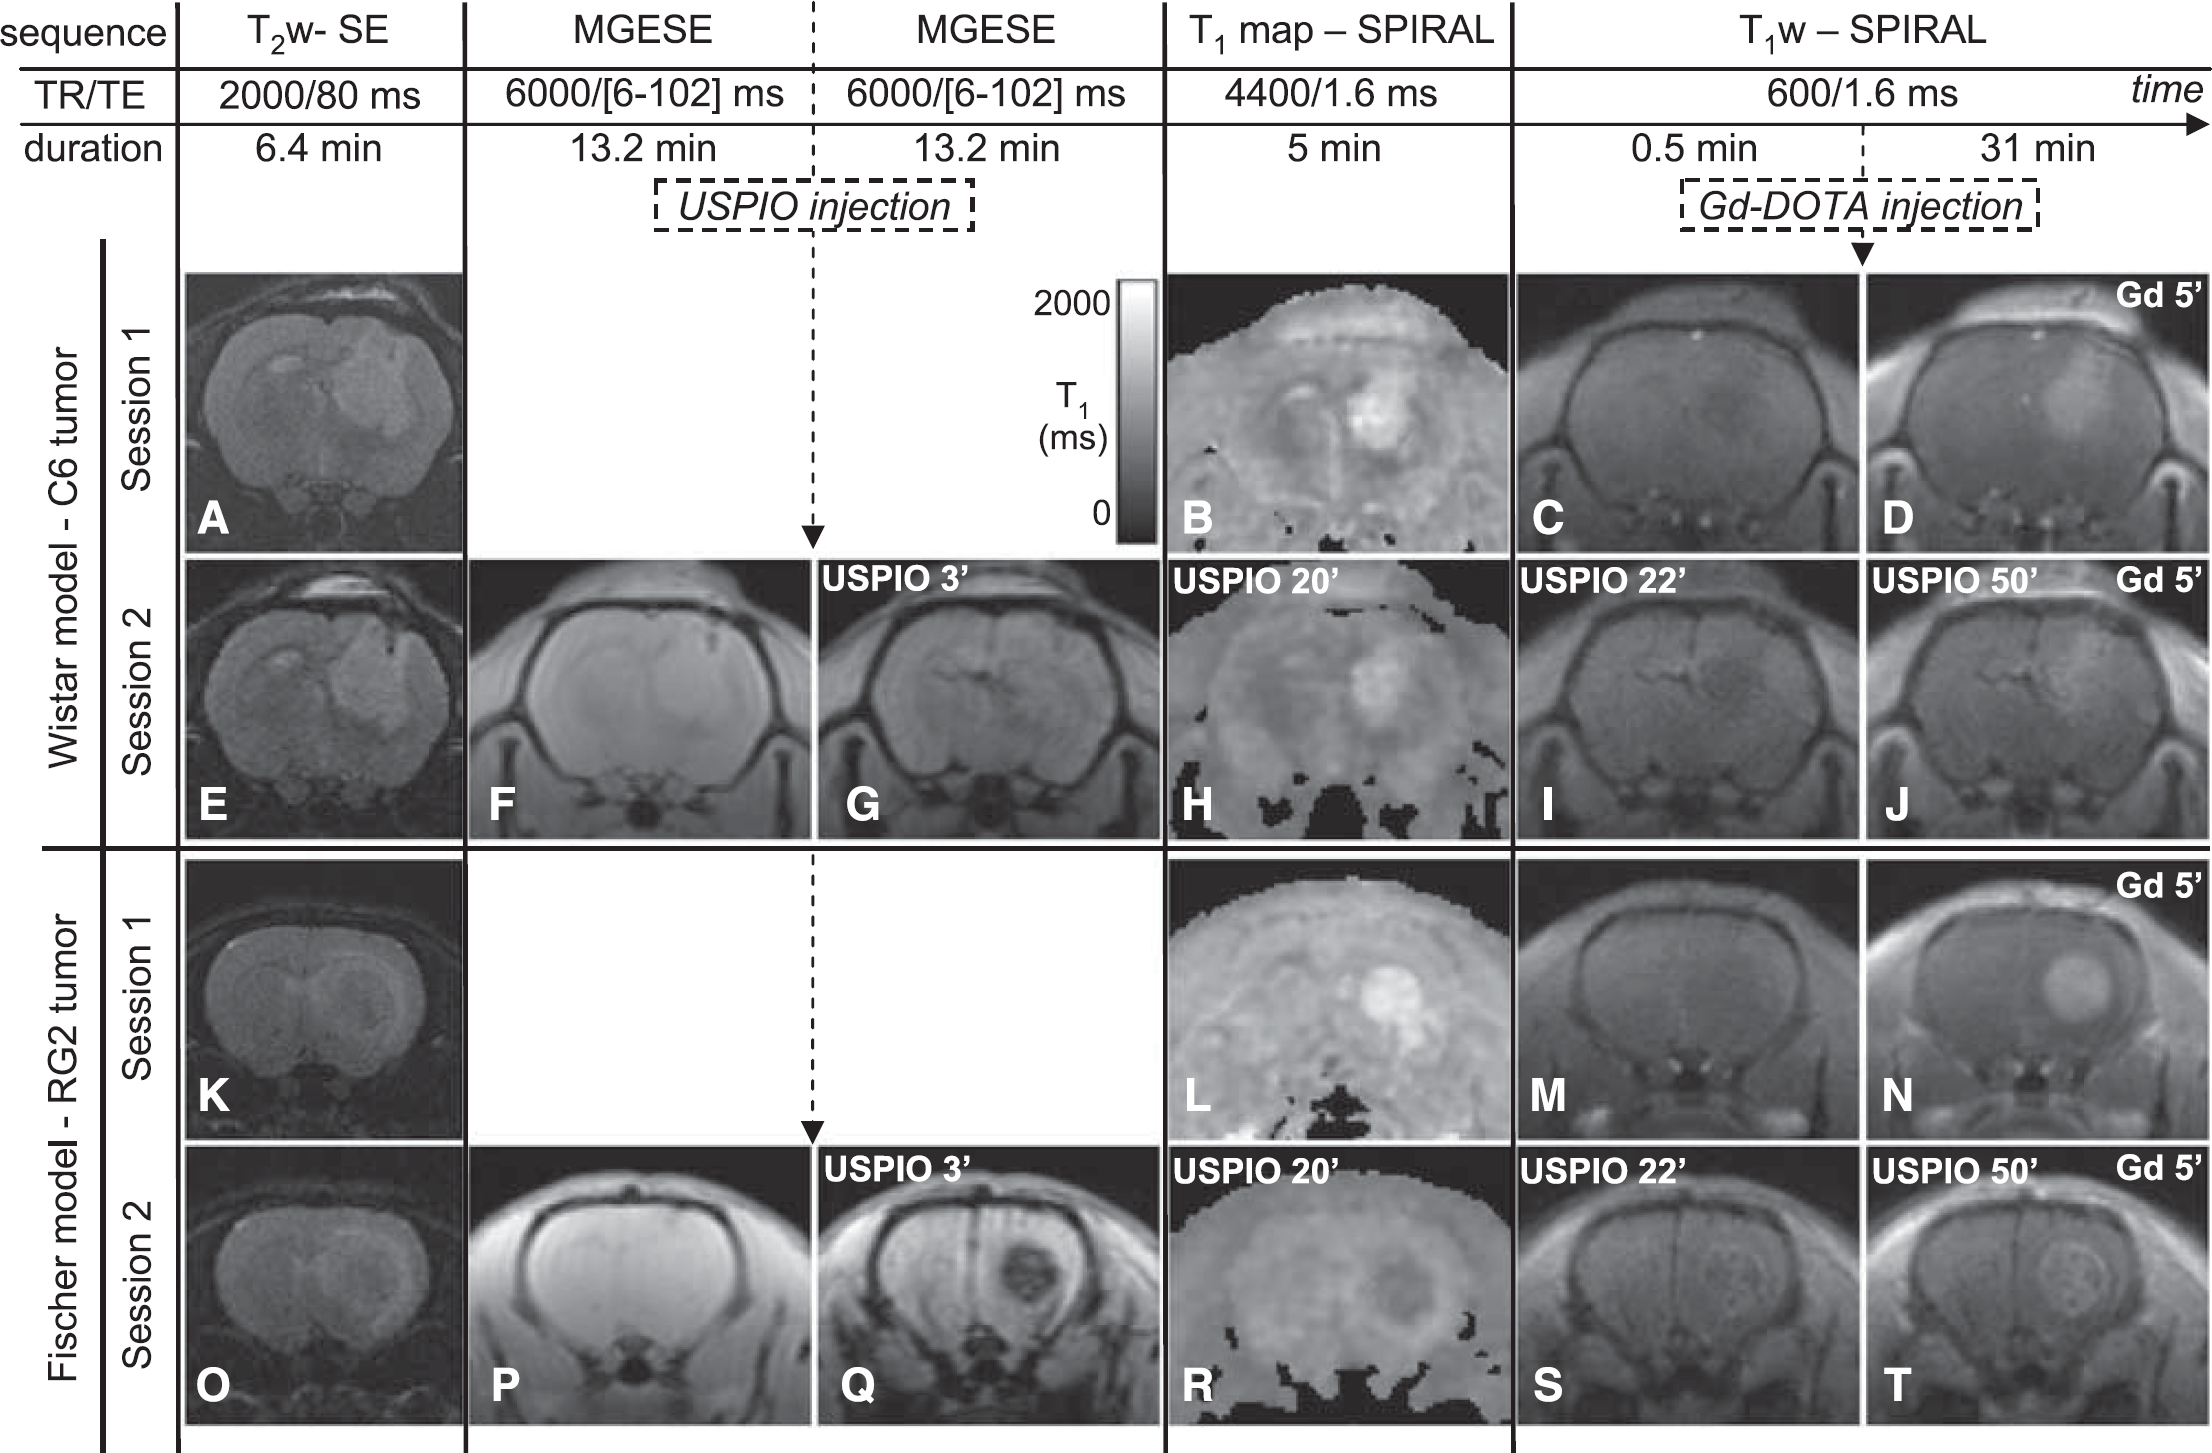
Protocol combining a BVf/VSI experiment with a DCE MRI experiment and images obtained at each stage of the protocol. The chronogram of MRI protocol for Experiment A is presented at the top of the figure. The names of the sequences, their respective TR, TE and durations, and the CA injections are indicated. Note that the MRI protocol of Session 1 is the same as the MRI protocol of Session 2 except that the two MGESE sequences and the injection of USPIO are missing. (
Steady-State BVf/VSI MRI: For the steady-state approach, we used USPIO (Sinerem, Guerbet, France/Combidex; AMAG Pharmaceuticals Inc., USA; diameter 30 nm, longitudinal relaxivity r1=8 L/mmol per sec, transversal relaxivity r2=89 L/mmol per sec (37°C and 2.35 T)). As in previous studies, a multigradient-echo and spin-echo MRI sequence (TR=6 secs, seven evenly spaced gradient-echoes (GE)=6 to 42 ms, 1 spin-echo=102 ms, voxel size=234 × 454 × 2,000 μm3) was acquired just before and 3 mins after manual administration of USPIO (200 μmol of iron per kg body weight, through the tail vein in approximately 20 secs) (Troprès et al, 2004; Valable et al, 2008).
DCE MRI
For the DCE MRI, we used a low molecular weight Gd-based CA, Gd-DOTA (Dotarem, Guerbet, France; diameter 1 nm, r1=3.4 L/mmol per sec (37°C and 2.35 T)). A baseline T1 map was derived from variable density spiral measurements (Kim et al, 2003) performed at different delays from a preparation inversion pulse (11 inversion times (TI), TR/TE=4,400/1.6 ms, flip angle=90°, acquisition time per interleaf (Tacq)=11.7 ms, five interleaves, field of view=30 mm, matrix=64 × 64, ST=2 mm). Then, a set of T1-weighted (T1w) images were acquired sequentially using a variable density spiral sequence (TR/TE=600/1.6 ms, flip angle=90°, Tacq=10.4 ms, 16 interleaves, field of view=30 mm, matrix=128 × 128, ST=2 mm). After the acquisition of five baseline images, a long bolus of Gd-DOTA was administered into the tail vein (200 μmol of Gd per kg, 12 mL/h, entire dose injected within 30 secs for a 250 g rat). Images were sampled every 9.6 secs during the initial 5 mins and every 19.2 secs subsequently (time span covered: 32 mins).
Experiment B: Does USPIO Remain Intravascular During the DCE MRI Protocol?
To evaluate whether the USPIO remained intravascular over the time span of the combined protocol, we performed a DCE MRI-like experiment on four additional animals (two C6- and two RG2-bearing animals were imaged 18 and 14 days after tumor implantation, respectively). The DCE MRI protocol was applied as described above (acquisition of a baseline T1 map followed by a set of T1w images), but the overall time span covered was extended to 120 mins. After the acquisition of five T1w baseline images, USPIO (200 μmol of iron per kg body weight) was injected similarly as the Gd-DOTA.
Histology
Frozen brain tissue was cut with a cryostat (ST=10 μm). Five coronal slices were generated per animal. After fixing in methanol/acetone (50%, v/v) and washing in tap water for 5 mins, one slice was stained with hematoxylin–erythrosine (nucleus and cytoplasm staining, respectively). Two slices were used for highlighting vessel and BBB integrity, using type IV collagen (against basal lamina) and rat BBB antibodies (i.e., against an endothelial protein found in areas with blood–brain or blood–nerve barriers), respectively. Slices were rehydrated in phosphate-buffered saline (0.01 mol/L) and fixed in 4% paraformaldehyde. After saturation in phosphate-buffered saline-Tween 0.01%-BSA 3% for 30 mins at room temperature, a goat antibody against collagen IV (Southern Biotech, Birmingham, AL, USA; ref. 1340-01, 1/2000) and a mouse antibody against rat BBB (Covance, Princeton, NJ, USA; ref. SMI 71R, 1/500) were incubated overnight at 4°C in phosphate-buffered saline-Tween 0.01%-BSA 1%. Revelation used an Alexa-546-linked donkey anti-goat IgG (Invitrogen, Cergy-Pontoise, France; ref. A11030, 1/200) and an Alexa-488-linked donkey anti-mouse IgG (Invitrogen; ref. A21202, 1/200). The last two slices were labeled with ED1 (AbCys, Paris, France; ref AbC117-6714, 1/2000), an antibody directed against a membrane receptor CD68 present on rat macrophage lysosomal membrane. Nucleus counterstaining was performed using 4′,6′-diamidino-2-phenylindole (DAPI).
Data Processing
All operations described in this section were performed on a pixel-wise basis using in-house programs developed in Matlab 7 (The MathWorks Inc., Natick, NA, USA). Pixels with an intensity below 5% of the image maximum (on raw data) were excluded from the processing. Note that this threshold was used to remove background pixels. All pixels originating from tissues of interest were kept in the analysis. All model-fitting procedures (for T2∗, T1, and pharmacokinetic parameters determination) used a Levenberg–Marquardt algorithm.
BVf/VSI Experiment
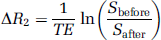
T2∗ was computed from the seven GE images acquired before (T∗2before) and after (T∗2after) USPIO injection by fitting a monoexponential function to the signal decay. Then, ΔR2∗=1/T∗2after−1/T∗2before was calculated. ΔR2 was derived from the two spin-echo signals, acquired before (Sbefore) and after (Safter) USPIO injection:
BVf and VSI were obtained as described by Troprès et al (2004):
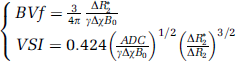
where γ is the gyromagnetic ratio, B0 the static magnetic field, Δχ the increase in blood magnetic susceptibility because of the USPIO, and ADC is the apparent diffusion coefficient of water. We used Δχ=0.57 10−6 CGS units and ADC=720 μm2 per sec for RG2 tumor, muscle and contralateral cerebral tissue, and ADC=974 μm2 per sec for C6 tumor (data previously measured in similar experimental conditions; Valable et al, 2008).
DCE MRI
Variable density spiral MR data were first corrected for nonidealities of the spiral k-space trajectories (Beaumont et al, 2007). They were then interpolated onto a Cartesian grid (128 × 128) using linear gridding and zero filling, where appropriate. T10 (reference T1 value) was estimated by fitting the following model function to the data:

where M0, c, and T10 are the adjustable parameters to be estimated. M(TI) is the signal at inversion time TI, M0 the equilibrium signal, and c a constant accounting for nonidealities of the inversion pulse. T1w signal intensities S were converted into T1 values using:
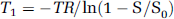
where S0 is the fully relaxed MR signal intensity. S0 was obtained from the baseline signal intensity (Sbaseline) and T10:
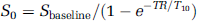
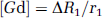
Gd-induced changes ΔR1 (i.e., 1/T1−1/T10) were converted into Gd concentrations ([Gd]), using the Gd-DOTA relaxivity r1 measured in water (we made the approximation that r1 was constant in the different tissues):
Data from Experiment B (DCE MRI using USPIO) were processed similarly, but they were not converted into CA concentrations. Thus, only USPIO-induced changes ΔR1 were obtained in this case.
To derive pharmacokinetic parameters from Experiment A (Gd-based DCE MRI), an AIF is required. Because of the loss of linearity between MR signal and CA concentration at high concentration values, and because of partial volume effect, we were not able to obtain the AIF directly from the DCE MRI data. We used a reference AIF based on arterial blood sampling, as previously determined in the laboratory. The reference AIF increases linearly (tracer injection as a long bolus) and then decays biexponentially (tracer clearance). The reference AIF, or Cp(t), is fully characterized by the following equation:
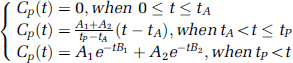
where tA and tP are the arrival time and the time to peak, respectively. The amplitudes are A1=1.94 mmol/L and A2=0.76 mmol/L, and the time constants are B1=1.01 min−1 and B2=0.03 min−1. tA and tP were estimated for each rat and each DCE MRI experiment using an automated procedure.
DCE MRI pharmacokinetic parameters were estimated by fitting the model function Ct(t) to the evolution of [Gd] over time (Tofts et al, 1999):
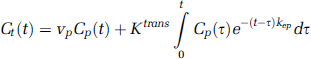
where vp (plasma volume fraction), Ktrans (volume transfer constant between blood plasma and extravascular extracellular space (EES)) and kep (flux rate constant between EES and plasma) were the adjustable parameters. Then, ve (EES volume fraction) was calculated:
Note that although BVf and vp both represent the plasma volume fraction, they arise from two different physiologic models.
Histology
Histologic data from twelve animals (six C6 and six RG2; other brains were not available) were quantitatively analyzed. Sections (up to three fields of view per region of interest (ROI) and per slice, three slices per animal) were digitized using a CCD camera (Olympus, Rungis, France). Collagen IV images were binarized (threshold manually defined) and vascular parameters (mean vessel density, fractional vascular surface (VSurf), mean vessel radius (r), and mean vessel length (h)) were obtained using ImageJ software (Rasband, WS; ImageJ, National Institutes of Health, Bethesda, MD, USA). To allow comparison between MR data and histologic data, VSIhisto was derived from two-dimensional slices as described by Troprès et al (2004) and BVfhisto was computed as described by Pathak et al (2001):
where ST is the section thickness.
Data Analysis
For each DCE MRI experiment, two ROIs were manually drawn on the [Gd] map: tumor and temporal muscle. These two ROIs were reported on BVf and VSI maps. For the analysis of these two last parameters, a third ROI was drawn on the contralateral brain tissue.
Within each ROI, pixels presenting estimates outside predefined ranges were excluded from ROI analyses. For BVf and VSI, the conditions of validity (0% to 15% and 0 to 50 μm, respectively) are those defined in Valable et al (2008)—our data were collected in identical experimental conditions—and they are derived from the theoretical framework behind the MRI method (Troprès et al, 2004). We further required T1 to be positive and vp, ve, Ktrans, and kep to be positive and smaller than 1. For each ROI, mean and standard error of the mean (s.e.m.) were calculated for each parameter.
Statistical analysis was based on the permutation test, which is suited to data originating from small- and different-sized groups, and with unknown distributions (Pitman, 1937). Unpaired permutation tests were applied to compare the two tumor models. To compare values between ROIs or between experiments performed on the same animal, paired permutation tests were used. All statistical analyses were performed with Matlab 7. Dynamic contrast-enhanced MRI pharmacokinetic parameters estimated in the absence and presence of USPIO are indicated USPIO− and USPIO+, respectively.
Results
Experiment A: MR Images
Figure 1 shows typical examples of MR images acquired on two rats, one for each tumor model. For both models, the signal of the tumor on the T1w image enhances as soon as 5 mins after Gd-DOTA injection (Figure 1D and 1N). The tumors are also visible on T2w images as hyperintense regions (Figure 1A, 1E, 1K and 1O).
In the C6 model, the USPIO induced a moderate decrease of the overall GE and SPIRAL signal intensities, with hypointense vessels, both in contralateral and tumor tissues (Figure 1G, 1I, and 1J). In the RG2 tumor, the GE signal decrease after USPIO injection was more pronounced than in the C6 tumor and its T1w SPIRAL signal was slightly enhanced at the periphery, even before Gd-DPTA injection, suggesting an extravasation of USPIO (Figure 1Q, 1S, and 1T). After injection of USPIO and of Gd-DOTA, signal enhancement because of Gd-DOTA extravasation can readily be detected in both tumor models (Figure 1J and 1T). However, signal increase dropped from 58% to 44% in the C6 model and from 65% to 23% in the RG2 model. Note that in the contralateral rat brain, T1 decreased by approximately 8% after injection of USPIO (data not shown).
Experiment A: Gd Concentration–Time Curves
Figure 2 presents examples of Gd concentration–time curves and their fits. On each graph, temporal evolutions of one representative pixel from the tumor ROI and one pixel from the muscle ROI are plotted. The top row shows the evolution of the concentration time curves for the Wistar model between the two DCE MRI experiments, before (left) and after (right) USPIO injection; the Fischer model is presented on the bottom row. Displayed curves are representative of the all rats for each model. All temporal evolutions were successfully fitted by the model (Equation 8). In the muscle, Gd concentration–time curves showed a similar CA uptake pattern, for both models. The presence of USPIO did not strongly modify this pattern, only the washout process (decreasing part of the curve) seemed slower. In the tumor, the two models exhibited different CA uptake curves. Before USPIO injection, the CA uptake in the RG2 tumor followed a ‘vascular’ pattern whereas in the C6 tumor, the Gd concentration reached its maximum well after the initial bolus phase. After USPIO injection, the temporal evolution in the C6 tumor was very similar to that obtained in absence of USPIO whereas in the RG2, the Gd concentration–time curve was strongly modified.
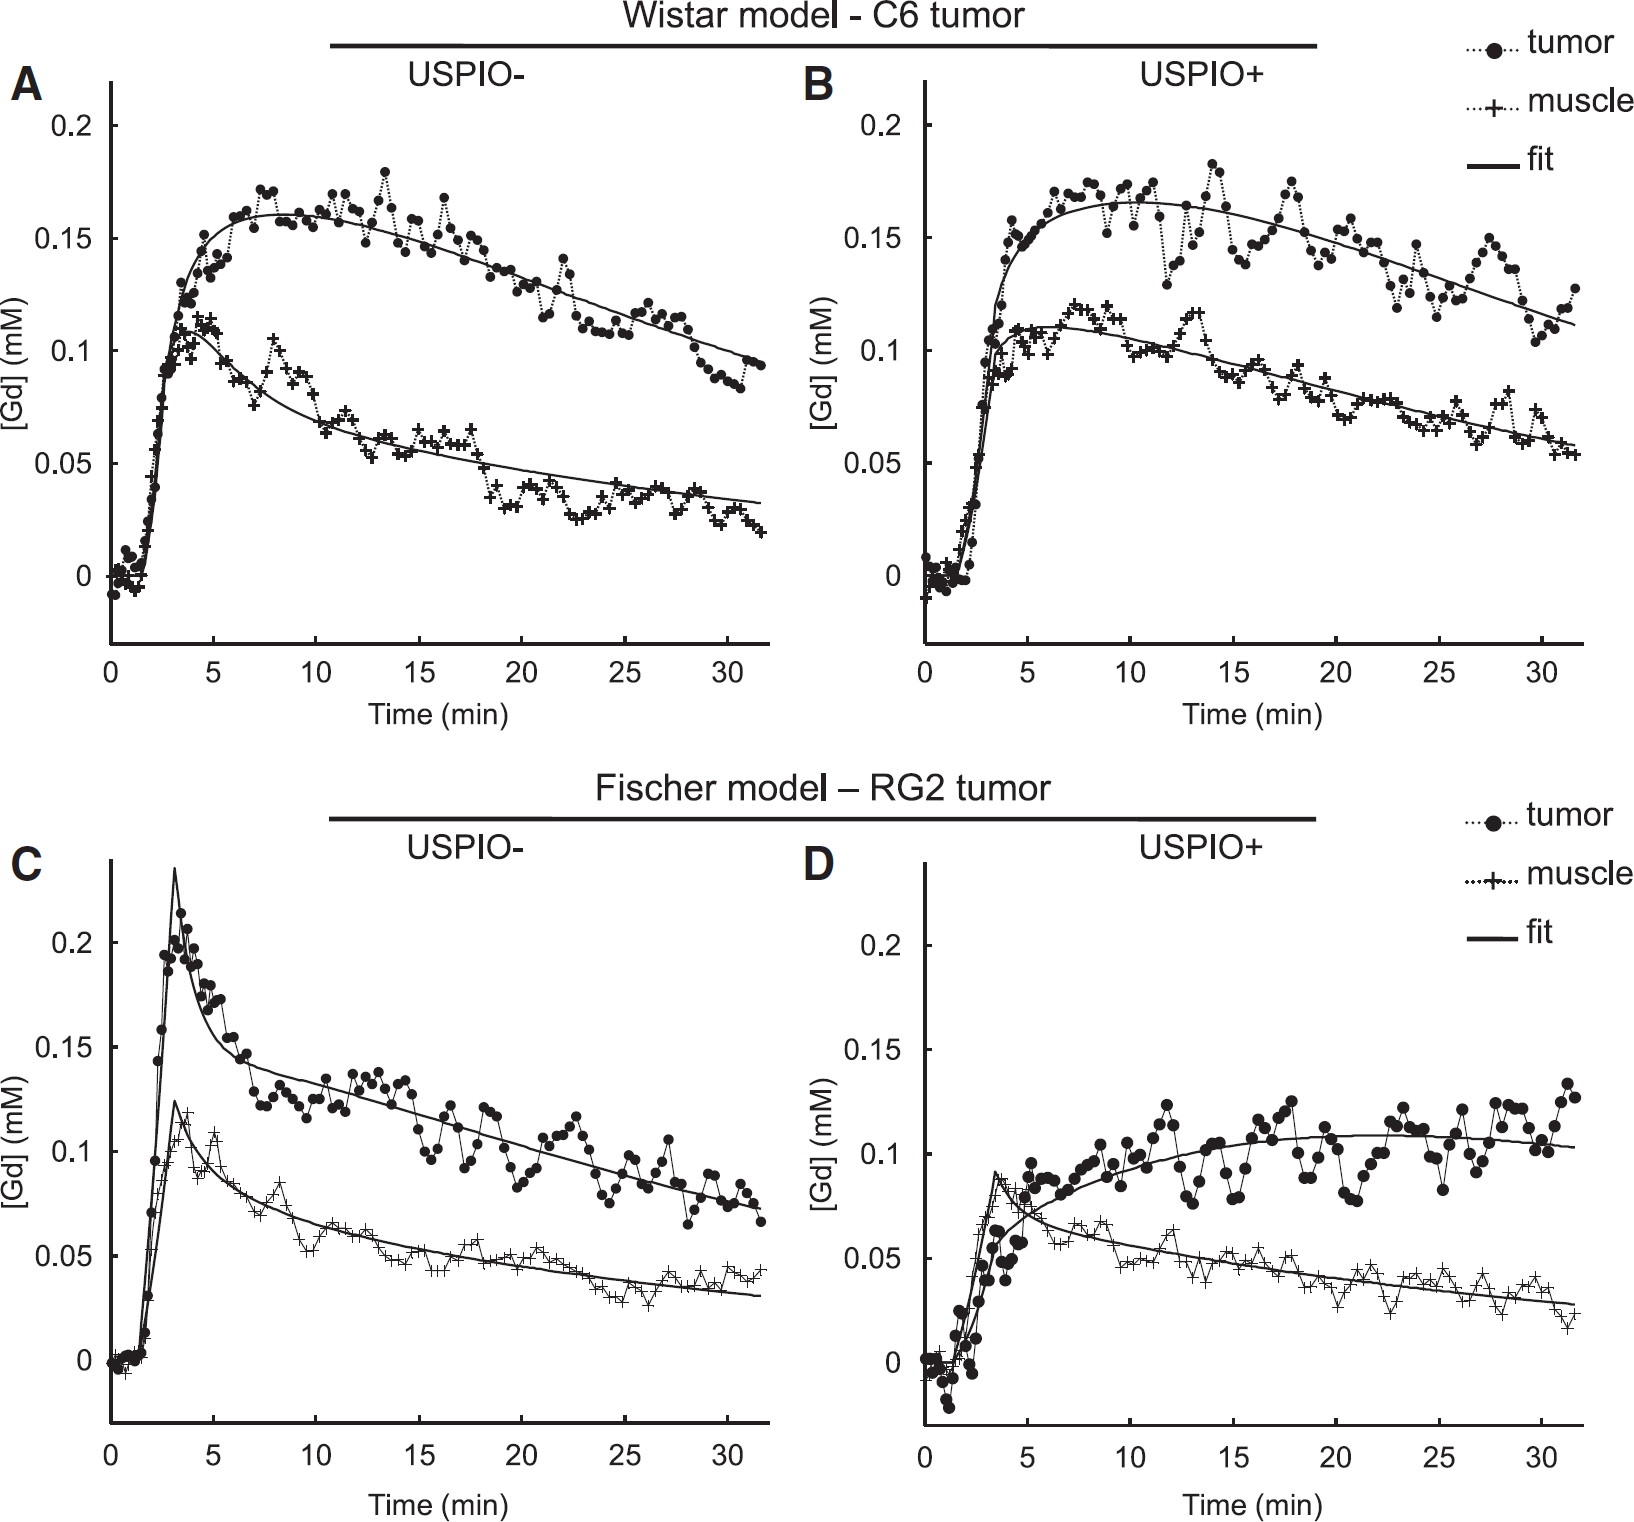
Temporal evolution of [Gd]. Examples of temporal evolutions of [Gd] observed during the DCE MRI analysis (
Experiment A: Wistar Model (C6 Tumor) Versus Fischer Model (RG2 Tumor)
Figure 3 shows the quantitative results of the DCE MRI USPIO− (Session 1) and the BVf/VSI (Session 2) experiments for each animal model. All values are reported in Table 1. Temporal muscle as well as contralateral brain tissue presented comparable BVf and VSI values in both rat strains. Blood volume fraction and vp in the RG2 tumor (BVf=4.5%±0.3%; vp=1.8%±0.2%) were about twice as large as in the C6 tumor (BVf=2.8%±0.1%; vp=0.9%±0.1%), which had a BVf similar to that in contralateral tissue (BVf=2.4%±0.1%). Blood volume fraction was larger than vp in tumor whereas the converse was true in temporal muscle. Vessel size index was larger in the C6 (14.4±1.5 μm) than in the RG2 tumor (8.7±0.7 μm), and both were larger than that in contralateral brain tissue (5.1±0.3 μm). ve was larger in the C6 than in the RG2 tumor and in both tumor types, it was larger than in temporal muscle. Ktrans in the C6 and in the RG2 tumors was comparable to that in temporal muscle. kep was lower in the C6 than in the RG2 tumor, and in both tumor types, kep was lower than in temporal muscle.
DCE MRI pharmacokinetic parameter estimates, obtained in presence or of USPIO, and BVf and VSI estimates, obtained from MRI and histological data, for C6 and RG2 models
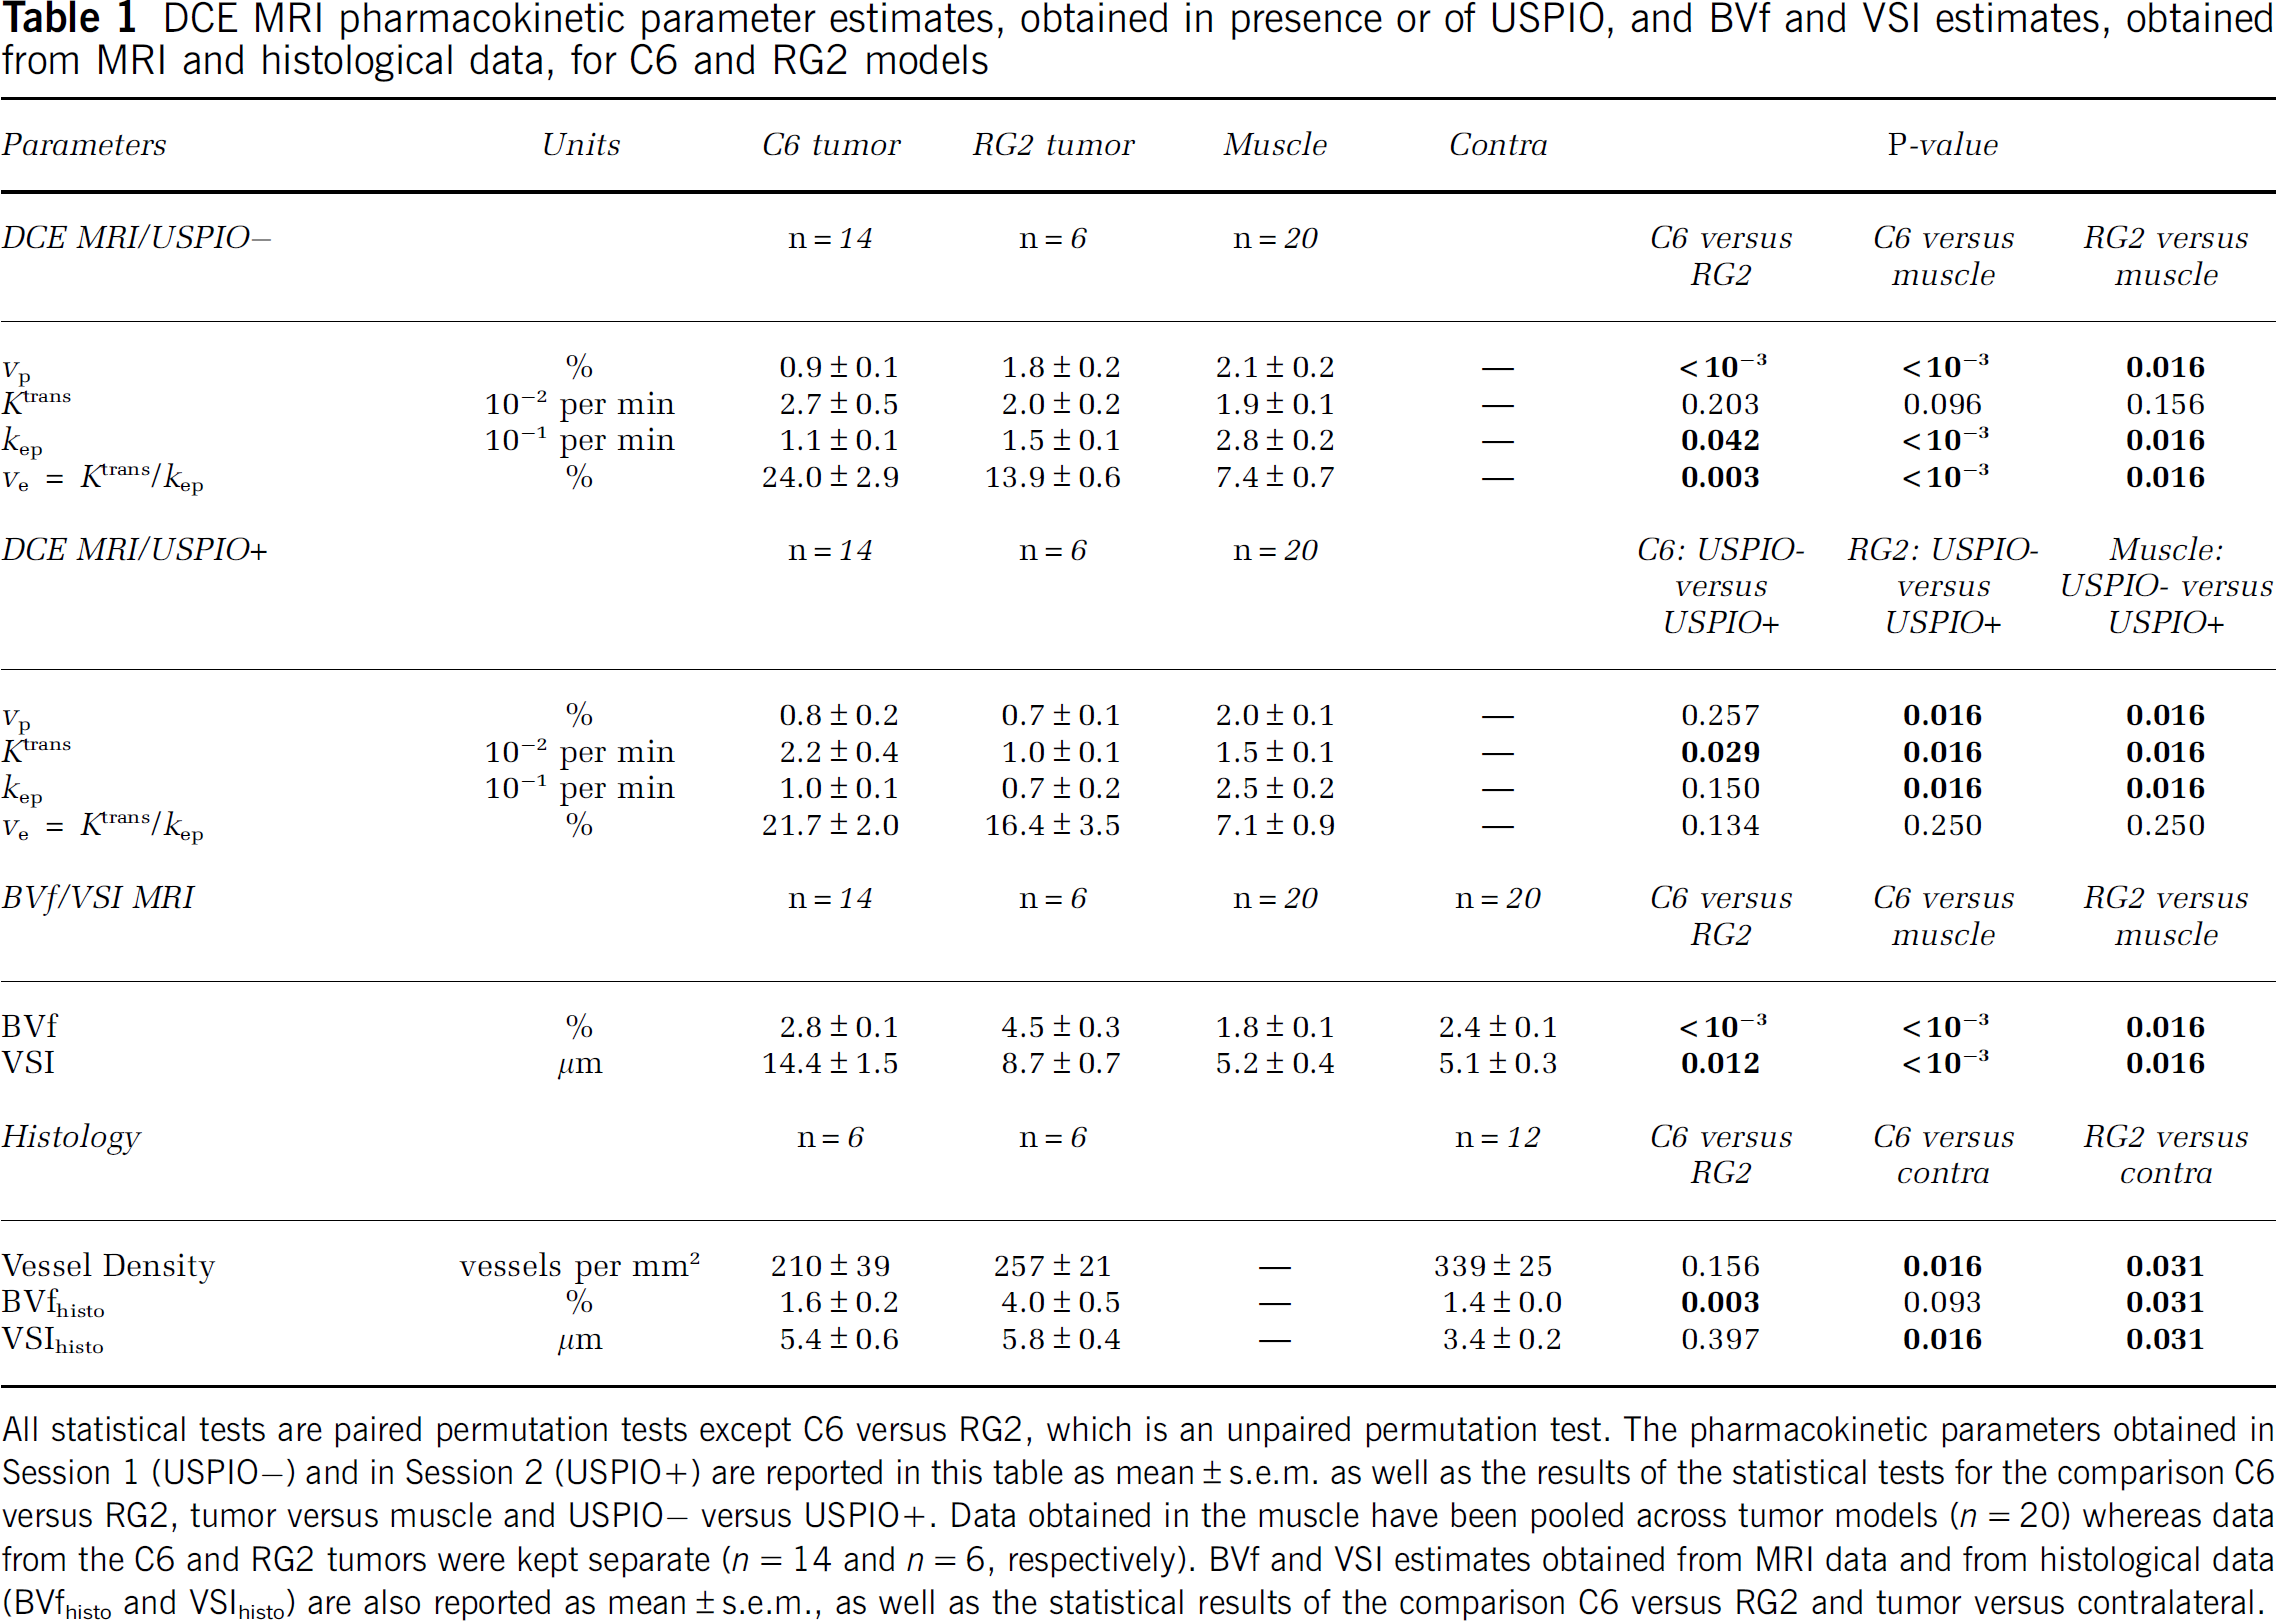
All statistical tests are paired permutation tests except C6 versus RG2, which is an unpaired permutation test. The pharmacokinetic parameters obtained in Session 1 (USPIO−) and in Session 2 (USPIO+) are reported in this table as mean±s.e.m. as well as the results of the statistical tests for the comparison C6 versus RG2, tumor versus muscle and USPIO− versus USPIO+. Data obtained in the muscle have been pooled across tumor models (n=20) whereas data from the C6 and RG2 tumors were kept separate (n=14 and n=6, respectively). BVf and VSI estimates obtained from MRI data and from histological data (BVfhisto and VSIhisto) are also reported as mean±s.e.m., as well as the statistical results of the comparison C6 versus RG2 and tumor versus contralateral.
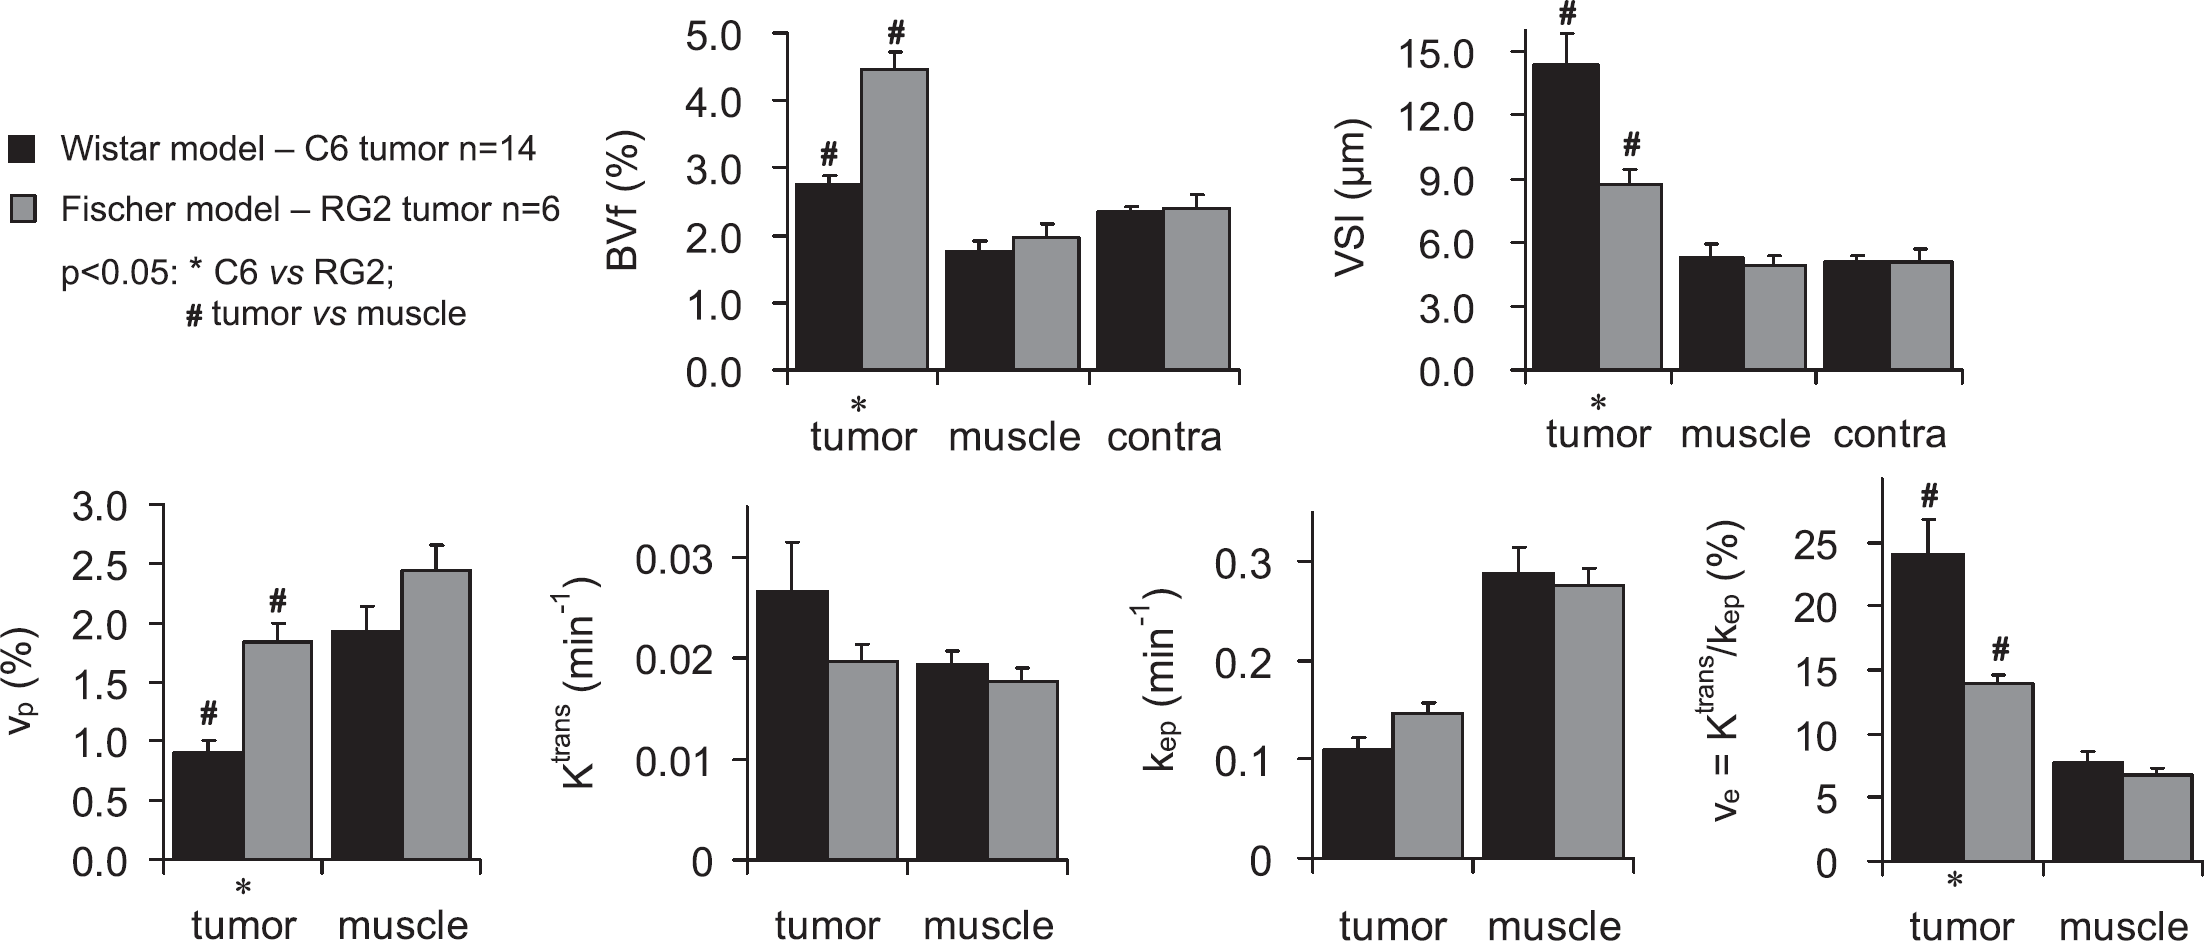
BVf, VSI, and DCE MRI pharmacokinetic parameter estimates in the C6 and RG2 models. Parameters obtained in Experiment A (mean±s.e.m.) for each tumor model (C6 in black and RG2 in gray) and different tissue ROIs. BVf and VSI were obtained during Session 2. vp, ve, Ktrans, and kep are the results of Session 1 (USPIO−).
Experiment A: USPIO+ Versus USPIO− Experiment
Pharmacokinetic parameters estimated in the USPIO− condition (Session 1) and in the USPIO+ condition (Session 2) are compared in Figure 4 and values are reported in Table 1. Because no significant difference was found in parameters estimated in the muscle between Wistar and Fischer rats (Figure 3), results from both animal models were pooled for the muscle ROI. For the C6 tumor and the muscle, all the pharmacokinetic parameter values determined in the presence of USPIO were slightly lower than the ones determined in the absence of USPIO. However, the paired statistical tests did not reveal statistical differences between the parameter values measured before and after the USPIO injection, except for Ktrans. For the RG2 model, the pharmacokinetic parameters estimated in the tumor region were significantly reduced by the presence of USPIO. The only exception was for the parameter ve, which presented a higher value in the USPIO+ condition than in the USPIO− condition. However, one has to bear in mind that ve is calculated for each animal and for each pixel of the ROI as the ratio of Ktrans and kep and, thus, is not an independent parameter.
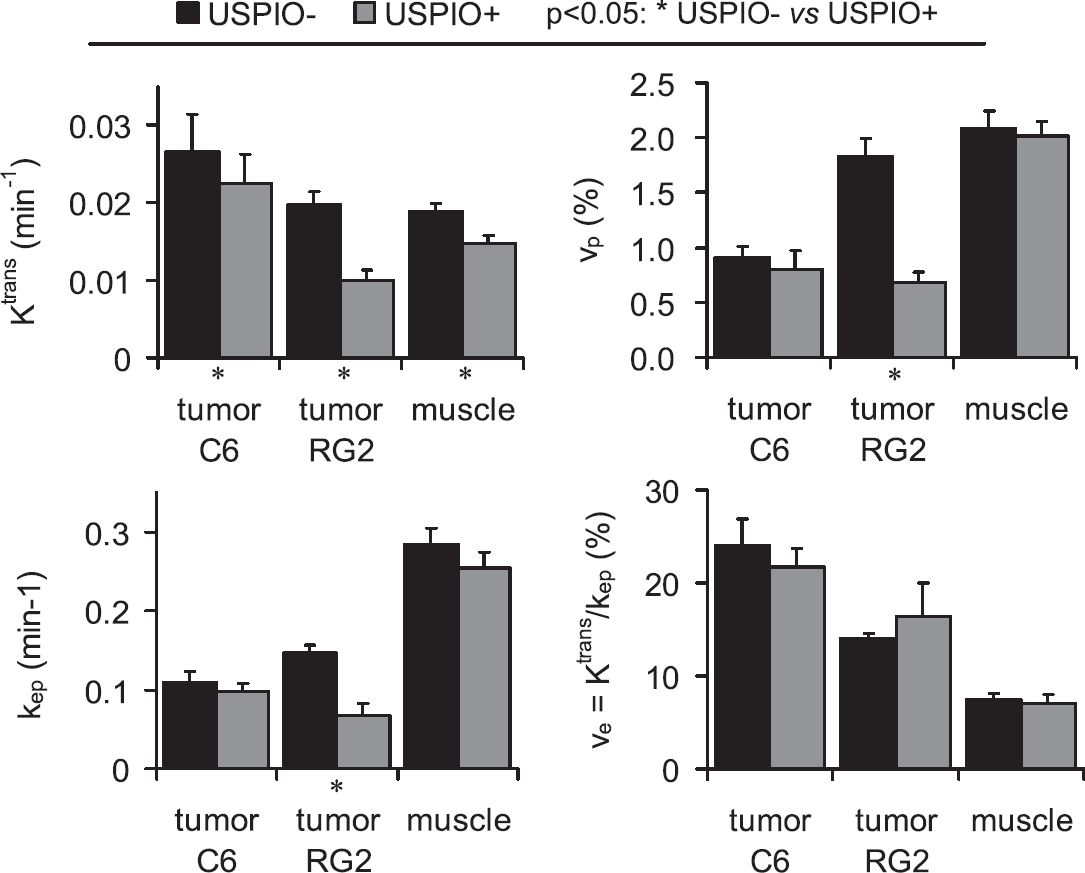
DCE MRI pharmacokinetic parameter estimates obtained in the presence or absence of USPIO. The pharmacokinetic parameters obtained in Session 1 (USPIO−, black) and in Session 2 (USPIO+, gray) are represented as mean±s.e.m. Data obtained in the muscle have been pooled across tumor models (n=20) whereas data from the C6 tumor and the RG2 tumor were kept separated (n=14 and n=6, respectively).
Experiment B
As mentioned in the Materials and methods section, the DCE MRI data obtained using USPIO as CA (Experiment B) were converted into ΔR1 to enable comparison with the data obtained using Gd-DOTA. Figure 5 shows the temporal evolution of ΔR1 obtained in three ROIs, on four rats. ΔR1 in muscle and in contralateral brain evolved similarly in both animal models. On bolus arrival, ΔR1 increased in muscle and remained stable afterwards. In contralateral brain tissue, ΔR1 slightly decreased on bolus arrival and remained stable afterwards. In the RG2 tumor, ΔR1 remained stable for a few minutes and increased continuously afterwards. No plateau was reached during the 2-h acquisition time window. The two RG2 rats presented different rates of signal increase, likely because of the different amounts of CA injected. In the C6 model, R1 remained unchanged over the same period of time.
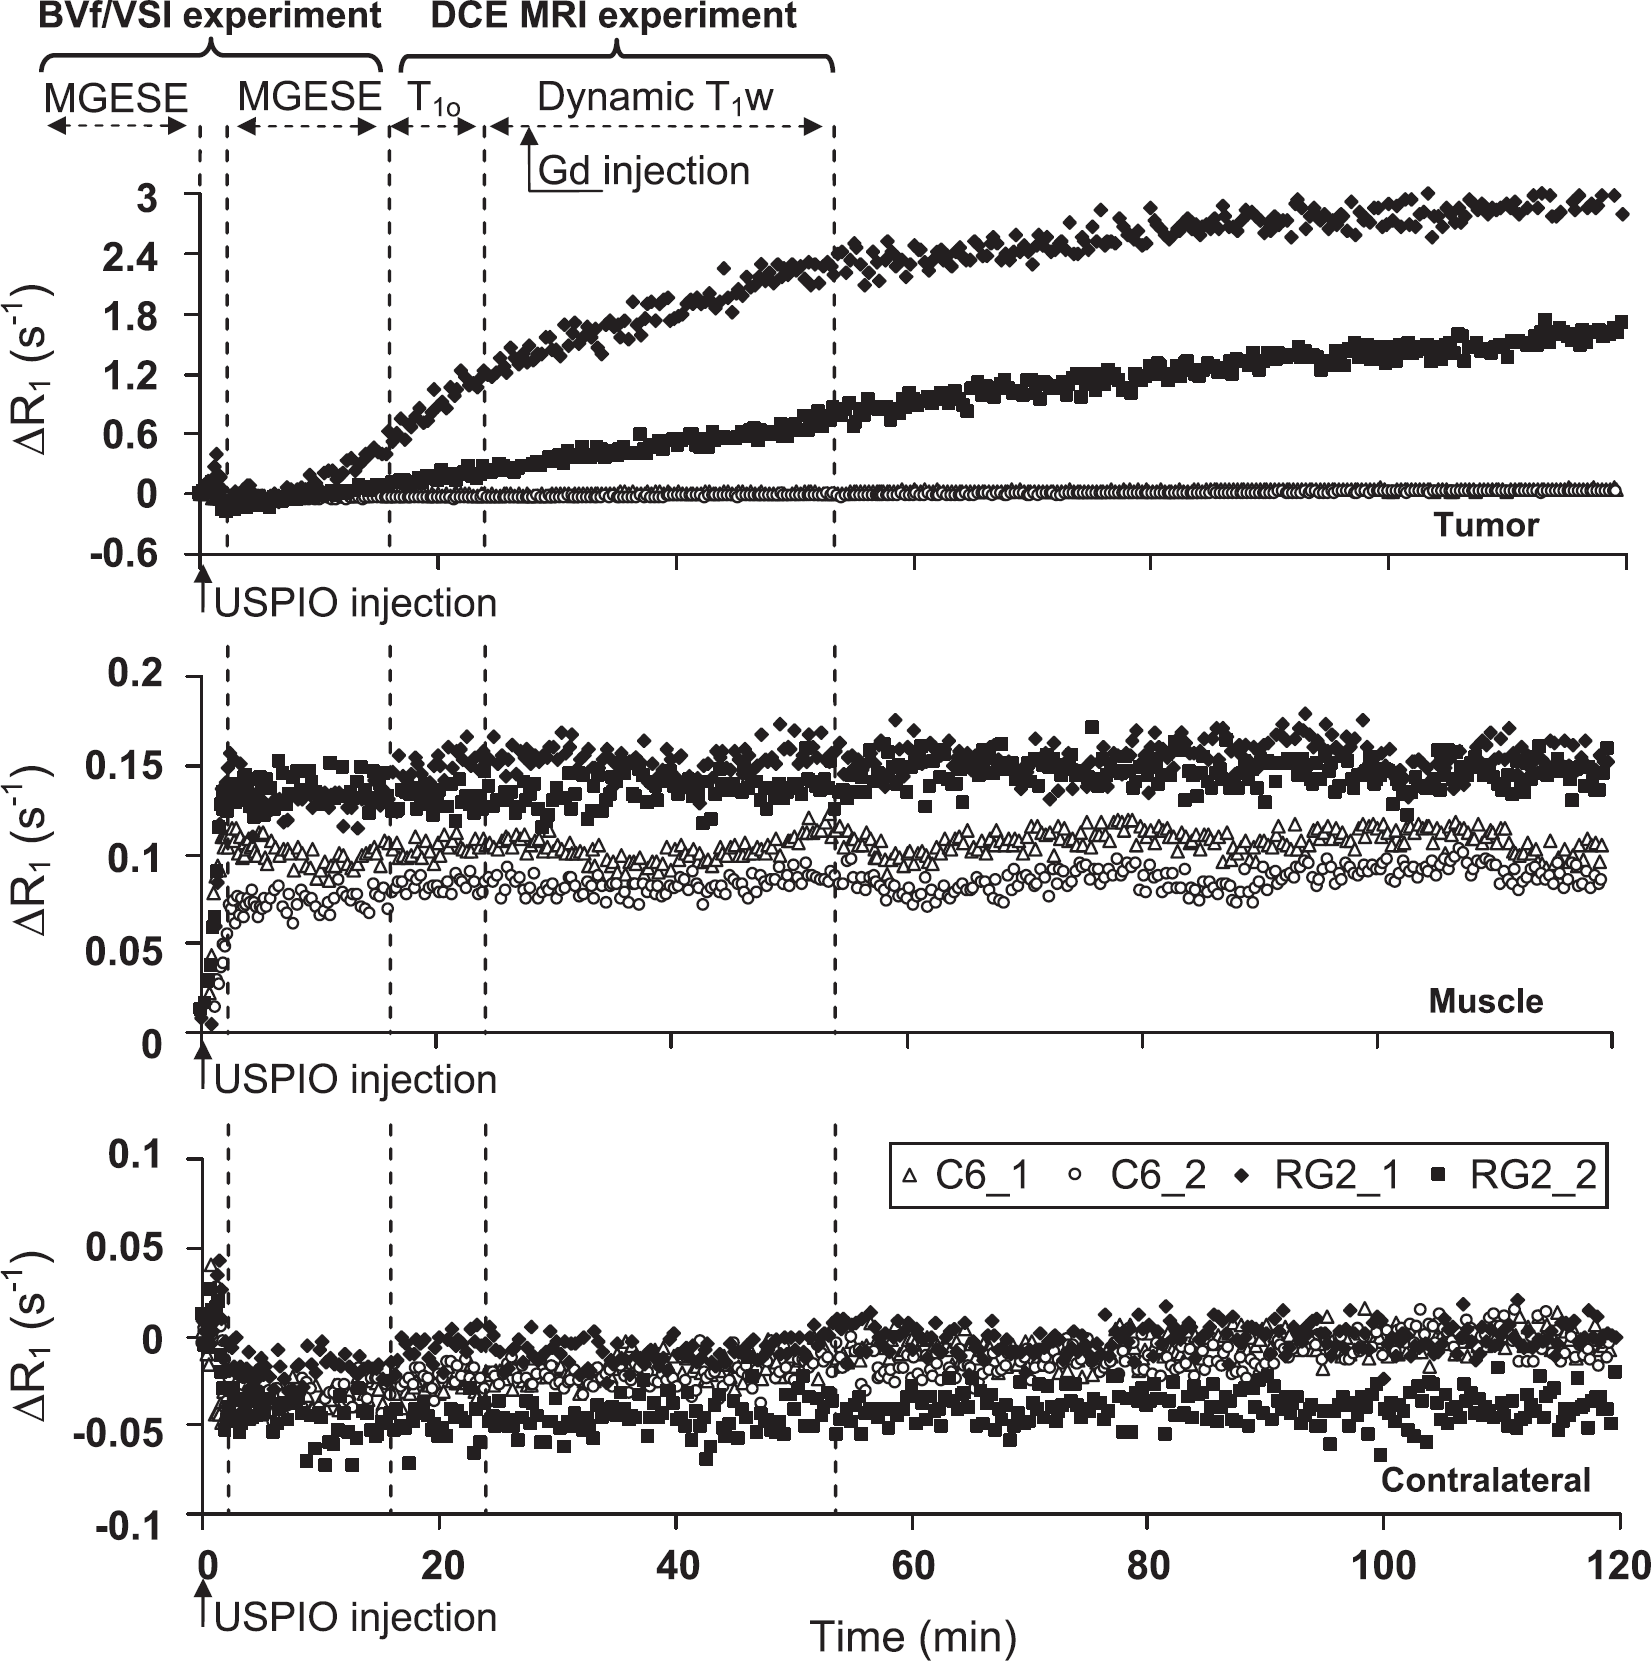
Does the USPIO extravasate in the tumor? Temporal evolutions of the longitudinal relaxation rate after USPIO injection in Experiment B. Each graph corresponds to one ROI, and, in each graph, each time course was obtained from a single animal (four time courses per graph: two C6 (open symbols) and two RG2 (filled symbols)). Dashed lines and double arrows indicate the time at which MR acquisitions and Gd injection were performed during Experiment A, Session 2, before and after USPIO injection (time=0 min was defined as the beginning of the USPIO injection).
Histology
For both tumor models, hematoxylin-erythrosine-stained brain sections showed that cellular density was larger in the tumor than in contralateral brain tissue. Neither macroscopic necrotic regions nor hemorrhage was seen. In C6 tumor, collagen IV labeling showed lower vessel density and higher vessel diameter compared with contralateral brain tissue (Figure 6A and 6B). Similar differences, but less pronounced, were found in the RG2 tumor (Figure 6C and 6D). For both tumor types, BBB labeling was much lower in the tumor center than contralaterally (Figure 6E and 6H). Finally, the level of ED1 labeling (macrophages) seemed higher in the center of the RG2 tumor than in the C6 tumor, whereas it was almost totally absent in the contralateral brain tissue (Figure 6I–6L). Results of the quantitative analysis of the histologic data are reported in Table 1. Both tumor models presented a lower vessel density in the tumor than in the contralateral brain tissue. BVfhisto measured in the RG2 tumor was larger than the one in the C6 tumor, which was comparable to the BVfhisto value in contralateral brain tissue. VSIhisto was not different between the two tumor models but was found significantly higher than in the contralateral brain tissue.
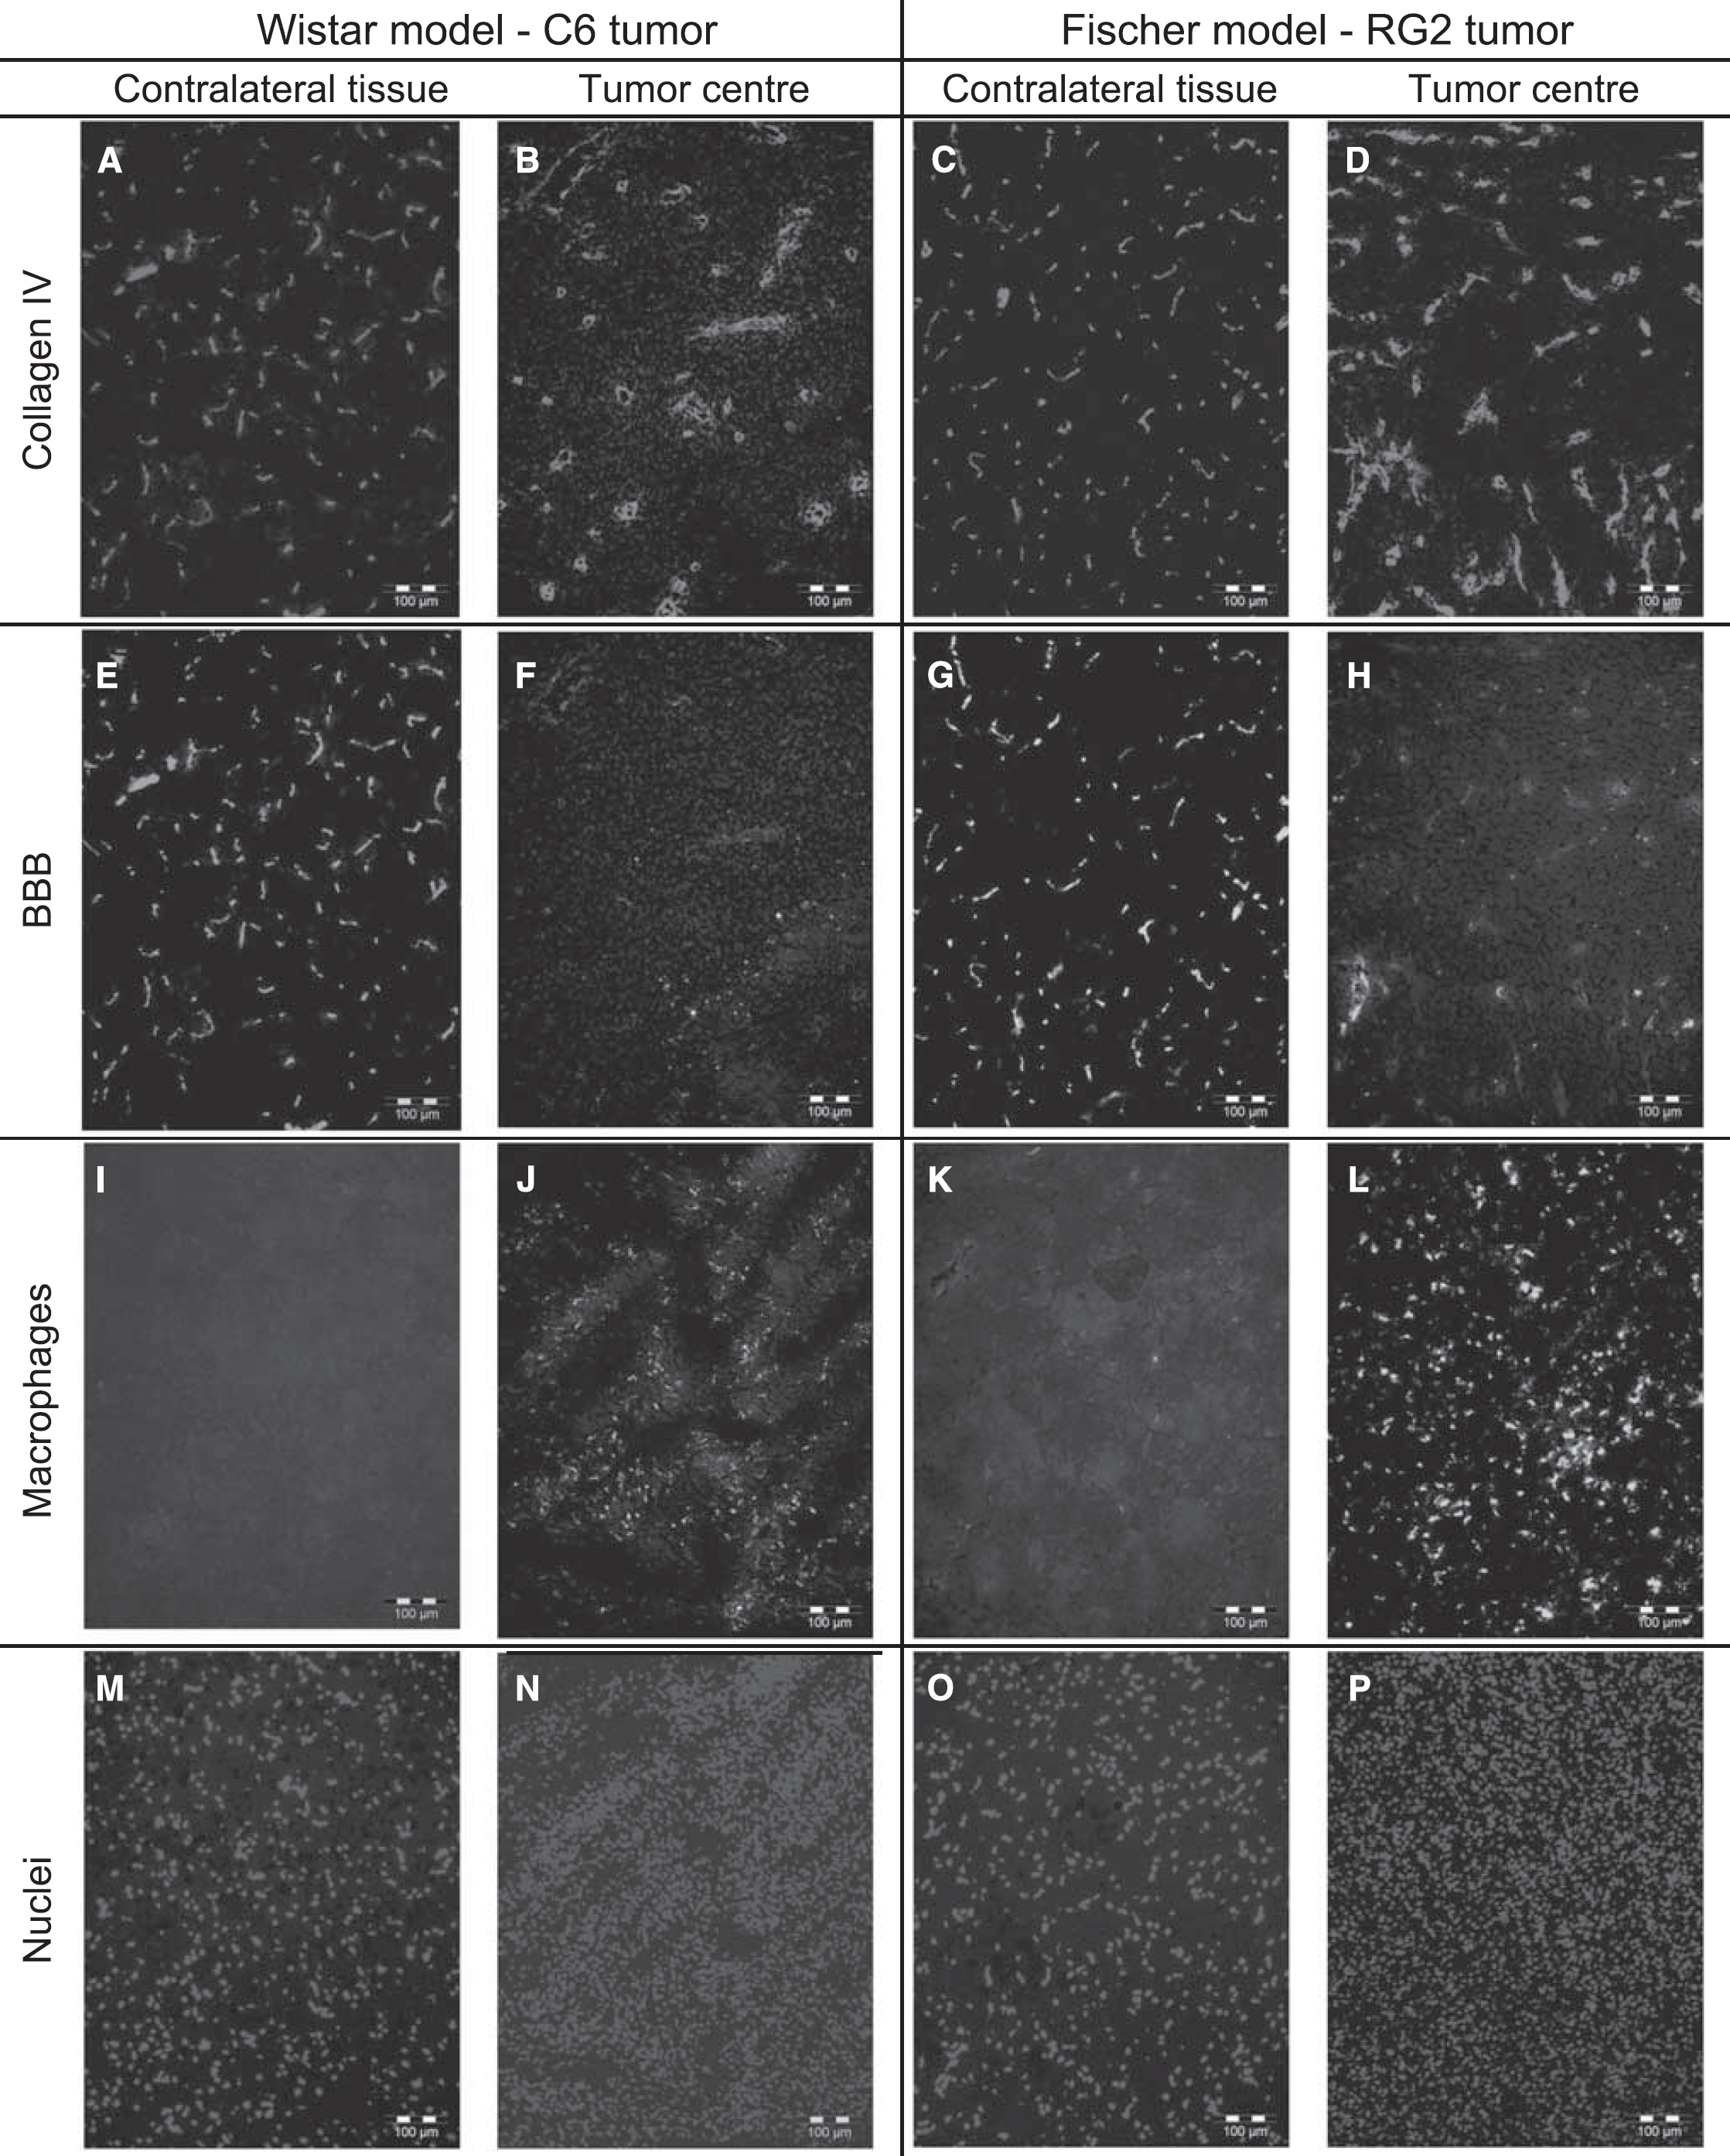
Histologic images. Examples of histologic images obtained for the C6 model (two left columns) and the RG2 model (two right columns). For each model, the tumor center (right) and the contralateral region are represented (left). (
Discussion
This study shows that a DCE MRI experiment can be combined within the same MRI session to a steady-state BVf/VSI measurement protocol, provided that USPIO does not extravasate. Ktrans values obtained with the combined protocol are 20% smaller than those obtained with a DCE MRI protocol alone. However, when USPIO does not extravasate (i.e., in the C6 model), Ktrans estimates are well correlated with Ktrans values calculated from the data obtained without the combined USPIO/Gd protocol. Physiologic information obtained from the DCE MRI experiment and that from the steady-state MRI experiment is complementary, improving the characterization of the microvasculature in glioma models. All MR results were in good agreement with histologic observations.
In muscle, BVf and vp estimates were comparable (mean for all 20 animals are 1.8%±0.1% and 2.1%±0.7%, respectively) and in good agreement with values from the literature (Everett et al, 1956; Schwarzbauer et al, 1993). In contralateral brain tissue, BVf estimates were comparable to previously published data obtained with the same method (Troprès et al, 2004; Valable et al, 2008). In tumor, blood volume as assessed by BVf, BVfhisto, and vp was twice as large in the RG2 model than in the C6 model. Blood volume fraction estimates (steady-state MRI approach) were larger than histologic estimates (BVfhisto) and both were larger than vp estimates (DCE MRI approach). Although BVf and vp estimates were different, they were well correlated in the tumor (R2=0.70). As discussed by Valable et al (2008), BVf values estimated with the steady-state MRI approach or the histology are prone to various source of bias. Quantitative histologic estimates have sampling errors because of cryosectioning and from two- to three-dimensional extrapolation errors (Pathak et al, 2001). The steady-state MRI approach may be biased by macroscopic magnetic field inhomogeneities and by limitations of the underlying theoretical model (Pathak et al, 2008). Dynamic contrast-enhanced MRI estimates are very sensitive to the AIF (Port et al, 2001) and to the choice of the physiologic model. An underestimation of the parameter vp can arise from various sources, as shown in Cheng (2008), including inaccurate AIF measurements, limited temporal resolution, and transit time effects. The shutter speed effect (Li et al, 2005) may also have a determinant role in the estimation of vp. However, in our protocol, the CA was injected as a long bolus, which may reduce the shutter speed influence on vp. Covariance between model parameters is another factor that may bias vp estimate (Buckley, 2002). Further investigation is required to understand why BVf and vp provide different estimates of the plasma volume fraction.
The VSI results were in good agreement with estimates obtained under similar experimental conditions (Valable et al, 2008). Histologic and MR estimates of VSI are biased by the same factors as those described above for BVf. In addition, nonideal collagen labeling yields an apparent vessel fragmentation in the sections. The subsequent analysis thus produces more and smaller vessels, which eventually yields an underestimation of VSIhisto. This could explain both the small estimates of VSI obtained by histology and the lack of difference between VSIhisto measured in C6 and RG2 tumors in this study. The fact that the C6 model presents a higher VSI value together with a smaller BVf value than the RG2 model is consistent with a reduction in vessel density more marked in the C6 than in the RG2 tumor and suggested by our histologic results.
Mean estimates of Ktrans and ve in muscle were 0.019±0.001 min−1 and 7.4%±0.7%, respectively, in good agreement with estimates from periprostate muscle tissue (Ktrans=0.015 min−1 and ve=8%) (Kershaw and Buckley, 2006). In both of our tumor models, BBB alterations were detected by DCE MRI and histology. This is consistent with a previous study (Valable et al, 2008) that indicated that vascular endothelial growth factor is equally overexpressed in C6 and RG2 tumors. Although pharmacokinetic estimates were in good agreement with the literature (Ferrier et al, 2007), we did not find a significant difference in Ktrans (measured in the absence of USPIO) between the two models (there is however a trend toward a larger Ktrans in the C6 model), in contrast to a previous observation (Uehara et al, 1997). This discrepancy could be related to differences between the two studies in the perfusion status of the animals (e.g., because of anesthesia). Indeed, Ktrans is sensitive to different parameters: blood flow (in mL/g/min), the surface vessel wall (in cm2/g), the actual permeability of the capillary wall (in cm/min) (Tofts et al, 1999), and possibly by CA diffusion into the EES and water exchange (Li et al, 2005). Moreover, because C6 and RG2 tumors present different vessel densities and blood volumes (Valable et al, 2008), they are not likely to present identical surfaces of vessel wall. Thus, although Ktrans may be similar among tumor types as reported in this study, the actual permeability of C6 and of RG2 tumor vessels may differ.
All parameter estimates obtained from the DCE MRI experiment were reduced by the USPIO. This reduction was significant for RG2 tumor only and very weak for C6 tumor and muscle tissue. This reduction may be explained in terms of magnetic field gradients generated within and around the vessels. Even at the short TE (1.6 ms) used in this study, these gradients reduce the MR signal intensities from within the vessels and from their periphery. The signal reduction from blood explains a lower vp value estimated in the presence of USPIO. The reduction of the contribution of the vessel periphery to the signal may explain the decrease in the three other parameter values, ve, Ktrans, and kep observed in the presence of USPIO, assuming limited diffusion of Gd-DOTA across the EES at the periphery of vessels. Transendothelial water exchange may also have contributed to the reduction seen in pharmacokinetic parameters (Li et al, 2005). Moreover, the apparent CA relaxivity in the voxel (r1) may also have been affected by the presence of USPIO (Li et al, 2005). It would be of interest to evaluate how the diffusion of CA in EES and the water exchanges (transendothelial and transcytolemmal) affect the estimates obtained in USPIO+ condition, using an adapted modeling of the different signal contributions in the presence of USPIO. The presence of the magnetic field gradients, induced by the USPIO, not only reduces the signal intensity in the surrounding tissue but also may invalidate the two-compartment DCE model (i.e., extended Tofts model) because the field gradient extending into the extravascular space will make the assumption of a single extravascular compartment questionable. Despite a significant effect of the USPIO on the estimate of Ktrans, a strong correlation between this estimate and that obtained from a combined protocol was found in the C6 model (R2=0.78). The coefficient of determination R2 was lower for the RG2 tumor (R2=0.41) than for the C6 tumor, likely because of the different extravasation properties of the USPIO in the two models—no extravasation in the C6 tumor, slow extravasation in the RG2 tumor (up to 2 h after injection). Also, this phenomenon probably explains why the presence of USPIO significantly reduced all the estimates determined in the RG2 model. Because USPIO is present in intra- and extravascular compartments, the effects of water diffusion and of water exchanges through the different membranes on the pharmacokinetic parameters estimates may be emphasized and lead to a strong reduction of these estimates. Following this hypothesis, one can suggest to lower the dose of USPIO and thus decrease the impact of the presence of iron on the estimates of Ktrans. However, a lower dose may affect the plasmatic half-life of the USPIO and impair the steady-state hypothesis for the DCE MRI experiment. Also, it has been shown (Troprès et al, 2004) that a high dose is necessary to provide accurate VSI measurements across the entire vessel size spectrum. Finally, the parameter ve has to be considered with caution as it is not determined independently.
It is unclear which features underlie the difference in USPIO extravasation between the two tumor models. Three mechanisms can be considered. (1) Passive diffusion, the mechanism at the origin of Gd-DOTA extravasation. This study shows that both tumor models are equally permeable to Gd-DOTA and present similar histologic BBB labeling. However, as mentioned above, the two tumors present different ADC values. Thus, a difference in EES interstitial pressure could prevent USPIO from extravasating in the C6 tumor but not in the RG2 tumor. (2) Active transport via macrophages (Corot et al, 2004; Saleh et al, 2004) : this assumption is supported by our histologic results, which show a macrophage labeling more pronounced in the RG2 tumor than in the C6 tumor. This assumption is, however, not supported by the timing of the USPIO extravasation. It began a few minutes after CA arrival and was, thus, too fast to allow time for macrophagic capture and transport across the vessel wall (Daldrup et al, 1999). (3) Active transport via endothelial cells: pinocytic activity in endothelial cells is known to be significantly higher in glioma than in healthy brain tissue and can contribute to the extravasation of CA (Shivers et al, 1984; Takano et al, 1991). In contrast to the macrophage response, a transport through pinocytic vesicles could occur within minutes after CA injection (Nag et al, 1981; Petito, 1979). A combination of these three mechanisms may also explain the reported extravasation of USPIO. Understanding this extravasation requires further investigation, such as determining how the observed phenomenon depends on the CA size. A detailed understanding of the mechanisms involved in USPIO extravasation could provide a new way of characterizing tumors.
Conclusion
This study shows that an iron-based BVf/VSI MRI experiment and a Gd-based DCE MRI experiment can be combined into a unique MRI protocol, provided that USPIO does not extravasate with the time frame of the DCE MRI experiment. In this case, the combined protocol proposed in this study appears well suited for evaluating antiangiogenic therapies: BVf, vessel size (and thus vessel density), and vessel permeability can be estimated within a single MRI session, as was successfully performed on the C6 glioma model. The behavior of the RG2 model indicates that this protocol cannot be used on every tumor model, however. Beyond the fact that such a combined protocol enriches the set of quantitative microvascular parameters, additional microvascular characteristics may emerge from this approach—an adapted modeling of the different signal contributions in the presence of USPIO and Gd-DOTA may provide insights into the diffusion of Gd-DOTA within the EES and/or on water exchange through cell membrane. Finally, USPIO extravasation may be used to differentiate tumor models that are indistinguishable based on Gd-DOTA permeability like C6 and RG2 models.
Footnotes
Acknowledgements
We thank the ‘Institut National du Cancer’, the ‘Cancéropôle Lyon Auvergne Rhône-Alpes’, the ‘Association pour la Recherche sur le Cancer’, and the ‘Région Rhône-Alpes’ for their financial support and Guerbet for providing Sinerem. BL received a stipend from Oncodesign Inc.
The authors declare no conflict of interest.