
Abstract
In magnetic resonance imaging (MRI), cerebral blood volume (CBV) quantification is dependent on the MRI sequence and on the properties of the contrast agents (CAs). By using the rapid steady-state T1 method, we show the potential of gadolinium per (3,6-anhydro) α-cyclodextrin (Gd-ACX), a new MRI paramagnetic CA (inclusion complex of Gd3+ with per (3,6-anhydro)-α-cyclodextrin), for the CBV quantification in the presence of blood—brain barrier lesions. After biocompatibility and relaxivity experiments, in vivo experiments on rats were performed on a C6 tumor model with 0.05 mmol Gd-ACX/kg (<1/10 of the median lethal dose) injected at a 25mmol/L concentration, inducing neither nephrotoxicity nor hemolysis. On T1-weighted images, a signal enhancement of 170% appeared in vessels after injection, but not in the tumor (during the 1 h of observation), in contrast to the 90% signal enhancement obtained with Gd-DOTA (a clinical MRI CA) injected at a T1 isoefficient dose. This result shows the absence of Gd-ACX extravasation into the tumor tissue and its confinement to the vascular space. Fractional CBV values were found similar to Gd-ACX and Gd-DOTA in healthy brain tissue and in the contralateral hemisphere of tumor-bearing rats, whereas only Gd-ACX was appropriate for CBV quantification in tumor regions.
Introduction
Hemodynamic parameters, such as blood flow and volume, obtained in vivo by magnetic resonance imaging (MRI) are of great interest to characterize diseases related to the cerebral microvasculature and to evaluate the efficacy of new antivascular/antiangiogenic drugs. Most MRI perfusion techniques are based on a two-compartment model (intra- and extravascular) and require the intravenous injection of contrast agents (CAs). For accurate measures of cerebral hemodynamic parameters, the CA must be confined in the intravascular space. Different quantitative MRI methods were validated in healthy brain tissue (Lu et al, 2005; Ostergaard et al, 1996) using the standard MRI CA (e.g., Gd-DOTA). However, diseased brain tissue, such as high-grade gliomas, shows enhancement with intravenously injected CAs, indicating an abnormal vascular permeability. In such cases, with impaired blood—brain barrier (BBB), the measures of hemodynamic parameters induce systematic errors (Kiessling et al, 2007). A challenge for accurate cerebral blood volume (CBV) quantification is the development of CAs that do not extravasate into adjacent tissue during the duration of the MRI experiment. Several kinds of paramagnetic blood pool agents have been developed that exhibit a prolonged blood half-life because of a slower clearance or metabolization or a slower leakage rate from extracerebral vasculature (Kroft and de Roos, 1999). They are particularly useful for MR angiography but still leak through an impaired BBB (Fonchy et al, 2001).
In this study, we describe the properties of a compound belonging to a new generation of CAs based on modified cyclodextrins, and we show that it remains confined to the intravascular space for at least 1 h even in the presence of BBB permeable for the standard clinical CA Gd-DOTA.
The hexakis (2-O-carboxymethyl-3,6-anhydro)-α-cyclodextrin, a hexaacid ACXH6 cyclodextrin derivative named ACX, was recently synthesized after chemical modification of the native cyclodextrin (Gadelle and Defaye, 1991). It has the shape of a rather flat disc and a molecular weight of 1,464 Da. This new molecule is characterized by a hydrophilic cavity capable of binding several kinds of metal cations (Fauvelle et al, 2002). More recently, the structure and stability constants of a lanthanide Ln3+-ACX inclusion complex were obtained with the lutetium ion Lu3+ (Bonnet et al, 2005), a lanthanide with the same chemical properties as Gd3+.
The aims of this study are to show (1) that α-cyclodextrin (ACX) complexes Gd3+, resulting in an MRI CA with higher relaxivities than Gd-DOTA, which is biocompatible at the standard dose of 0.1 mmol Gd3+ per kg body weight and convenient for in vivo investigations and (2) that it is useful to investigate the microvasculature and, in particular, the blood volume of cerebral tissue with BBB breakdown in animal models. The first part of the article consists of biocompatibility studies: hemolytic activity, in vivo nephrotoxicity, and lethal dose determination. The second part is devoted to the study of the longitudinal and transverse relaxivities of gadolinium per (3,6-anhydro) α-cyclodextrin (Gd-ACX). The third part concerns in vivo MRI investigations of rat brains. Two different in vivo MRI experiments were performed using Gd-ACX: (1) the biodistribution of this CA was investigated in a C6 glioma model and (2) the CBV fraction (CBVf) was mapped using the Gd-ACX as CA in both healthy and tumor-bearing animals.
Materials and methods
Biocompatibility
Hemolytic activity: Hemolysis is a classic side effect of natural cyclodextrins (Djedaïni and Perly, 2001). Therefore, hemolysis in the presence of ACX alone and of the complex Gd-ACX was evaluated and compared to the hemolytic activity of natural α-cyclodextrins (ACD) (Wacker Société de Chimie, Lyon, France).
Human blood from healthy volunteers was collected in heparinized tubes and washed twice using isotonic NaCl solution. The hematocrit was then reduced to 10%. Tubes of 5 mL were filled with 4 mL of solutions containing 0 to 50 mmol/L of ACD and 0 to 1 mmol/L of ACX or Gd-ACX (in terms of ACX concentration), and 100 μL of diluted blood was added. The samples were kept at 37°C for 1h and then centrifuged for 10mins at 4°C and 2,400 r.p.m. Absorption measurements were performed at 540 nm on a Shimazu MCS-2000 absorption spectrometer (Debouzy et al, 1998). To calibrate the absorption, absence of hemolysis (0%) was evaluated by addition of isotonic NaCl solution, whereas total hemolysis (100%) was induced by addition of Triton X-100 or sonication of the samples.
Lethal dose 50%: All procedures involving animals were in accordance with the standard for animal care approved by the animal ethnic committee of the French Research Center of the Army Health Services (CRSSA) (decree 622-2-2000, 15 October 2000).
Three toxicity experiments were performed on CD1 mice from Charles River (L'Arbresle, France) weighing 20 to 30 g. All intraperitoneal injections were prepared in normal saline solution and administered with a volume of 20 μL/g body weight.
The first experiment was performed to determine toxicity at the maximum soluble concentration of ACX corresponding to 45 mmol/L. Five mice were assigned to each of three groups receiving injections of (i) normal saline solution, (ii) a 45 mmol/L solution of ACX (0.9 mmol ACX/kg), and (iii) a 27:45 mmol/L Gd-ACX solution in a 1:1.67 stoichiometry (0.54mmol/kg), respectively.
The second experiment was a quantitative determination of lethal dose 50% (LD50%), which is the dose of Gd-ACX that is lethal to 50% of the animals. The economic statistical floating mean method (Weil, 1952) was used. A total of 40 mice were assigned to eight equal groups of five animals each. The first group received a 21 mmol/L Gd-ACX solution (0.42mmol/kg). Starting with this concentration, six successive dilutions by a factor of three were made and each of these solutions was administrated to one of six groups. The last group received an injection of normal saline solution.
The final experiment was performed because the first two experiments did not allow to obtain the precise LD50%. Twenty mice were assigned to two groups of 10 mice each. One group received an injection of a 25 mmol/L Gd-ACX solution corresponding to a dose of 0.50mmol/kg. The control group received an injection of normal saline solution.
Besides assessing mortality, a general survey was performed daily for 1 week, including body weights and observation for behavioral anomalies, with special attention to prostration, spontaneous locomotor activity, and tegumental alterations (yellow-colored skin suggests significant stress).
Because heavy metals and lanthanides, in particular, are known to be nephrotoxic (Galle, 1997; Johanson, 1994), all animals of the first and last sets of experiments underwent histologic examination of both kidneys 7 days after injection. Histology was performed with a hematein-phloxin-safran staining on six frontal slices of 10 μm for each kidney. Histologic coronal brain sections (thickness 10 μm) from eight C6 tumor-bearing rats subjected to a 0.05 mmol/kg Gd-ACX injection 1 h before decapitation were stained with hematoxylin-erythosine. Immunofluorescent staining with anti-collagen IV of the microvasculature on sections from the same location was also performed.
Nuclear Magnetic Resonance Relaxometry
Samples: Gadolinium per (3,6-anhydro) α-cyclodextrin solutions were prepared with concentrations accurate to within 1%. Sealable nuclear magnetic resonance (NMR) tubes (Young tubes) of 5 mm diameter were filled with different concentrations of Gd-ACX in normal saline solution (0.126, 0.233, 0.286, 0.414, 0.643, 0.965, 1.910, 2.840, and 3.830 mmol/L) and were degassed from their paramagnetic oxygen. Gadolinium per (3,6-anhydro) α-cyclodextrin concentrations (0, 0.284, 0.421, 0.636, 0.964, and 1.445 mmol/L) were also prepared in human plasma. The pH was adjusted to physiologic acceptable values (6 to 7.4).
The longitudinal relaxation rate R1 = 1/T1 of the water protons was measured at 100 and 400 MHz and the transverse relaxation rate R2 (R2 = 1/T2), at 100 MHz. T1 and T2 are the longitudinal and transverse relaxation times, respectively. Measurements were performed for different Gd-ACX concentrations [Gd-ACX] (mmol/L) to obtain longitudinal and transverse relaxivities ri (i = 1, 2) defined as:
where Rio are the relaxation rates in the absence of CA.
High-field relaxation: The relaxivity experiments at 100 MHz were performed in a horizontal bore magnet (Bruker Spectrospin, Wissembourg, France) of 40 cm diameter, operating at 100 MHz equipped with actively shielded gradient coils (Magnex Scientific, Abington, UK) at room temperature (20°C to 21°C). Longitudinal relaxations were measured using an inversion-recovery sequence with 15 variable inversion times (delays between the 180° and 90° pulses). Each experiment was repeated three times to yield an estimated T1 value (mean ± s.d.). These experiments in normal saline solution were repeated 11 weeks later. The transverse relaxations were measured on the same samples using a spin-echo sequence with 15 variable echo times and were repeated twice.
The T1 measurements at 400 MHz were performed in the high-resolution small bore magnet of a Varian-U400 spectrometer at 25°C and 37°C. To avoid the effect of radiation damping caused by the huge water proton signal at this frequency, the T1 values were measured with a saturation recovery pulse sequence of the form 2 sat x /3-sal y /3 (Canet, 2005), where sat is the duration of a long radio frequency pulse on the order of 100 to 1,000 ms.
Estimations of the longitudinal and transverse relaxivities were better described by a piecewise linear regression rather than the usual rectilinear one, differentiating the relaxivity at low concentration from the one at high concentration. Relaxivities were also computed individually for each available data point to illustrate the dependence on [Gd-ACX].
Low-field nuclear magnetic relaxation dispersion: The low-field nuclear magnetic relaxation dispersion (NMRD) profiles were recorded automatically using a Stelar FFC-2000 relaxometer operating between 10 kHz and 35 MHz. The profiles were obtained at 25°C ± 1°C for four Gd-ACX concentrations 0.965, 1.91, 2.84, and 3.83 mmol/L in normal saline solution. The temperature dependence of the r1 relaxivity was studied for the 0.965 mmol/L sample by recording an additional profile at 37°C ± 1°C.
Magnetic Resonance Imaging Experiments
Animal model: All procedures related to animal care strictly conformed to the Guidelines of the French Government (decree 87 to 848 of 19 October 1987, licenses 38 03 21, 38 07 19, A 38 516 10004, and B 38 516 10003).
C6 rat glioma cells were unilaterally implanted into the right cerebral hemisphere (Kobayashi et al, 1980). Briefly, rats weighing 160 to 180 g were anesthetized (400 mg/kg chloral hydrate, intraperitoneally) and placed in a stereotaxic head holder. A middle scalp incision was made and, using a drill bit of 1 mm diameter, a hole was drilled 3.5 mm lateral to the midsagittal line at the level of the bregma. The cell suspension (105 cells in 5 μL) was slowly injected into the right caudate nucleus at 5.5 mm depth under the dura mater. The burr hole was sealed with Horsley wax, and the scalp was sutured. The survival time of the rats after this procedure is about 4 weeks.
Magnetic Resonance Imaging Protocols: All MRI experiments were performed at 100 MHz on a horizontal Bruker magnet of 40 cm diameter. Rats weighing 270 to 400 g were anesthetized with 1.3% to 1.8% isoflurane and placed in a prone position with their heads fixed by means of a tooth bar or ear bars. The body temperature was maintained at 37°C ± 1°C using a warm-water circuit. All rats were equipped with two catheters: in the femoral vein for CA administration and in the femoral artery for blood gas analysis.
Contrast agent solutions were manually injected at a rate of about 1 mL/min at a dose of 0.05 mmol/kg for Gd-ACX (25 mmol/L in terms of Gd3+) and at a dose of 0.1 mmol/kg for Gadolinium-1,4,7,10-tetrakis(carboxymethyl)-1,4,7,10-tetraazacyclo dodecane (Gd-DOTA) (50 mmol/L). With these concentrations, the total volumes of the injected solutions were 0.2mL/100g for both CAs.
In the CBVf experiments, arterial blood (0.01 mL) was withdrawn before and 5 mins after CA injection for blood gas analysis using a pH/blood gas analyzer (ABL 510; Radiometer, Copenhagen, Denmark) to confirm full oxygenation, a normal partial arterial CO2 pressure (PaCO2 = 40 ± 5 mm Hg = normocapnia) as well as normal hematocrit (>35%), as these parameters are known to affect cerebral hemodynamics.
Biodistribution: The biodistribution of Gd-ACX was studied in a C6 rat glioma model (n = 6) 19 to 23 days after tumor induction. In this experiment, a single-turn radio frequency coil of 30 mm diameter was used for signal excitation and reception.
A T2-weighted multislice spin-echo sequence with TR (repetition time)/TE (echo time) = 2,000/80 ms was used to obtain coronal anatomic images to delineate the spatial extent of the tumor. Seven contiguous coronal slices of 1 mm thickness were acquired in a field of view of 30 × 30 mm2 and with a 128 × 66 matrix size. With two averages, the total acquisition time was 4 mins and 48 sees.
The signal change after CA injection was monitored by a T1-weighted multislice spin-echo sequence with TR/TE = 500/20 ms and four averages giving a total acquisition time of about 2 mins. Acquisitions were performed before injection and 2, 15, 30, and 60 mins after injection of Gd-ACX. At 62 mins after Gd-ACX injection, Gd-DOTA was injected followed by a last T1-weighted acquisition.
Image processing was performed with an in-house software using an IDL program (interactive data language). The signal enhancement E(t) after CA injection was calculated pixelwise as:
where Spre and Spost(t) correspond to the signal obtained before and at time t after CA administration, respectively. The kinetic signal enhancement was calculated on three regions of interest (ROIs) located in the lumen of the cavernous sinus (⌣10 pixels), covering the whole tumor (⌣200 pixels), and in the periphery of the tumor (⌣50 pixels).
Cerebral blood volume fraction: In this experiment, five control rats and eight tumor-bearing male Wistar rats (3 weeks after tumor implantation) were investigated using a homogeneous radio frequency coil for emission and a single-turn radio frequency surface coil for reception. The rapid steady-state T1 (RSST1) method for mapping the CBVf was used (Perles-Barbacaru and Lahrech, 2007). After CA injection, the method allowed for the suppression of the extravascular signal (characterized by a T1 ≤ 1 sec) and the selective visualization of the intravascular signal, which was proportional to the equilibrium magnetization of the intravascular water protons and consequent to the CBV (as long as T1 ≥ TI (inversion time)/5). This was achieved with a IR-FLASH (inversion recovery fast low-angle shot) sequence (Haase, 1990) acting like a low-pass T1 filter. The experiment consists in the acquisition of a series of RSST1 images before and just after injection of Gd-ACX and 1h after Gd-DOTA, when the signal was in a steady state corresponding to the intravascular magnetization at thermal equilibrium. Each image (coronal slice of 2 mm thickness with a matrix size of 32 × 32 and a field of view of 24 × 24 mm2) was acquired every 750 ms. The FLASH module was used with a flip angle of 10°, a TR = 10.5 ms, and a TE = 3.2 ms. The image acquisition started with the center of k-space at TI = 325 ms and sampling from low to high spatial frequencies (center out). To obtain the fraction of CBV, the total magnetization at thermal equilibrium was acquired for normalization. Images with anatomic contrast were acquired using the same sequence with a spatial resolution of 187.5 × 375 μm2, TR = 3,500 ms, TI = 325 ms, and a number of averages = 8. This image facilitated the delineation of ROIs and the localization of large vessels.
Assuming a slow water exchange regime, the CBVf map was calculated from the signal in each pixel using the following equation:
where Sprei is the signal acquired before CA injection, Sposti is the signal acquired immediately after CA injection, and Soi is the signal corresponding to the equilibrium magnetization of the intra- and extravascular compartments. In this experiment, N= 200 images were averaged corresponding to 2.5 mins during which the Spost signal amplitude is in a steady state.
Results
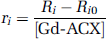
Hemolytic Activity: Figure 1A shows the hemolytic activity of ACD, ACX, and Gd-ACX. It was found that a 12mmol/L concentration of ACD induces 50% hemolysis, as has been obtained previously (Debouzy et al, 2002). At this concentration, no hemolysis could be detected, either with ACX or with Gd-ACX. Hemolysis occurring with ACX or Gd-ACX never exceeded 5% even at an ACX concentration of 41 mmol/L, and was even lower for Gd-ACX than for ACX alone. Note that for in vivo MRI applications, typical concentrations of Gd-ACX in blood after intravenous injection ranged between 1 and 2 mmol/L.
Biocompatibility studies. (
Lethal dose 50%: In the first biocompatibility experiment, no adverse effect was observed after injection of 0.9 mmol ACX/kg at the maximum soluble concentration corresponding to 45 mmol/L. However, an injection of a solution of the complex Gd-ACX (27:45 mmol/L) at a dose of 0.54mmol/kg led to the deaths of three out of five mice within 1 day. One of the surviving mice showed a 20% weight loss along with major behavioral anomalies such as prostration.
In the second experiment, in which doses up to 0.42 mmol/kg Gd-ACX were administered, no death occurred and neither abnormal locomotor activity nor trembling nor global weight loss was observed. However, during the first 2 days, transient weight loss accompanied by prostration and porphyrin-wet pilosity, indicative of a general health status alteration (Harkness and Wagner, 1989), were observed within the two mice groups subjected to the two highest Gd-ACX doses (0.42 and 0.14mmol/kg). As shown in Figure 1B, the weight loss was followed by recovery and normal growth and it was significant (P<0.5) only for the group that received a dose of 0.42 mmol/kg.
In the last experiment, no mortality was observed, but the Gd-ACX injection at a dose of 0.50 mmol/kg also led to transient weight loss (data not shown). After the 7-day observation period, all mice had the same weight percentage gain.
Histologic examination of the glomerular and tubular system of the kidneys 1 week after ACX or Gd-ACX administration (data not shown) did not reveal any evidence for nephrotoxicity, either for the surviving animals or for the three mice that died in the first experiment. In the brain hemisphere contralateral to the C6 tumors, no morphologic damage was observed by microscopy 1 h after Gd-ACX injection, except for a substantial shift and compression, which is frequently observed in the presence of large tumors. Finally, from these three experiments, it was concluded that the LD50% of Gd-ACX is in the range of 0.50 to 0.54 mmol/kg (corresponding to concentrations of 25 to 27mmol/L, respectively). The LD50% is five times higher than the usual dose of Gd-DOTA and 10 times higher than the Gd-ACX dose used for the in vivo MRI experiments.
Nuclear Magnetic Resonance Relaxivities
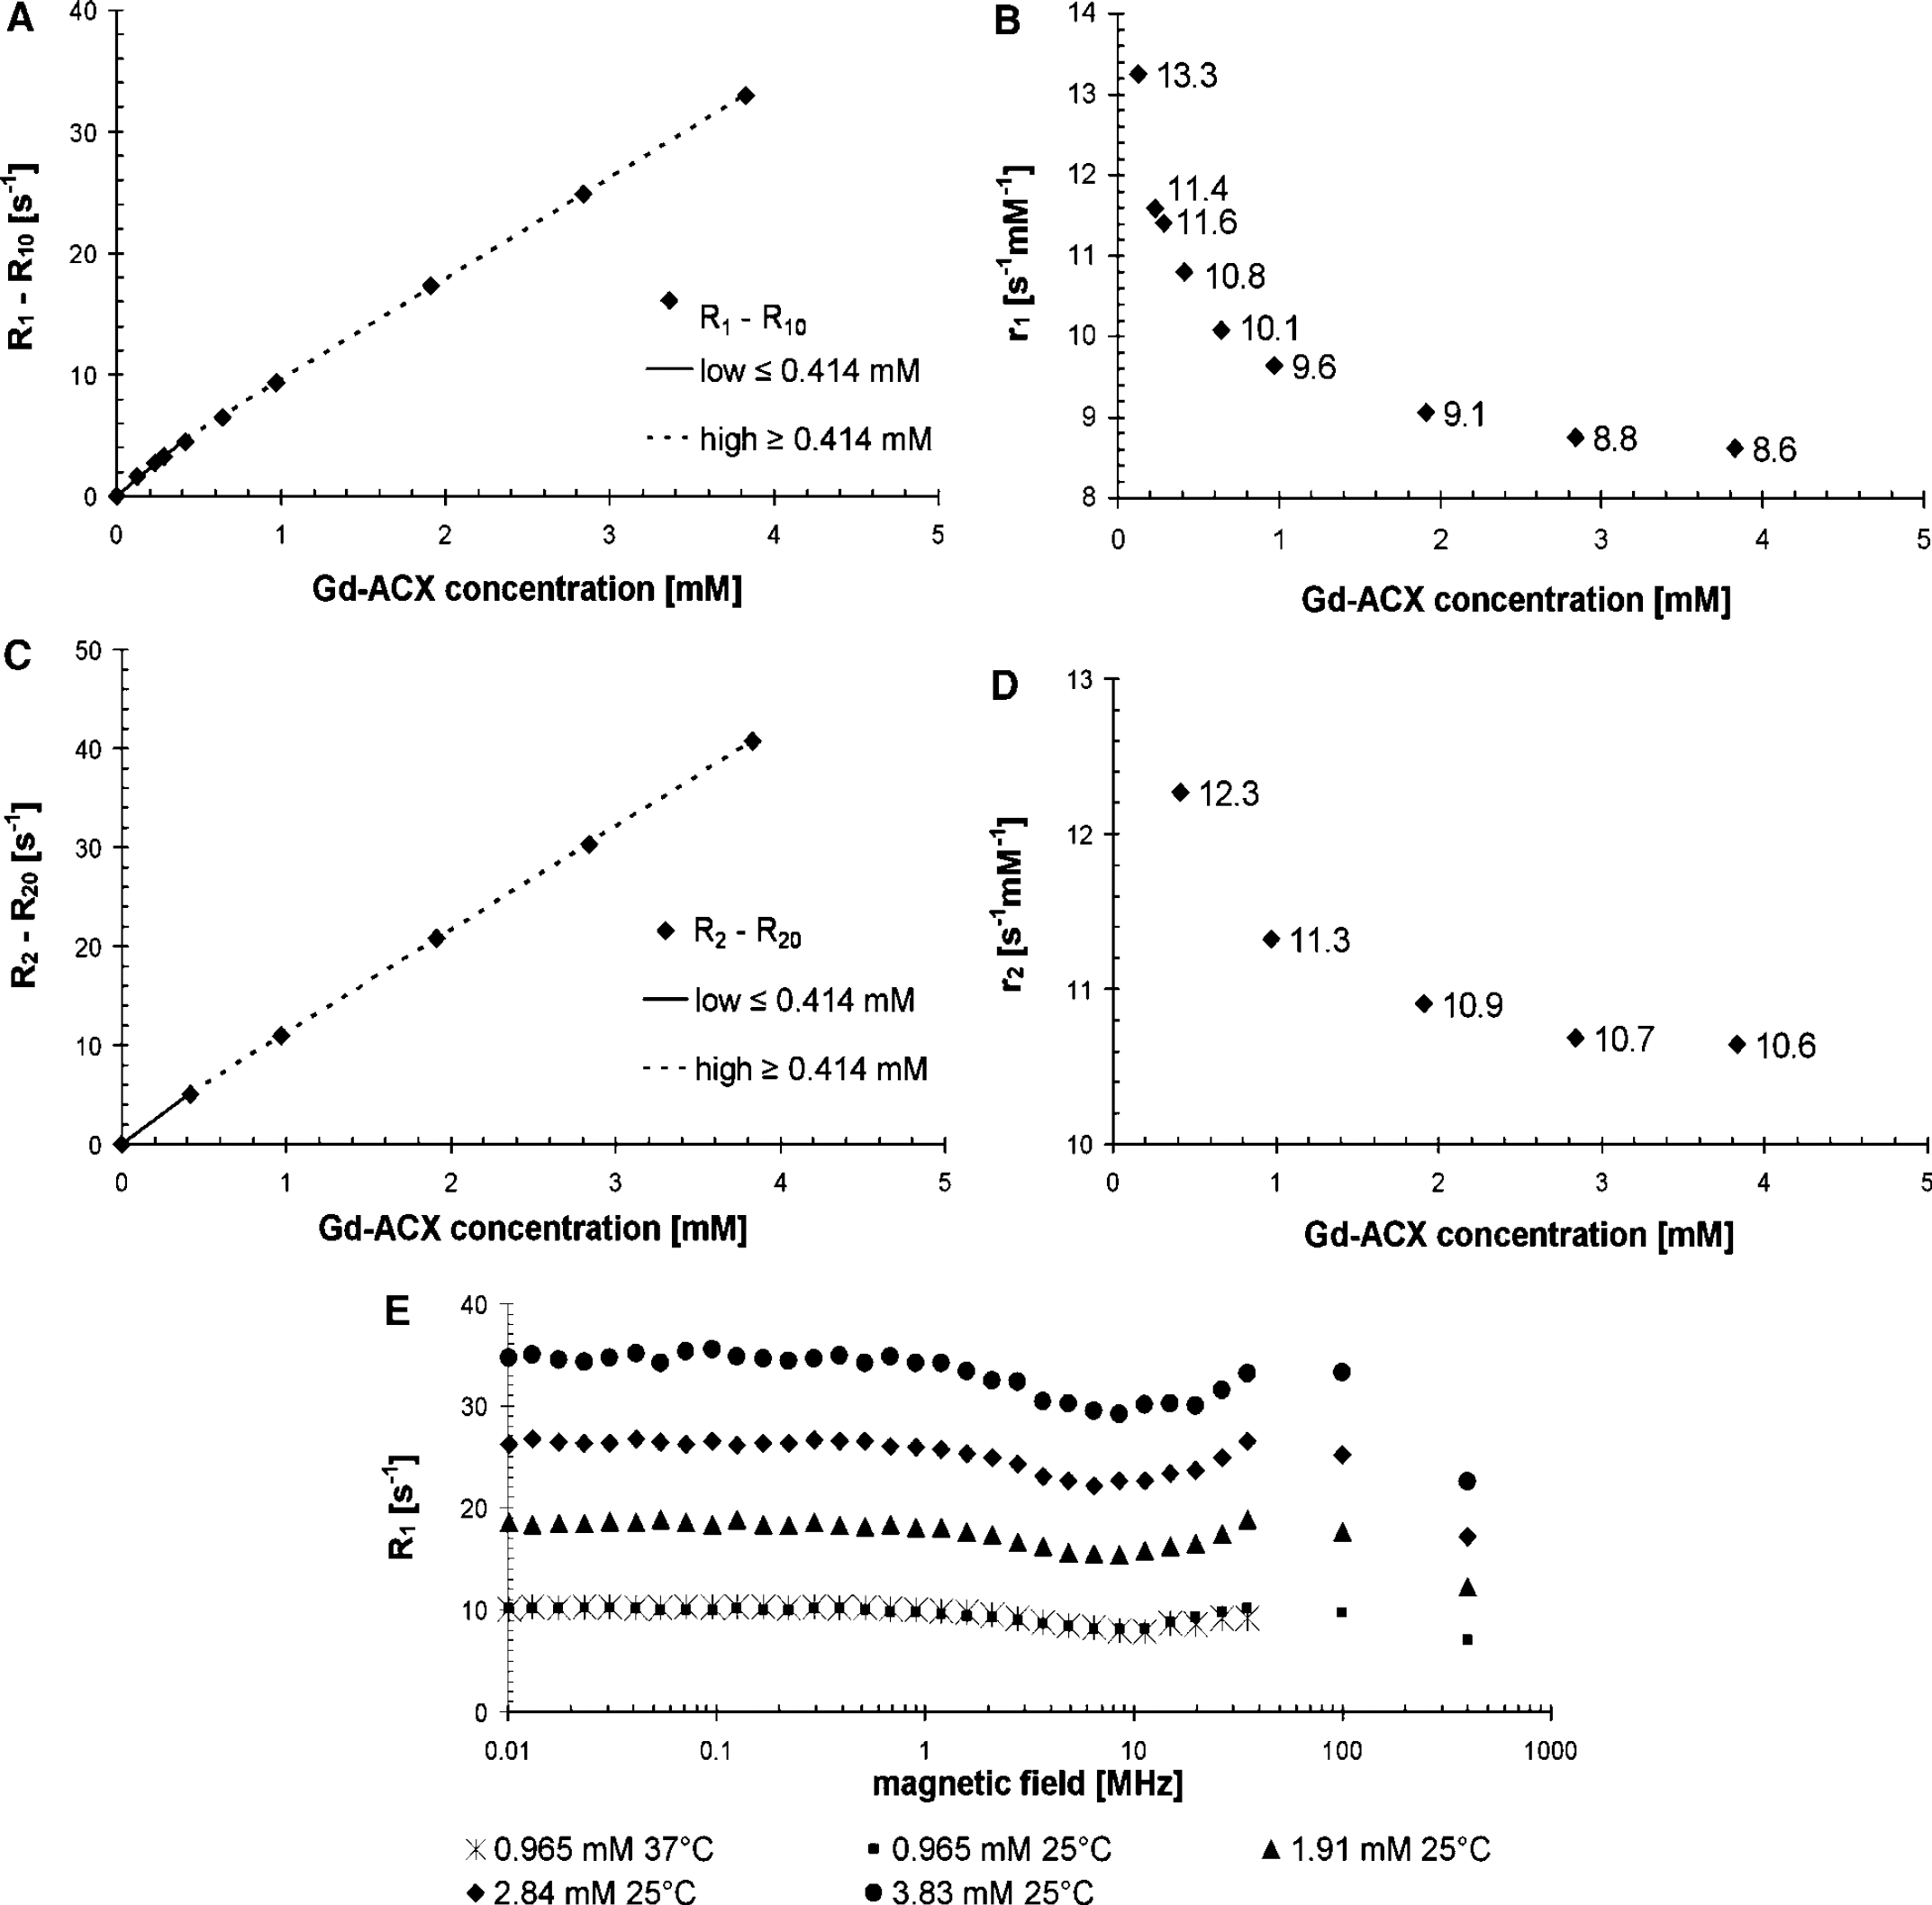
Relaxivity at 100MHz: The longitudinal relaxation rate enhancement ΔR1 = R1-R10 of water protons at 21°C versus the Gd-ACX concentration in normal saline solution is displayed in Figures 2A and 2B. This relaxation rate enhancement is approximated by low- and high-concentration linear regimes of notably different slopes 11.3 and 8.3 per sec per mmol/L, respectively (Figure 2B). This slope difference can be further investigated by studying the r1 relaxivity of Gd-ACX, which is defined by equation (1) for each studied Gd-ACX concentration plotted in Figure 2B versus this concentration. This relaxivity has a smooth behavior, which is an indication of the accuracy of the concentration and relaxation measurements. It decreases smoothly from 13.3 to 8.6 per sec per mmol/L as [Gd-ACX] increases from 0.126 to 3.83 mmol/L. At 100 MHz and for concentrations above 3 mmol/L, it is still 8.6 per sec per mmol/L, about twice as high as the r1 of Gd-DOTA at the same temperature (Powell et al, 1996). In addition, it was constant in time. In human plasma at 20°C, the r1 relaxivity was measured in the concentration range 0.3 to 1.5 mmol/L, where it shows a slight overall decrease from about 11.6 to 10.7 per sec per mmol/L as [Gd-ACX] increases.
Longitudinal r1 (
The transverse relaxation rate enhancement ΔR2 = R2-R20 of water protons in normal saline solution at 100 MHz and 20°C is plotted versus [Gd-ACX] in Figure 2C. The overall transverse relaxivity r2, which is 12.4 per sec per mmol/L in the low-concentration regime below 0.414 mmol/L, decreases to 10.4 per sec per mmol/L in the high-concentration regime above 0.414 mmol/L. In both concentration ranges, the r2 is also about twice as high as the r2 of Gd-DOTA (5 per sec per mmol/L). The r2 dependence on the Gd-ACX concentration is shown in Figure 2D. Its decrease with [Gd-ACX] is less pronounced than that of ra.
Nuclear Magnetic Relaxation Dispersion Profiles: Figure 2E shows the NMRD profiles measured at 25°C for four different Gd-ACX concentrations in normal saline solution. In contrast to the typical NMRD profiles of usual paramagnetic CAs, the profiles of Gd-ACX are flat up to frequencies of 100 MHz. Almost no temperature dependence can be observed at the available Larmor frequencies.
In Vivo Magnetic Resonance Imaging
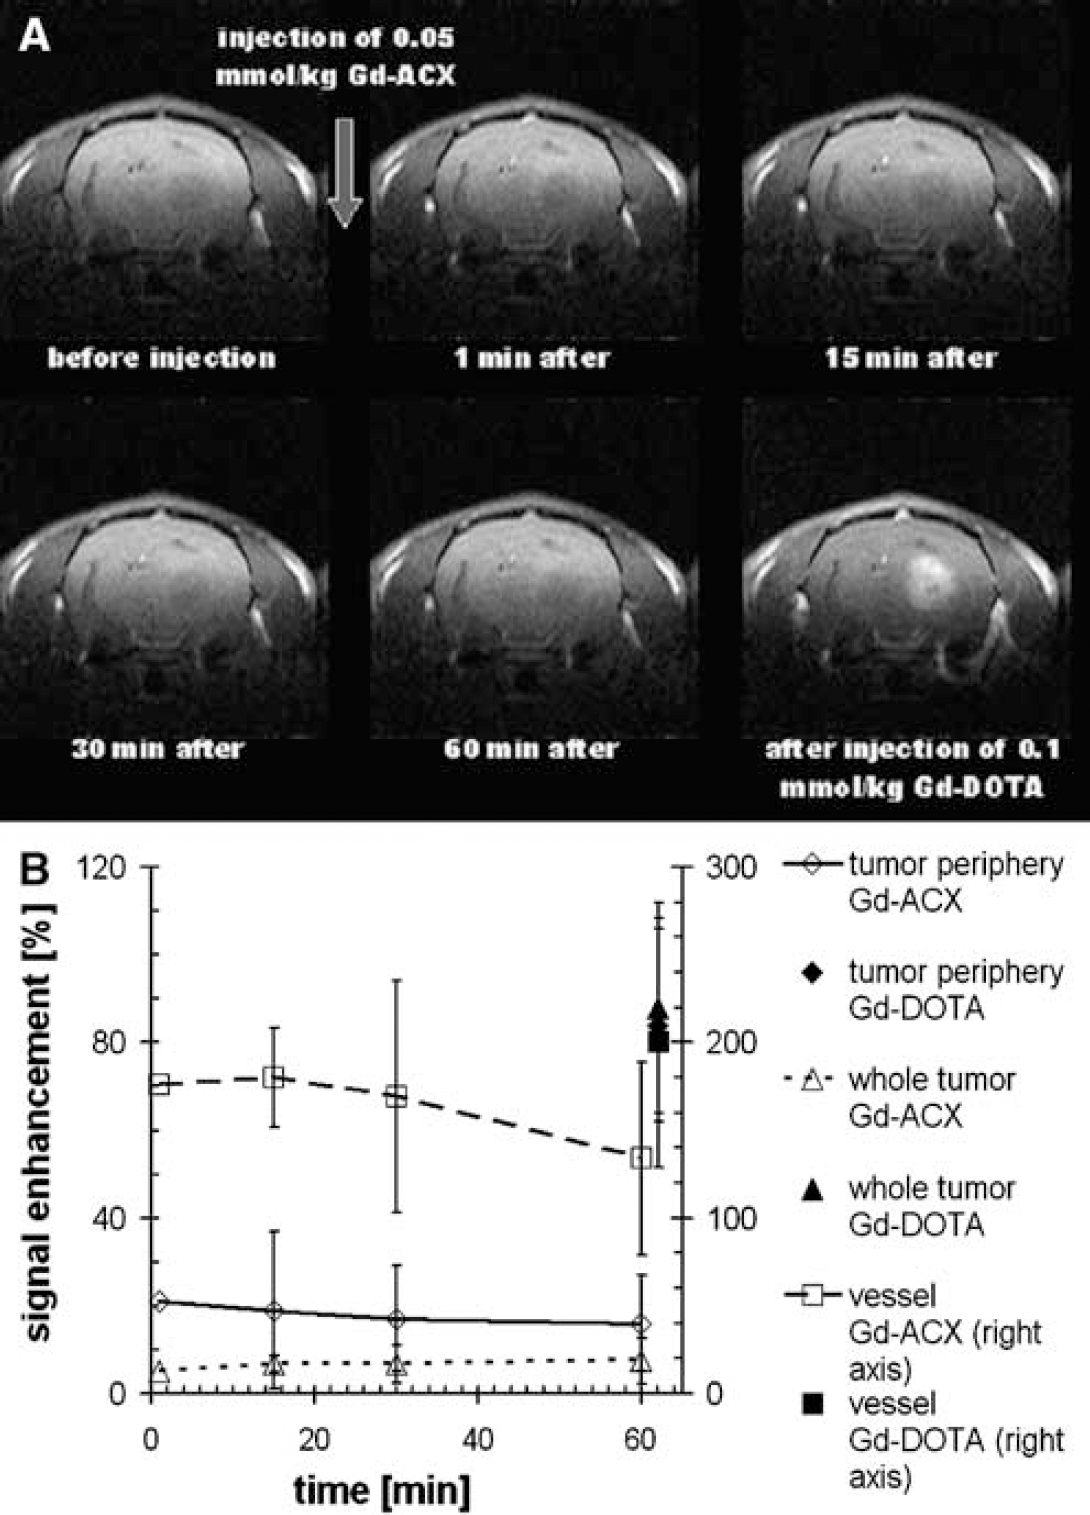
Gd-ACX biodistribution in a C6 glioma model: Figure 3A shows T1-weighted coronal images of a typical C6 glioma-bearing rat obtained before and at different time points after intravenous injection of 0.05 mmol/kg Gd-ACX. In this figure, the last image was obtained just after the injection of 0.1 mmol/kg Gd-DOTA. It can be observed that after Gd-ACX injection, the signal enhancement appears immediately in the visible vessels but not in the tumor. No extravasation of Gd-ACX takes place in the tumor area, whereas injection of Gd-DOTA reveals disruption of the BBB, as an extensive signal enhancement is observed inside the tumor area. A quantitative analysis of the biodistribution of both CAs is presented in Figure 3B, in which the temporal evolution of the relative signal enhancement with Gd-ACX is plotted within three ROIs. A sudden signal enhancement of 176% appears in the vascular ROI after injection of Gd-ACX. In the tumor as a whole, no enhancement (<8%) was observed during the first hour after Gd-ACX injection. In the tumor periphery, there was an enhancement of 21%, which appeared as rapidly as that in the vascular ROI, indicating a vascular origin.
(
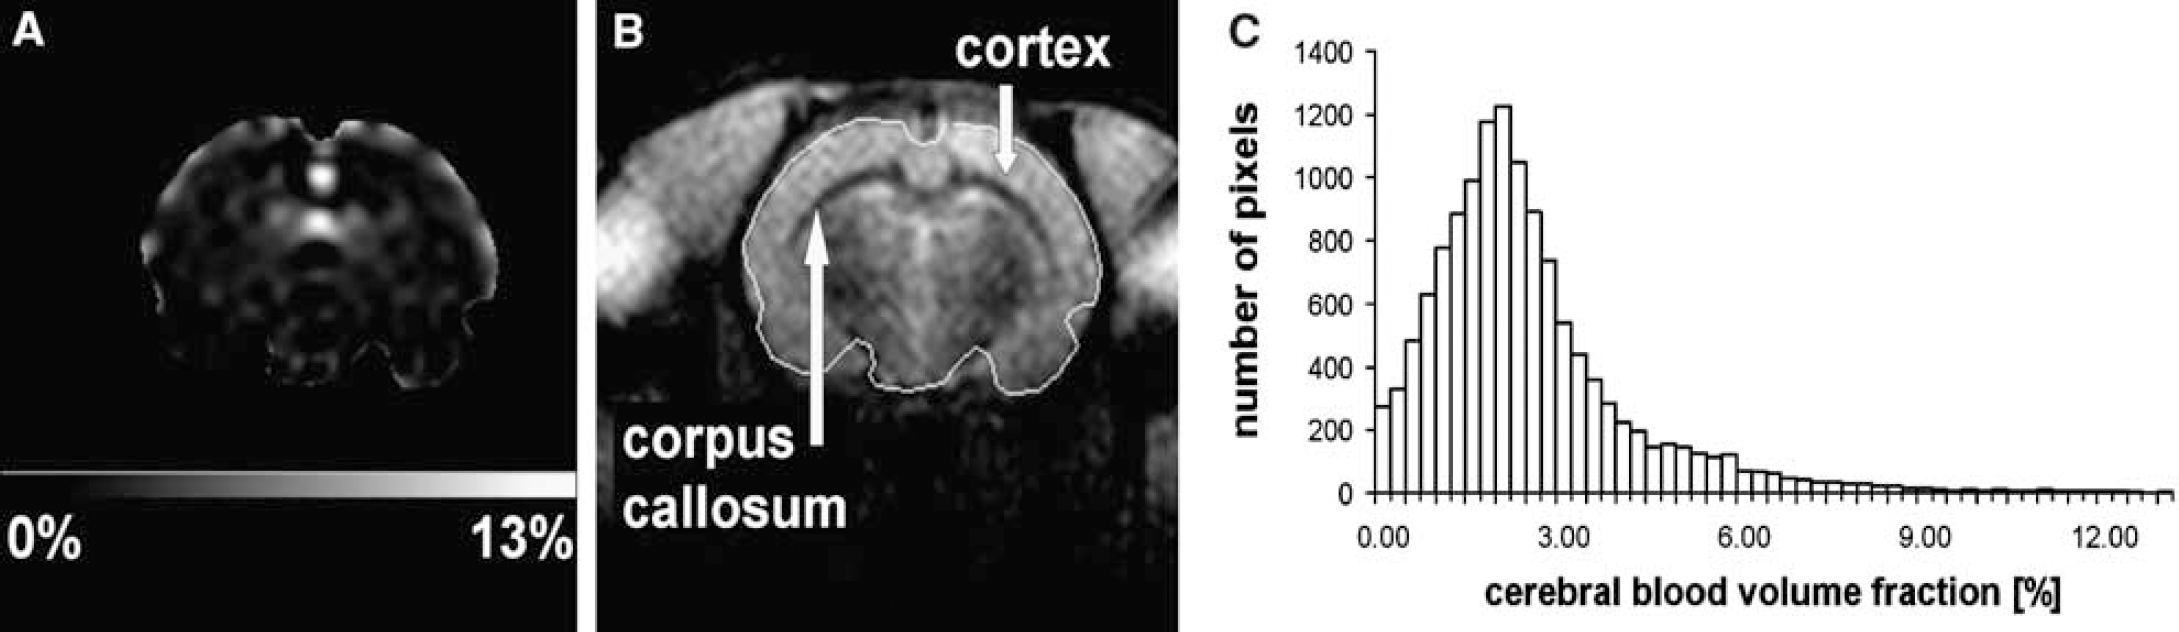
Cerebral Blood Volume Quantification: The CBVf map of one healthy rat in Figure 4A corresponds to the coronal brain slice with anatomic details shown in Figure 4B. For this rat brain, the average CBVf of the whole slice was 2.7% ± 0.2%. The s.d. of 0.2% reflects the temporal instability of the signal during 2.5mins, as N = 200 acquisitions were averaged to obtain the CBVf map. However, it was observed that the signal obtained by the RSST1 method after a 0.05 mmol/kg Gd-ACX bolus injection remained constant for at least 5mins (duration of the entire MRI experiment), allowing further averaging for SNR (signal-to-noise ratio) increase, whereas after a bolus injection of 0.1 mmol/kg Gd-DOTA, without previous and recent CA injection, it is known to decrease immediately (Perles-Barbacaru and Lahrech, 2007) because of rapid extravasation in extracerebral tissues. The CBVf histogram in Figure 4C illustrates the heterogeneity of the CBVf for different brain matters included in the ROI. This heterogeneity is also expressed by a large standard deviation of the mean CBVf within the ROI of 1.9%. The white matter of the corpus callosum appears darker because its blood volume fraction of 1.6% ± 0.9% is smaller than that of the cortex tissue, which has a value equal to 2.8% ± 0.7%. The value obtained in a small ROI centered in the cavernous sinus is 78% ± 7%. Extracerebral vascular structures are excluded from the map for better contrast within the low CBVf range of brain tissues. Averaged over five healthy normocapnic rats, the global CBVf (ROI encompassing the whole brain in the coronal slice) obtained with Gd-ACX was 2.2% ± 0.4%.
Cerebral blood volume fraction (CBVf) measure in healthy normocapnic rat brain with the rapid steady-state T1 method using Gd-ACX as contrast agent. (
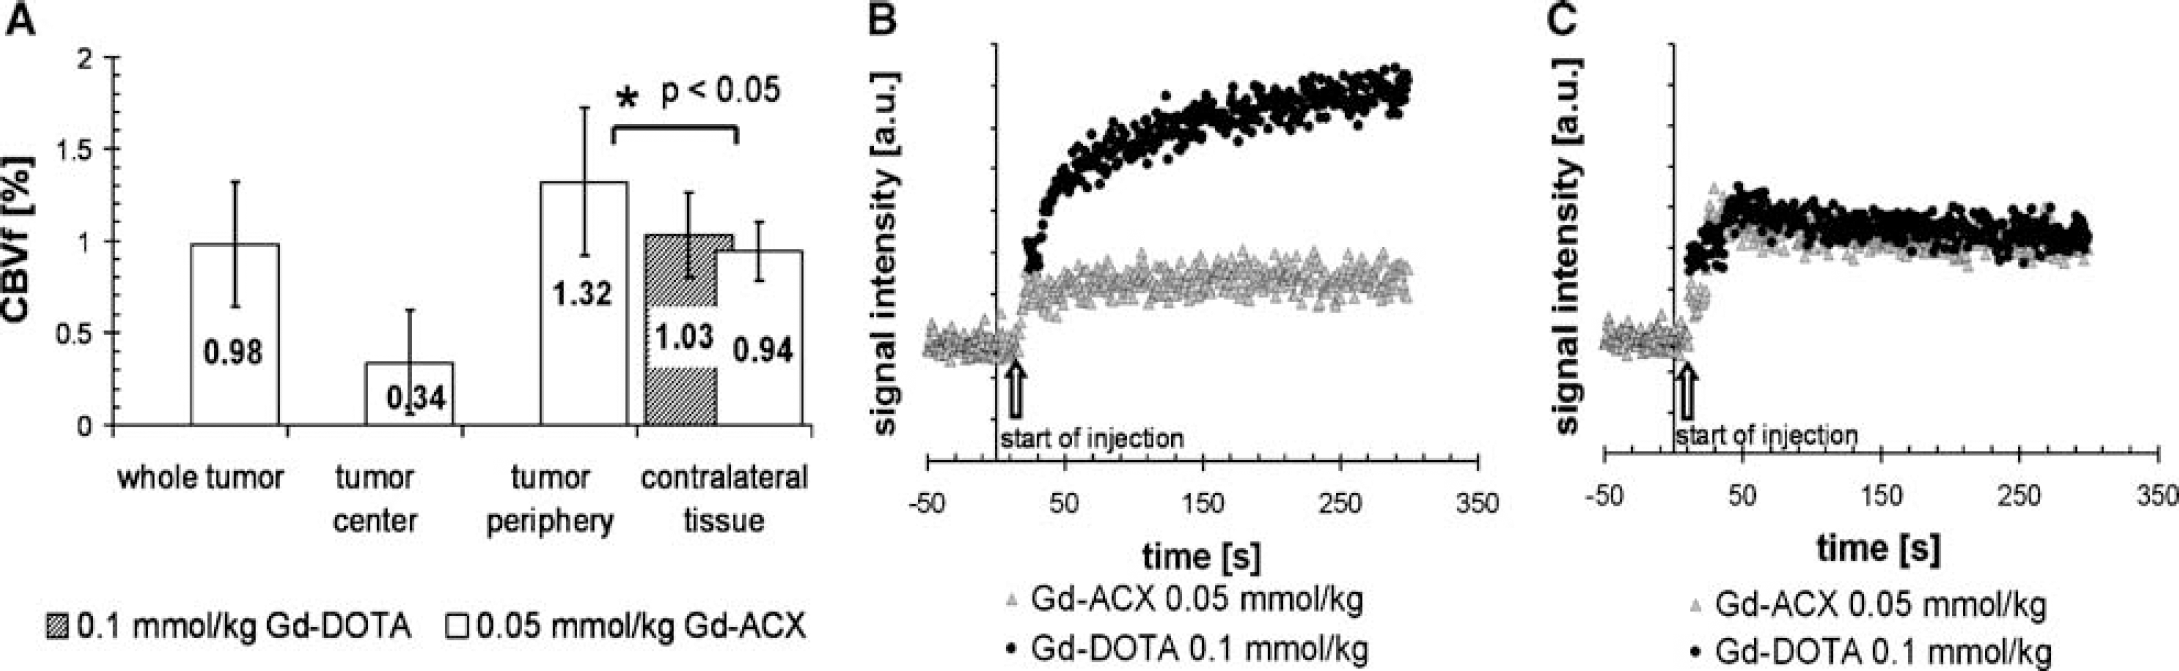
Figure 5A illustrates the mean CBVf values obtained in various ROIs in tumor-bearing rat brains (n = 8). A mean CBVf value of 0.98% ± 0.34% was obtained in the tumor ROIs, which on average covered 46% ± 11% of the whole brain section area. In the contralateral hemisphere, similar CBVf values were obtained with both CAs: 0.94% ± 0.16% with Gd-ACX and 1.03% ± 0.23% with Gd-DOTA.
Cerebral blood volume fraction (CBVf) measure in a C6 tumor model with the rapid steady-state T1 method using Gd-ACX as contrast agent. (
In all eight cases, the CBVf in the tumor center was low, corresponding to a necrotic region, as was confirmed by microscopy analysis (data not shown). The CBVf in the tumor periphery was 1.32% ± 0.40%, which is significantly different (P<0.05) from the mean CBVf value in the contralateral tissue.
The signal versus time plots in Figures 5B and 5C are from one representative rat. Figure 5B shows the signal from the tumor ROI. After Gd-ACX injection, it remains perfectly constant for about 5mins, whereas after Gd-DOTA injection the signal increases continuously, reflecting CA accumulation in the tissue because of a BBB leakage for this CA. Therefore, all CBVf measures in tumor tissue were obtained from measurements after Gd-ACX injection. Figure 5C shows the identical signal behavior in cerebral tissue contralateral to the tumor after injection of Gd-ACX and Gd-DOTA.
Discussion
For the first time, despite the rather moderate thermodynamic affinity of modified ACX for the trivalent lanthanide cations, it was shown that the Gd-ACX complex composed of the Gd3+ metal ion and the biocompatible ACX ligand can be used as a paramagnetic CA for preclinical in vivo MRI studies. It presents two major advantages with respect to Gd-DOTA, commonly used in clinical practice: it has a twofold longitudinal relaxivity and remains confined to the intravascular space during at least 1 h even in the case of a BBB permeable to Gd-DOTA. Therefore, Gd-ACX has properties of blood pool CA such as macromolecular complexes. This class of CAs is very important to assess brain hemodynamics and function in diseases related to the microvasculature such as ischemia and tumor angiogenesis.
Biocompatibility
Because the longitudinal relaxivity of Gd-ACX is two to three times greater than that of Gd-DOTA, the doses necessary for the in vivo MRI measurements are 1/10th of the LD50% determined in this study (1/100th for Gd-DOTA). The Gd-ACX can be administered in the form of a Gd-ACX solution of a concentration as high as 25 mmol/L with 41 mmol/L of ACX without adverse effects. However, solution concentrations approaching the maximum solubility of this ligand (45 mmol/L) can become toxic, probably because of the formation of insoluble precipitates. Moreover, the biocompatibility experiments reveal that, contrary to natural ACD, the hemolytic activity of ACX and Gd-ACX remains negligible at all concentrations. This accounts for the biocompatibility of Gd-ACX solutions with a notable excess of ACX.
Given the biocompatibility conditions and its limits, we exclude the use of this CA for human investigations. However, the benefit-to-risk ratio justifies the use of Gd-ACX for preclinical applications despite the thermodynamic stability constant of the Gd-ACX complex, which is of the same order as the one of the Lu-ACX complex (log KGd-ACX ⌣ log KLu-ACX = 7.5) (Bonnet et al, 2005). The selectivity of ACX for some endogenous ions Cu2+, Ca2+, Na+, and K+ was evaluated in vitro (Fauvelle, 1999). The association constants KX-ACX for X = K+ or Cs+ were on the order of log KX-ACX ⌣ 2, low compared to that of Lu-ACX and even lower for Cu2+, Ca2+, and Na+, such that no complex formation with ACX was detectable with NMR spectroscopy. In vitro relaxometry could be used to confirm these results and determine whether plasma anions compete with ACX for the Gd3+ ion.
Although no nephrotoxicity or morphologic damage to the brain tissue has been detected, we agree that further toxicity experiments are needed for a larger use of Gd-ACX in in vivo studies.
Nuclear Magnetic Resonance Relaxivities of Gd-ACX
Several kinds of paramagnetic CAs covering various applications have been developed (Aime et al, 2005; Caravan et al, 1999). They can be classified into three categories: gadolinium chelates, manganese chelates, and iron oxide nanoparticles. Complexes of Gd3+ are by far the most widely used CAs because of their highest electronic spin value (S = 7/2). At the usual imaging fields of 0.5 to 1.5 T, the common clinical CAs have relaxivities around 4 to 5 per sec per mmol/L, whereas relaxivities on the order of 50 to 100 per sec per mmol/L are expected within the framework of the Solomon-Bloembergen-Morgan theory (Aime et al, 2005; Caravan et al, 1999; Livramento et al, 2006a, b; Vander Eist et al, 2003), if the rotational diffusion speed of the complex, the residence life time of the water molecules coordinated to Gd3+, and the electronic relaxation of the spin of this ion have their optimal values.
The NMR profiles of Gd-ACX exhibit only a modest dispersion with frequency. At a Gd-ACX concentration of 0.97 mmol/L, the r1 relaxivity is 10.5 per sec per mmol/L at 35 MHz and still 7.3 per sec per mmol/L at 400 MHz. This is consistent with the absence of free Gd3+ ions in the solution, as the profiles are very different from those of the free aquo Gd3+ ion (Powell et al, 1996).
Moreover, this constant behavior of the NMRD profiles can be explained by a dominant inner-sphere relaxivity rIS, which is governed by
The outer-sphere contribution to the relaxivity, which stems from the water molecules diffusing freely with respect to the Gd complex, is typically on the order of only 2 per sec per mmol/L (Fries et al, 2005; Powell et al, 1996). Because the measured r1 values are high, they have to be attributed to the inner-sphere proton relaxation enhancement mechanism.
Unexpectedly, r1 and r2 relaxivities depend on Gd-ACX concentrations at a given field (Figures 2B and 2D), confirmed by multiple experiments in which particular care was taken to obtain solutions with highly accurate Gd-ACX concentrations. A precise interpretation in terms of structural and dynamic molecular factors is well beyond the standard approach (Aime et al, 2005; Caravan et al, 1999; Vander Eist et al, 2003), and a much deeper physicochemical characterization involving the su-pramolecular mechanism and additional experimental investigations (such as electronic relaxation; Fries et al, 2005; Nonat et al, 2006) are necessary to understand the origin of the unusual relaxation properties. This is beyond the scope of this study, in which the experimental characterization of the relaxivity is sufficient to assess the contrast efficacy of Gd-ACX.
At the standard dose of MRI blood pool CAs, resulting in a vascular CA concentration of 1.4 to 2 mmol/L just after injection, the average r1 relaxivity of Gd-ACX is 9.1 per sec per mmol/L in normal saline solution and 10.7 per sec per mmol/L in human plasma, that is, 2.5 to 3 times larger than that of Gd-DOTA (Fonchy et al, 2001; Powell et al, 1996).
Finally, the Gd-ACX complex in solutions stored in sealed tubes at 4°C are chemically stable for a few months, as shown by the fact that strictly the same r1 relaxivity values were obtained just after the solutions were prepared, and 2 months later. In particular, this result indicates that no substantial concentration of free gadolinium ions has appeared in normal saline solution during this period. Although this is an encouraging finding, it is not sufficient proof of the in vivo stability of Gd-ACX.
In Vivo Magnetic Resonance Imaging
Although the low value of the stability constant seems to prevent an in vivo use of this compound, MRI was successfully performed on rats using a 25 mmol/L Gd-ACX solution (in terms of Gd3+), intravenously administrated at the dose of 0.05mmol/kg.
The new CA Gd-ACX is characterized by a r1 relaxivity higher than that of Gd-DOTA. In cerebral tissues with a BBB breakdown, Gd-ACX remains intravascular and does not accumulate within the tumor for at least 1 h after administration. These two properties make it an appropriate CA for CBV quantification using the RSST1 method.
Both MRI experiments on rats studying the biodistribution of Gd-ACX and mapping the CBVf show that this CA remains intravascular in brain tissue. In the second experiment, in which the signal is independent of transversal relaxation effects and in which the doses of Gd-ACX and Gd-DOTA were T1 isoefficient, the longer steady signal duration of Gd-ACX compared to that of Gd-DOTA indicates a longer blood half-life of Gd-ACX. Gadolinium per (3,6-anhydro) α-cyclodextrin could therefore be a convenient CA for MR angiographies, as well as to assess cerebral hemodynamic parameters in areas of ischemia and to provide information about the extent of tumor neovascularity.
The absence of a continuous signal increase in tumor after injection implies that Gd-ACX does not leak out of the tumor vessels. This finding is probably attributable to the diffusion-limited delivery of the Gd-ACX complex to the endothelial cells, which is related to one or more of the following properties: disk shape, size, charge, and hydrophilicity. Another hypothesis is that a plasma protein binds the compound. Therefore, Gd-ACX does not allow early differentiation of lesions with BBB disruption from normal tissue, as is the case when using Gd-DOTA. However, in this study, we show that the intravascular confinement of Gd-ACX in the presence of a Gd-DOTA-permeable BBB is interesting and appropriate for the differential diagnosis between pathologies with abnormal vasculature as well as for the quantification of hemodynamic parameters in the presence of BBB lesions. Cerebral blood volume fraction measurements in healthy brain tissue and in a C6 tumor model in rats, as performed in this study using the RSST1 method, confirm the potential of Gd-ACX for angiogenesis characterization.
The CBVf values of 2.2 ± 0.4% obtained for healthy brain tissue in this preliminary study are in the range of CBVf values reported in the literature obtained by various techniques: autoradiography (Todd et al, 1992), MRI (Lin et al, 1997), synchrotron radiation quantitative computed tomography (Adam et al, 2003), and histology (Pathak et al, 2001), but lower than those obtained in a previous study with an experimental MRI CA P760 (3.3% ± 0.7%; Perles-Barbacaru and Lahrech, 2007). However, the ROIs placed in vascular structures revealed similar maximal values (70%) as obtained with other CAs (Perles-Barbacaru and Lahrech, 2007). A value of 100% is never attained because of partial volume and transversal relaxation effects.
The ratios between the CBVf from the ROIs shown in Figure 5A appear consistent, as expected, despite the fact that the CBVf values in tumor ROIs are probably affected by an increased intravascular/extravascular water exchange rate, which is difficult to determine. This advanced stage C6 tumor model is characterized by a large CBVf heterogeneity, and the low CBVf in the ROIs covering the whole tumor is surely caused by a large necrotic center. These findings were confirmed by vascular immunohistology on the same tumors, for which first qualitative analysis also reveals a low microvascular density.
Almost equal CBVf values were obtained in the contralateral tissue using the new CA Gd-ACX and also Gd-DOTA with which the CBVf measures have been validated (Perles-Barbacaru and Lahrech, 2007). The rather low contralateral CBVf obtained with both CAs might be explained by the mass effect of very large C6 tumors, which cover almost 50% of the brain section in a coronal plane. Edema, increased interstitial pressure, and possible tumor infiltration are other causes that could explain the decreased blood volume in the contralateral hemisphere. Impaired metabolism and decreased blood flow in the contralateral hemisphere (Beaney et al, 1985; Ito et al, 1982), as well as decreased blood flow and volume in the peritumoral region (Ito et al, 1982; Uematsu et al, 2003) and contralateral hemisphere (Julien et al, 2004), have also been observed by other authors.
Conclusion
In this study, we show the possibility of quantifying the CBV in tumor tissue with compromised BBB, using the RSST1 method in conjunction with Gd-ACX, a new MRI CA.
This new Gd-ACX, composed of a modified cyclodextrin, was found to have a higher relaxivity than Gd-DOTA, but its main interest lies in its use for the quantification of cerebral hemodynamic parameters by MRI in the presence of BBB damage. Therefore, it is possible to perform longitudinal studies to evaluate the effect of new antivascular drugs.
Despite its modest thermodynamic stability in solution, the experimental conditions for in vivo use of this CA in animals were carefully studied. Further investigations remain necessary firstly to explain the relaxation mechanism and secondly to elucidate the cause of its high vascular confinement.
The recently synthesized BCX (β-cyclodextrin derivative) is analog to ACX with seven instead of six glucose units and is characterized by a greater solubility. Its complex with Gd3+ has a higher relaxivity. If its biocompatibility can be confirmed, Gd-BCX could be an even more promising CA than Gd-ACX.
Footnotes
ACX Synthesis
The starting compound was hexakis (3,6-anhydro)-cyclomaltohexaose, simply denoted as per (3,6-anhydro)-α-cyclodextrin and synthesized according to a previously described procedure (Gadelle and Defaye, 1991). Hexakis (2-O-carboxymethyl-3,6-anhydro)-α-cyclodextrin, named ACX (Figure 6A), was obtained in one step in the form of its hydrated sodium salt by substituting the residual hydroxyl groups of per (3,6-anhydro)-α-cyclodextrin by carboxymethyl groups as follows. Per (3,6-anhydro)-α-cyclodextrin (1 g, 1.15 mmol) was dissolved at room temperature under argon atmosphere in a mixture of dimethylsulfoxide (DMSO) (10 mL) and a solution of NaH in DMSO (7mL, 2N). After 3h, sodium monochloracetate (1.6 g, 14 mmol) was added and the mixture was maintained at 45°C under argon atmosphere for 15 h. DMSO was removed under vacuum, and the residue was dispersed in acetone for 1 day and removed by centrifugation. For further purification, the residual solid was dissolved in water (200 mL) and dialyzed (1.5 L water, Spectra/PortCE Sterile DispoDialysers-cellulose ester membrane-MWCO 500). The final solution was lyophilized and 1 g of ACX was obtained (54%). The synthesis was repeated several times to get the quantity of ACX required for the biocompatibility, relaxometry, and MRI studies. The chemical formula of the product, its structure, and purity were controlled after each synthesis with the help of the following analytical techniques. Microanalysis (Service Central de Microanalyse du CNRS, Solaize, France) was performed to check the basic chemical formula of ACX, to assess the number of hydration water molecules attached to it, and to control the absence of iodine that might have been introduced with the starting compound as a residual synthesis impurity. Assuming that the hydrated product has the basic chemical formula Na6ACX.14.5H2O, the measured results of a typical microanalysis were C (35.86%), H (5.03%), and Na (8.53%) in fair agreement with the values C (35.90%), H (5.21%), and Na (8.59%) calculated from the chemical formula. The molar mass of ACX was controlled by mass spectrometry electrospray (LCQ—THERMO-ELECTRON). Nuclear magnetic resonance in solution was performed to investigate the chemical structure of ACX. A typical 1H-NMR spectrum of ACX in D2O (AVANCE 200 Bruker spectrometer) is presented in Figure 6B, for which the 1H attribution of the various peaks were obtained by selective double irradiation and checked by homonuclear COSY 2D-NMR. 1H-NMR and 13C-NMR were also used to assess the purity of the product.
Gd-ACX Complexation
The 1:1 Gd-ACX complexes were prepared in normal saline solution (NaCl at 0.9% w/v in H2O) by dissolving gadolinium chloride (GdCl3.6H2O; Sigma, La Verpillere, France) and ACX in excess in the 1:y stoichiometry with 1.5 < y < 2. Because of the moderate value of the formation constant of Gd-ACX, an excess of ACX was systematically used in this study to minimize the presence of free Gd3+ in the solution. The Gd3+ concentrations of the mother Gd-ACX solutions did not exceed 27mmol/L because the ACX aqueous solubility was found to be limited to 45mmol/L. In this study, all injected doses of the complex Gd-ACX are expressed in mmol/kg in terms of Gd3+.
The ACX was washed twice in ethyl ether to remove iodine residues and dried under vacuum to yield a compound of formula ACX.(nH2O) (n ⌣ 14) and molar mass of 1,464 Da. After dissolving ACX · (nH2O) and GdCl3 · (6H2O) at room temperature in normal saline solution, the resulting solution was transparent with a slight yellow color. For all the biologic investigations, the solutions were systematically filtered (Swinnex Millipore, Billerica, MA, USA) isopore membrane filters, type 0.8 μm) to remove any macroscopic impurities.
Finally, the pH of the solution was adjusted within the range of 6.9 to 7.4 by adding a few drops of 10mol/L NaOH solution. For the first solutions prepared, the absence of free Gd3+ was systematically confirmed by standard complexometric titration using xylenol orange as indicator (Lyle and Rahman, 1963), which formed a distinctively colored red-violet complex with Gd3+.
When GdCl3 was suspended with ACX in excess ([ACX] > 1.5 [Gd3+]) in normal saline solution, complete complexation of Gd3+ occurred immediately at ambient temperature. The xylenol orange test showed the absence of free Gd3+ ions in the solution.
Acknowledgements
Pr R Muller, Pr D Canet, Dr CS Bonnet, Dr P Delangle and Dr Melchior are gratefully acknowledged for fruitful discussions as well as R Farion for tumor implantation. We thank warmly Dr M Defranceschi, Pr P Turq and Dr M Lecomte for supporting the development of Fast Cycling NMR Relaxometry.