
Abstract
Adrenergic nerves innervate the human cerebrovasculature, yet the functional role of neurogenic influences on cerebral hemodynamics remains speculative. In the current study, regional cerebrovascular responses to sympathoexcitatory reflexes were evaluated. In eight volunteers, contrast-enhanced computed tomography was performed at baseline, –40 mmHg lower body negative pressure (LBNP), and a cold pressor test (CPT). Cerebral blood volume (CBV), mean transit time (MTT), and cerebral blood flow (CBF) were evaluated in cortical gray matter (GM), white matter (WM), and basal ganglia/thalamus (BGT) regions. Lower body negative pressure resulted in tachycardia and decreased central venous pressure while mean arterial pressure was maintained. Cold pressor test resulted in increased mean arterial pressure concomitant with tachycardia but no change in central venous pressure. Neither reflex altered end-tidal carbon dioxide. Cerebral blood volume was reduced in GM during both LBNP and CPT (P<0.05) but was unchanged in WM and BGT. Mean transit time was reduced in WM and GM during CPT (P<0.05). Cerebral blood flow was only modestly affected with either reflex (P<0.07). The combined reductions in GM CBV (˜ –25%) and MTT, both with and without any change in central venous pressure, with small CBF changes (˜ –11%), suggest that active venoconstriction contributed to the volume changes. These data demonstrate that CBV is reduced during engagement of sympathoexcitatory reflexes and that these cerebrovascular changes are heterogeneously distributed.
Introduction
Cerebral blood volume (CBV) affects intracranial pressure and local cerebrovascular hemodynamics. Thus, there is considerable interest in understanding the control of CBV on both arterial and venous sides of the cerebral vascular tree. As the venous vessels account for 70% to 80% of CBV (Schmidek et al, 1985), the control of CBV must involve either reductions in arterial inflow that passively reduce venous stressed volume, and/or must be through active constriction of the veins so that unstressed volume is reduced at a given pressure (Braunwald et al, 1963).
A primary candidate for neurogenic CBV control is the sympathetic nervous system (Goadsby and Edvinsson, 2002). Certainly, the anatomic basis for investigations of sympathetic cerebrovascular control has been established. Since Thomas Willis' (1664) discovery of perivascular nerve fibers in the adventia of cerebral vessels, histochemical techniques have verified the innervation of extracortical pial vessels as well as intracortical arteries and veins of the cerebral parenchyma (Edvinsson et al, 1983). However, there has been long-standing debate over the degree to which the autonomic nervous system affects the cerebral vasculature (Bevan et al, 1998; Heistad and Marcus, 1978; Purves, 1978; Sercombe et al, 1979). Under conditions of severe hypotension and/or direct stimulation of sympathetic nerves, several authors report the potential for adrenergic vasoconstriction in anesthetized animals (Auer et al, 1983; D'Alecy and Feigl, 1972; Edvinsson et al, 1985; Pearce and D'Alecy, 1980). However, concurrent changes in cerebral metabolic or other competitive dilatory factors (Sercombe et al, 1979) may counteract such processes (Sercombe et al, 1979). Evidence of physiologically important adrenergic control in conscious humans has been difficult to observe (Kimmerly et al, 2003; Levine et al, 1994).
Similarly, animal studies indicate that intracranial venous capacitance can be controlled actively by neurogenic means and it could thereby play a role in cerebral hemodynamics (Auer and Johansson, 1980; Schmidek et al, 1985; Schumann et al, 1998). In conscious humans, the sympathetic influence on CBV and intracranial pressure is largely unexplored despite the potential benefits of understanding the mechanisms of blood volume control in clinical management (Lannoo et al, 2000; Procaccio et al, 2000).
The purpose of the current study was to characterize the effects of sympathoexcitatory reflex maneuvers on regional CBV in healthy conscious humans. For this, we used contrast-enhanced computed tomography (CT) to quantify, with excellent spatial resolution (Cenic et al, 1999, 2000), CBV, cerebral blood flow mean transit time (MTT), and cerebral blood flow (CBF) (Nabavi et al, 1999a, b ). To separate the isolated effects of sympathetic activation versus combined sympathetic activation and elevated blood pressure, these measures were made during two maneuvers that differentially affected arterial pressure, namely lower body negative pressure (LBNP) and a cold pressor test (CPT). The mechanisms of action and cardiovascular effects of these tests are described below. With these methods we tested the hypothesis that CBV is regulated by reflex sympathetic outflow, independent of changes in blood pressure. In addition, the subhypotheses that sympathetic activation would elicit either passive and/or active reductions in CBV were addressed. It was reasoned that support for active venoconstriction would require reduced CBV without concurrent reductions in CBF. A reflex-induced reduction in CBF with elevated cerebrovascular resistance (CVR) would contribute to passive reductions in cerebral venous volume but not exclude the possibility of active venoconstriction.
Methods
Subjects
Eight healthy participants (two women and six men) gave informed consent for the current study that had been approved by the University of Western Ontario Review Board for Health Research Involving Human Subjects. Subjects had a mean age of 23 ± 1 years and were 73 ± 18 kg in weight and 175 ± 10 cm tall (Mean ± s.d.). All subjects were nonsmoking individuals who were deemed healthy based on a medical history questionnaire. Subjects were always tested after abstaining from caffeine, any drugs, and alcohol for at least 24 hours.
General Procedure
Participants were placed on the CT scanner bed in the supine position with a slight head-down tilt (6°). This position was used to enhance venous congestion as a starting point from which to observe CBV changes. Participants were monitored continuously for mean arterial blood pressure (MAP) (Finapres, Ohmeda), heart rate (HR), end-tidal partial pressure of carbon dioxide (PETCO2) (Datex), and central venous pressure (CVP). Sympathoexcitation was achieved through LBNP and a CPT. It was reasoned that the use of two sympathoexcitatory maneuvres that differentially affected blood pressure (see below) would provide the opportunity to examine the pressure-dependent nature of cerebrovascular responses to sympathetic stimulation.
Lower body negative pressure
After a 15 to 30 minute acclimatization period, LBNP was administered for approximately 6 min followed by a 15 to 30 minute recovery period. This stimulus was achieved by placing the supine subject in an airtight box to the level of the iliac crest. A variable vacuum source lowered the pressure within the apparatus to the prescribed level indicated by an attached manometer. The level of –40 mmHg (below atmospheric pressure) approximates the hemodynamic effects of upright posture with a net fluid shift towards the lower extremities (Lundvall et al, 1993; Patwardhan et al, 1995). Thus, this maneuver reduces CVP with consequent reflex increases in sympathetic outflow and vascular resistance (Kimmerly and Shoemaker, 2002; Lundvall and Edfeldt, 1992). Importantly, moderate levels of LBNP do not affect mean blood pressure. Computed tomography scans were taken after 4 to 5 min of LBNP to allow stabilization of the sympathetic effect.
Cold pressor test
After LBNP recovery, CPT was performed for approximately 2 mins. The right hand of each volunteer was submerged to the level of the wrist in ice water for a period of 2 mins. This procedure elicits concurrent increases in sympathetic outflow and blood pressure with little change in CVP (Victor et al, 1987). The CT scan occurred between the sixtieth and ninetieth second of the protocol, corresponding to the expected peak of the sympathetic and pressor response. Although cardiovascular indices return to baseline quickly during recovery from the CPT plasma, catecholamine concentrations persist for more than several min (Victor et al, 1987). Therefore, to avoid complications related to the unknown persistence of CPT effects, the order of the sympathoexcitatory maneuvres was not randomly assigned and LBNP always preceded CPT.
Computed Tomography Procedure
The enhanced CT procedure has been developed and used extensively by Lee and colleagues (Cenic et al, 1999, 2000; Nabavi et al, 1999a, b). For each CT perfusion study, the brain was scanned continuously for 45 sec at the level of the Circle of Willis with a General Electric Medical Systems (GEMS) LightSpeed Plus CT scanner starting at 4 to 5 sec into injection of 40 to 45 mL of contrast agent (Omnipaque 300) at the rate of 3 to 4 mL/s in an antecubital vein. The scanning parameters were as follows: 120 kVp, 190 mA, 4 × 5 mm of collimation, at 1 rotation per second.
Analysis
From the CT scans, regions of interest (ROI) were defined from anatomical maps of the cortical gray matter (GM), white matter (WM), and the basal ganglia/thalamus (BGT). Cerebral blood flow, CBV, and MTT for GM, WM, and BGT were determined from corresponding functional maps generated by the CT Perfusion software (GEMS) (Figure 1). Because the presence of large vessels may lead to overestimation of the quantitative value of CT-generated variables (Kudo et al, 2003), the conduit arteries and veins (i.e., nonparenchymal vessels) were excluded from the CT analysis. Thus, the analysis focused on cerebral microvascular and venous hemodynamics. Mean ROI values were generated for each subject during baseline, LBNP, and CPT.
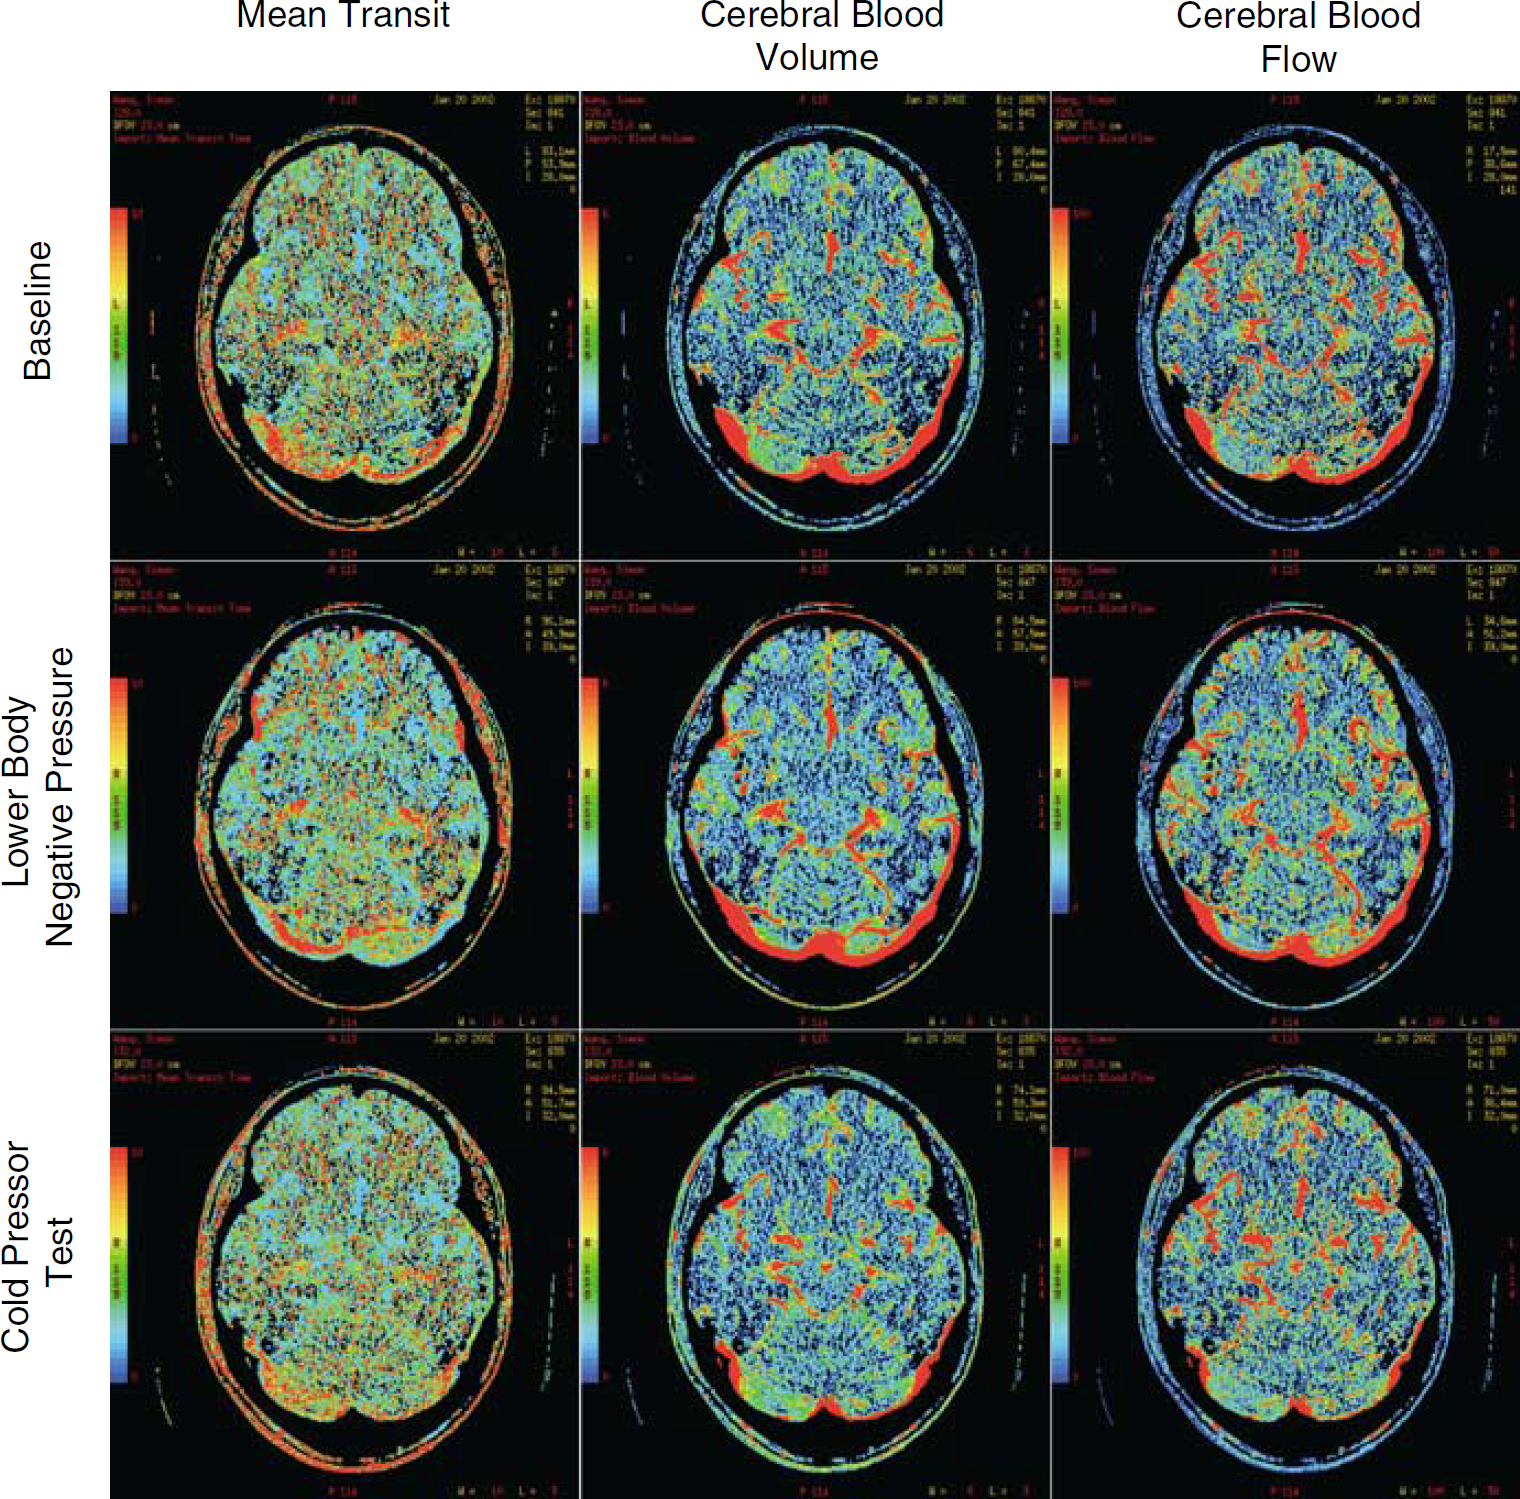
Functional maps of a representative subject. Left-hand panels indicate cerebral blood mean transit time (MTT), middle panels indicate cerebral blood volume (CBV), and right-hand panels indicate cerebral blood flow (CBF) during baseline (upper row), lower body negative pressure (LBNP) (middle row), and cold pressor test (CPT) (lower row).
Statistics were performed using a PC-based software package (Statistical Analysis System; SAS Institute Inc., Cary, NC, USA, V. 8.0.2). Changes in CBF, CBV, MTT, MAP, CVP, HR, and PETCO2 as well as percent changes from baseline were compared using a two-way repeated measures analysis of variance for all ROI in each experimental condition. Statistical significance was set at P<0.05. Values are presented as means ± s.d. One subject moved during LBNP; therefore, CT data for that subject were removed.
Calculation of Cerebrovascular Resistance
Cerebrovascular resistance is an index of cerebrovascular tone. Generally, resistance is calculated through a modification of Ohm's law such that cerebral perfusion pressure is divided by CBF. Cerebral perfusion pressure is affected both by the arterial and intracranial pressure. The complication of intracranial pressure has raised concern about using just arterial inflow pressure (i.e., MAP) to calculate CVR. Of note, it has been shown that MTT, as assessed by the CT method, is inversely proportional to cerebral perfusion pressure (Schumann et al, 1998), thereby incorporating both arterial and intracranial pressure components. Using this assumption, CVR may be expressed as
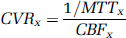
where x represents one of the regions of interest: GM, WM, BGT. Values will be expressed as arbitrary units (a.u.).
RESULTS
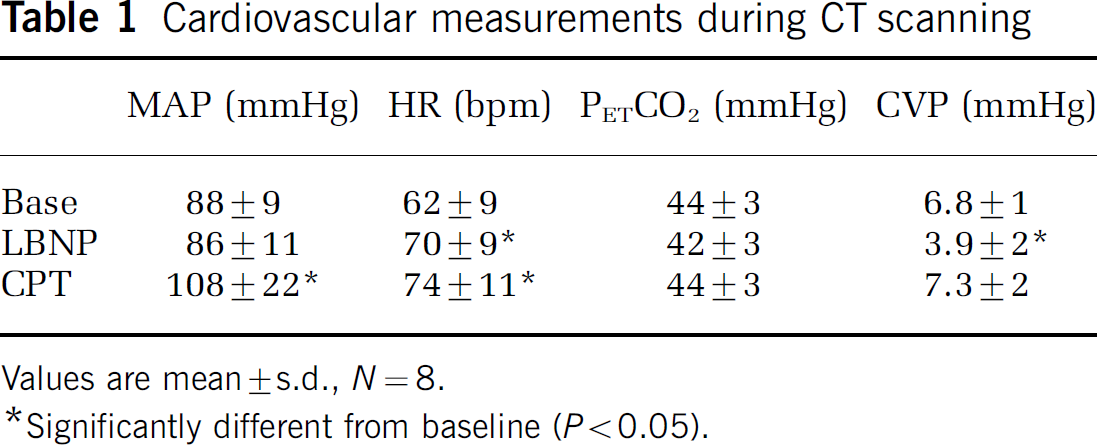
Table 1 illustrates cardiovascular data for baseline, LBNP, and CPT testing conditions. Mean arterial blood pressure increased during CPT (P<0.05), while HR increased in both maneuvres (P<0.05). PETCO2 was unchanged during each protocol. Central venous pressure was reduced during LBNP (P<0.05) but not with the CPT.
Cerebral blood volume in the gray matter decreased from baseline (2.30 ± 0.42 mL/100 g tissue) to 1.65 ± 0.36 mL/100 g tissue during LBNP (P<0.01) and 1.72 ± 0.36 mL/100 g tissue during CPT (P<0.005). Cerebral blood volume in the WM and BGT did not change (Figure 2).
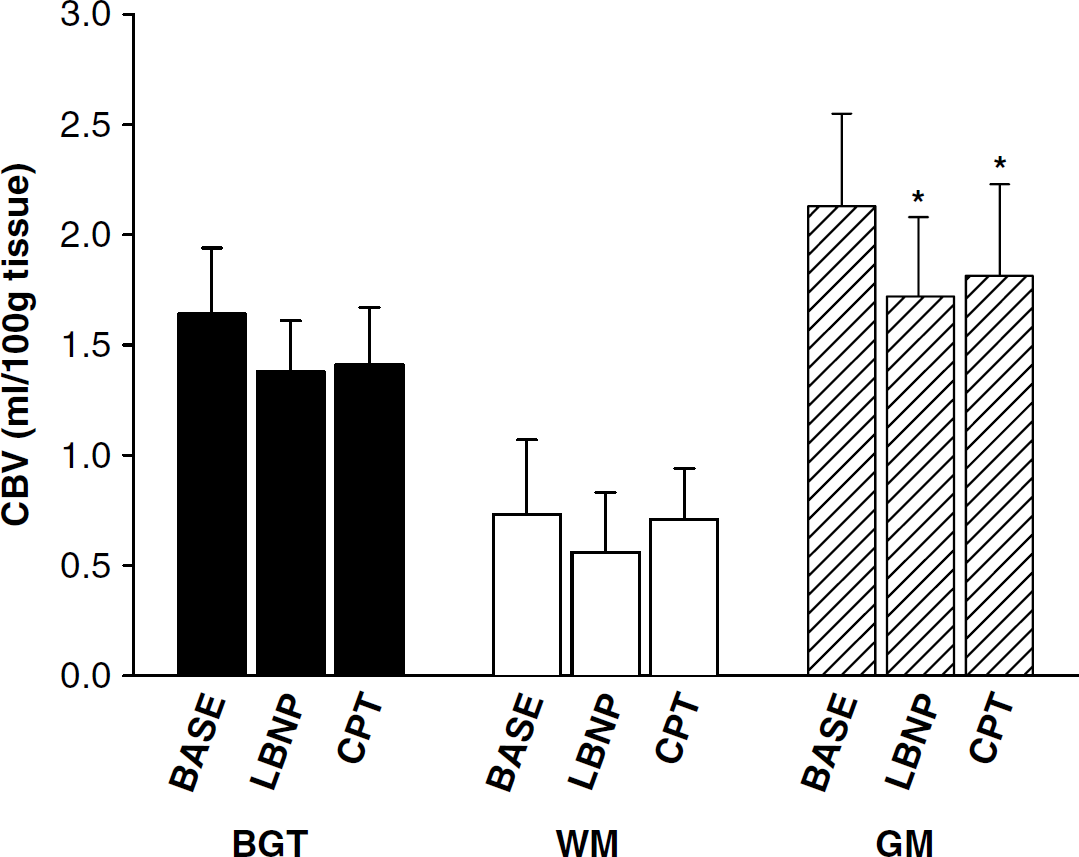
Mean cerebral blood volume (CBV) of blood in basal ganglia and thalamus (BGT), white matter (WM), and gray matter (GM) during baseline (BASE), lower body negative pressure (LBNP), and cold pressor test (CPT). N = 8 except for LBNP where N = 7, *significantly different from BASE (P<0.05). Error bars indicate standard deviation.
Compared with baseline, MTT was not affected by LBNP in any of the examined regions. In contrast, MTT decreased relative to baseline during CPT in WM and GM. Specifically, WM MTT was 4.88 ± 0.53 sec at baseline and declined to 3.98 ± 1.07 secs during CPT (P<0.005); GM MTT was 4.06 ± 0.24 secs at baseline and declined to 3.36 ± 0.85 secs during CPT (P<0.05) (Figure 3).
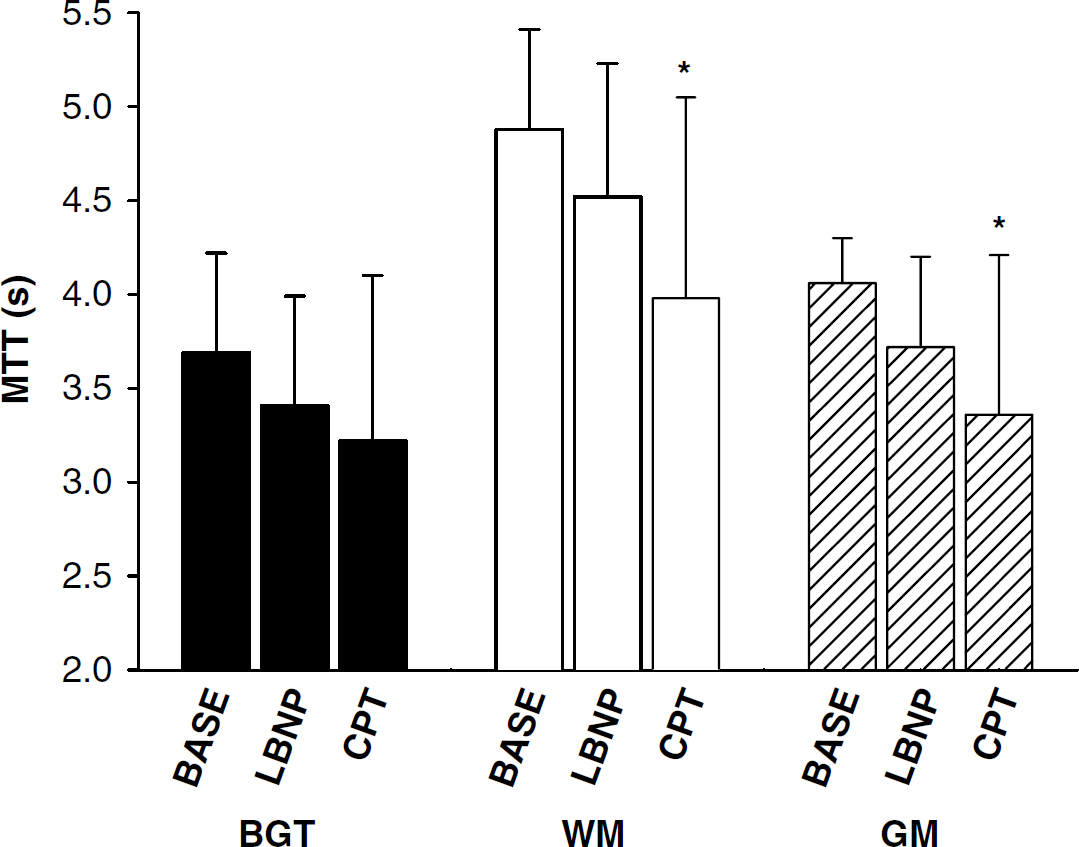
Mean transit time (MTT) of blood in basal ganglia and thalamus (BGT), white matter (WM), and gray matter (GM) during baseline (BASE), lower body negative pressure (LBNP) and cold pressor test (CPT). N = 8 except for LBNP where N = 7, *significantly different from BASE (P<0.05). Error bars indicate standard deviation.
Compared with baseline (45 ± 8 mL/min per 100 g tissue), CBF in GM was 39 ± 8 mL/min per 100 g tissue during LBNP and 41 ± 12 mL/min per 100 g tissue during CPT (NS; Figure 4).
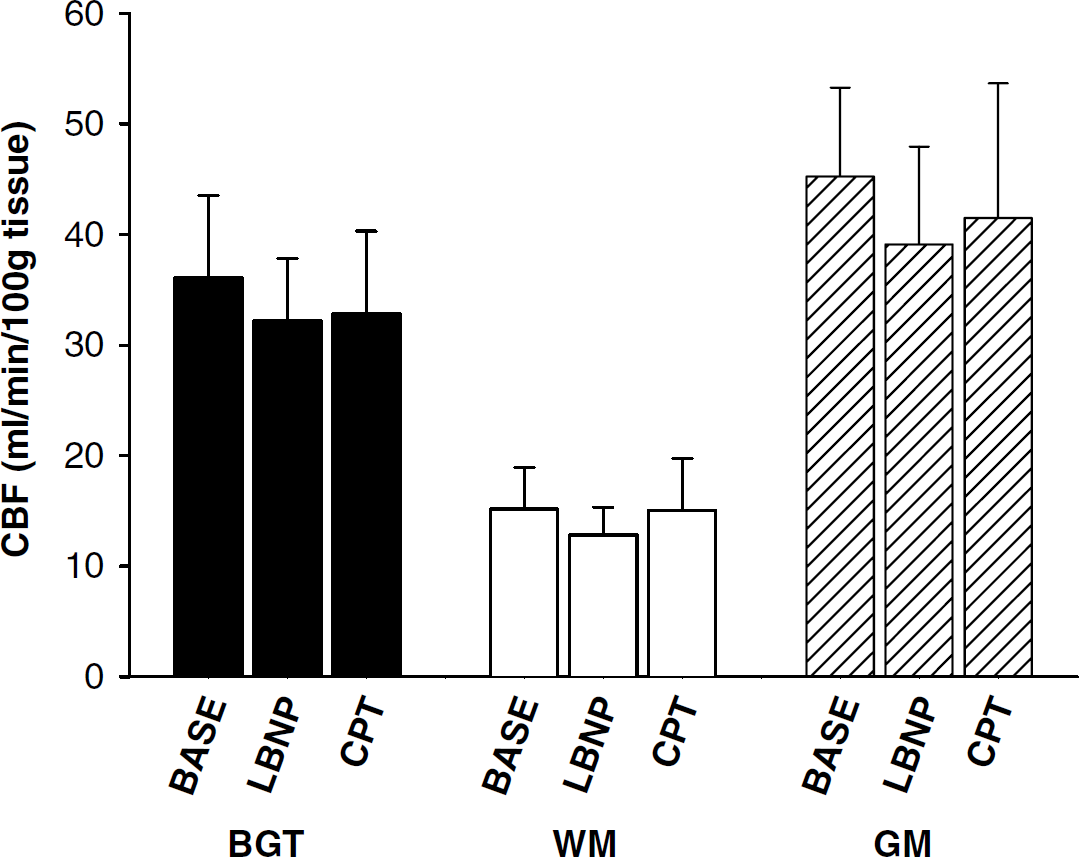
Mean cerebral blood flow (CBF) in basal ganglia and thalamus (BGT), white matter (WM), and gray matter (GM) during baseline (BASE), lower body negative pressure (LBNP), and cold pressor test (CPT). N = 8 except for LBNP where N = 7. Error bars indicate standard deviation.
During LBNP, the WM was the only ROI where CVR increased from baseline values (14 ± 2 × 10⁻³ a.u.) to 18 ± 5 × 10⁻³ a.u. (P<0.05) (Figure 5). In contrast, CVR increased from 7.8 ± 1.0 × 10⁻³ a.u. at baseline to 10 ± 3 × 10⁻³ a.u. in BGT, from 4.1 ± 2.2 × 10⁻³ a.u. to 18 ± 3 × 10⁻³ a.u in WM, and from 5.6 ± 0.9 × 10⁻³ a.u. at baseline to 9.4 ± 2.5 × 10⁻³ a.u. in GM during the second minute of the CPT (all P<0.05).
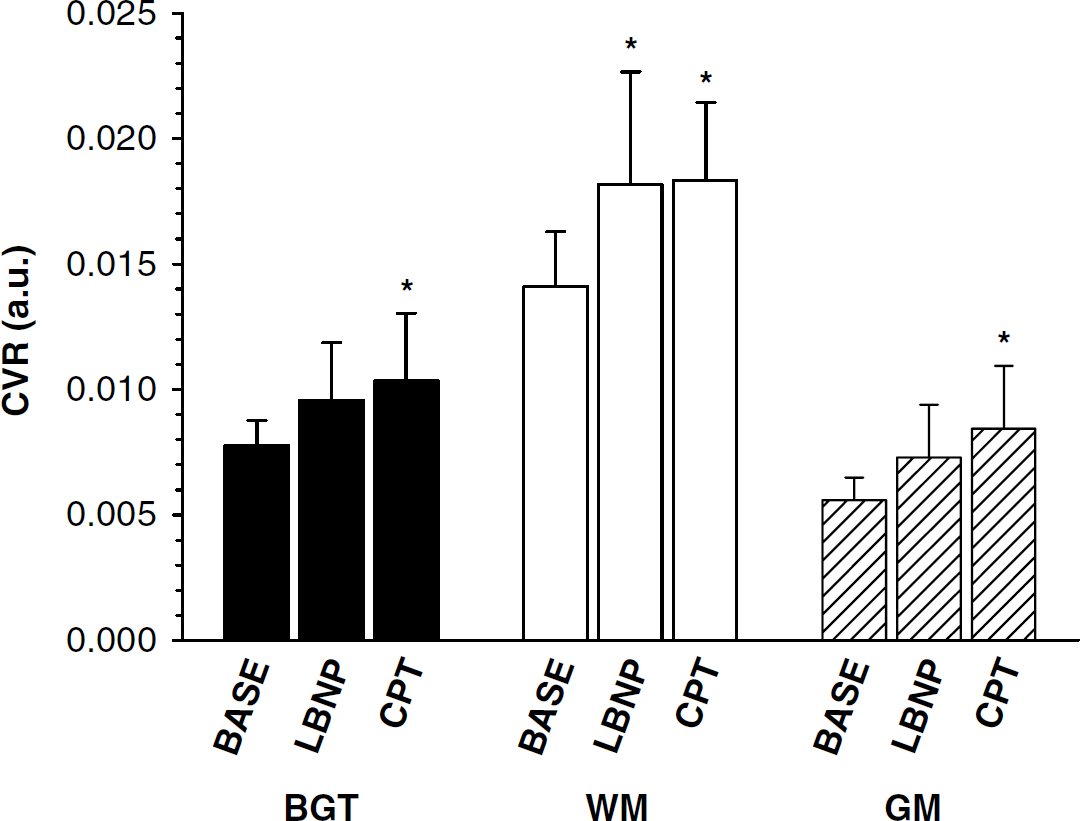
Cerebral vascular resistance (CVR) in basal ganglia and thalamus (BGT), white matter (WM), and gray matter (GM) during baseline (BASE), lower body negative pressure (LBNP), and cold pressor test (CPT). N = 8 except for LBNP where N = 7, *significantly different from BASE (P<0.05). Error bars indicate standard deviation.
Cardiovascular measurements during CT scanning
DISCUSSION
The major finding of this study was that both LBNP and CPT produced reductions in CBV with the largest effect observed in the cortical GM. Thus, there was regional heterogeneity in this reflex response that occurred regardless of any change in arterial pressure or PETCO2. The regional heterogeneity in CBV response was not related to differences in baseline blood flow or venous volume as the BGT and cortical GM regions had similar pretest hemodynamic profiles. Overall, these results support the hypothesis that sympathetic reflex activation plays a role in CBV control. To our knowledge, this study is the first to demonstrate reflex-mediated alterations in CBV in conscious humans. The regional CBF, CBV, and MTT values are qualitatively similar to those reported previously based on PET approaches (see Helenius et al (2003) for review).
The majority of vascular volume resides in the venous tissue. Therefore, the changes in CBV observed here are largely attributed to changes in venous volume. However, it is difficult to assess the degree to which arterial or venous hemodynamics contributed to the CBV change because venous function cannot be assessed independently of the arterial circulation in the intact organ. Based on the magnitude of decrease in CBF (˜11%) versus CBV (˜25%), it might be argued that the reduction in venous volume was partly accounted for by passive changes in arterial inflow with additional contributions from active venoconstriction. The basis of such an argument depends on the compliance of the cerebral veins. As venous engorgement had already occurred due to the head-down position of the participants, it is expected that these veins were distended and positioned on a rather shallow portion of the volume/pressure relationship. If so, then relatively small changes in volume would occur for a given fall in arterial inflow. From this perspective, it is speculated that the small change in CBF was not the sole source of reduction in CBV in the current analysis.
It has been demonstrated in humans that CBV is sensitive to arterial CO2 partial pressures and that there may be regional differences in this response (Ito et al, 2000, 2003). However, PETCO2 was unchanged in the current study and cannot explain the observed response. Rather, the fall in CBV during both LBNP and CPT suggests that physiologically relevant consequences to cerebral circulation may be achieved through reflex engagement of the sympathetic nervous system. Sympathetic innervation has been demonstrated in the cerebral arteriolar and venous smooth muscle and is hypothesized to contribute to the regulation of CBV and intracranial pressure (Auer and Johansson, 1980, 1981). It has also been proposed that cerebral veins may respond to sympathetic stimulation more than the arterial system (Auer and Johansson, 1980; Edvinsson et al, 1982) although both are likely to undergo simultaneous constrictor responses during reflex arousal (Auer and Johansson, 1983). Regardless of the mechanism, this study is in agreement with reflexive CBV alterations in mice (Edvinsson et al, 1971) and cats (Auer and Johansson, 1980, 1981) and indicates a possible mechanism of intracranial pressure regulation in humans.
The changes in CBV were observed in the cortical GM and not in the BGT region even though both regions contain metabolically active tissue and have similar baseline levels of blood flow and volume. Differences in sympathetic cerebrovascular control of focal midbrain regions have been reported (Aubineau et al, 1973; Sercombe et al, 1975) but these studies have not focused on CBV control. To our knowledge, regional differences in CBV responsiveness and/or control within these two compartments of cerebral GM have not been reported in humans. Thus, the current findings of differential control of CBV within the cortical and midbrain regions add important information regarding the complexity of regional cerebrovascular control. Whether such differences in control extend to focal regions within each of the cortical and BGT tissues requires further assessment. Confirmation of the sympathetic mechanism involved in CBV control would require adequate adrenergic blockade studies.
The two reflexes used in this study were chosen based on earlier observations that they produce approximately similar increases in sympathetic nerve activity but markedly different blood pressure responses (Shoemaker et al, 2001; Victor et al, 1987; Wallin et al, 1989). To date there is no evidence that cerebral veins respond to metabolic or myogenic autoregulatory stimuli. Thus, the present data also provide further insight into the regional differences in sympathetic versus myogenic control of arterial tissue. Only in the WM was an increase in CVR observed during LBNP when blood pressure was not changed. This constrictor effect had little effect on CBV. This observation suggests that WM vessels, which have low baseline CBF and blood volume, may be more sensitive to the constrictor effects of elevated sympathetic outflow. Further, the enhanced constrictor sensitivity in WM may be due to the expected attenuation of metabolic activity in this region and, therefore, less dilatory stimuli to counter neurovascular tone. Studies in rabbits suggest that most cerebral vascular beds respond to sympathoexcitation, but to varying degrees with the cortical regions providing greater reductions in cerebral blood flow than midbrain (BGT) regions (Lacombe et al, 1977, 1985; Sercombe et al, 1979). The inconsistent responses between the current study and the early animal work may be due to variations in the level of stimulus provided. In this study, we used a level of lower body suction that elicits cardiovascular stress similar to the upright posture, and a level that can be tolerated by most healthy individuals for more than five min so that steady-state conditions could be produced. Such a physiologic stimulus may have limited impact in some cerebrovascular beds. Nonetheless, both the LBNP and CPT protocols elicited large increases in heart rate, confirming the autonomic response. In a related manner, it could be that metabolic dilatory stimuli are higher in the conscious human model compared with the anesthetized animal and this may effectively compete with physiologic levels of sympathetic excitation to limit neurogenic vasoconstriction.
Unlike the LBNP response, cerebral vascular constriction during the CPT was not regionally restricted but was observed in each region of interest. Such a global response is consistent with a myogenic mechanism responding to the elevated systemic mean arterial pressure. Of note, the conclusions regarding changes in CVR were not different if mean arterial pressure was used instead of MTT in the calculation. Previously, we observed that the cerebral constrictor response to elevations in blood pressure as diminished after alpha adrenoceptor blockade (Kimmerly et al, 2003). Thus, an interactive relationship between myogenic and sympathetic arteriolar constrictor tone may be proposed supporting the previously stated concept that the sympathetic nervous system plays a modulatory role in cerebral autoregulation (Paulson et al, 1990).
Some methodological issues must be addressed. First, the dynamic CT method employed is restricted to a single 2-cm-thick slab of the cerebral tissue in the axial direction. Hemodynamic measures from this slab and the contained ROIs are assumed to represent the entire GM, WM, and BGT. Although more than 2 cm of brain tissue can be covered using current CT technology, this would lead to low time resolution of the collected data and unacceptably low accuracy of the hemodynamic measurements (Cenic et al, 2000). In addition, there may be limitations with the sensitivity of the enhanced CT method to detect altered hemodynamics in small regions of interest associated with deeper cerebral structures like the basal ganglia/thalamus region. However, Cenic et al (1999) have validated the CT technique against microspheres in rabbits and found regional cerebral blood flow can be measured in ROIs as small as 0.38 cm2, well under the size of the smallest ROI in the current study.
In conclusion, the current results demonstrated that regional alterations in CBV occur concomitantly with reflexes that engage an increase in sympathetic activity independent of changes in blood pressure or end-tidal CO2. Some of the change in CBV may have been related to small reductions in arterial inflow but the proportionately greater decrease in CBV relative to CBF suggests that active venoconstriction may also have contributed to the observations. Cerebrovascular resistance increased during CPT in response to increased perfusion pressures in all regions investigated and may represent an interaction of myogenic and neural influences on vascular tone. The vascular adjustments to sympathoexcitation were not uniform across ROI and have provided evidence of differential and complex influences of reflex cerebrovascular control.
Footnotes
Acknowledgements
The authors gratefully acknowledge the volunteers for their participation in this study.