
Abstract
Introducing optogenetics into neurovascular research can provide novel insights into the cell-specific control of the hemodynamic response. To generalize findings from molecular approaches, it is crucial to determine whether light-activated circuits have the same effect on the vasculature as sensory-activated ones. For that purpose, rats expressing channelrhodopsin (ChR2) specific to excitatory glutamatergic neurons were used to measure neural activity, blood flow, hemoglobin-based optical intrinsic signal, and blood oxygenation level-dependent (BOLD) functional magnetic resonance imaging (fMRI) during optogenetic and sensory stimulation. The magnitude of the evoked hemodynamic responses was monotonically correlated with optogenetic stimulus strength. The BOLD hemodynamic response function was consistent for optogenetic and sensory stimuli. The relationship between electrical activities and hemodynamic responses was comparable for optogenetic and sensory stimuli, and better explained by the local field potential (LFP) than the firing rate. The LFP was well correlated with cerebral blood flow, moderately with cerebral blood volume, and less with deoxyhemoglobin (dHb) level. The presynaptic firing rate had little impact on evoking vascular response. Contribution of the postsynaptic LFP to the blood flow response induced by optogenetic stimulus was further confirmed by the application of glutamate receptor antagonists. Overall, neurovascular coupling during optogenetic control of glutamatergic neurons largely conforms to that of a sensory stimulus.
INTRODUCTION
Light-activated ion channels are becoming a common neuroscience tool for the exploration of cell-specific cortical circuits.1,2 The initial report of combining the use of optogenetics with functional magnetic resonance imaging (opto-fMRI) by Lee
Currently, there are a few studies of neurovascular coupling with optogenetic stimulation.7–13 To examine neurovascular coupling in the primary motor cortex of channelrhodopsin (ChR2) expressing rats, Ji
In the present work, we sought to obtain comprehensive knowledge about the light-evoked neurovascular coupling in rat cortex and compare our results to reported mouse transgenic model data.8–12 We evaluated the neurovascular coupling of optogenetic and sensory stimulation employing optical and blood oxygenation level-dependent (BOLD) fMRI hemodynamic measurements, as well as electrophysiology in the forelimb region of rat primary somatosensory cortex (S1FL). The choice of S1FL is owing to prior extensive studies of neurovascular coupling in the somatosensory cortex using optical14–18 and fMRI approaches.19–24 We compared dynamic BOLD response functions, and the relationship between neural activities and hemodynamic responses induced by optical and sensory stimulation. Further, the neurovascular relationships were examined by decoupling the presynaptic firing rate from the postsynaptic processing with application of antagonists to ionotropic GluRs.
MATERIALS AND METHODS
We used viral transduction in S1FL to express ChR2 transgene under a promoter for Ca2+/calmodulin-dependent protein kinase II (CaMKII) specific to excitatory glutamatergic neurons (Figure 1A). We performed two separate studies using both ChR2 and forelimb stimulation. First, multimodal optical approaches were used to evaluate the temporal evolution of the hemodynamic response. In a subset of those animals, we also recorded simultaneously electrical activity to examine neurovascular coupling (Figure 1B). Second, BOLD fMRI (Figure 1C) was obtained using a 9.4-T scanner to detect global networks and to compare local hemodynamic response functions induced by forelimb versus light stimulation.
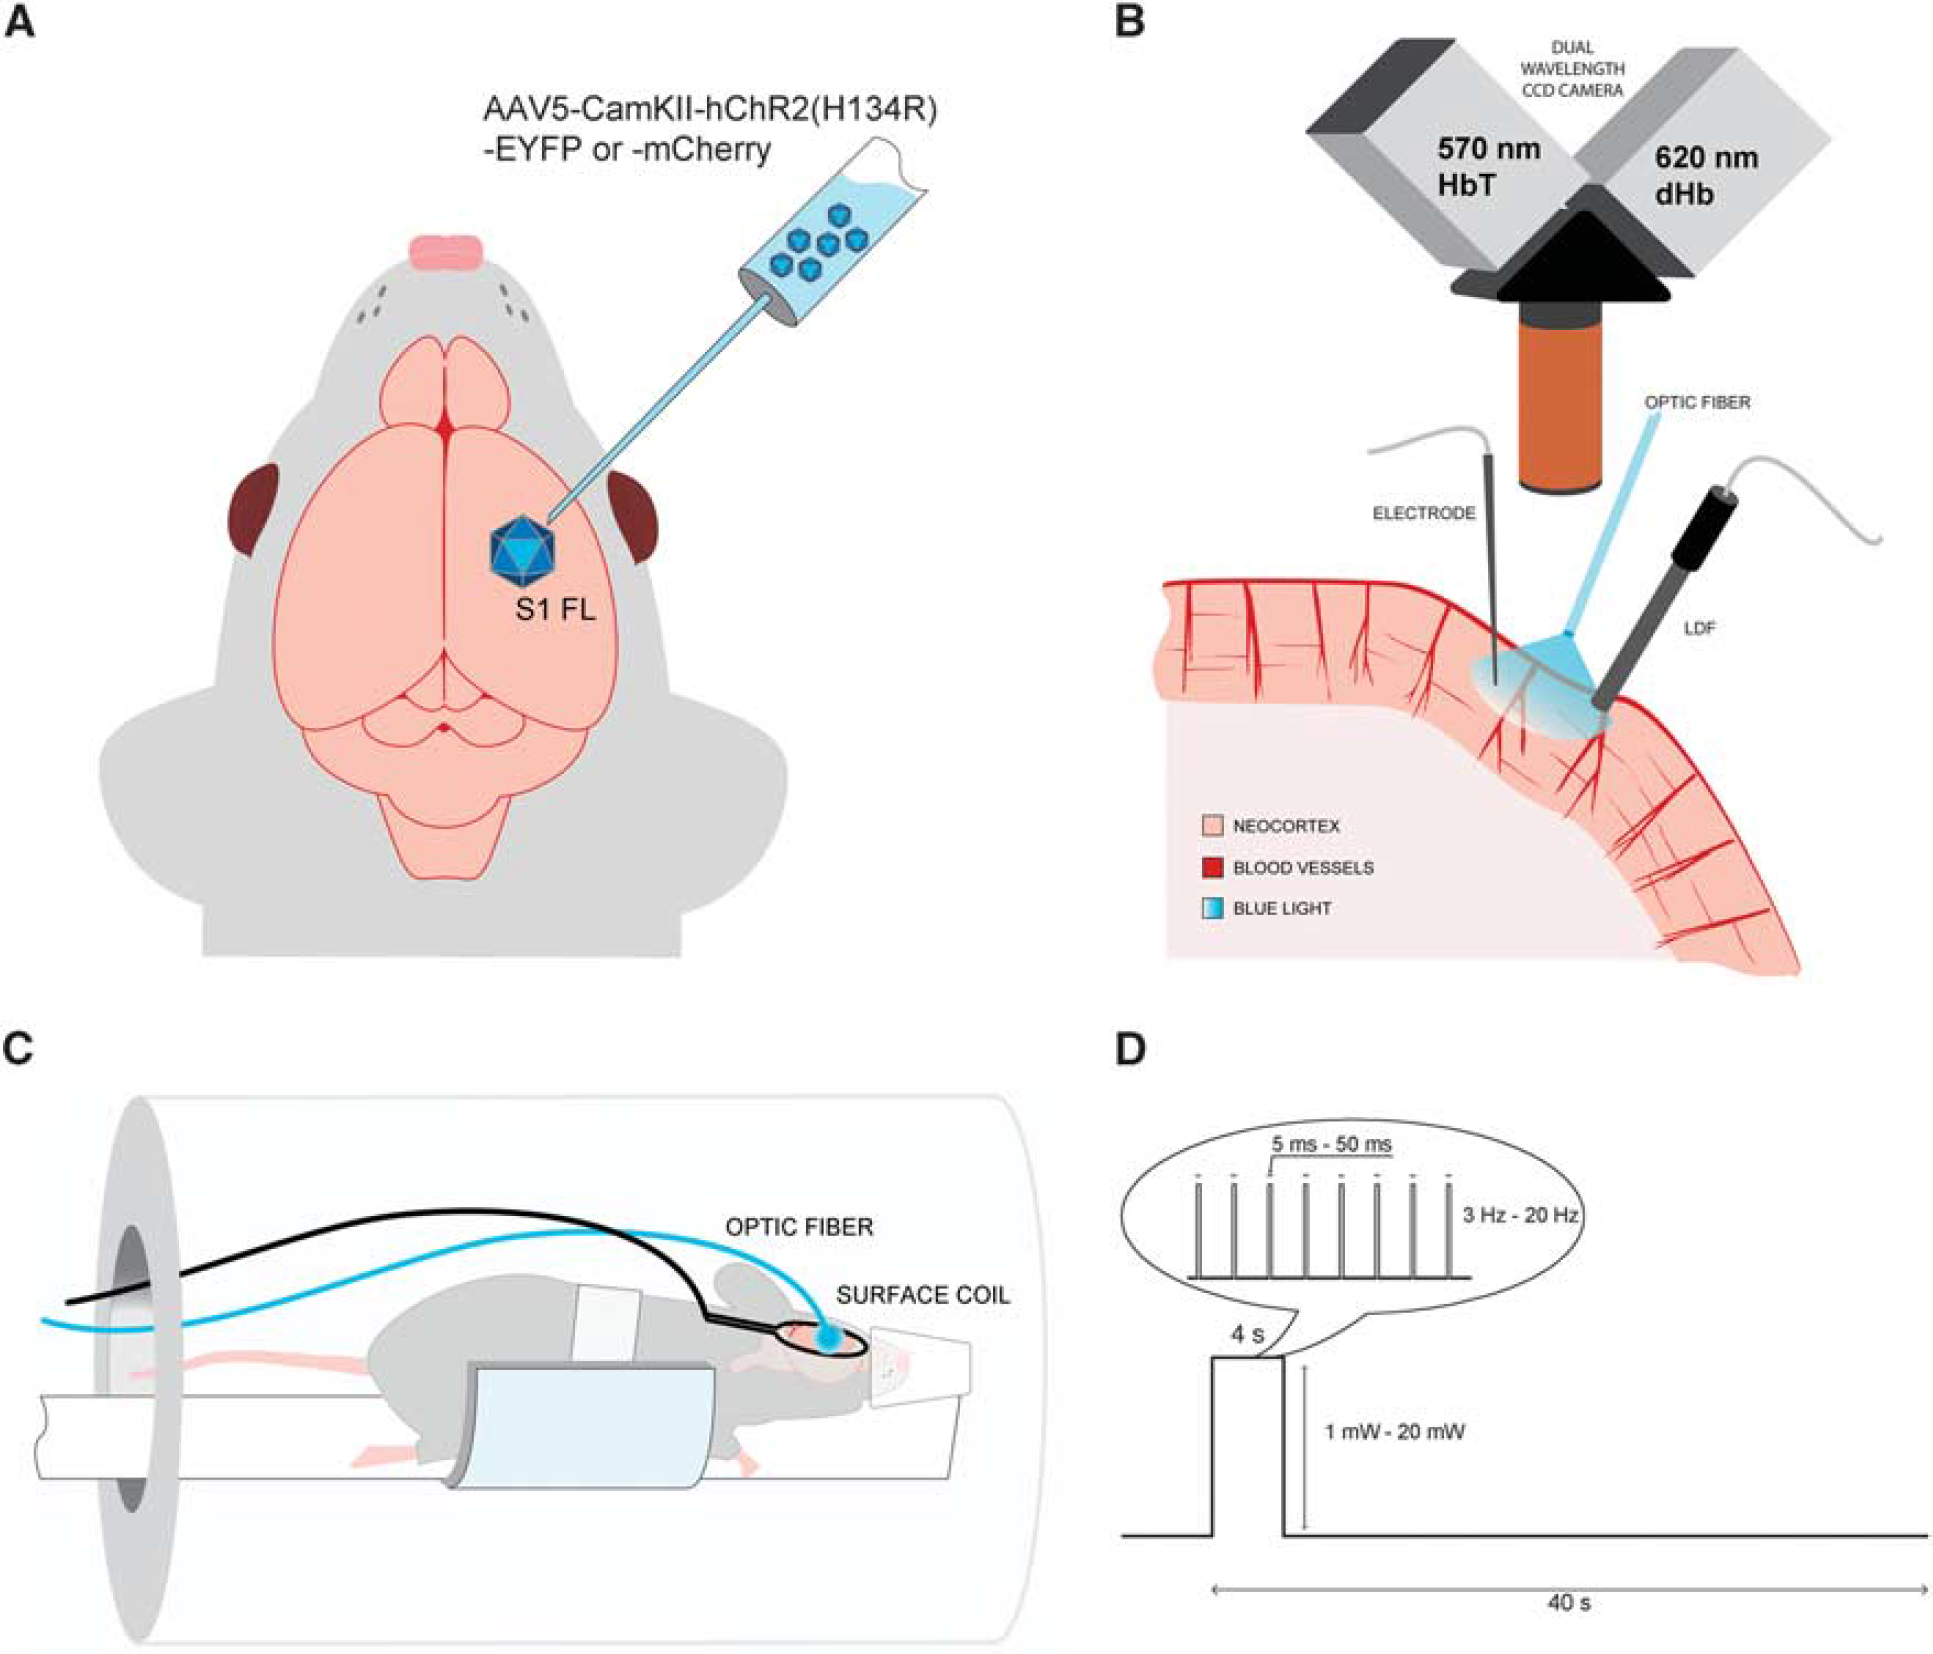
Experimental setup. (
Animal Preparation
All animal procedures were conducted in accordance with the National Institute of Health guidelines and with the approval of the University of Pittsburgh Institutional Animal Care and Use Committee. We used a total of 20 male Sprague Dawley rats (5 to 7 weeks, Charles River, Cambridge, MA, USA), 14 for optical measurements, and 6 for BOLD fMRI.
Viral Transduction
We transduced 14 animals with AAV5-CaMKII.ChR2(H134R)-eYFP or -mCherry and 6 animals with control vector AAV5-CaMKII.eYFP or -mCherry obtained from University of North Carolina Vector Core (Chapel Hill, NC, USA). Briefly, animals were anesthetized with 1.7% to 2.2% isoflurane and placed in a stereotaxic frame (Narishige, Tokyo, Japan). A burr hole was drilled into the right hemisphere at stereotaxic coordinates of 0 to 0.5 mm from bregma, 2 mm from the midline. The 2-μL viral inoculum was delivered at 1 mm below the surface of the dura by a stereotactic injector (Stoelting Co., Wood Dale, IL, USA) at a rate of 0.2 μL/min.
Animal Surgery for Experiments
Three to four weeks after the viral injection, the animals were anesthetized with isoflurane; a catheter was placed at the right femoral artery to monitor blood pressure and to withdraw arterial blood for gas analysis, and at the right femoral vein to administer fluids (5% dextrose in saline). Two needle electrodes were placed in the left forelimb between digits 2 and 4 for sensory stimulation. Body temperature was maintained at 37.6°C using a feedback heating pad. Heart rate and arterial blood pressure were continuously monitored and recorded (Biopac Systems, Goleta, CA, USA). Blood gases partial pressure (pO2 and pCO2) and expired CO2 were also monitored.
The animals undergoing optical imaging were intubated and their breathing was adjusted by a pressure-driven ventilator (Kent Scientific, Torrington, CT, USA). The rats were placed in a stereotaxic frame, the skin above the skull was removed and a well of approximately 1.5-cm diameter was built over the injection site with dental cement. A craniotomy and a durotomy were conducted under filtered light (570±10 nm). The cerebrospinal fluid was released around the cisterna magna area to minimize herniation and 1% agarose was poured into the well at body temperature to maintain intracranial pressure.
For the fMRI experiments, the skin above the skull was removed and the burr hole at the viral injection site was slightly widened. The optic fiber was then implanted at the brain surface, and secured using dental cement. Since we could not immediately access the animal inside the magnet, rats were free breathing for the fMRI studies and the anesthetic was delivered via a nose cone. Our preliminary functional studies of intubated versus free breathing naive animals showed no difference. Also, no significant difference was observed in vascular physiologic parameters between optical imaging and fMRI animals.
After surgery, atropine (0.05 to 0.07 mg/kg) was administered intramuscularly to reduce secretions. Then, the isoflurane level was reduced to 1% to 1.3% in a mixture of 20% oxygen and 80% air.
Stimulation
All stimulations were driven by a waveform generator (AMPI, Jerusalem, Israel) and performed in a block design (4 seconds stimulus delivered every 40 seconds, with 6 or 10 repetitions), for schematic, see Figure 1D. The sensory forelimb stimulation was applied using a current isolator box (AMPI) and consisted of 1-ms electrical pulses at a frequency of 8 Hz and a amplitude of 1.5 mA. The photo-stimulus was delivered via a multimode optic fiber with 400-μm core diameter (ThorLabs, Inc., Newton, NJ, USA) coupled to a 473-nm laser diode unit (CrystaLaser, Inc., Reno, NV, USA). Before each experiment, the power of the laser was measured at the tip of the fiber with an optical power meter (Melles Griot, Carlsbad, CA, USA). All power levels were reported for continuous light irradiation. Optical stimulus parameters consisted of three parameter groups: The first one was four pulse durations (5, 10, 30, and 50 ms) with a fixed power of 2.5 mW and a frequency of 8 Hz. The second group covered four light frequencies within the native firing rate of excitatory glutamatergic cells (3, 8, 12, and 20 Hz) with a fixed power of 2.5 mW and a pulse duration of 30 ms; and the third group included five light power levels (1, 2.5, 5, 10, and 20 mW) with a fixed frequency of 8 Hz and a pulse duration of 30 ms. Since one combination (8 Hz, 2.5 mW, and 30 ms) was common for all three modulation studies, a total of 11 different light stimulation parameters were used.
Neural Activity and Hemodynamic Measurements
We used 14 animals for this part of the experiment, 10 with ChR2 and 4 with the control vector. In all controls, we performed simultaneous hemodynamic measurements and electrophysiology. In the ChR2-expressing animals, we measured blood flow (
Laser Doppler Flowmetry
The laser doppler flowmetry (LDF) probe with a tip diameter of 450 μm (Perimed, Inc., Jarfalla, Sweden) was placed over the area illuminated by the optic fiber to monitor and record cerebral blood flow (CBF). The LDF was operated at a wavelength of 780 nm and a sampling rate of 1 kHz.
Hemoglobin-Based Optical Intrinsic Signal
The illumination source consisted of oblique light guides connected to a halogen light source (Thermo-Oriel, Stratford, CT, USA) to transmit filtered light of 600±50 nm. Reflected light from the cortex was split to acquire two spatially identical but spectrally distinct images simultaneously (Dual-Cam, Photometrics, Tucson, AZ, USA), which were filtered at 572±7 nm and 620±7 nm (see Figure 1B). On the basis of the molar extinction coefficients of oxyhemoglobin and dHb, the reflectance at the 570-nm isosbestic point is indicative of the total hemoglobin (HbT); whereas the reflectance at 620 nm is primarily weighted to dHb content. The optical intrinsic signal (OIS) at 570 nm is therefore representative of cerebral blood volume (CBV), while the OIS at 620 nm is more sensitive to the blood oxygenation level and comparable to the BOLD fMRI signal. Both 570 nm and 620 nm OIS data were recorded at 30 fps with two analog CCD cameras (Sony XT-75, Tokyo, Japan) and an analog to digital frame-grabbing board (Matrox, Inc., Dorval, Quebec, Canada). The field of view was 7 × 6 mm2 or 8.8 × 7.4 mm2 depending on the magnification setting of the macroscope (MVX-10, Olympus, Tokyo, Japan).
Electrophysiology
An electrode with a tip diameter of 5 μm and nominal impedance of about 1 MΩ (Carbostar, Kation Scientific, Minneapolis, MN, USA) was placed adjacent to the optic fiber below the core of the illuminated area at a depth of 500 to 800 μm. Electrophysiologic activity was recorded at a frequency of 20 kHz (Plexon, Inc., Dallas, TX, USA).
Pharmacological Blockade of Glutamate Receptors For the pharmacological inhibition of GluRs, a cocktail of 5 mmol/L NBQX (1,2,3,4-Tetrahydro-6-nitro-2,3-dioxo-benzo[f]quinoxaline-7-sulfonamide hydrate) and 50 mmol/L APV (DL-2-Amino-5-phosphonopentanoic acid) (Sigma-Aldrich, St. Louis, MO, USA) was applied topically over the exposed somatosensory cortex to inhibit AMPA and NMDA receptors, respectively. We continuously monitored spontaneous activities to identify a new steady-state condition with reduced glutamate transmission. After 45 minutes to 1 hour after application of the GluR antagonists, neural and blood flow responses to light and forelimb stimulation were recorded (
Magnetic Resonance Imaging
All MRI experiments (four ChR2 and two control rats) were performed on a 9.4-T/31-cm MR system interfaced by a DirectDrive console (Agilent Tech, Santa Clara, CA, USA) and an actively shielded gradient coil with 40 G/cm gradient strength and 120 μs rise time (Magnex, Oxford, UK). The head of the rat was fixed with a bite bar and ear bars. A custom-built surface coil (2-cm diameter) was positioned on the animal head over the implanted optic fiber.
Anatomic images were acquired using a fast spin-echo sequence with the following parameters: a 128 × 128 matrix size, 16 × 16 mm2 field-of-view (125 × 125 μm2 in-plane resolution), 3.0 second
Histology
After imaging, animals were perfused transcardially with phosphate buffered saline, then with 4% paraformaldehyde. The brains were frozen in optimal cutting temperature compound (EMS, Hatfield, PA, USA) and stored at −80°C. Frozen brain tissue was cryosectioned using a Leica CM1850 cryostat (Leica, Wetzlar, Germany) in 25-μm-thick slices, and mounted on glass slides. Glass coverslips were set and the sections were imaged using a Zeiss AxioImager (Oberkochen, Germany).
Data Analysis
Collected data were analyzed using Matlab software (Mathworks, Natick, MA, USA). Standard errors, linear regressions, coefficients of determination, and
Electrophysiology
The raw electrophysiology data were filtered between 300 and 9000 Hz for multiunit activity (MUA) and between 10 and 150 Hz for LFP. Multiunit activity was calculated over 100 ms temporal bins by counting the number of outward deflections exceeding a threshold of 3.5 times the standard deviation of the baseline. Local field potential was quantified by measuring the magnitude between the trough of the first negative and the peak of the first positive deflections (N1 to P1). Since the forelimb stimulation introduced a transient electrical artifact, the initial 2 ms of data after the stimulus onset were discarded for both sensory and light stimulation to maintain consistency. The MUA and LFP data were averaged for each stimulation parameter set for each animal. The mean change of MUA and the mean amplitude of LFP induced by stimulation were determined.
Laser Doppler Flowmetry
The time series were averaged across repetitions within the same trial and detrended by comparing the first 5 seconds before the stimulus and the last 5 seconds of each trial. For the neurovascular correlation analysis, the time series were temporally averaged to 1-second bins and the maximum amplitude of the LDF time series was calculated after the light stimulation was over.
Optical Intrinsic Signal
Images were averaged across repetitions within the same trial and smoothed by a 2-pixel-wide Gaussian filter. Then, OIS activation maps were computed by the intensity difference between each data point and a 2-second baseline period preceding the stimulus onset. The large surface vessels were segmented from the OIS data using a global intensity threshold that delimited the top 10% of the intensity values. A region of interest (ROI) was drawn over the exposed brain in the right hemisphere for each animal, and the same ROI was used for all OIS data sets to obtain the time series of change in reflectance. Small linear drifts were detrended by comparing the first 5 seconds before the stimulus and the last 5 seconds of each trial. The time series were temporally averaged to 1-second bins, to match with the temporal resolution of the fMRI data sets. The peak amplitudes were determined after the stimulation period and used for the neurovascular correlation analysis.
Magnetic Resonance Imaging
Each repetition from the fMRI runs was linearly detrended using baseline periods of 1 to 4 seconds and 30 to 40 seconds. A general linear model (GLM) (SPM8 software, Welcome Trust Centre for Neuroimaging, London, UK) was used with a boxcar function to initially determine the area of activity. Pixels exceeding a fixed
Statistical Analysis
Group measures were expressed as means ± standard errors of the mean. Statistical significance was assessed using Student's paired
RESULTS
Optical Control of Neurovascular Response Light stimuli at the site of ChR2 expression evoked significant electrical activity as well as robust hemodynamic responses. Figure 2 shows a multimodal dataset example of simultaneous neurovascular measurements obtained during light stimulation with 2.5 mW power, 8 Hz frequency, and 30 ms pulse in one ChR2 and one control rat. No significant changes of electrical activity and blood flow were detected in the control animal (red trace in Figures 2A–C), while in the ChR2 rat, the changes of the LFP closely followed the timing of the light stimulus (black trace in Figure 2A) and were accompanied by an increase in MUA (Figure 2B). We also observed a substantial increase of the local blood flow (Figure 2C). Temporal changes of HbT and dHb-weighted OIS images are shown in Figure 2D for the ChR2 rat and Figure 2E for the control rat. The bright spot in subtraction maps seen at 1 and 3 seconds during the laser stimulation (Figures 2D and 2E, frames inside the blue rectangle) is due to an increase in the fluorescence signal of mCherry or YFP. Light stimulation induced darkening in 570-nm OIS due to an increase in light absorption and brightening in 620-nm OIS (Figure 2D, 3 to 6 seconds data), which indicates an increase in CBV and a decrease in dHb, respectively. We did not observe any such changes at either wavelength in the control animals (N = 4) (Figure 2E). It should be noted that the light stimulation with 473 nm laser induces artifacts in optical imaging and laser Doppler flow data. The filters (572±7 nm for HbT and 620±7 nm for dHb) in front of the dual-channel camera reduce significantly the laser artifact on the OIS images, but still let through the concurrent, relatively broadband emission of the excited fluorescent proteins conjugated to ChR2 (mCherry or YFP). Thus, the light artifact on the images is reduced but not completely eliminated. In contrast with the filtered OIS, there is no filter in front of the receiving fiber of the LDF probe. The blue light artifact depends on the relative position and angle between the LDF probe and the blue laser fiber. Consequently, the light artifacts on the LDF vary between animals.
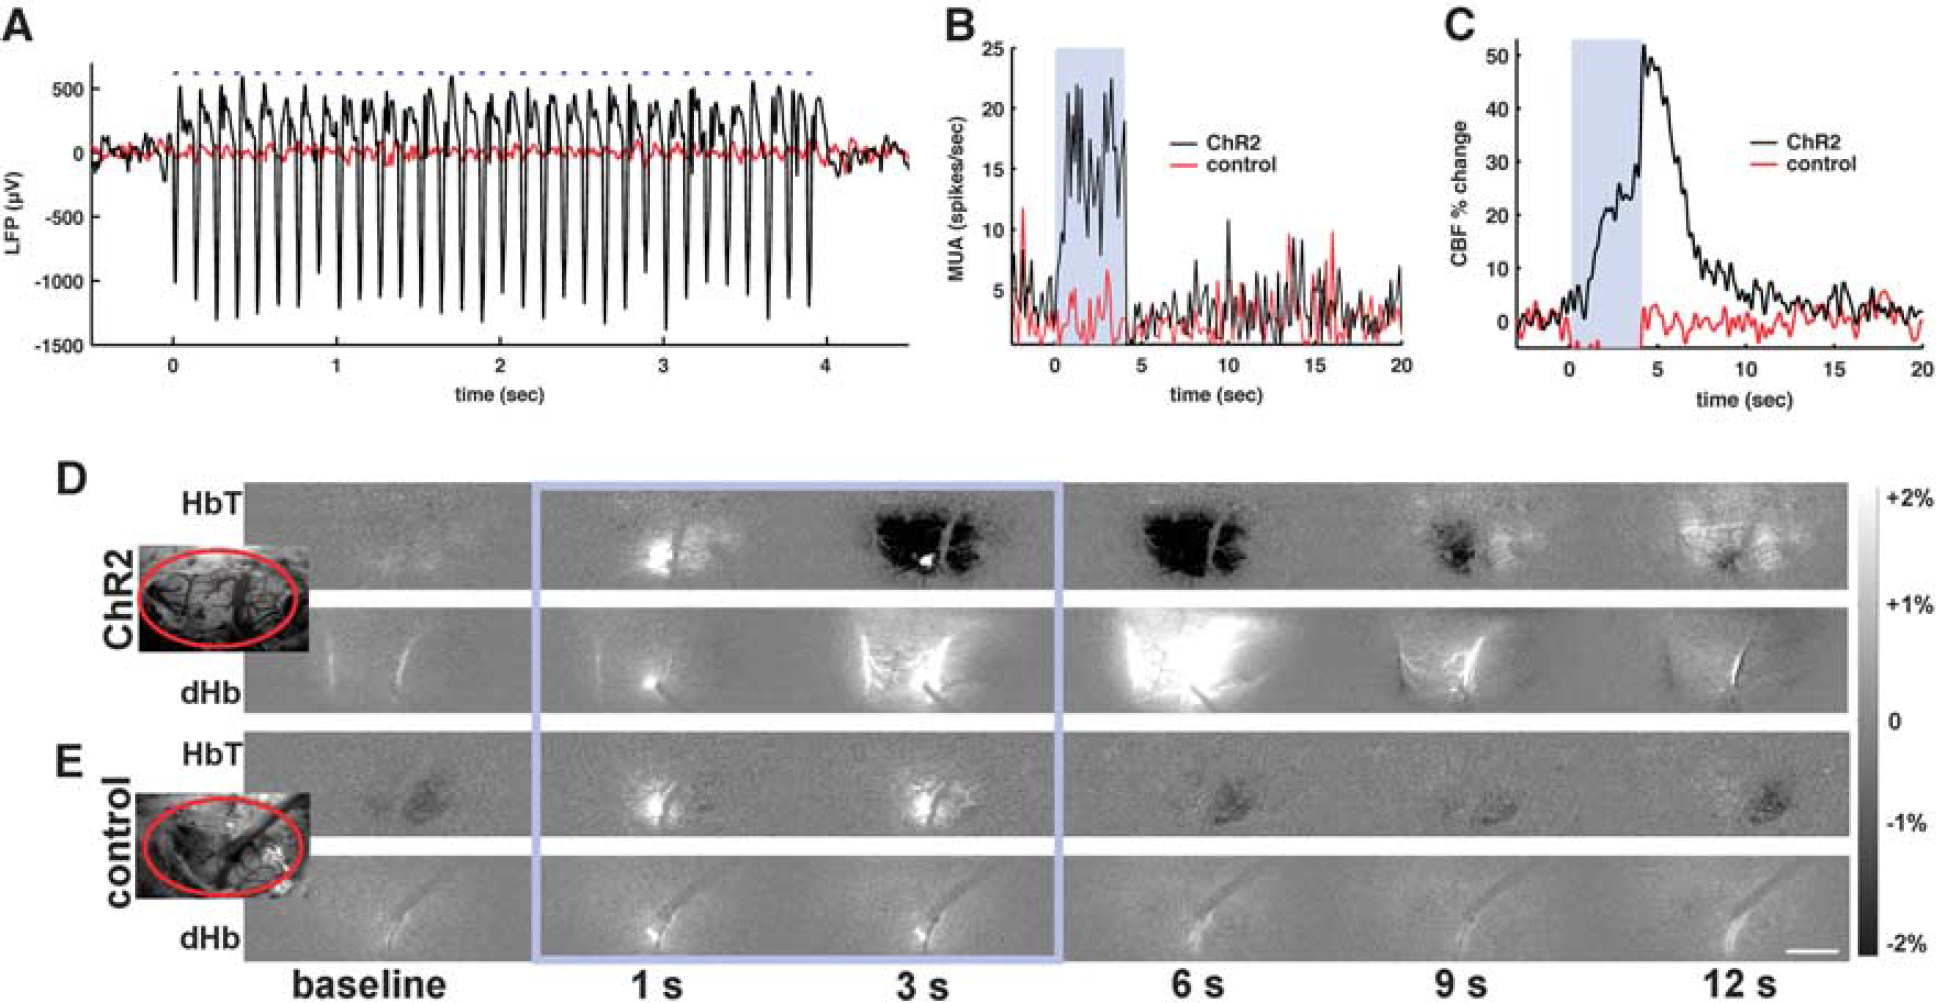
Neurovascular responses to optogenetic stimulus. (
Remote Regions in the Cortex Harbor Channelrhodopsin Projections and Show Blood Oxygenation Level-dependent Functional Magnetic Resonance Imaging Activation Light-induced hemodynamic response was not restricted to S1FL. The BOLD fMRI response was observed in the primary motor area (M1) and the secondary somatosensory cortex (S2) in the same hemisphere, particularly at high light power (> 5 mW) (Figures 3A and 3B). Furthermore, a weak activation in the ipsilateral striatum and thalamus was observed in two animals. These activation sites were projection targets of the ChR2-positive S1 area, as confirmed by histology (Figures 3C–F). Histologic sections at the S1FL displayed robust YFP expression (with linked ChR2) across the full cortical thickness at the site of the viral inoculation (Figure 3C). We observed lateral connections from the S1FL to the neighboring motor cortex (M1) and large bundles of yellow fibers entering the corpus callosum (arrow in Figure 3D). In addition, there were projections innervating the secondary somatosensory cortex (S2) (Figure 3E), thalamus, and striatum (Figure 3F).
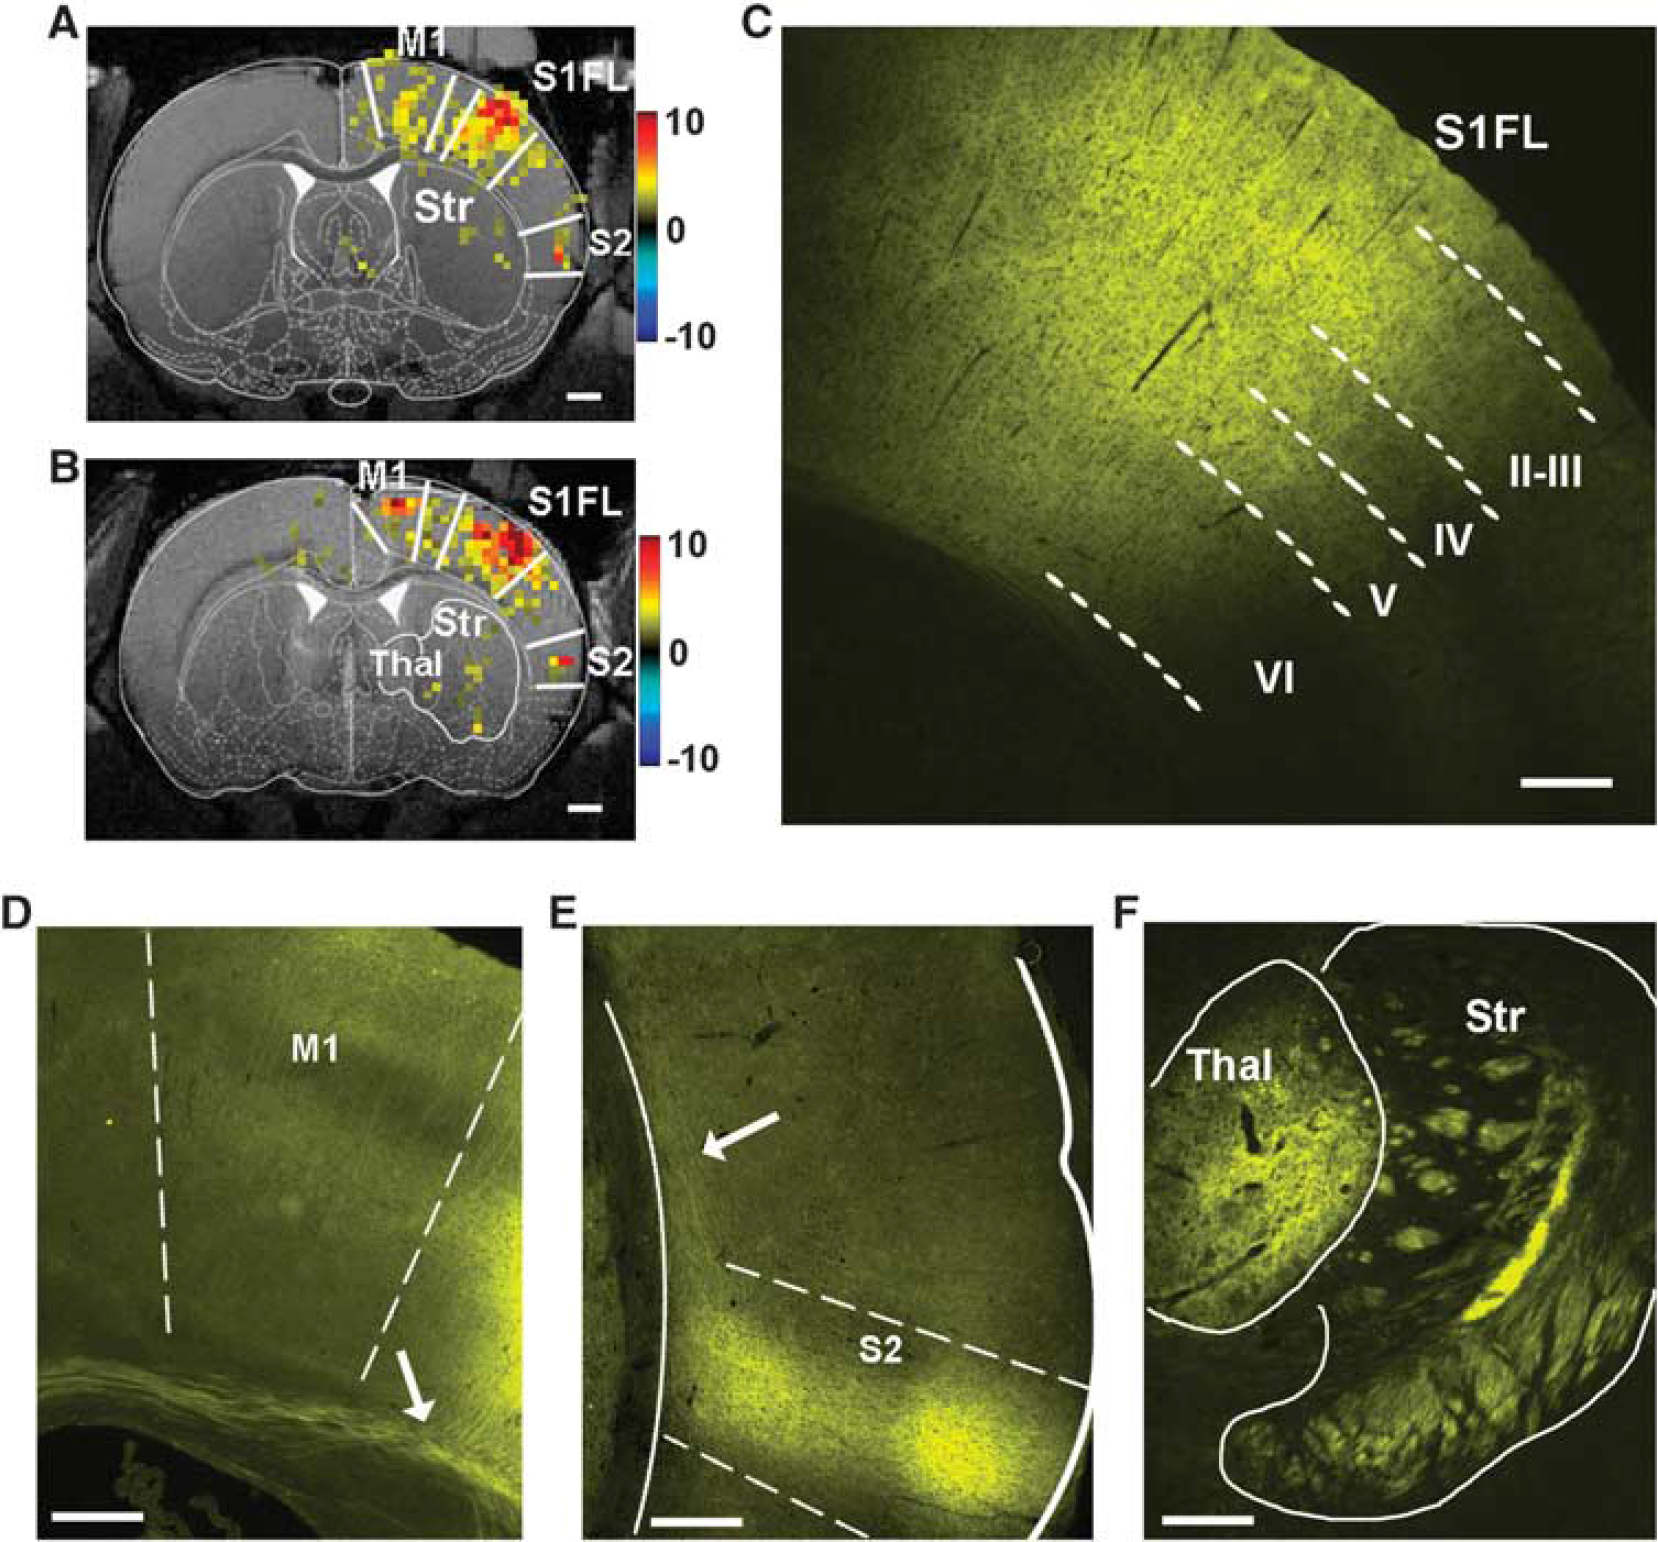
Blood oxygenation level-dependent (BOLD) functional magnetic resonance imaging (fMRI) activation at channelrhodopsin (ChR2)-positive brain regions. To show activation at the sites of the long-range ChR2 projections, a relatively low statistical threshold of
Channelrhodopsin Is Expressed in the Forelimb Somatosensory Area
To compare hemodynamic responses induced by light and sensory stimulations from the same region, ChR2 expression needs to be located at the S1FL area. The ChR2-mCherry expression is seen as an increase in the red fluorescence (Figure 4A) at the S1FL region. This region shows increased CBV during forelimb stimulation (Figure 4B). Upon light stimulation (bright spot in Figure 4C), the same cortical area also displays increased CBV. A similar overlap between ChR2 expression and S1FL was observed in the other animals.
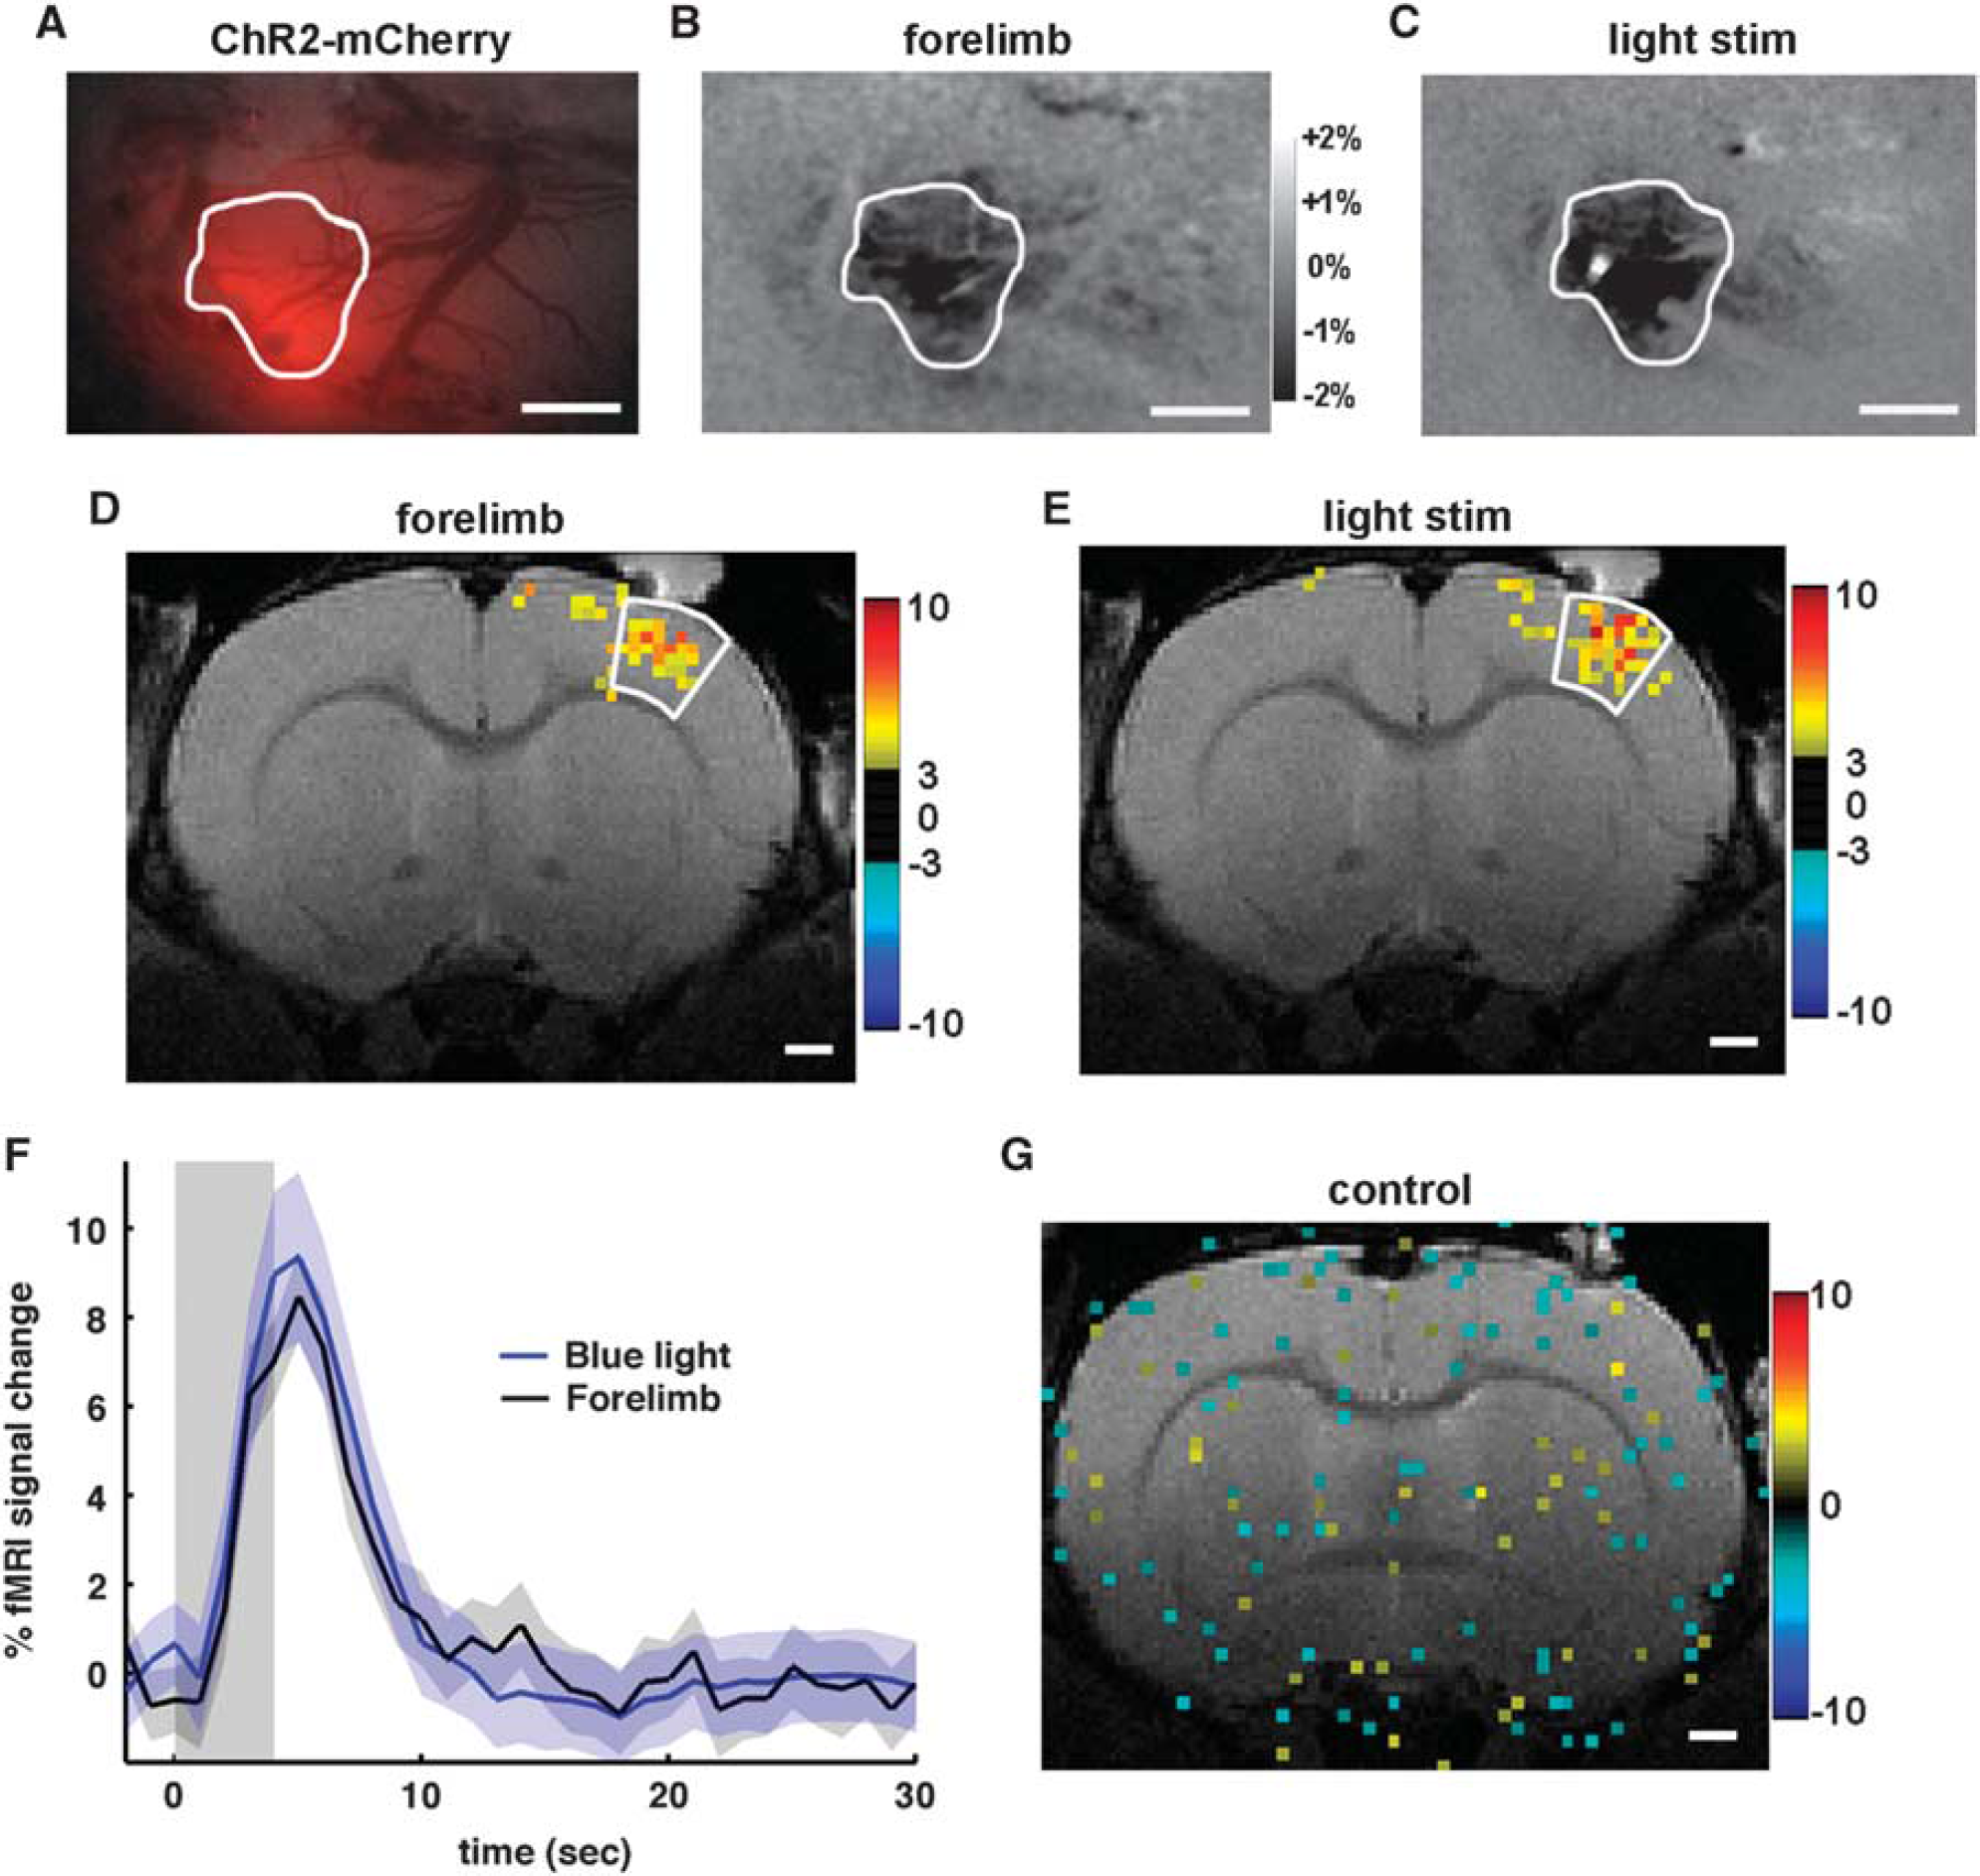
Correspondence of activation sites and temporal blood oxygenation level-dependent (BOLD) functional magnetic resonance imaging (fMRI) responses between forelimb (1 ms, 8 Hz, and 1.5 mA) and channelrhodopsin (ChR2) stimulation (30 ms, 8 Hz, and 10 mW). Example of a ChR2-mCherry expression site seen as an increase in the red fluorescence (
We further confirmed the functional overlap of the area responding to forelimb stimulation (Figure 4D) and the optogenetically driven site (Figure 4E) using BOLD fMRI (
Hemodynamic Responses Are Modulated By the Duration of the Light Pulse, Frequency, and Power
To determine the relationships between the neural and hemodynamic responses, we modulated neural activities by changing the light stimulation parameters. Longer duration of light pulses elicited larger hemodynamic responses (Figures 5A–F). For example, larger areas were activated in response to 50-ms pulse duration than 5-ms length in fMRI, 620 nm OIS, and 570 nm OIS (Figures 5A–C). Group-averaged time courses are shown in Figures 5D–F. It should be noted that OIS and LDF signals were interfered by the stimulating light, so their signal changes during the light stimulation period are not reliable. Generally, longer pulse durations induced a higher peak and a longer recovery time as shown (Figures 5D–F). The BOLD fMRI response and the dHb-weighted OIS had a similar time-to-peak (5 seconds after the onset of the 4-second stimulus) and almost an identical recovery time to baseline (10 to 15 seconds) (Figures 5D and 5E). The time-to-peak for the HbT was shorter (~4 seconds, Figure 5F), though the precise timing of the peak may be even earlier and obscured by the light stimulus artifact.
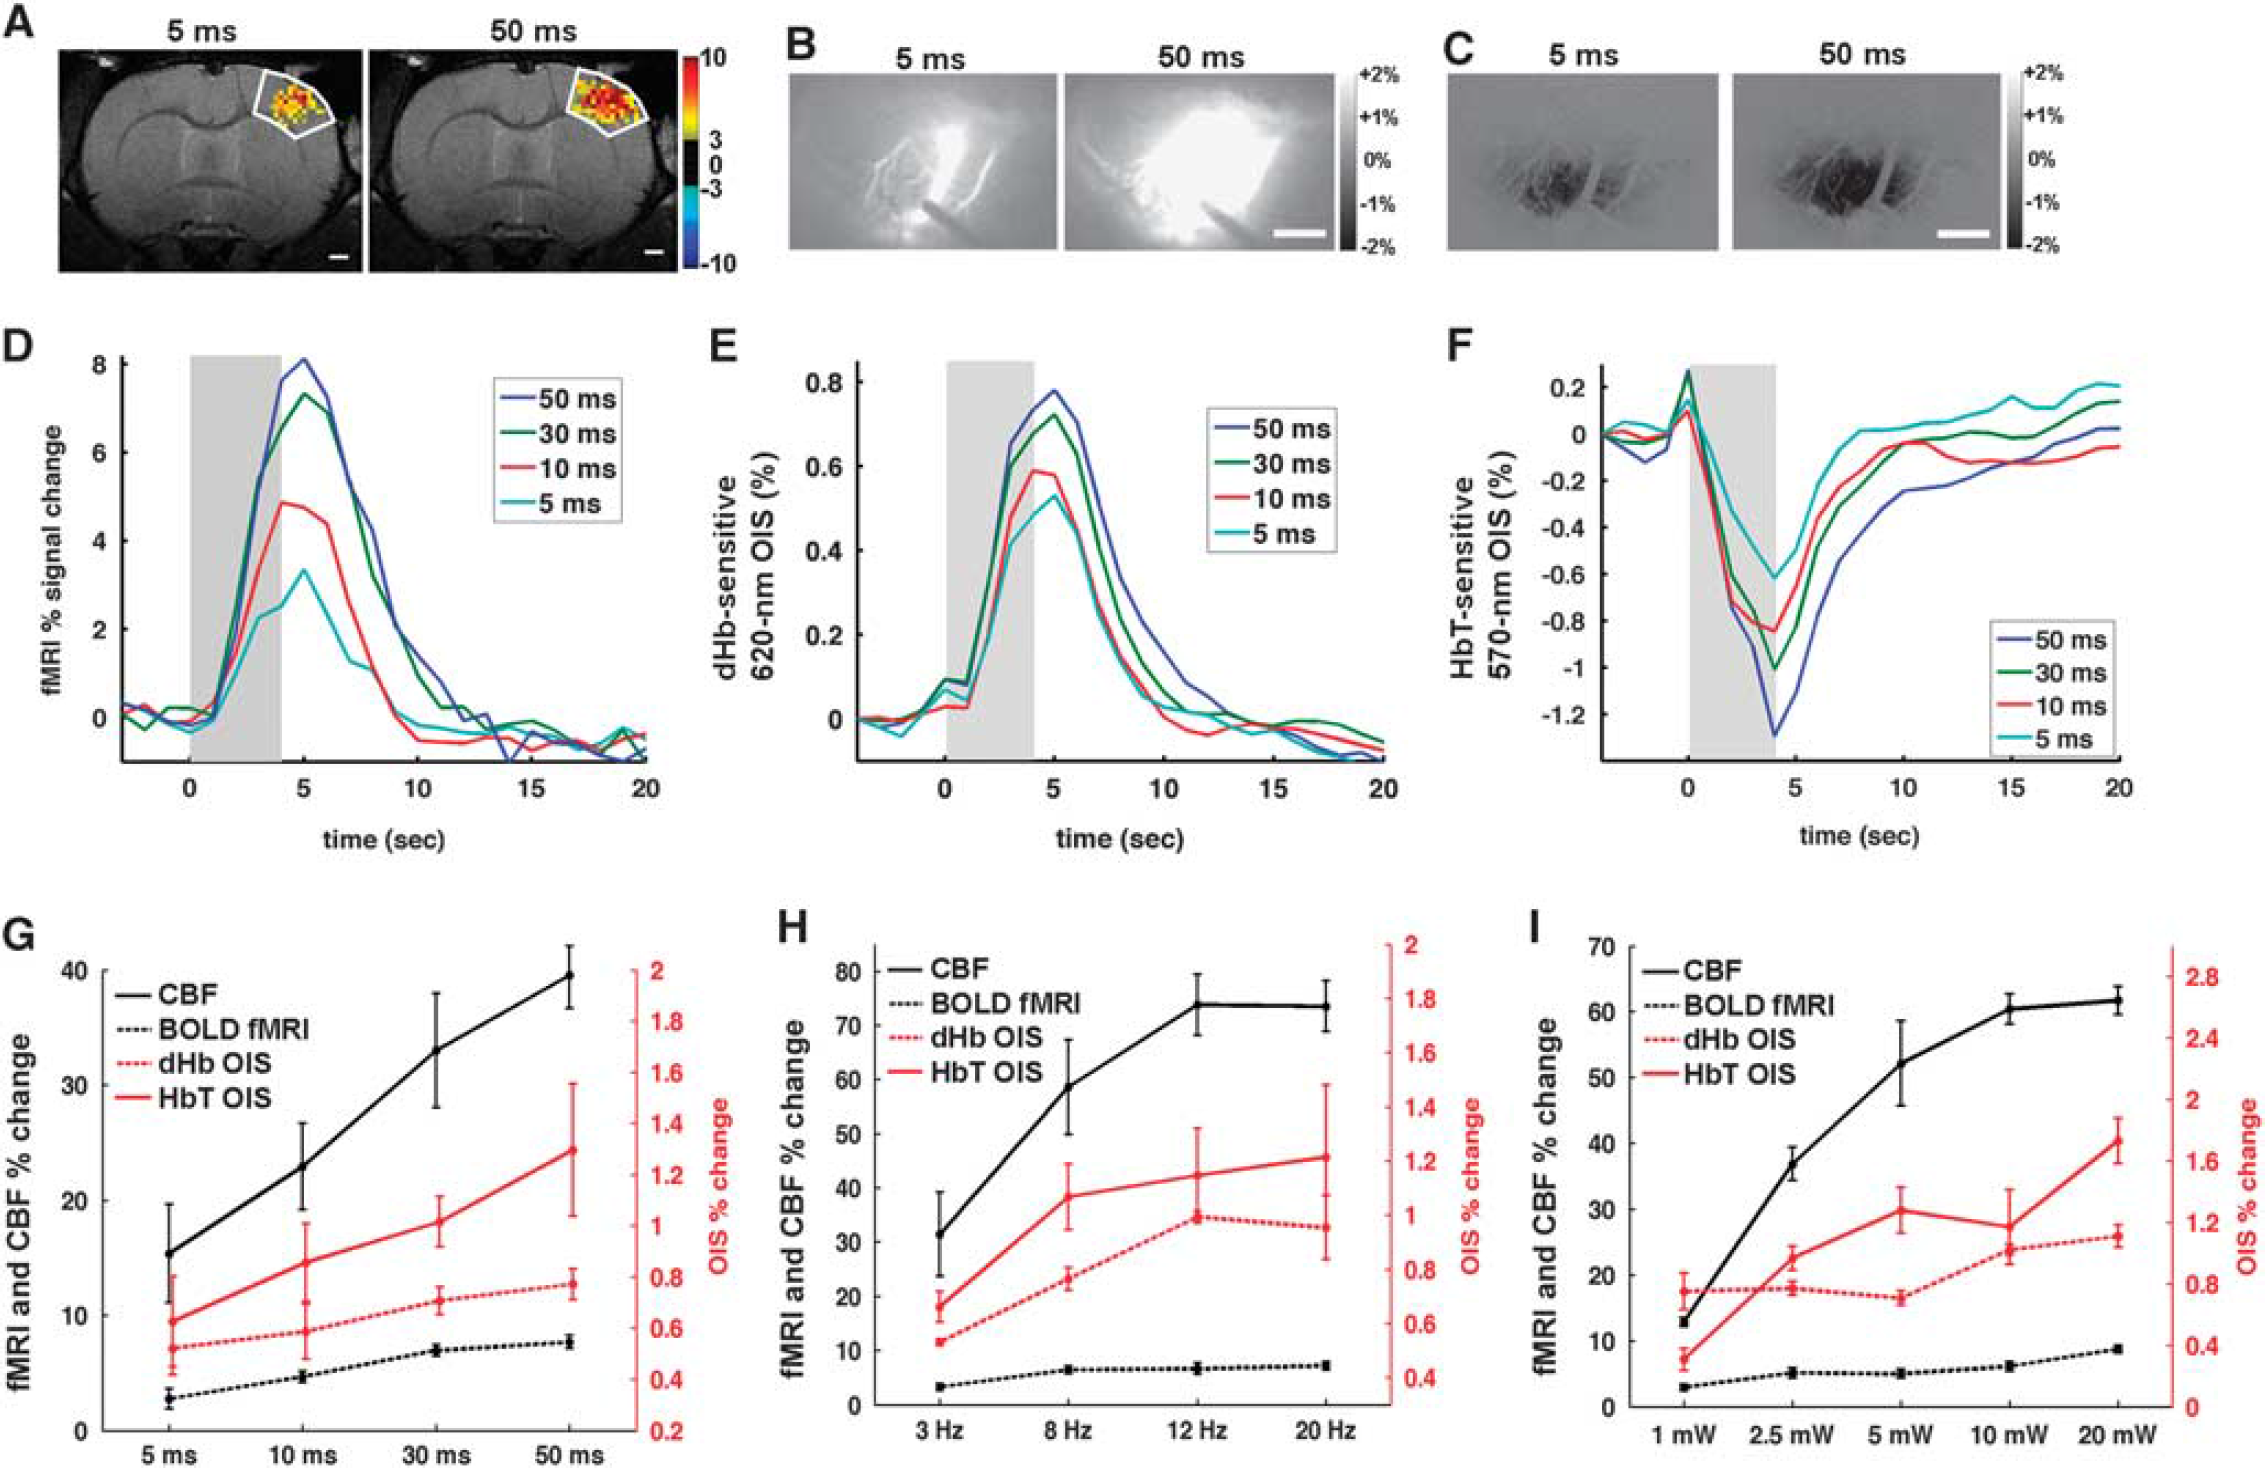
Hemodynamic responses modulated by the duration of the light pulse, frequency, and power. Activation area is larger when light pulse duration increases from 5 ms (left panel) to 50 ms (right panel) in blood oxygenation level-dependent (BOLD) functional magnetic resonance imaging (fMRI) (
The summary of the group data from increasing stimulus intensity across four modalities is shown in Figures 5G–I. Generally, the upward trend was maintained in all modes of measurements with an increase in pulse duration (Figure 5G). The frequency dependence of the light-evoked hemodynamic response (Figure 5H) shows that the amplitude plateaued at 12 Hz (Figure 5H). A similar saturation in the response at 10 mW was observed with an increase in light power, although the trend was less monotonic (Figure 5I).
Local Field Potential Is a Better Predictor of the Light-evoked Hemodynamic Response than Multiunit Activity In effort to elucidate the light-evoked neurovascular relationships, simultaneously acquired neural activities and hemodynamic responses were correlated in Figure 6. For this, stimulation frequency-dependent data were not included because neurovascular coupling is known to be nonlinear across frequencies.16,17 Overall, the mean LFP during the stimulus duration was a better predictor of the hemodynamic response (Figures 6A, Figures 6C, and 6E) than the average MUA increase (Figures 6B, D, and F), for both light and sensory stimulation. Cerebral blood flow had somewhat higher correlation (Figures 6A and 6B) than CBV-weighed OIS (Figures 6C and 6D). The slopes of the linear fits were similar for both light and forelimb stimulation, even though the intercepts differed. The correlations between the mean change of MUA and the maximum amplitude of both HbT and dHb responses were weaker for light stimulation than for forelimb (Figures 6D and 6F).
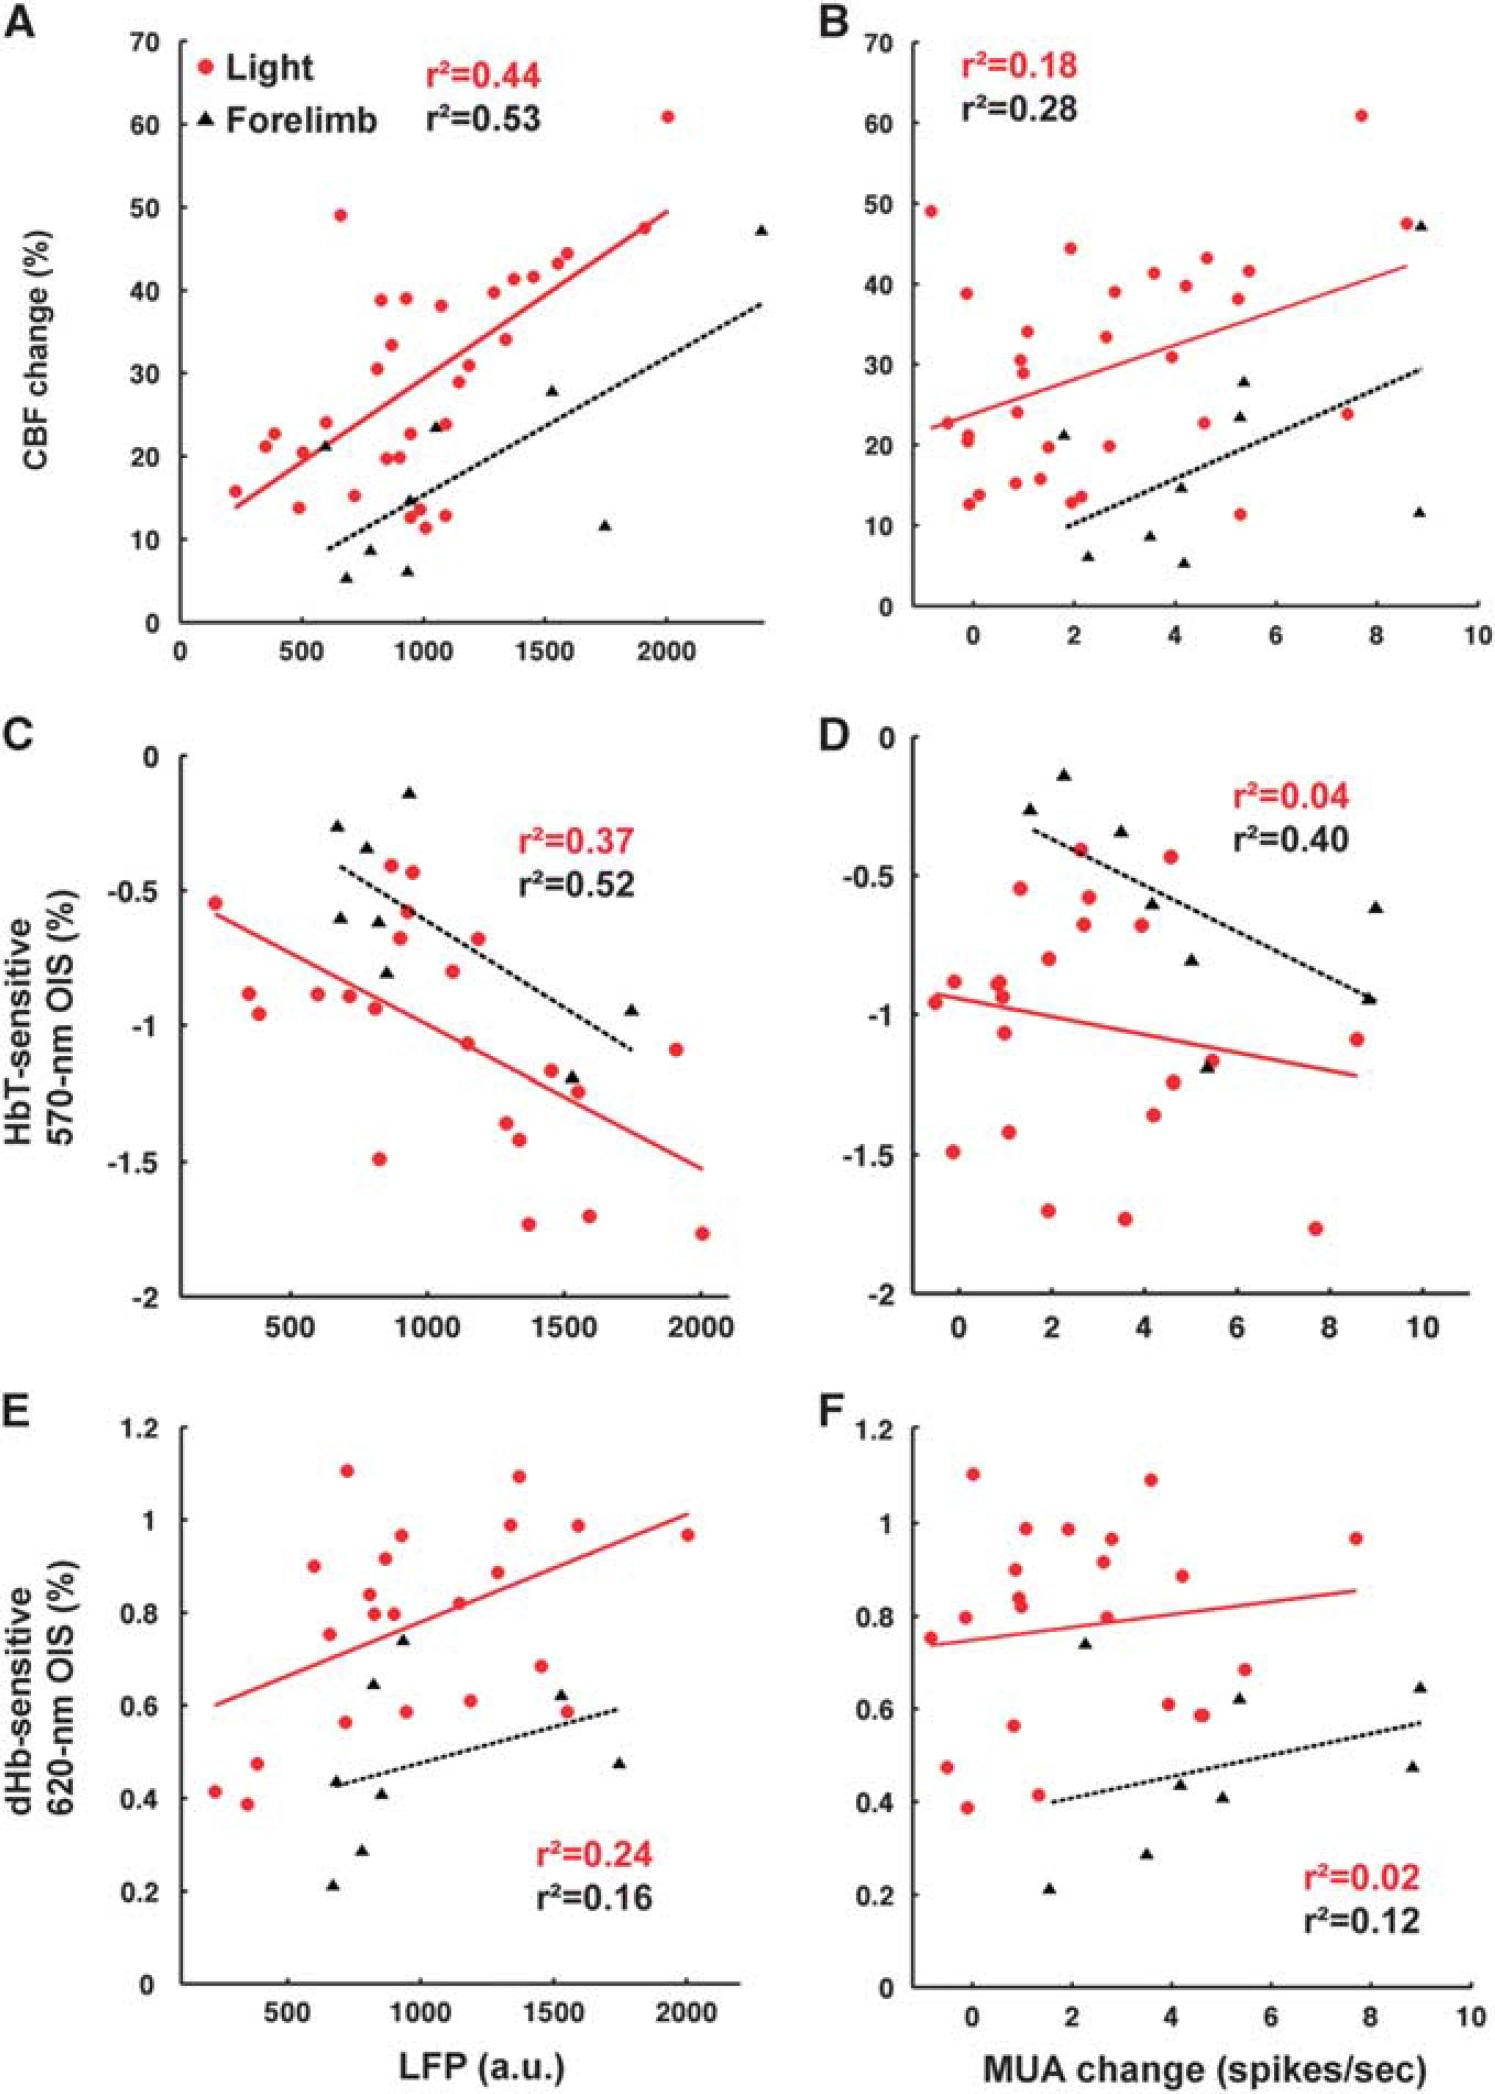
Correlation between neural activity and simultaneously acquired hemodynamic responses. The number of data points for light stimulation (red) was 31 from 5 animals for cerebral blood flow (CBF) and 22 from 4 animals for total hemoglobin (HbT) and deoxyhemoglobin (dHb), while data for sensory stimulation (black) included control animals, which were 9 for CBF and 8 for HbT and dHb. Local field potentials (
Blocking Glutamate Receptors Attenuates the Local Field Potential and Cerebral Blood Flow Response
To investigate vascular regulation under reduced postsynaptic neuronal activity, we topically applied antagonists of ionotropic GluRs, NBQX and APV (to block AMPA and NMDA receptors, respectively), at the site of the light activation. During forelimb sensory stimulation, glutamate antagonists decreased significantly LFP (Figure 7A), MUA (Figure 7B), and CBF (Figure 7C) in all animals tested (Figure 7D). For light stimulation, however, while glutamate antagonists significantly attenuated the LFP and CBF responses (
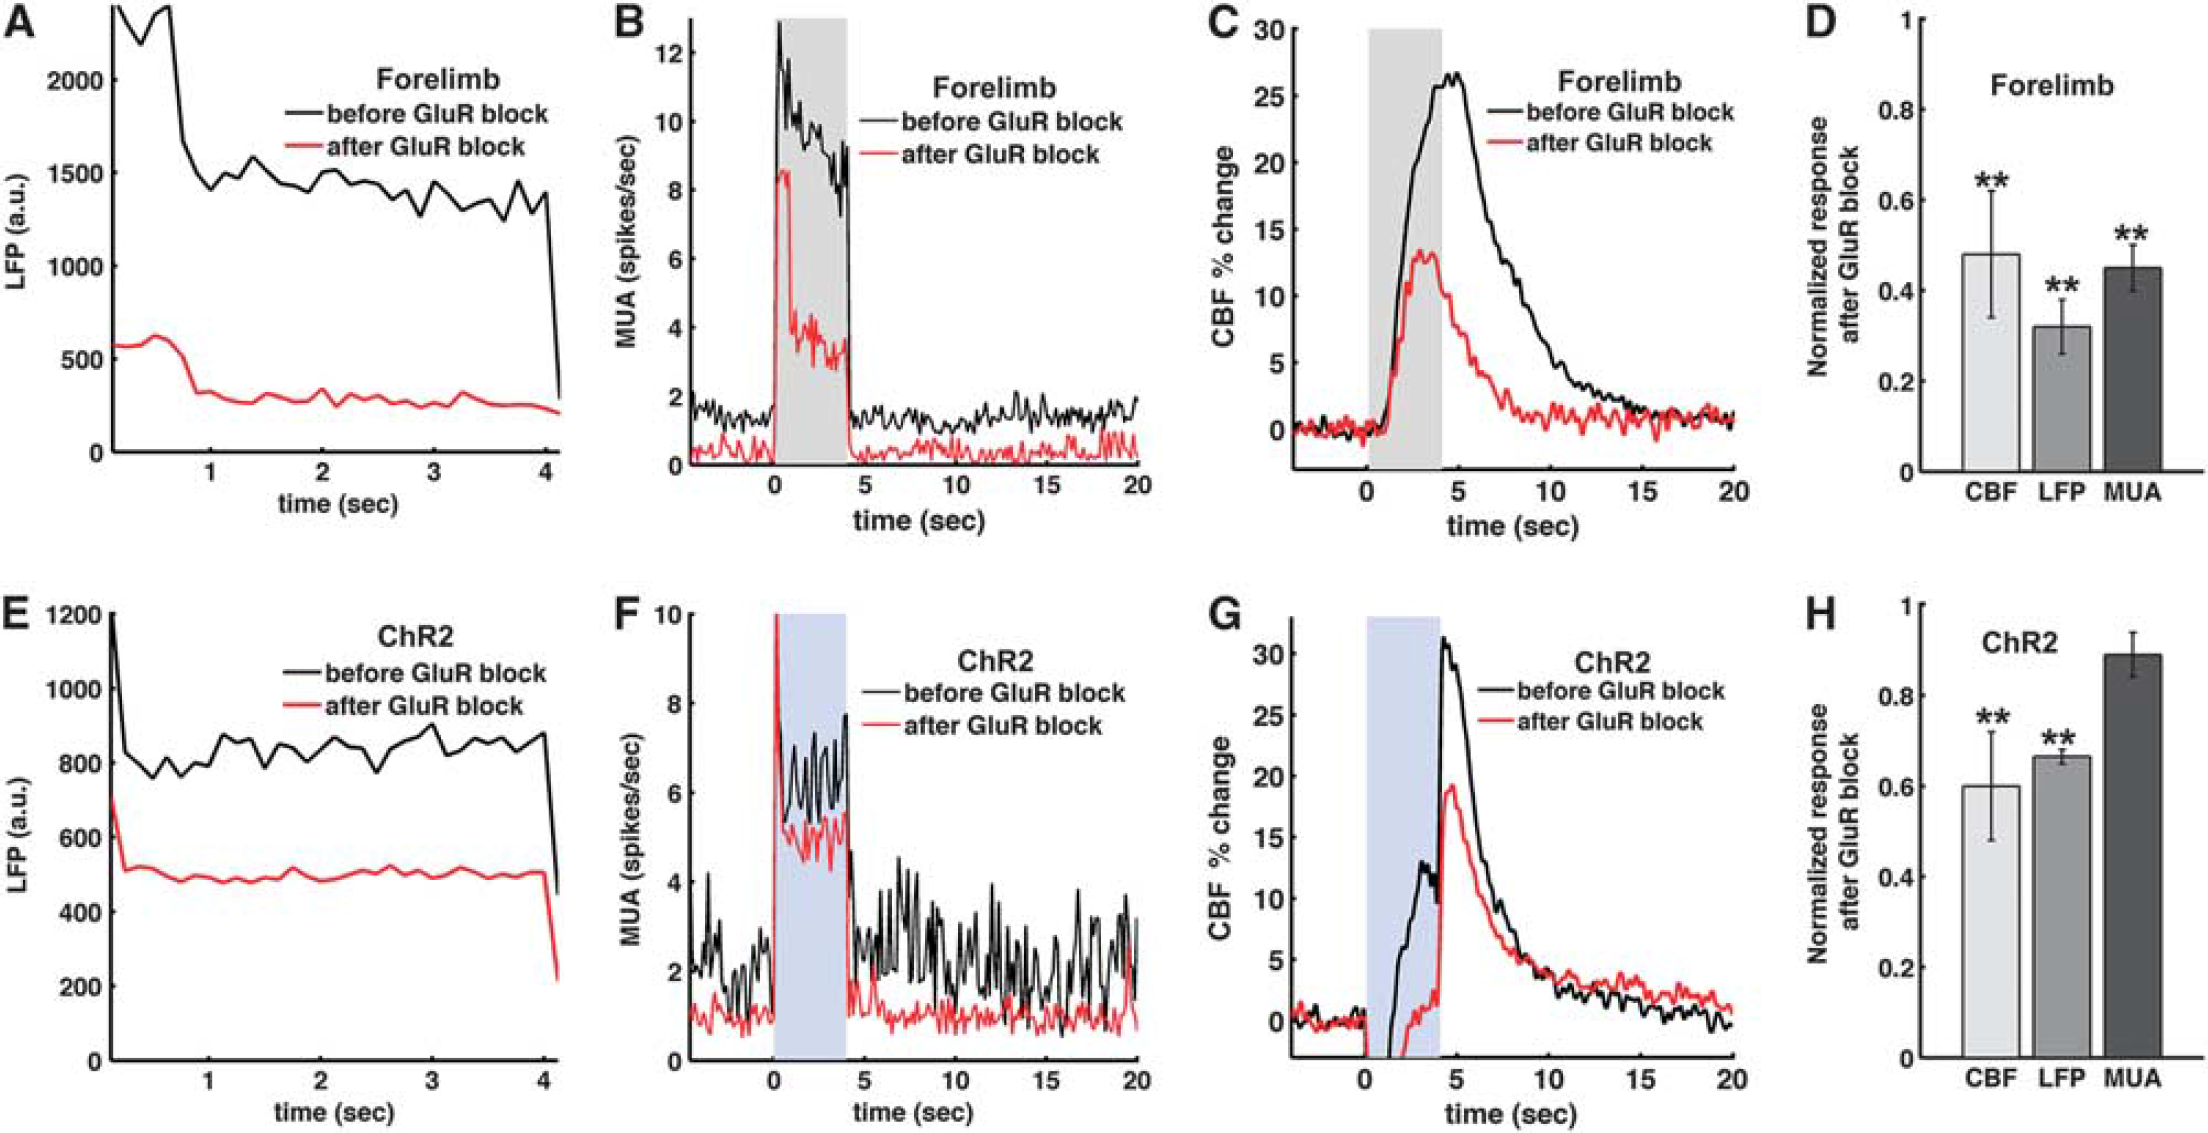
Role of the post-synaptic glutamate receptors (GluRs) in the light-evoked and forelimb neural activities and hemodynamic responses. Glutamate receptor antagonists were topically applied in three animals to block AMPA and NMDA GluRs for forelimb (
DISCUSSION
We used a multimodal approach to investigate different aspects of neurovascular coupling during optogenetic activation in the rat forelimb somatosensory cortex. Using ChR2 stimulation, we were able to achieve reliable fMRI activation. We addressed several specific opto-fMRI concerns and provided the following observations for more comprehensive understanding for opto-fMRI;(1) No light-induced functional hemodynamic signal changes were observed in control rats, indicating that light-induced heating is negligible in our setup. (2) The light-evoked BOLD responses were almost identical to the forelimb-evoked BOLD responses, suggesting that the same neurovascular coupling mechanism could be involved for the two stimulation modalities. (3) The magnitude of the hemodynamic responses scaled with the energy of the light stimulus in ChR2 animals. (4) The LFP was a better predictor of the light-evoked hemodynamic response than the local presynaptic firing rate. This finding was further confirmed by the pharmacological blockade of GluR, which caused a significant reduction of the LFP and blood flow, but only a small change in the light-evoked MUA. These findings can serve as a groundwork for general fMRI research with optogenetic tools.
Local and Global Opto-Functional Magnetic Resonance Imaging Response
No light-induced activation was observed in the control animals for both optical and MRI studies (Figure 2E and Figure 4G). These results are in agreement with most previous findings,3–5,8,9,13,26 except one study which observed BOLD activation in naïve rat brains.
27
One difference between our data and Christie
The global activation BOLD fMRI maps obtained (Figures 3A and 3B) are consistent with the observed ChR2 long-range projections in the histologic slices (Figures 3D to 3F) and the structural connectivity of S1FL. 28 Very weak activation in subcortical structures such as thalamus and striatum may be due to anesthesia effects on the global connectivity 4 and the relatively short stimulation duration (4 seconds) for activating robustly long-range networks. Overall, our observations are congruent with previous opto-fMRI maps of stimulation in somatosensory (barrel) cortex in ChR2 expressing mice 4 and rat motor cortex. 3
Dynamic Behavior of the Hemodynamic Responses We found that the BOLD fMRI time courses of light and forelimb stimulation were remarkably similar (Figure 3F). This is consistent with previous observations in rat motor cortex 3 as well as somatosensory cortex of transgenic mouse models. 8 Taken together, the hemodynamic response function of light stimulation in our setup can be inferred from that of sensory stimulation fMRI studies in the same region.
The initial dHb-weighted OIS dip typically present in sensory stimulation is thought to signify the tissue early metabolic consumption, before the rush of oxygen supply from the vessels. 29 The presence of this dip depends on many factors such as anesthesia, systemic blood pressure, and paradigm. 29 Under our experimental conditions, we as well as others14,15,17,18 observed dHb-weighted OIS initial dip during forelimb stimulation. However, no discernible initial dip (darkening) was observed during light stimulation probably due to the contribution of fluorescence signals induced by light stimulation (see Figure 2D). Although OIS data for the duration of the light stimulus have contributions from the fluorescent proteins, trends of the stimulation parameter-dependent amplitudes and temporal behaviors are similar for BOLD and dHb-weighted OIS (Figures 5D and 5E). This is expected since the BOLD fMRI signal is inherently linked to the dHb level. The peak response time is later for dHb signals compared with HbT (Figures 5E and 5F), suggesting different origins. The dHb signal change mostly occurs at venous vasculature, so the HbT difference is most likely from change in arterial vasculature. This inference is consistent with hemodynamic regulation studies by two-photon microscopy 30 and fMRI. 31
Correlation Between Neural Activity and Hemodynamic
Responses Neural activity is well correlated with CBF, moderately with CBV, and less with dHb signals (Figure 6). We expected that both CBF and CBV would be similarly correlated with neural activity, since CBF and CBV largely parallel each other (
Correlation between neural and hemodynamic responses was performed for LDF and OIS data, not for BOLD fMRI, since BOLD and electrophysiology data were acquired in different animals. Thus, we can only make a conjecture about the neural source of BOLD fMRI from the 620-nm OIS data. Overall, the LFP is a better predictor of the hemodynamic responses than the MUA. This finding agrees with the frequently acknowledged origin of the hemodynamic responses evoked by sensory stimulation33,34 and with optical neurovascular studies in transgenic ChR2 mice
12
and transduced ChR2 rats.
13
However, our data differ from a recent study in transgenic ChR2 mice which reported that the BOLD signal was matched best by the spiking activity.
9
In the specific studies by Kahn
We found no significant differences between the slopes of the neurovascular relationships obtained from light and forelimb stimulation. These results differ from our previous transgenic ChR2 finding, 12 where the neural activity due to forelimb stimulation produced a larger hemodynamic response. The transgenic mice have expression of ChR2 limited to layer V, while the rats in our study expressed the opsin throughout the cortical thickness. As a result, light activation most likely engages different circuits, possibly impacting the hemodynamic response. In addition, LDF has a sensitivity volume of 1 mm, 3 making it more sensitive to CBF changes in the upper cortical layers. This depth sensitivity of the CBF response could also explain the difference between our rat and mice studies.
For most part, correlation coefficients between LFP and hemodynamic responses are higher for sensory stimulus compared with light stimulation. One possible explanation is the difference between pre and postsynaptic origin of the electrical activity. The neural response in forelimb stimulation comes largely from postsynaptic activity (see Figures 7A–D). In contrast, the light stimulus evokes synchronized opening of many ionic channels producing substantial presynaptic LFP (Figure 7E). This occurrence may be a source of a nonlinear component in our light evoked response.
Glutamate Receptor Block
The topical application of GluR antagonists significantly reduced light-evoked LFP and CBF, while MUA change was much smaller. In contrast, all LFP, MUA, and CBF evoked by forepaw stimulation were significantly reduced by the drug application. There are several factors that may explain these outcomes: (1) The synchronous opening of many light-gated channels produces a large ion flux. Consequently, the optogenetically driven LFP seems to have a greater presynaptic component than the one from sensory stimulation. (2) We blocked pharmacologically the ionotropic GluR, leaving functional the metabotropic GluR. Systemically infused metabotropic GluR antagonist was shown to reduce LFP. 10 (3) The surface application of pharmacological agents may not diffuse completely to deeper layers. The antagonists were applied topically and most likely have a diffusion gradient with more effective silencing of the GluR-dependent response at the more superficial layers. As a result, evoked responses to forepaw stimulation that mainly originate from activities in superficial layers (II to IV) can be more effectively reduced by the drugs than those to photo-stimulation that are originated from activities in all layers. Relatedly, an earlier study with transgenic mice expressing ChR2 in layer V reported that an ionotropic GluR antagonist did not reduce dHb-weighted OIS and CBF responses evoked by photo-stimulation. The transgenic mice in this study 10 have expression of ChR2 only in a deeper layer (V) and the antagonists may not fully reach these layers.
Finally, it has been suggested that selective glutamatergic cell activation with light rapidly engages a wider cell network of balanced excitation and inhibition.37–40 In terms of neurovascular studies, this observation means that light stimulus may result in a hemodynamic response that is not only driven by the cell-specific ChR2 expression, but also affected by secondary postsynaptic cell populations. Only a small change in light-evoked firing rate after GluR inhibition (Figure 7C) indicates that the action potential contribution from postsynaptic cells is minimal at this power level (2.5 mW). In contrast, the significant reduction of firing rate during forelimb stimulation after GluR inhibition indicates that the bulk of MUA originates from postsynaptic cells in the afferent somatosensory circuits (Figure 7B). It is important to note that the spike detection in extracellular recording is somewhat biased toward detecting spikes from large pyramidal cells. Therefore, it is conceivable that nonglutamatergic postsynaptic signaling may be at least in part contributing to the LDF and LFP responses to blue light after the block of GluRs. Also, the engagement of larger and diverse cellular networks may still be present at higher light powers.
Bringing the tools of optogenetics into neurovascular research delivers the opportunity to manipulate directly the activity of specific cell populations. The present work provides a basis for the design of optogenetic studies and the interpretation of hemodynamic data. The knowledge of the neurovascular coupling properties during opto-fMRI is essential since hemodynamic-based imaging data on this relatively noninvasive level can provide a link between animal models and studies in humans.
DISCLOSURE/CONFLICT OF INTEREST
The authors declare no conflict of interest.
Footnotes
ACKNOWLEDGMENTS
The authors would like to thank Ping Wang and Francesca Nicholls for technical assistance, Michel Modo for instrumentation access, and Owen Smith for the artist rendering of the experimental setup.