
Purposes
Post mortem imaging provides both anatomical and functional information at microscopic resolution and can be considered as a gold standard for macroscopic in vivo studies. We propose a generic, robust and automated protocol integrated in a graphic interface to digitalize, reconstruct and analyze functional volumes of rodent brain based on coronal post mortem slices. The first application of this work concerns the 3D analysis of an activation study on a group of rats to investigate the metabolic response to visual stimulation in superior colliculus (SC).
Methods
After injection of [14C]2-deoxyglucose, adult Long Evans rats (n=5) were visually stimulated during 45 minutes with a moving checkerboard displayed on a computer screen with left eye opened (activated SCright) and right eye masked (non activated SCleft). After sacrifice, cryostat sections (20 μm thickness) were obtained in coronal incidence for the whole SC (about 150 sections), exposed to generate autoradiographic information and converted to Cerebral Metabolic Rate of Glucose (CMRGlu). The same sections were then stained with histological dye. An optimized digitalization (600 dpi resolution) was proposed by simultaneously acquiring group of slices at the same time. The individualization of each slice from these global scans was then realized using a dedicated method. A slice to slice registration based on the block-matching method was then performed for the anatomical series leading to a consistent 3D anatomical volume. The autoradiographic volume was then reconstructed by directly matching 2D functional slices with their corresponding registered anatomical slices. A manual segmentation of SC was realized and used to calculate the mean activity m and the standard deviation s in non activated SCleft. The maximal CMRGlu sub-region was automatically outlined in the SCright using m+2 s threshold. An automated symmetrization of this sub-region in the SCleft was computed and an increased metabolic percentage was calculated for each rat.
Results
The part of the rat brain including the whole SC was automatically reconstructed for anatomical and functional data of all rats. Mean volumes calculated were respectively 3.71±0.34 mm3 for SCright, 3.61±0.35 mm3 for SCleft and 0.38±0.18 mm3 for the sub-region of maximal metabolic response (about 10% of SCright volume). The location of the activity in SCright was consistent for the five rats. Increased metabolic response was estimated to 26±6%.
Conclusion
3D morphological and functional parameters of interest (location, volume, CMRGlu) have been derived from histological slices. This study demonstrated 1) the feasibility of this automated procedure to analyze group of animals and 2) the possibility to perform 3D quantitation with a high reproducibility. In the future, this method will allow merging post mortem and in vivo (microPET) information.(See Figure 1 and Figure 2).
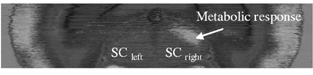
Fusion of anatomical and functional reconstructed volumes in axial incidence.

Axial 3D view of SC: 1) sub-region of maximal CMRGlu automatically extracted, 2)symmetrized sub-region