Introduction
Three accumulative tracers, I-123-IMP, Tc-99m-HMPAO, and Tc-99m-ECD were widely used to measure cerebral blood flow (CBF) in single-photon emission computed tomography (SPECT). In the present study, normal database of CBF measured by three SPECT tracers were built and compared with regional distribution of CBF measured by positron emission tomography (PET) with O-15 labeled water. The regional distribution of tissue fraction of gray matter determined from magnetic resonance (MR) images by using voxel-based morphometry (VBM) technique was also compared with CBF distributions.
Methods
Total 59 healthy subjects were recruited (47–71 years of age). SPECT studies with I-123-IMP, Tc-99m-HMPAO, and Tc-99m-ECD were performed on 11, 20, and 17 subjects, respectively. PET studies were performed on 11 subjects. MR imaging studies for VBM were performed on 43 subjects who had SPECT study. All SPECT, PET, and MR images were transformed into the standard brain format using the SPM2 system. The radioactivities of each SPECT and PET image were globally normalized to 50 mL/100 mL/min. Gray matter, white matter, and cerebrospinal fluid images were segmented and extracted from all transformed MR images by VBM methods in the SPM2 system.
Results
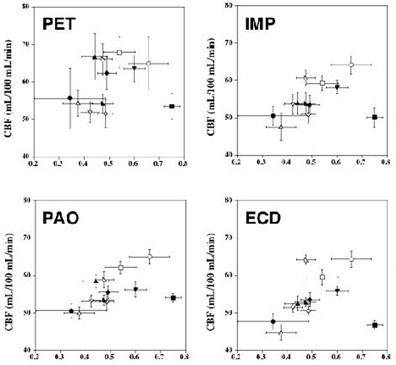
Differences in regional distribution of SPECT tracers as compared with O-15 labeled water were observed in the pons, mid brain, thalamus, putamen, parahippocampal gyrus, posterior part of cingulate gyrus, temporal cortex, and occipital cortex. No significant correlations were observed in all relations between tissue fraction of gray matter determined by VBM analysis and CBF values of PET or SPECT for all regions-of-interest. In particular, smallest CBF values per gray matter fraction were observed in hippocampal region.
Conclusions
Differences in regional distribution of SPECT tracers were considered to be mainly caused by differences in the mechanism of retention of tracers in brain. Regional distribution of CBF was independent on regional distribution of gray matter, resulting in that the blood flow per gray matter volume were various for each brain region (See Figure 1).