
Abstract
Positron emission tomography (PET) data are commonly analyzed in terms of regional intensity, while covariant information is not taken into account. Here, we searched for network correlates of healthy cognitive function in resting state PET data. PET with [18F]-fluorodeoxyglucose and a test of verbal working memory (WM) were administered to 35 young healthy adults. Metabolic connectivity was modeled at a group level using sparse inverse covariance estimation. Among 13 WM-relevant Brodmann areas (BAs), 6 appeared to be robustly connected. Connectivity within this network was significantly stronger in subjects with above-median WM performance. In respect to regional intensity, i.e., metabolism, no difference between groups was found. The results encourage examination of covariant patterns in FDG-PET data from non-neurodegenerative populations.
Keywords
INTRODUCTION
In recent years, the field of brain connectivity has gained enormous impact. Herewith, functional magnetic resonance imaging (fMRI) has been the leading imaging modality, providing valuable insights into connectivity substrates of normal and pathologic cognition. 1 Yet, clinical utility of fMRI is still very limited. 2 In contrast, positron emission tomography with [ 18 F]-fluorodeoxyglucose (FDG-PET) is an established clinical tool, assisting early and differential diagnosis of dementing and movement disorders.3–5 These conditions are accompanied by a certain spatial pattern of neural degeneration that is captured by PET as regional glucose hypometabolism. So far, however, this imaging tool has got little attention in studies of healthy cognitive function and non-degenerative brain diseases.
As compared with traditional, intensity-based analyses of PET images, modern approaches of brain connectivity modeling enable a more comprehensive usage of image information, particularly in terms of covariance. Given that cognitive functions rely on networks of interacting cerebral regions rather than on single brain areas, it is plausible that covariance information may prove useful in investigating neural substrates of healthy cognition. Indeed, assuming that regions of the same network follow a similar pattern of glucose metabolism across subjects, 6 FDG-PET is able to capture plausible patterns of metabolic covariance, or connectivity, in healthy state.6–8
Verbal WM represents a complex cognitive system for storage and manipulation of linguistic information, e.g., words and letters. It is involved in many everyday activities and is regarded to be one of the elements underlying intelligence. As highlighted in an extensive meta-analysis of neuroimaging studies, neural correlates of verbal WM go far beyond the lateral fronto-parietal cortex, including parts of the cingulate, temporal cortex, as well as the insula. 9
Recently, we reported a relationship between verbal WM performance and metabolic connectivity within the default mode network (DMN) in young healthy adults. 10 In the present study, we go beyond the midline DMN and examine metabolic connectivity between brain regions that are known to be implicated in verbal WM. To this end, we apply functional connectivity modeling in the form of sparse inverse covariance estimation (SICE).
MATERIALS AND METHODS
Subjects and Image Data
Details on subject characteristics, assessment procedures, and data acquisition are reported elsewhere. 10 In brief, 35 healthy, unmedicated subjects (27.1±5.1 years, mean ± s.d.) were recruited by two centers, Inserm-EPHE-Université de Caen, France (n = 16) and University Medical Center Mainz, Germany (n = 19). All the participants gave their informed consent to cognitive and neuroimaging assessments, which were approved by the Ethics committee of the University of Caen and Ethics Committee of the University of Mainz. Verbal WM was assessed using the digit span backward test. According to the test scores, subjects were divided into groups with high (n = 17) and low (n = 18) test performance by the median split. As a result, the groups significantly differed in test performance (P < 0.001). 10
The PET data were acquired under standard resting conditions. In Caen, a 10-min PET scan was acquired on a Discovery RX VCT 64 PET/CT device (GE Healthcare Milwaukee, WI, USA) approximately 50 minutes after intravenous injection of approximately 180 MBq FDG. In Mainz, a 15-min PET scan was acquired on a Philips Gemini TF PET/CT scanner (Philips Medical Systems, Eindhoven, Netherlands) approximately 30 minutes after intravenous injection of approximately 150 MBq FDG. The PET images were spatially normalized via anatomical T1 MRI images. Images were intensity scaled by the value in the pons. 11 To account for intercenter effects, PET images were then divided by the mean of all PET images per center. 11 Finally, the WFU PickAtlas (http://fmri.wfubmc.edu/software/PickAtlas) was utilized to extract individual intensity values in Brodmann areas (BAs).
Choice of Regions for Connectivity Modeling
Choice of regions was based on a meta-analysis of 60 neuroimaging (PET and fMRI) studies of WM tasks. 9 That analysis included only studies of healthy, unmedicated subjects, in which whole-brain comparisons of WM tasks with a control task were reported. Of note, each peak coordinate was classified according to the type of material to be remembered, with major categories of verbal, spatial, and object. For the present study, we considered all brain regions with normalized peak counts >0.005 for verbal storage (see Figure 6 in ref. 9), i.e., the main component of the digit span backward test. Thus, the following 13 BAs were included: premotor cortex and supplementary motor area (BA 6), precuneus and superior parietal lobule (BA 7), portions of the dorsolateral and medial prefrontal cortex (BA 9), posterior insula (BA 13), caudal two-thirds of the superior temporal gyrus (22), ventral (BA 24) and dorsal (BA 32) anterior cingulate, dorsal posterior cingulate (BA 31), caudal portions of the fusiform gyrus and inferior temporal gyrus (BA 37), ventral part of the inferior parietal lobule (BA 40), opercular (BA 44) and triangular (BA 45) parts of the inferior frontal gyrus, and middle third of the middle frontal gyrus and ventral portion of the inferior frontal gyrus (BA 46), see Figure 2.
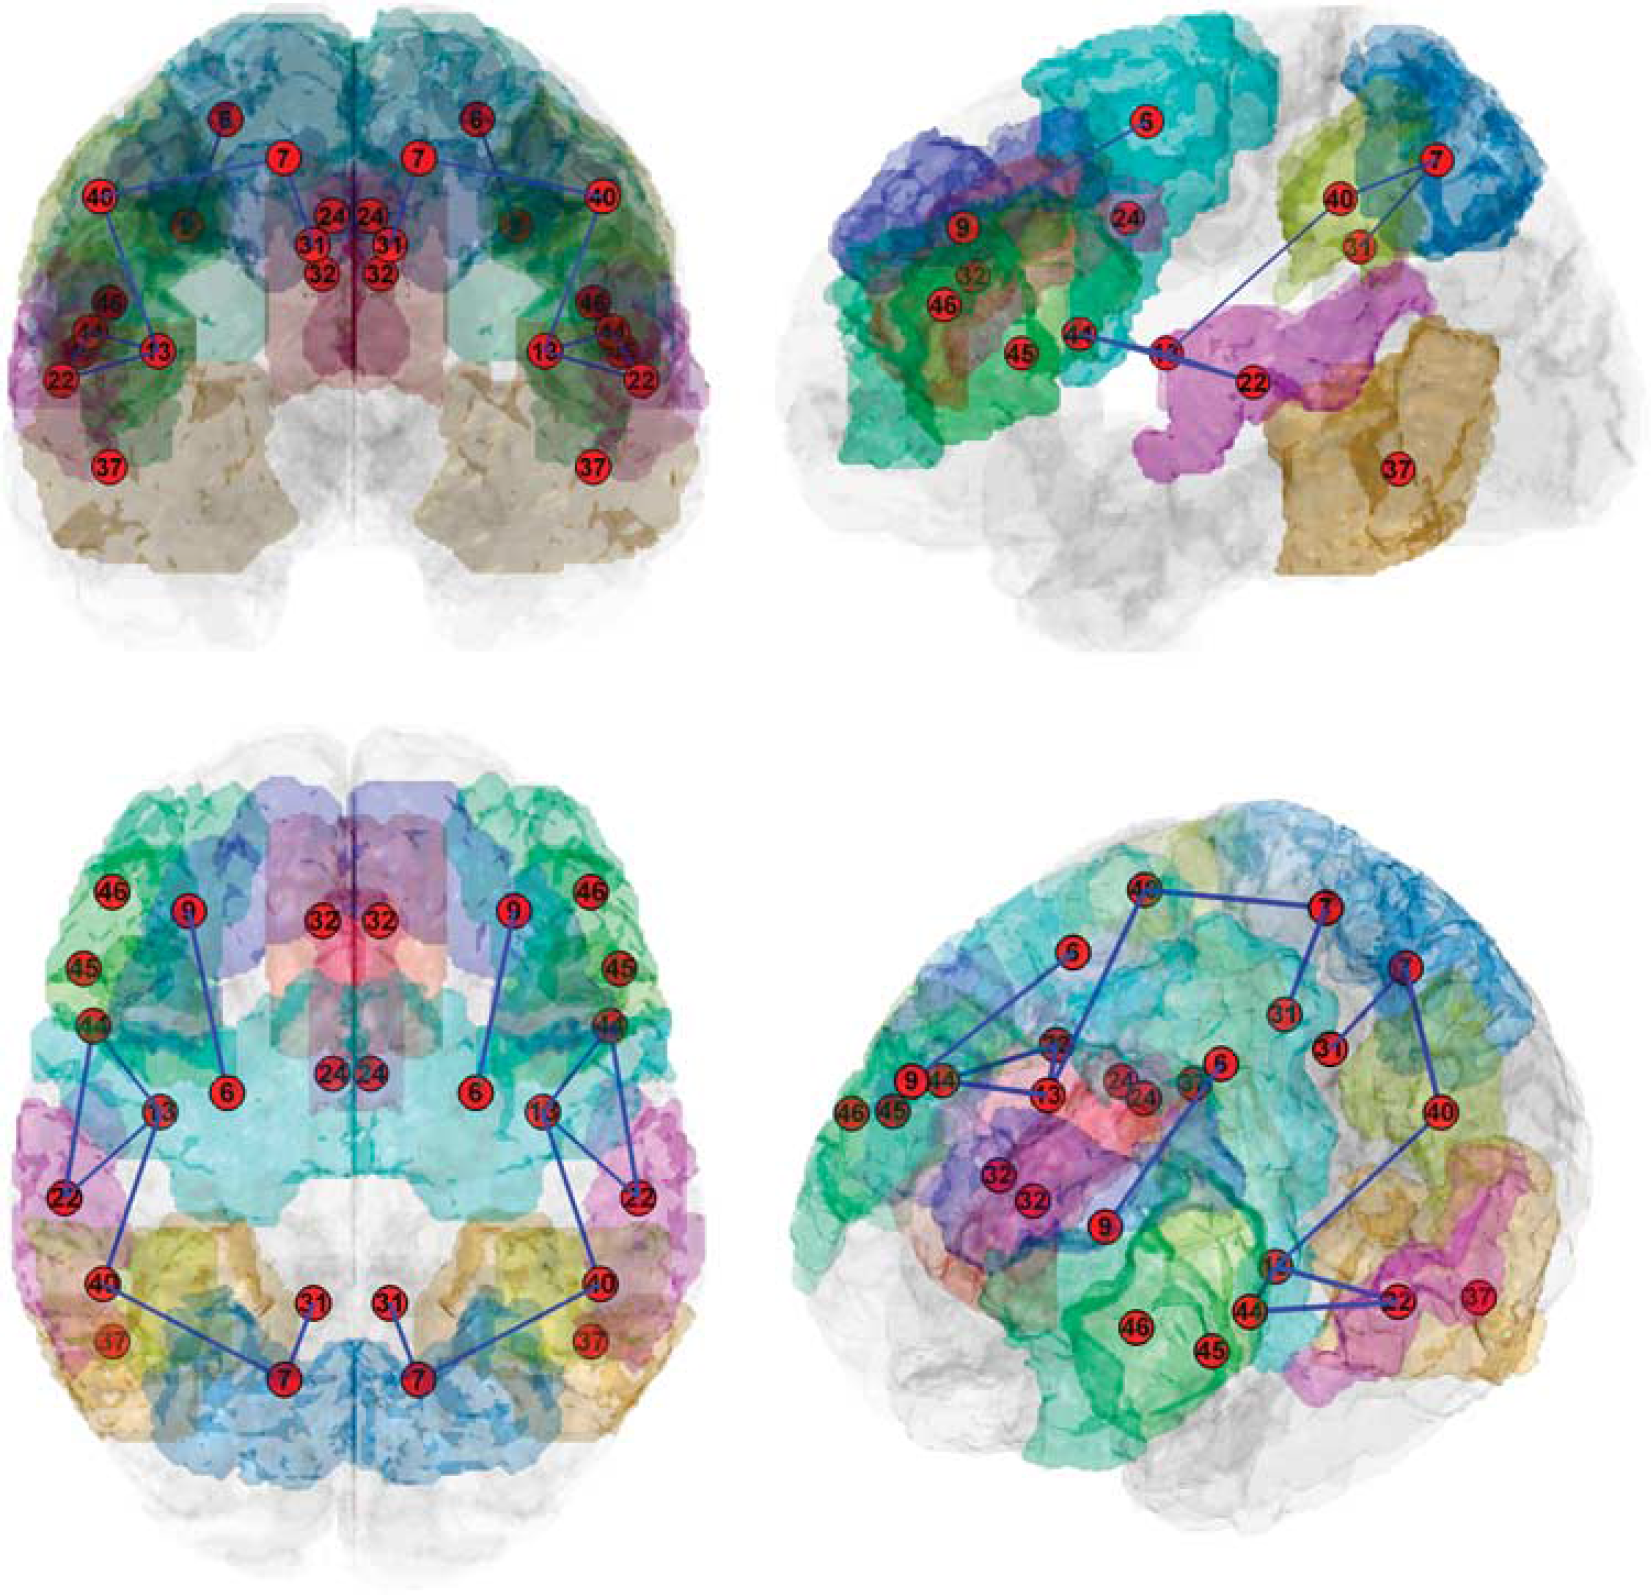
The connectivity structure is overlaid onto a three-dimensionally rendered transparent cortex image in different projections. Nodes are located within corresponding Brodmann areas, which are differently colored for visualization. Blue lines are stable connections/edges.
Metabolic Connectivity Modeling
The SICE was used to identify metabolic connectivity structure of 13 BAs from the PET data of all 35 subjects. The method of SICE has been validated previously; 12 mathematical details are reported in the Supplementary Material. The output of SICE is a graph in which BAs are represented by nodes and the existence of connectivity between two nodes is represented by an edge. No edge between two BAs does not necessarily mean no connectivity. Rather, it suggests that two BAs do not have a robust connectivity that can be confirmed by limited samples. An edge between two nodes as identified by SICE corresponds to a significant partial correlation between two nodes, i.e., after factoring out the effect of other nodes on this correlation.
Given that all individuals were young healthy subjects, we assumed the same network structure (i.e., the same graph) in all subjects. However, we anticipated that the strength of the edges may differ between the low and high-performance groups. To estimate the strength of edges in the graph generated by SICE, a constrained optimization algorithm 13 was applied (see Supplementary Material for details). The algorithm works by taking the graph structure, i.e., existence/non-existence of an edge between each pair of nodes as a constraint, and iteratively producing a maximum likelihood estimate for the strength of edges. Finally, the Wilcoxon signed-rank test was applied to compare the average strength of edges between the high and low-performance groups.
To link to our previous work, 10 we included two original clusters from that study, the posterior cingulate and prefrontal regions, as additional nodes in the present SICE. To address the issue of specificity, we in a separate analysis included two regions of no interest, the vermis and crus of the cerebellum from the WFU PickAtlas.
As methodological reference, we applied the conventional region-based approach. Specifically, regional values from 13 BAs that were used for SICE were compared between the groups using a two-sample t-test.
RESULTS
The connectivity graph from 35 subjects/images is depicted in Figures 1 and 2. The graph shows seven statistically robust edges. Six edges form a network consisting of BAs 7, 13, 22, 31, 40, and 44. The average strength of edges within this network was significantly higher in the high-than in the low-performance group (P = 0.016). The strength of single edges as estimated by the constrained optimization algorithm is depicted in Figure 1. The edge BAs 6-9 that were not connected to this network had lower strength in the high-performance group.
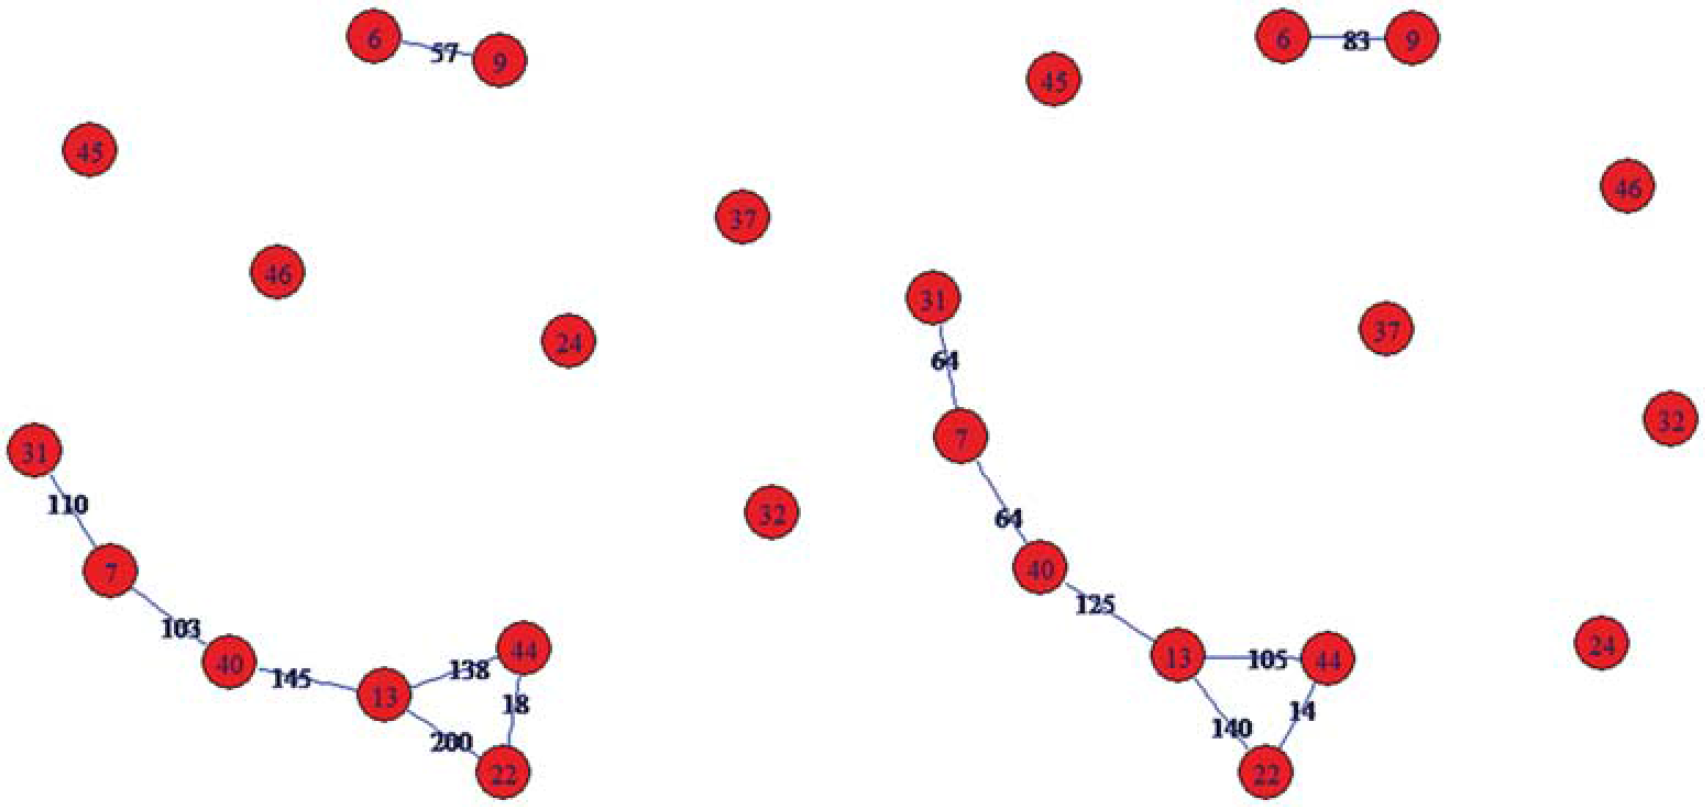
The connectivity structure identified by SICE based on the data of 35 subjects. Nodes are Brodmann areas. Blue lines are stable connections/edges. Numbers over edges indicate their strength, for high (left) and low (right) performance group. SICE, sparse inverse covariance estimation.
In the additional analysis with 15 regions, i.e., 13 BAs plus two DMN nodes, SICE did not reveal stable connectivity between two DMN nodes, as well as between the DMN nodes and 13 BAs. This was also the case for the analysis with two cerebellar regions.
The conventional region-based approach did not reveal any difference between the groups (P = 0.51-0.84, uncorrected). This observation is consistent with a previously reported whole-brain voxel-wise analysis in the same groups. 10
DISCUSSION
In the present study, we searched for network correlates of healthy verbal WM in resting state FDG-PET data. Metabolic connectivity in a network of several WM-relevant BAs was found to be stronger in young healthy subjects with above-median memory performance. Of note, the groups did not differ in respect to regional intensity measurements, i.e., metabolism. To our knowledge, this is the first study, addressing network correlates of cognitive function in resting state PET data. The results encourage examination of (inverse) covariance patterns in FDG-PET data from non-neurodegenerative populations.
Perhaps the most intuitive measure for connectivity of brain regions is the covariance or correlation matrix, I. Covariance/correlation-based connectivity modeling has been successfully applied in recent PET studies. Thus, Lee et al. 8 established normative findings of voxel-wise interregional metabolic correlations. Others examined gender differences in metabolic networks 7 and voxel-wise interrelationships of neurotransmitter systems. 14 Valuable insights into aberrant metabolic connectivity have been provided by studies in Alzheimer's disease.15–17 However, covariance/correlation captures only pairwise information, whereas impact of brain regions beyond a given correlation is not taken into account. Indeed, natural neural networks represent dynamic systems of interacting regions. Thus, through adjustment for other correlations within a potential network, a more correct estimation can be reached. 18 Although simulations on PET data do not exist, fMRI studies found partial correlations to be more accurate in detecting network connections than bivariate ones. 19 Factoring out the contribution from other regions is reached in SICE in a straightforward way via inversion of the covariance matrix, Σ-1.
Another advantage of the applied connectivity modeling approach is its robustness to small sample sizes. ‘Small’ means that the sample size may be close to or even smaller than the number of regions.20,21 To estimate Σ-1, a naive approach is to compute the sample covariance/correlation matrix
As discussed in detail elsewhere,23,24 increasing evidence from fMRI research suggests that WM performance may be mediated by functional connectivity of both task-negative networks, such as DMN and task-positive networks. The specificity of this relationship with respect to the material type (i.e., object, spatial, verbal) and degree of executive function involved (i.e., with executive processing or storage only) is not yet known. Recently, we found support for the functional role of the DMN, a network that is deactivated during attention-demanding tasks, in verbal WM. 10 Here, we focused on task-positive regions, i.e., regions that are activated by a verbal WM task. 9 Under such conditions, the two previously reported DMN clusters were not identified as part of the (in nature task-positive) network of six BAs. In statistical terms, the partial correlation of these nodes was not as robust as the partial correlations between six BAs. Given that these networks belong to two different, in part, antagonistic, functional brain systems,23,25 this observation is not unexpected.
In the current study, we included only regions that are known to be relevant for verbal WM according to a meta-analysis. Thus, the choice of the regions was unbiased. Still, we admit that this study design underestimates the complexity of neuronal/network substrates of WM. Working memory as a complex neuropsychological domain is likely to be mediated by interplay of networks, e.g., the DMN and task-positive networks, as mentioned above. Besides, a stronger cognitive function may well be related to weaker connectivity between certain regions/networks. Indeed, we observed one edge with a weaker connection in the high-performance group. Yet, the aim of this basically proof-of-principle study was to test whether connectivity modeling of PET data can provide network correlates of normal cognitive function. No doubt, however, that the rapidly developing field of connectivity modeling may soon offer tools to investigate network interactions in PET data.
Cortical glucose metabolism is known to be reduced in healthy aging and especially in neurodegenerative dementing disorders,26,27 currently target populations for FDG-PET. For consistency with our previous multi-center studies in aged11,28 as well as in young healthy subjects, 10 intensity normalization to the pons was adopted in the present work. Although there are a number of PET studies on the choice of the reference region in univariate analyses,29–33 little is known about the impact of intensity normalization on results of multivariate analyses. 34 This important issue should be addressed by future studies.
As for now, one can only speculate about the functional meaning of the identified network. It is remarkable, however, that BAs found to be connected are not localized to a certain lobe, but are distributed between the parietal (BAs 7, 31, 40), temporal (BA 22), frontal (BA 44) lobes, and the insula (BA 13). It seems plausible that BAs within the parietal lobe are connected to each other, rather than are dispersed between other nodes. In addition, BA 13 was found to be connected to all three brain lobes, consistent with the anatomy and integral role of the insula in functional systems. 35 Future PET studies, in combination with other imaging modalities, such as diffusion tensor imaging and fMRI, will elucidate relationships between different connectivity measurements.
The current approach can be extended in several ways. First, although here we applied SICE at the group level, the method can be used at the individual subject level, 12 favoring its application in, e.g., differential diagnosis of clinical entities. Second, because of the nature of the penalized formulation as discussed above, SICE can potentially be used for high-dimensional connectivity modeling, e.g., on a voxel basis, although larger samples (n>200) would be necessary. In addition, an assumption that nodes follow multivariate normal distribution would need to be proved. Finally, the approach can be applied to data from other imaging modalities, where one image per subject is available, e.g., structural MRI.
DISCLOSURE/CONFLICT OF INTEREST
The authors declare no conflict of interest.
Footnotes
References
Supplementary Material
Please find the following supplemental material available below.
For Open Access articles published under a Creative Commons License, all supplemental material carries the same license as the article it is associated with.
For non-Open Access articles published, all supplemental material carries a non-exclusive license, and permission requests for re-use of supplemental material or any part of supplemental material shall be sent directly to the copyright owner as specified in the copyright notice associated with the article.