
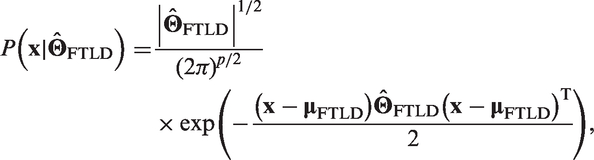
Abstract
Presently, visual and quantitative approaches for image-supported diagnosis of dementing disorders rely on regional intensity rather than on connectivity measurements. Here, we test metabolic connectivity for differentiation between Alzheimer’s disease and frontotemporal lobar degeneration. Positron emission tomography with 18F-fluorodeoxyglucose was conducted in 47 patients with mild Alzheimer’s disease, 52 patients with mild frontotemporal lobar degeneration, and 45 healthy elderly subjects. Sparse inverse covariance estimation and selection were used to identify patterns of metabolic, inter-subject covariance on the basis of 60 regional values. Relative to healthy subjects, significantly more pathological within-lobe connections were found in the parietal lobe of patients with Alzheimer’s disease, and in the frontal and temporal lobes of subjects with frontotemporal lobar degeneration. Relative to the frontotemporal lobar degeneration group, more pathological connections between the parietal and temporal lobe were found in the Alzheimer’s disease group. The obtained connectivity patterns differentiated between two patients groups with an overall accuracy of 83%. Linear discriminant analysis and univariate methods provided an accuracy of 74% and 69%, respectively. There are characteristic patterns of abnormal metabolic connectivity in mild Alzheimer’s disease and frontotemporal lobar degeneration. Such patterns can be utilized for single-subject analyses and might be more accurate in the differential diagnosis of dementing disorders than traditional intensity-based analyses.
Keywords
Introduction
There is increasing evidence that neurodegenerative dementias represent diseases of neural networks, with distinct patterns of disconnection being found in different dementing disorders. 1 Thus, damage to specific neural tracts was reported in Alzheimer’s disease (AD) and frontotemporal dementia (FTD), 2 two most common types of presenile dementia. Similarly, functional magnetic resonance imaging (fMRI) studies have pronounced divergent changes in resting state networks between AD and FTD. 3 So far, however, the connectivity information has not been tested for purposes of differential diagnosis.
Positron emission tomography with 18F-fluorodeoxyglucose (FDG-PET) is a well-established tool for early and differential diagnosis of dementia. 4 Thus, dementia due to AD and frontotemporal lobar degeneration (FTLD) could be differentiated by means of FDG-PET with a high accuracy.5,6 In this context, both visual and quantitative analysis of PET images relies on identification of a characteristic spatial pattern of hypometabolism. These methods take into account intensity, or magnitude, of regional FDG-PET measurements, while information about interregional covariance is not considered.
In accord with growing interest in research on brain connectivity, recent studies have addressed the issue of covariance, or functional connectivity, 7 in FDG-PET data. To distinguish from functional connectivity as quantified with fMRI, hereafter we use the term “metabolic connectivity.” 8 Thus, plausible patterns of inter-subject metabolic covariance have been reported in healthy individuals.9–11 More relevant from the clinical perspective, a few recent FDG-PET studies have consistently reported abnormalities in metabolic covariance in patients with mild cognitive impairment (MCI)12–14 and dementia due to AD.13,15 Yet, none of the studies above addressed individual subject analysis, a prerequisite for clinical applications.
Thus, the aim of the present work was to explore the value of metabolic connectivity in the differential diagnosis of mild AD and FTLD. To this end, we applied connectivity modeling in the form of sparse inverse covariance estimation (SICE) and selection (SICS).
Materials and methods
Subjects
Demographic characteristics.
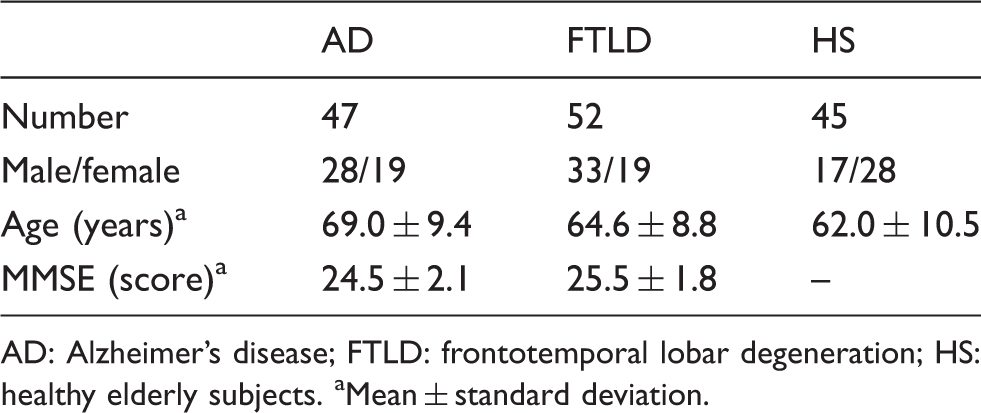
AD: Alzheimer’s disease; FTLD: frontotemporal lobar degeneration; HS: healthy elderly subjects.
Mean ± standard deviation.
This study was carried out in accordance with the latest version of the Declaration of Helsinki after the consent procedures had been approved by the local ethics committee of the medical faculty at the Technische Universität München. Written informed consent to the study was obtained from HS. The patients gave oral informed consent, since the FDG-PET examination was a part of a diagnostic work-up for suspected neurodegenerative disorder.
PET data acquisition and preprocessing
VOI labels according to the AAL atlas.
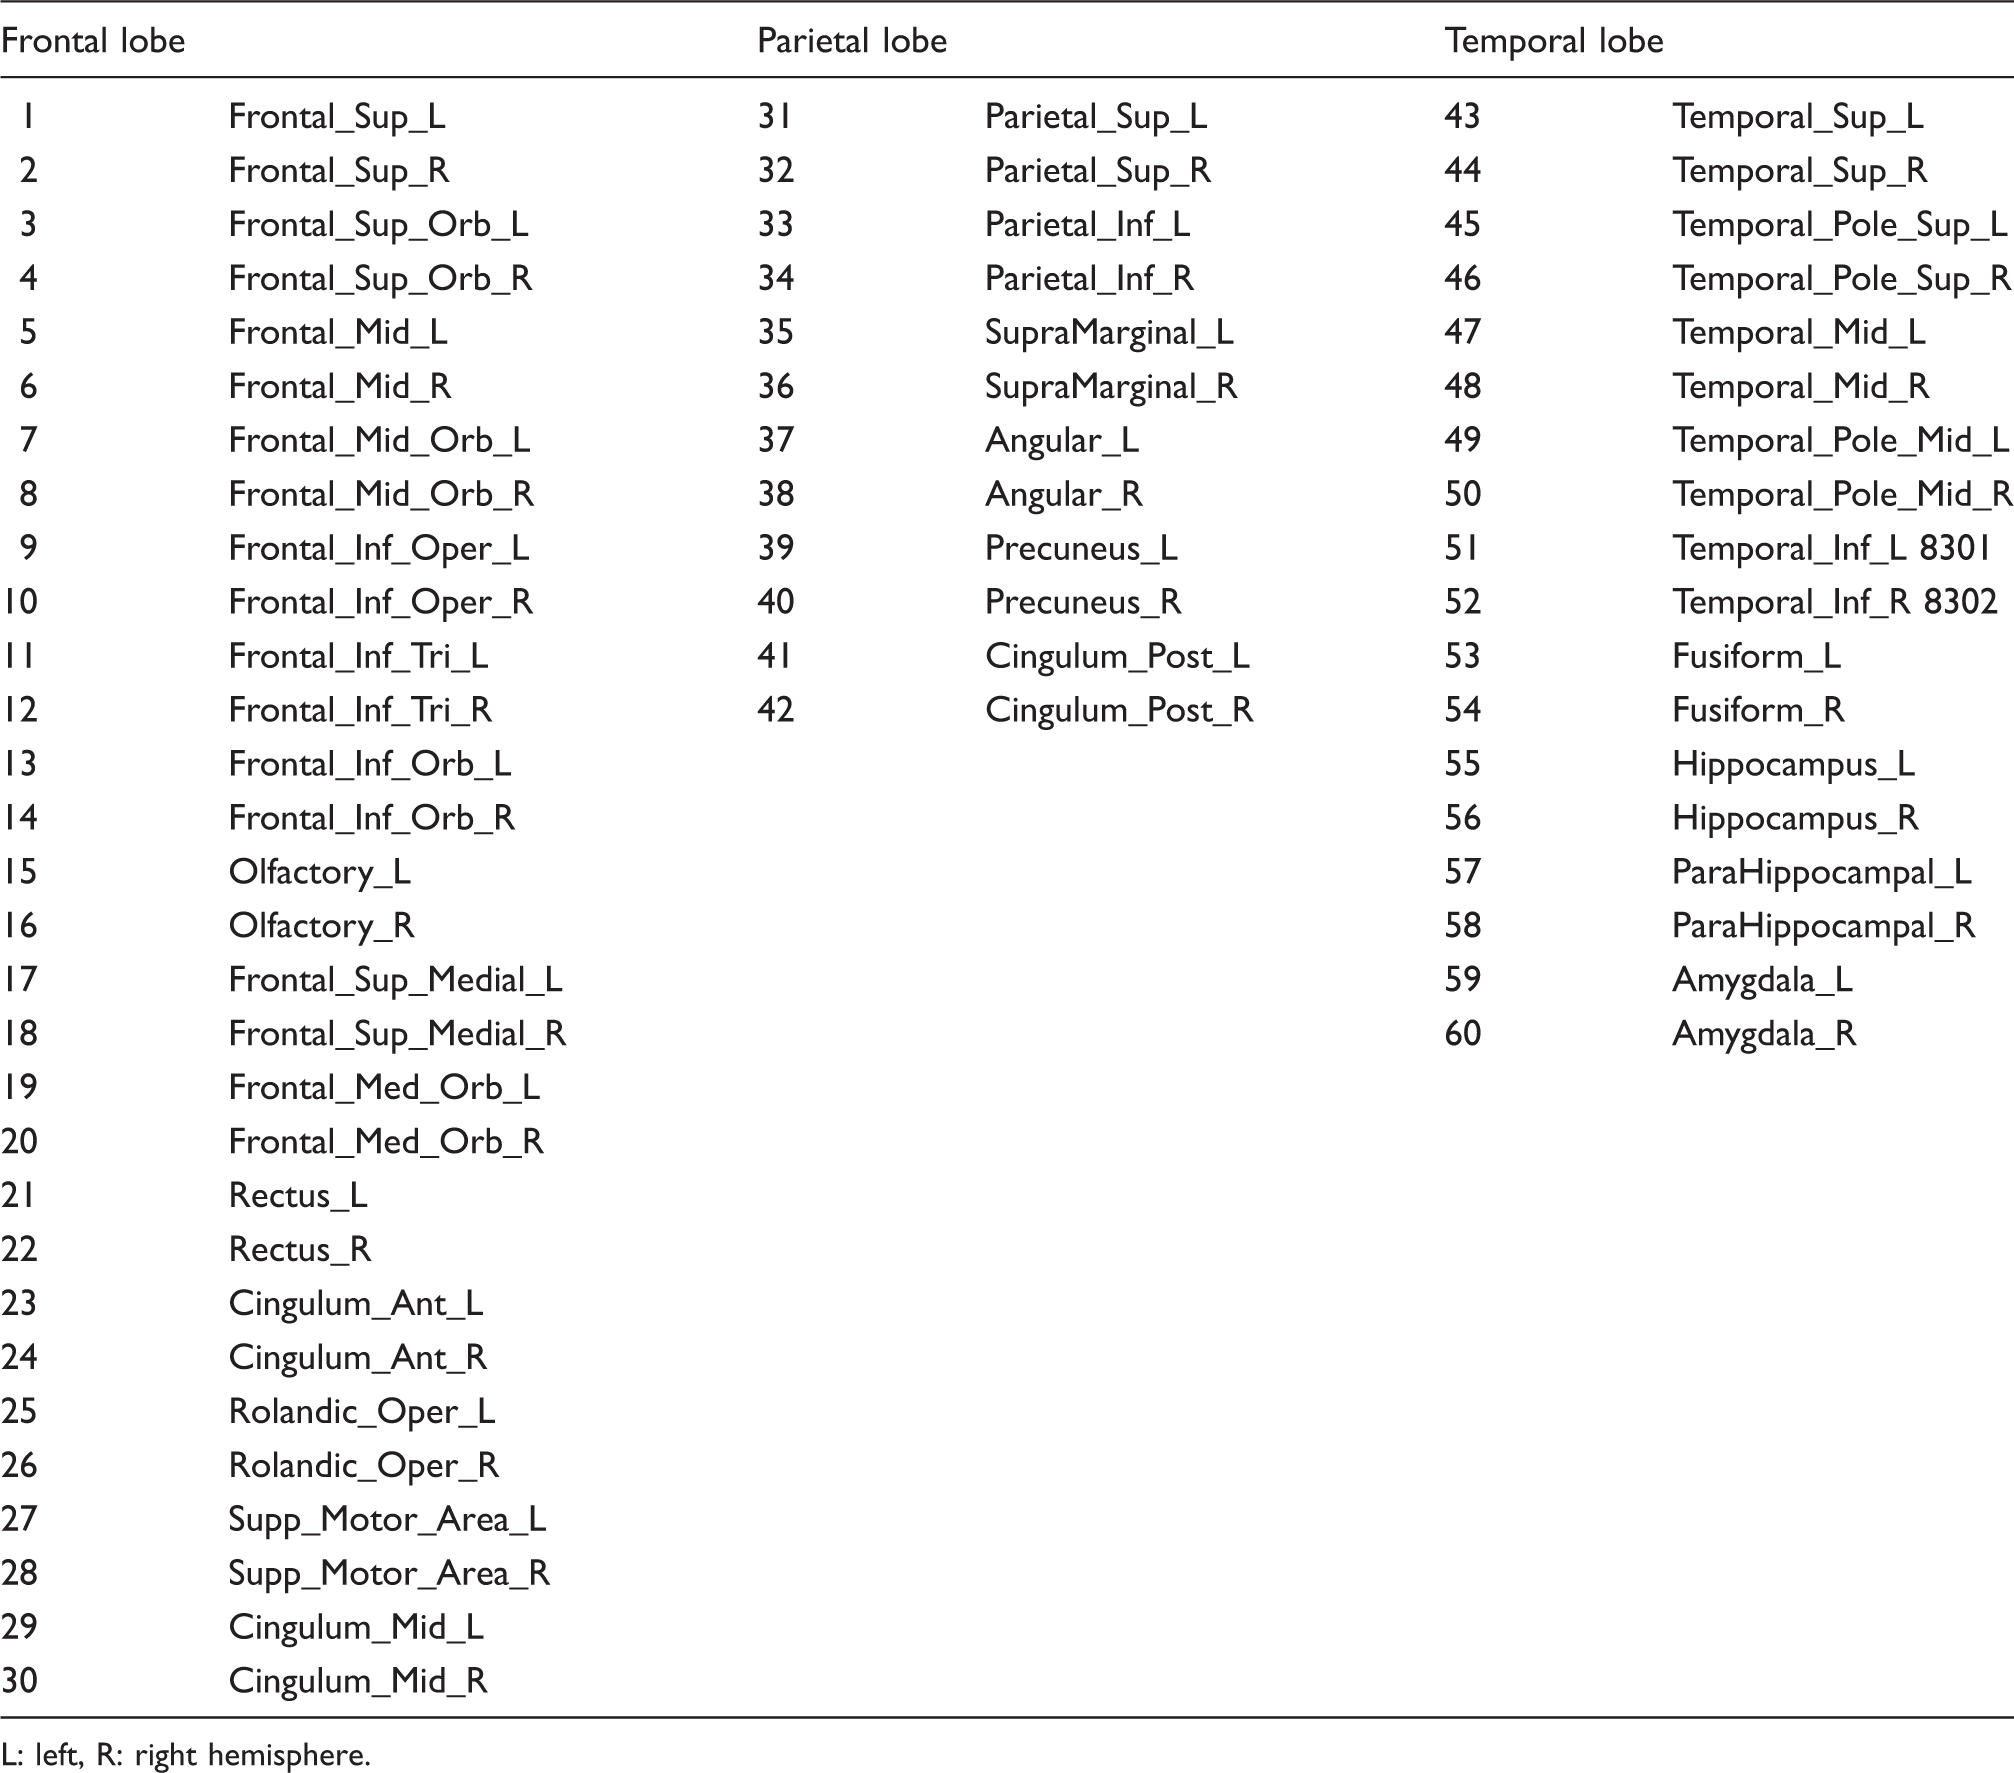
L: left, R: right hemisphere.
Metabolic connectivity pattern
We considered a dataset 
To overcome this limitation, i.e. to estimate magnitudes of non-zero entries, we applied a constrained optimization algorithm
26
that fits the covariance to the predefined sparse binary structure of the estimated IC matrix. This procedure was denoted as SICS. SICS uses the principle of parsimony in parametric model fitting, and estimates covariance according to maximum entropy, maximum likelihood, existence and uniqueness. An example of the metabolic connectivity pattern Metabolic connectivity pattern 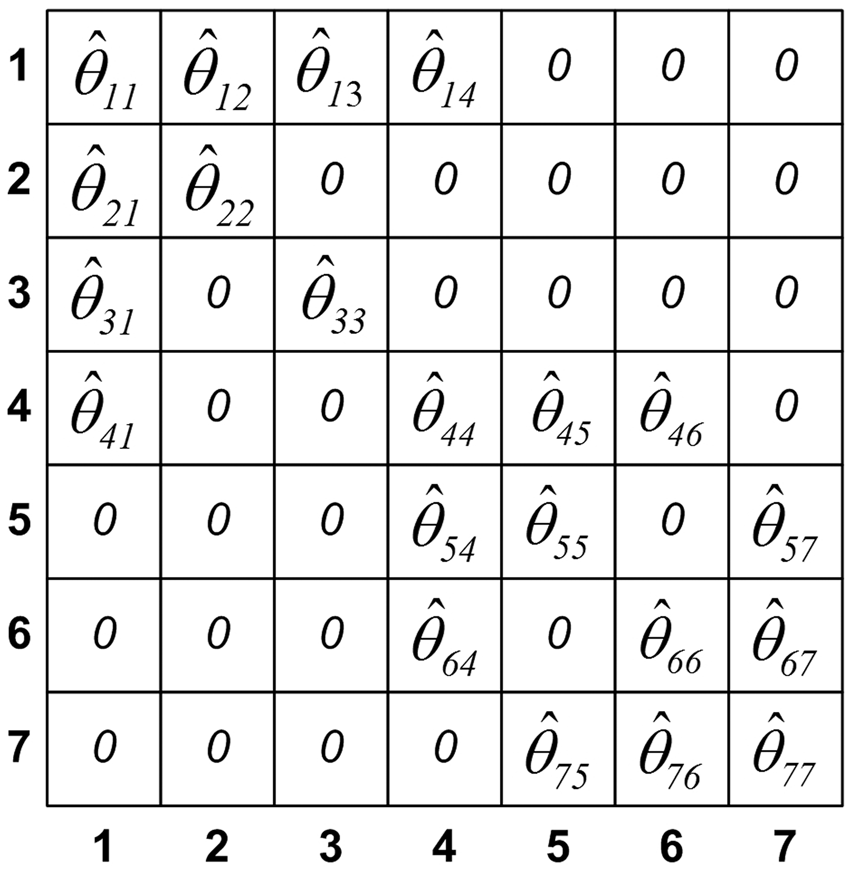
Metabolic correlation network is modeled from the sparse binary structure of the metabolic connectivity pattern Metabolic correlation network: matrix representation (a), graph representation (b). Numbers 1–7 that denote rows and columns in the matrix representation and nodes in the graph representation correspond to the one from the p = 7 regions. Elements in the matrix representation and edges in the graph representation denote estimated correlation coefficients between connected regions.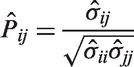
Metabolic differentiation pattern
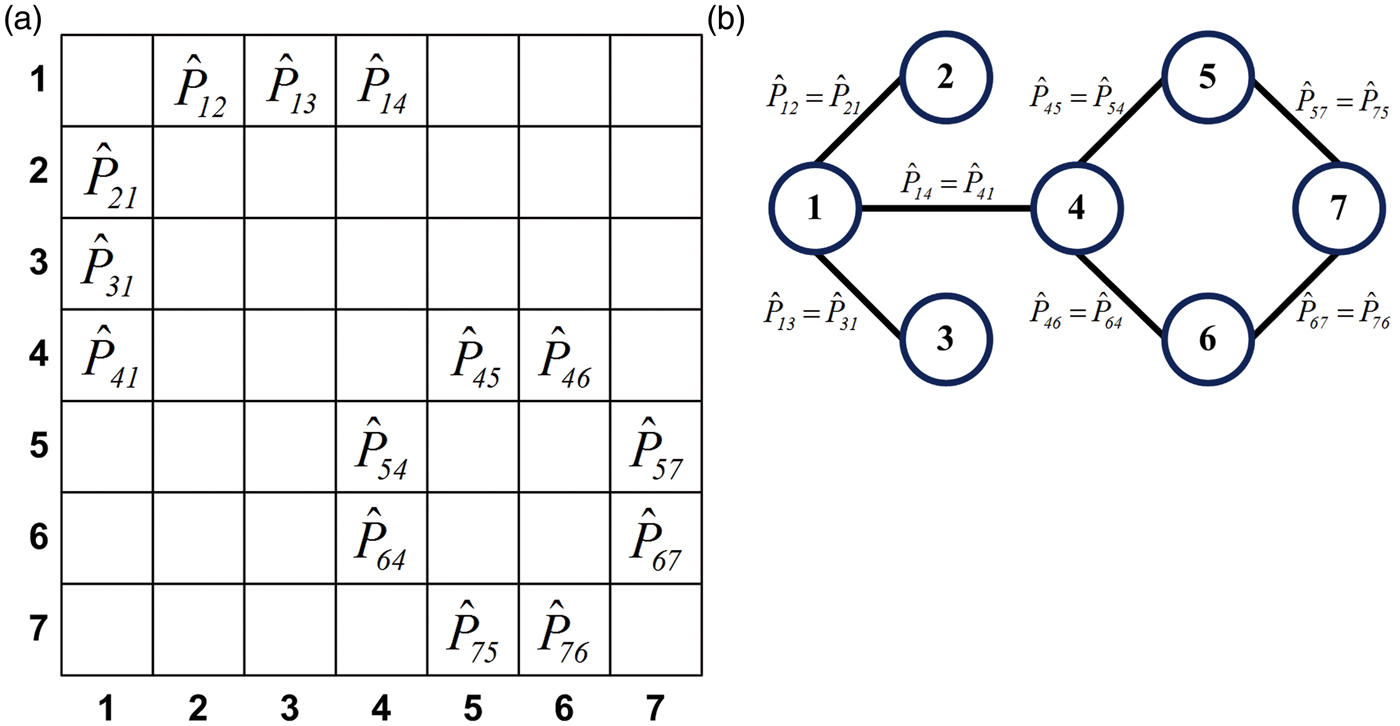
To characterize pathological changes in metabolic connectivity patterns and corresponding metabolic correlation networks of the AD and FTLD groups, we applied the algorithm presented in Figure 3. The null-hypothesis H0 stated that there was no pairwise difference between correlations Calculation of the metabolic differentiation pattern in the AD group; magenta and green cells denote pathological (i.e. significantly altered) and healthy connections (correlations), respectively.
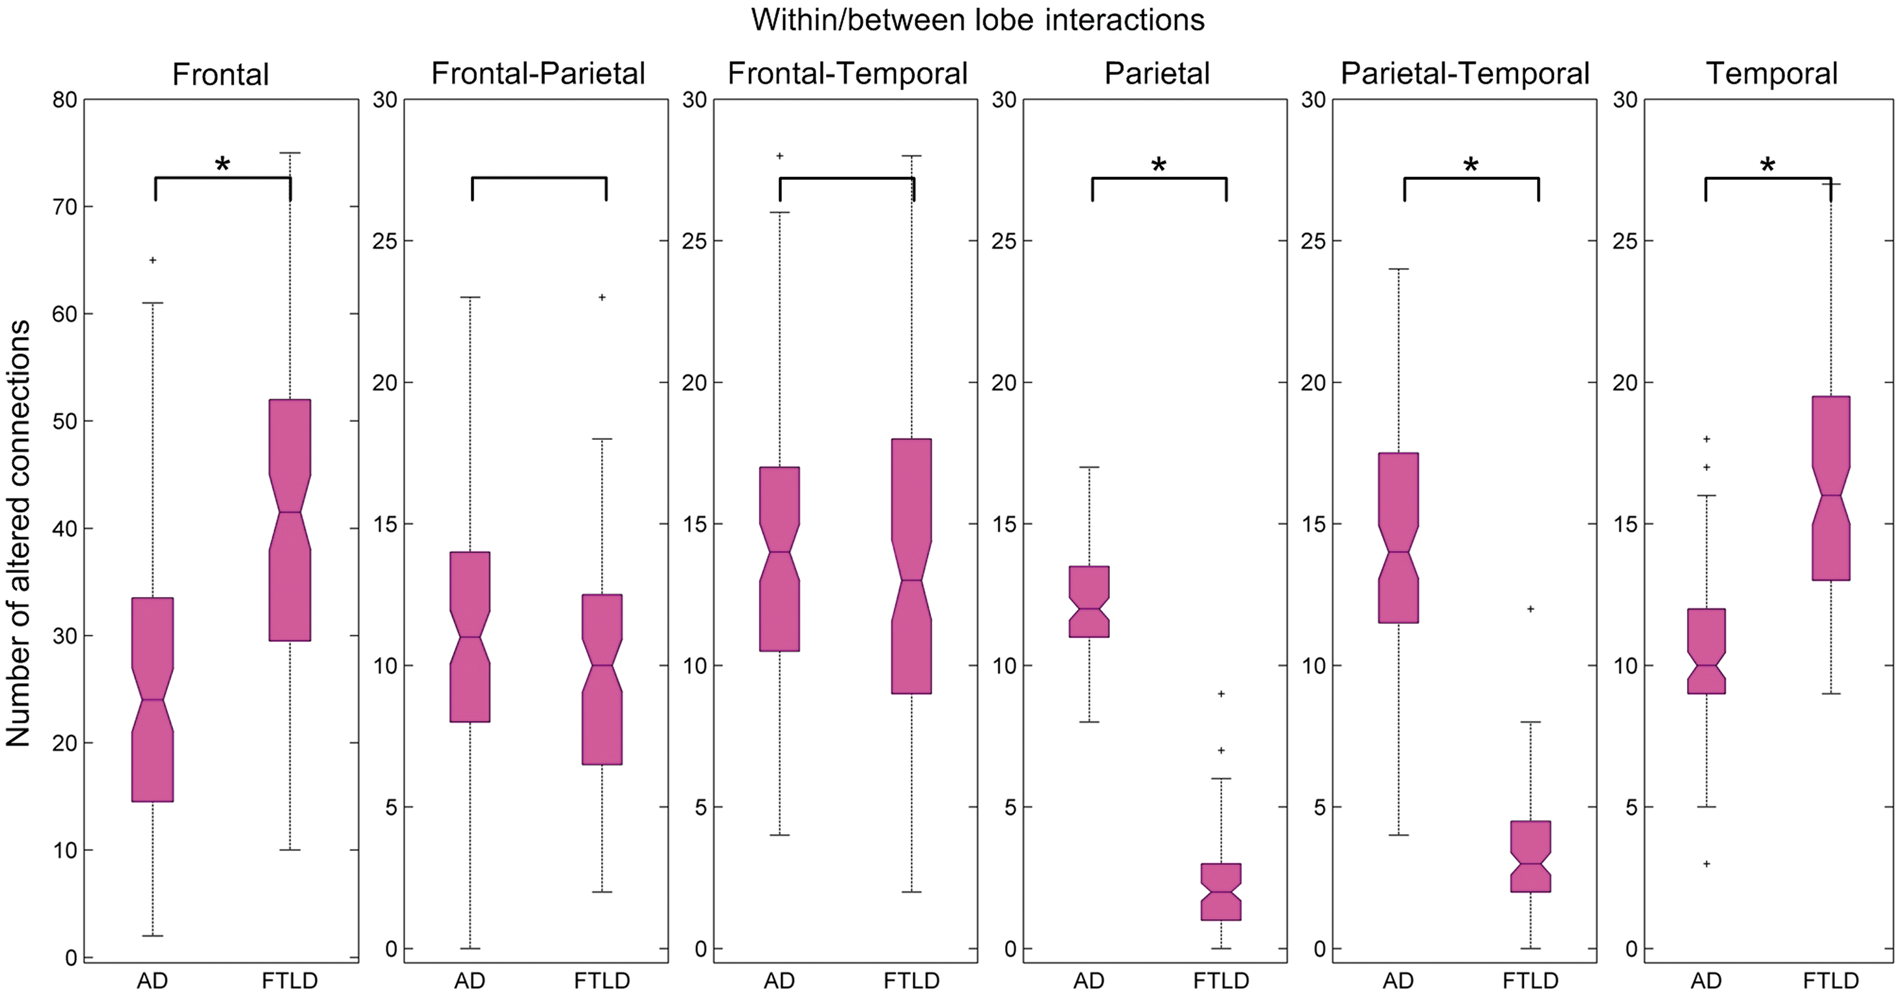
In addition, we counted the number of pathologically altered connections within and between lobes. Permutation tests with replacement 28 were performed in each group. Finally, a two-sample t-test was applied for hypothesis testing. We accepted the null-hypothesis H0 that the number of connections for the group 1 (AD) is equal to their number for the group 2 (FTLD): n1 ij = n2 ij , where i and j are the one of the lobes (frontal, parietal, or temporal). The alternative hypothesis H1 was n1 ij ≠ n2 ij . Computed p-values were adjusted for multiple tests by FDR.
Single-subject analysis
Here, metabolic connectivity pattern 
The new subject
Reference methods
Diagnostic performance of the present methodology was compared with that of a widely used multivariate method such as linear discriminant analysis (LDA)3,6,29 and with a straightforward univariate method based on the t-test.
30
In LDA, covariance was estimated using MLE. In the univariate method, the region with the largest difference between two groups was used for differentiation.
30
In addition, we performed SICE alone
15
and a regression tree.31–33 The former was conducted on the analogy of Huang et al.
15
with a difference that the regularization parameter
The same data were used as input to all statistical analyses. In all analyses leave-one-out cross-validation was applied.
Results
Metabolic differentiation patterns are presented in Figures 4 and 5. A pathological metabolic connection indicates that the correlation between two given regions significantly (p < 0.01 FDR corrected) differs from the same correlation in the HS group. In the AD group, pathologically altered were on average 6%, 60%, and 27% of connections within the frontal, parietal, and temporal lobe, respectively. In the FTLD group, corresponding values were 22%, 0%, and 52%. Distribution of abnormal connections within and between lobes is presented in Figure 6. Relative to the HS group, more pathological within-lobe connections were found in the parietal lobe of AD subjects, while in the frontal and temporal lobes of FTLD subjects (p < 0.01 FDR corrected). In addition, more pathological connections between the parietal and temporal lobe were found in the AD relative to FTLD group (p < 0.01 FDR corrected).
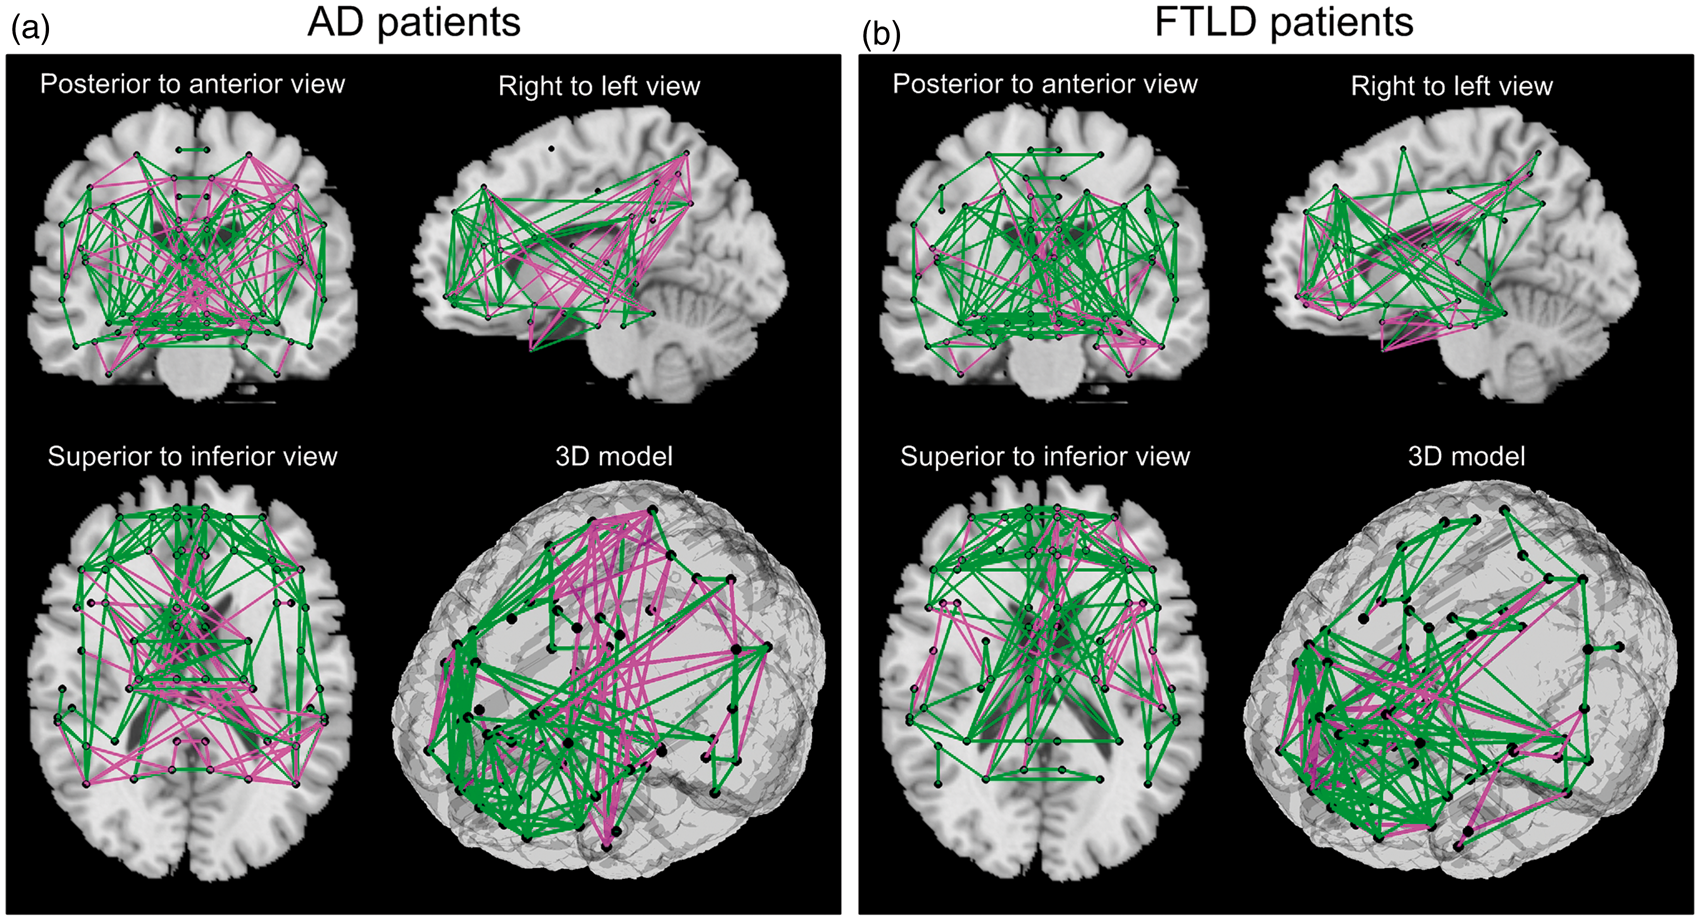
Metabolic differentiation patterns for AD, FTLD, and HS groups in matrix representation with a sparsity level of 0.1, i.e. 10% of all entries are considered for sparse estimation of IC matrix. Each row (column) in the matrix corresponds to one of the 60 VOIs. A colored cell corresponds to an edge, i.e. to a metabolic connection between two VOIs. Each matrix contains internally three highlighted black squares that denote brain lobes. Magenta and green cells denote pathological (i.e. significantly altered) and healthy connections (correlations), respectively. Metabolic differentiation patterns for AD (a) and FTLD (b) groups with a sparsity level of 0.1 is overlaid onto a standard MRI brain template. Altered metabolic connections are represented by magenta lines, healthy connections – by green lines, and centers of VOIs – by black dots. Distribution of pathological metabolic connections as presented by box-plots. A star (*) denotes a significant difference in the number of pathological connections between the AD and FTLD groups (p < 0.01 FDR corrected).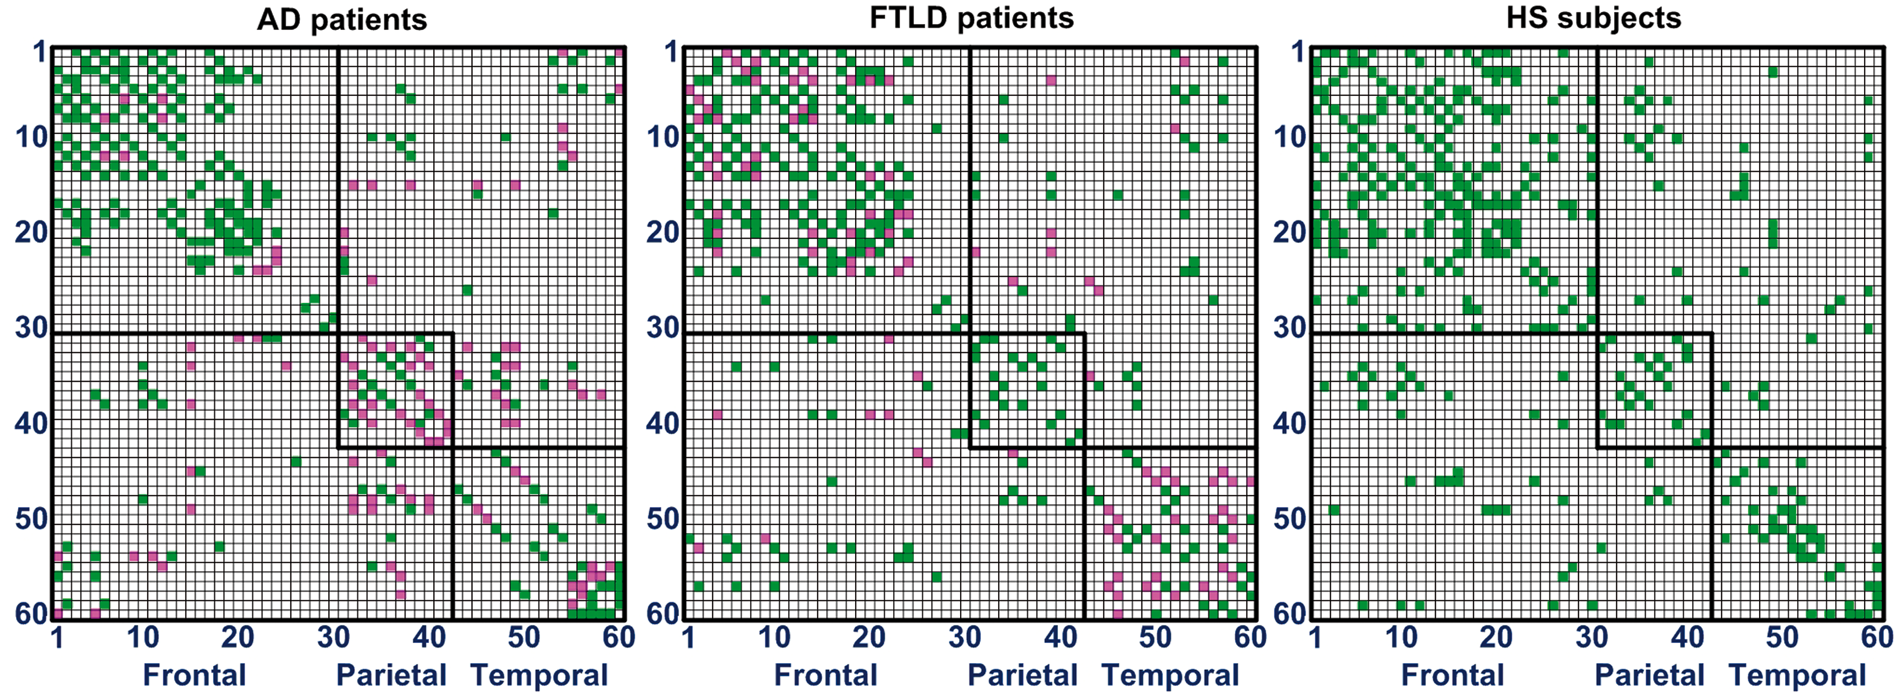
Differentiation between the groups using three methods.
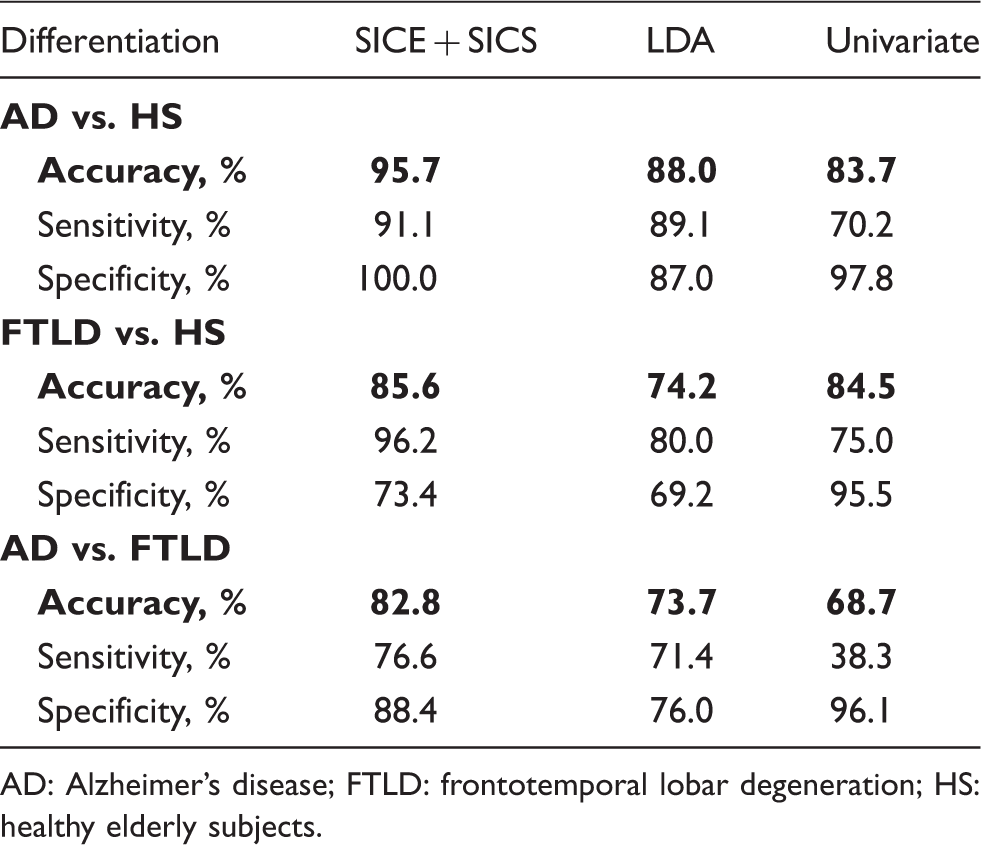
AD: Alzheimer’s disease; FTLD: frontotemporal lobar degeneration; HS: healthy elderly subjects.
Discussion
Here, we report an optimized methodological approach for modeling metabolic connectivity at a group level, with a subsequent single-subject analysis. This covariance-based method was applied to differentiate between patients with mild AD and FTLD. Characteristic patterns of abnormal metabolic connectivity were found in both clinical entities. The proposed approach enabled a more accurate differentiation between two groups of patients than common uni- and multivariate methods.
So far, very few studies have examined metabolic connectivity/covariance in AD and none in FTLD. Morbelli et al. 12 reported reduced correlations of a cluster of AD-typical hypometabolism, prefrontal cortex, and hippocampus in probable AD. A voxel-wise seed-based method was adopted by Carbonell et al. 14 They found aberrant metabolic connectivity in ß-amyloid-positive subjects with MCI. Similar to our study, Sanabria-Diaz et al. 13 applied brain parcellation into a number of anatomical regions followed by construction of a metabolic connectivity pattern. The researchers revealed aberrant global and local network properties in patients with probable AD and MCI. Yet, the applied approaches do not allow individual subjects analyses as those required in clinical settings. We are aware of only one study that has tested the value of metabolic connectivity at a single-subject basis. 15 Using SICE, the authors could differentiate patients with probable AD from healthy subjects with a reasonable accuracy. Their approach provided a binary matrix, thus being insensitive to continuous changes in metabolic connectivity. To estimate magnitudes of non-zero entries in the IC matrix, we applied SICS. This method has been successfully utilized in the field of fMRI, 34 but so far it has not been adopted for PET image analyses. Of note, SICS (following SICE) allowed estimation of differences in metabolic connectivity strength and improved accuracy of differentiation between the groups. As compared to Huang et al. 15 we in addition applied an algorithm for optimal selection of the regularization parameter λ instead of its simple fixation. Not unexpectedly, higher (96% vs. 88%) accuracy of differentiation between patients with AD and healthy subjects was achieved in the present study, although more severely affected patients were included in Huang et al. 15
Using the proposed approach, we found altered within-lobe connections to be distributed according to the known pattern of regional involvement. That is, pathological connections were most numerous in the parietal lobe in AD, while in the frontal and temporal lobes in FTLD. In a comparison between the patients groups, more altered within-lobe frontal and temporal connections were found in FTLD, in line with a more pronounced hypometabolism in this clinical entity.35,36 Intriguing results were obtained by analyses of between-lobe connections. Whereas the number of abnormal frontoparietal and frontotemporal connections did not differ between AD and FTLD, significantly more abnormal parietotemporal connections were found in AD. In accord with this observation, integrity of the descending cingulate bundle, a major white matter tract connecting the medial parietal and temporal lobes, 37 was found to be more severely affected in AD than in FTLD, with the difference being non-significant though. 2
As major focus of this study, we tested the proposed covariance-based sparse approach for purposes of differential diagnosis at a single subject level. The method achieved accuracy of 83% in discrimination between mild AD and FTLD. As expected, higher accuracy was found in discrimination of patients from healthy subjects, i.e. 96% for AD and 86% for FTLD. Overall, these results are comparable with previous FDG-PET studies.5,6,38 Given a high heterogeneity in study design and methodology, a numerical comparison with the literature would be inappropriate. For instance, an important feature of our work is very mild disease severity. That is, in the studies reported so far, the range of the mean MMSE scores was 14.0–22.3 and 15.5–22.5 points for AD and FTLD populations, respectively (compare with 24.5 and 25.5 points in our study). Hence, we confronted these results with established quantitative methods such as univariate analysis and LDA. The proposed approach outperformed both methods. Indeed, as compared with the univariate analysis, the proposed algorithm considers not only information about regional intensity but mainly covariance information. In terms of SICE, the regional information is represented by the estimated vector of mean regional intensities, while covariance information by the estimated IC matrix. Whereas LDA can also be regarded as covariance method, it involves MLE. As in detail described in Materials and methods section and in supplementary material, reliable MLE requires the data sample size n to be substantially larger than the number of variables p, in our case VOIs, i.e.
Visual image rating in clinical routine is supported by univariate techniques as implemented in popular image analysis tools like NEUROSTAT/3D-SSP (http://128.208.140.75/∼Download) and SPM (http://www.fil.ion.ucl.ac.uk/spm). Although the power of multivariate techniques in research settings is well established, their application in the daily routine has been problematic. So far, one group of studies has segmented whole brain glucose metabolism into implicit clusters using principal or independent component analysis, followed by MLE of covariance.40–42 The analysis of only a few main components allows avoiding large errors in covariance estimation when applied to limited PET samples. However, the resultant clusters do typically not correspond to anatomical regions, limiting interpretation and consequently, clinical application. In another group of studies like in our one, the brain is partitioned into explicit regions, i.e. anatomical structures according to various brain atlases.8,43 Here, the number of employed VOIs is usually larger than the number of available PET images, precluding accurate MLE of covariance. Therefore, these studies are limited to (explorative) correlation analyses. In contrast and as mentioned above, the method applied in the current study is robust to small sample sizes. In addition, the approach generates a metabolic differentiation pattern in the form of a color map that is based on proper anatomical regions (Figure 4). These advantages favor testing this method in clinical settings.
As a major study limitation, we defined pathological connections as correlations whose strength was significantly different from that in the healthy state. Such definition corresponds to the nature of the connectivity pattern, which captures the relationships as a whole, i.e. pattern, and does not discriminate between stronger/weaker covariance/correlations. Basically, such discrimination is possible, but more subjects (at least n > p) would be necessary for reliable estimation of the IC matrix with more elements. Future studies with larger datasets should explore the direction of changes in correlation strength. Further, to minimize inflated accuracy due to data overfitting, the robustness of classification was tested using a leave-one-out cross-validation. Although this technique is recommended for evaluating classifier performance with small samples, an independent dataset would allow a more robust validation. Yet, this limitation concerns to the same or similar extent all methods, such that the comparison between the methods should actually not be biased. Further, a detailed neuropsychological testing was not available for most HS. Consequently, we cannot exclude that some HS had very mild cognitive deficits that were not evident clinically and not perceived by subjects themselves. Thus, the provided specificity values might be underestimated. Finally, gender distribution differed between the patients (about 3/5 males) and healthy (about 2/5 males) groups. Hence, putative, gender-associated variations in brain glucose metabolism might have biased the results. Again, however, two last reservations apply to all statistical methods tested, not favoring the proposed approach.
Footnotes
Funding
The study was supported by the internal grant program for resident physicians (KKF, project number B23-13/8764179) at the Technische Universität München (IY).
Declaration of conflicting interests
The author(s) declared no potential conflicts of interest with respect to the research, authorship, and/or publication of this article.
Authors’ contributions
Design or conceptualization of the study: DT, KS, IY; Analysis or interpretation of the data: DT, KS, NZ, JL, IY; Drafting or revising the manuscript for intellectual content: all authors.
References
Supplementary Material
Please find the following supplemental material available below.
For Open Access articles published under a Creative Commons License, all supplemental material carries the same license as the article it is associated with.
For non-Open Access articles published, all supplemental material carries a non-exclusive license, and permission requests for re-use of supplemental material or any part of supplemental material shall be sent directly to the copyright owner as specified in the copyright notice associated with the article.