
Abstract
Delirium is a common, serious, yet poorly understood syndrome. Growing evidence suggests cerebral metabolism is fundamentally disturbed; however, it has not been investigated using 2-18F-fluoro-2-deoxyglucose (FDG) positron emission tomography (PET) in delirium. This prospective study thus explored FDG PET patterns of cerebral glucose metabolism in older inpatients with delirium. A particular emphasis was on the posterior cingulate cortex (PCC), a key region for attention, which is a central feature of delirium. Delirium scans were compared with post-delirium scans using visual analysis and semi-quantitative analysis with NeuroQ; 13 participants (8 female, median 84 y) were scanned during delirium, and 6 scanned again after resolution. On visual analysis, cortical hypometabolism was evident in all participants during delirium (13/13), and improved with delirium resolution (6/6). Using NeuroQ, glucose metabolism was higher post-delirium in the whole brain and bilateral PCC compared to during delirium (p < 0.05). Greater metabolism in both PCCs correlated with better performance on a neuropsychological test of attention, the WAIS-IV Digit Span Test forwards, and with shorter delirium duration. This research found widespread, reversible cortical hypometabolism during delirium and PCC hypometabolism was associated with inattention during delirium.
Keywords
Introduction
Delirium is a neuropsychiatric syndrome that remains so poorly understood that there are no licensed treatments for use in the wards or Emergency Departments, despite it being first described almost 2500 years ago. 1 Key features include the acute onset of confusion, inattention, impaired cognition and consciousness, and a fluctuating course. 2 As delirium affects many diverse populations, including those suffering critical illness, postoperative patients, and the elderly,2–4 its consequences are far-reaching. Furthermore, with over 50% of hospitalised older adults affected, and age being a major risk factor for delirium, 2 its prevalence is likely to grow given the aging population. Regardless of the population studied, delirium has been consistently and independently associated with adverse outcomes, including increased mortality, cognitive and functional decline, length of stay in hospital and institutional admission.3–10 Per year, delirium costs over US$164 billion in the USA and over $182 billion in 18 European countries. 2 Unfortunately, however, current preventative and therapeutic research remain limited by a poor understanding of underlying pathophysiological mechanisms.
Multiple complex and overlapping hypotheses attempt to explain the pathophysiology of delirium, implicating disturbed neurotransmission, neuroinflammation, hormonal imbalances and metabolic dysregulation.11,12 Accumulating research suggests cerebral metabolism is disrupted in delirium. Across varied populations, delirium has been consistently associated with reduced global 13 and regional cerebral blood flow,13–15 reduced preoperative regional cerebral oxygen saturation,16,17 and impaired cerebral autoregulation,18,19 characteristics that tend to reduce the availability or utilisation of metabolic substrates. Lower CSF concentrations of neuron-specific enolase, an isoenenzyme of the glycolytic enzyme enolase, and increased lactate have also been demonstrated, indicating aerobic glycolysis may be suppressed and anaerobic metabolism increased in delirium. 20 Based on the existing literature, metabolic disturbances appear widespread and predominantly cortical in delirium.13,14,21,22 However, as this research is scant, only includes one cause or subtype of delirium, and does not correlate anatomy with clinical features, further research of metabolism in delirium is warranted.
The posterior cingulate cortex (PCC) may play an important role in delirium. Located in the medial part of the inferior parietal lobe, the PCC is one of the most anatomically connected brain regions, 23 a key centre of a resting-state network known as the default-mode network. 24 It appears critical for attention and arousal, 23 functions that are profoundly disturbed during delirium. Although PCC abnormalities occur in conditions which overlap with delirium, including hepatic encephalopathy 25 and Alzheimer's disease, 23 only one study has investigated it in delirium. 26 Resting-state functional MRI (fMRI) revealed dysfunctional connectivity between the PCC and brain centres involved in executive function, and that connectivity strengths between the PCC and precuneus, another region of the default-mode network, correlated with delirium duration and severity. 26 However, this study did not investigate whether disturbed functional connectivity related to clinical features of delirium. Given that the PCC has one of the highest resting metabolic rates, approximately 40% higher than the brain average,24,27 it may be most vulnerable to insults that impair cerebral metabolism.
2-18F-fluoro-2-deoxy-D–glucose (FDG) positron emission tomography (PET) is a valuable and widely used functional neuroimaging technique that measures cerebral glucose metabolism. Since it is yet to be employed in delirium, this research aimed to investigate cerebral metabolism in delirium using FDG PET, and to correlate this with the clinical features of delirium. We hypothesised metabolism would be reduced in the PCC and the whole brain during delirium. As the PCC is important in regulating attention, we further hypothesised that disrupted metabolism in the PCC during delirium would relate to impaired attention.
Materials and methods
This study was conducted at Prince of Wales Hospital, Sydney, a 440-bed urban teaching hospital. Written informed consent was obtained from all patients or their person responsible, identified in accordance with the NSW Guardianship Act (1987), in cases where participants lacked capacity. The project was approved by the Human Research Ethics Committee of the South Eastern Sydney Local Health District as complying with the National Statement on Ethical Conduct in Research Involving Humans 2007.
Participants
Participants were consecutively recruited from all geriatric inpatients between November 2014 and September 2015. Eligibility criteria included current delirium of any cause or subtype, diagnosed by an experienced geriatrician and documented with the Confusion Assessment Method (CAM), 28 and age ≥ 65 years. Delirium diagnosis was made between one and seven days before scanning. Exclusion criteria included delirium resolution, epilepsy, psychosis, evidence of a stroke or other organic brain pathology on neuroimaging, current benzodiazepines use and extreme agitation. Those without a carer available to accompany them during scanning were also excluded.
Clinical assessment
Trained researchers collected clinical data and performed neuropsychological testing within 24 h of scanning. Testing was conducted in the hour preceding scanning, or shortly before that, to ensure patients remained acutely delirious during imaging. The CAM documented delirium presence and severity,28,29 and the Delirium Index scored delirium severity. 30 The Mini-Mental State Examination (MMSE) assessed cognitive impairment. 31 The Acute Physiology and Chronic Health Evaluation III (APACHE-III) documented illness severity, 32 and the Charlson Comorbidity Index assessed overall disease status. 33 The Short Informant Questionnaire on Cognitive Decline in the Elderly (S-IQCODE) is a validated informant-based screening test for dementia. 34 A score > 3.44 was used to screen for undiagnosed dementia, because this had a sensitivity and specificity of 100% and 86% respectively, respectively. 35 The Barthel Index 36 and Instrumental Activities of Daily Living Index 37 documented baseline function. Admission diagnosis, cause, type and duration of delirium as determined by the treating physicians, and medication use were also documented. A neuropsychological test, the WAIS-IV (Wechsler Adult Intelligence Scale) Digit Span Test, was used to assess auditory attention. 38
Imaging procedure
Participants in this prospective cohort study underwent two FDG PET/CT scans, separated by at least four weeks. The first scan was conducted during delirium, while the second occurred after discharge and delirium resolution, determined by clinical history and a negative CAM. Patients were accompanied by a relative/carer to reassure them prior to and during the scan. All scans were acquired at midday.
Standard scan preparation was undertaken, including a six hour fast. Patients were cannulated and rested for 10 min prior to tracer injection in a quiet, dark room. An intravenous injection of 3.5 MBq/kg of FDG was administered (median injected dose 237MBq, range 154–262 MBq), followed by a 60-min uptake period with the patient remaining in a quiet, dark room. The patients were positioned supine with arms down and the head placed in a foam brace with Velcro chin and forehead straps used to minimise head movement during the scan acquisition.
All scans were acquired on the Philips Ingenuity TF 128 PET/CT scanner (Cleveland, Ohio). A helical low-dose CT of the head was acquired (64 × 0.625 slice thickness, 50 mA, 0.828 pitch, 120 kVP), followed by a 10-min PET acquisition over one bed position (18 cm axial field of view) using a 256 × 256 image matrix.
The PET images were reconstructed using Philips Astonish TF (list mode fully 3D iterative ordered subset expectation maximisation (OSEM) algorithm and point spread function (PSF). The CT was reconstructed using Philips Standard Iterative method with iDose.
Visual analysis
Images were viewed on a Philips Extended Brilliance Workspace workstation (software version 4.5.3.40140). Scans were reported by two experienced nuclear medicine physicians and consensus was reached. The brain was divided into lobes and areas of hypometabolism were visually scored as mild, moderate or severe. Global versus regional hypometabolism was noted. Neurological Statistical Image Analysis Software (NEUROSTAT) version 3.5 for Windows (University of Washington, Seattle, WA) was used to assist visual analysis.
Semi-quantitative analysis
Semi-quantitative analysis using NeuroQ version 3.0 (Philips Medicals Systems, Cleveland, OH) was performed by an experienced nuclear medicine physicist and one trained researcher. Briefly, steps included preprocessing, structurally reformatting the brain to a high quality standardised normal brain template, and intensity normalisation to the pons. The pons was chosen for normalisation because it is unaffected by antipsychotics,39,40 and relatively preserved in Alzheimer's dementia. 41 These steps reduce inter- and within-individual variability in brain anatomy and signal intensity, enabling within and between subject comparisons to be made.
The NeuroQ output quantifies relative FDG uptake in 240 different brain ‘regions of interest,’ which are combined to quantify uptake in 47 larger brain ‘clusters.’ FDG uptake reflects the regional cerebral metabolic rate of glucose consumption (rCMRG), a marker of brain activity. The PCC is one cluster, while the whole brain is a mean of all clusters.
Statistical analysis
SPSS version 23 for Macintosh (SPSS Inc., Chicago, IL) was used for statistical analysis. Descriptive statistics are presented using medians and quartiles for non-normally distributed continuous data and proportions for categorical variables. Since there were no previous data using FDG PET in delirium to perform a power calculation with, a power calculation was performed using data on cerebral perfusion in delirium. 14 This showed that seven participants would be required to detect an effect size of 1.36 with 5% alpha and 80% power, corresponding to the perfusion reduction in the frontal lobe of patients with delirium.
Feasibility was defined as the percent of scans attempted which produced data useful for semi-quantitative analysis. Non-parametric statistics were used for all analyses owing to the small sample size. To assess for attrition bias, baseline characteristics and rCMRG of participants who only received one scan were compared against those who received two scans using the Mann–Whitney U test for continuous data, and Fischer's exact test for categorical data. Baseline characteristics of patients who underwent paired scans were compared using the Wilcoxon matched-pair signed-rank test for continuous data and McNemar's test for categorical data.
In patients who underwent two scans, the Wilcoxon matched-pair signed-rank test was used to compare the rCMRG in all brain regions during and after delirium. Spearman's rho was used to assess correlations between rCMRG in the PCC, and clinical and neuropsychological tests. All statistical tests were two-sided with a significance level of 0.05.
Results
Recruitment and baseline characteristics
Overall, 202 patients were screened, and 187 were excluded. The primary reason for exclusion was logistical, in that delirium resolved before scanning could occur (30%). Other reasons included CT evidence of stroke or other brain pathology (26%), excessive medical instability (11%), no carer available (8%), no consent (8%), benzodiazepine use (5%), non-English speaking (4%) or extreme agitation (4%). Those included did not differ from those excluded in terms of age (p = 0.10); however, there was a significantly higher proportion of female patients included compared to those excluded (65 vs. 41%; p = 0.03).
In total, FDG PET was attempted in 15 participants initially, and 7 post-delirium. Extreme agitation prevented one initial scan from being conducted, while technical factors led to the exclusion of one participant's paired scans. Feasibility was therefore demonstrated in 13/15 or (87%) of initial scans and 6/7 (86%) of follow-up scans. Movement artefact occurred in 2/14 (14%) of initial scans and 1/7 (14%) of follow-up scans. Consent withdrawal (5), death (1) and epilepsy (1) prevented follow-up.
Baseline characteristics of participants with delirium. a
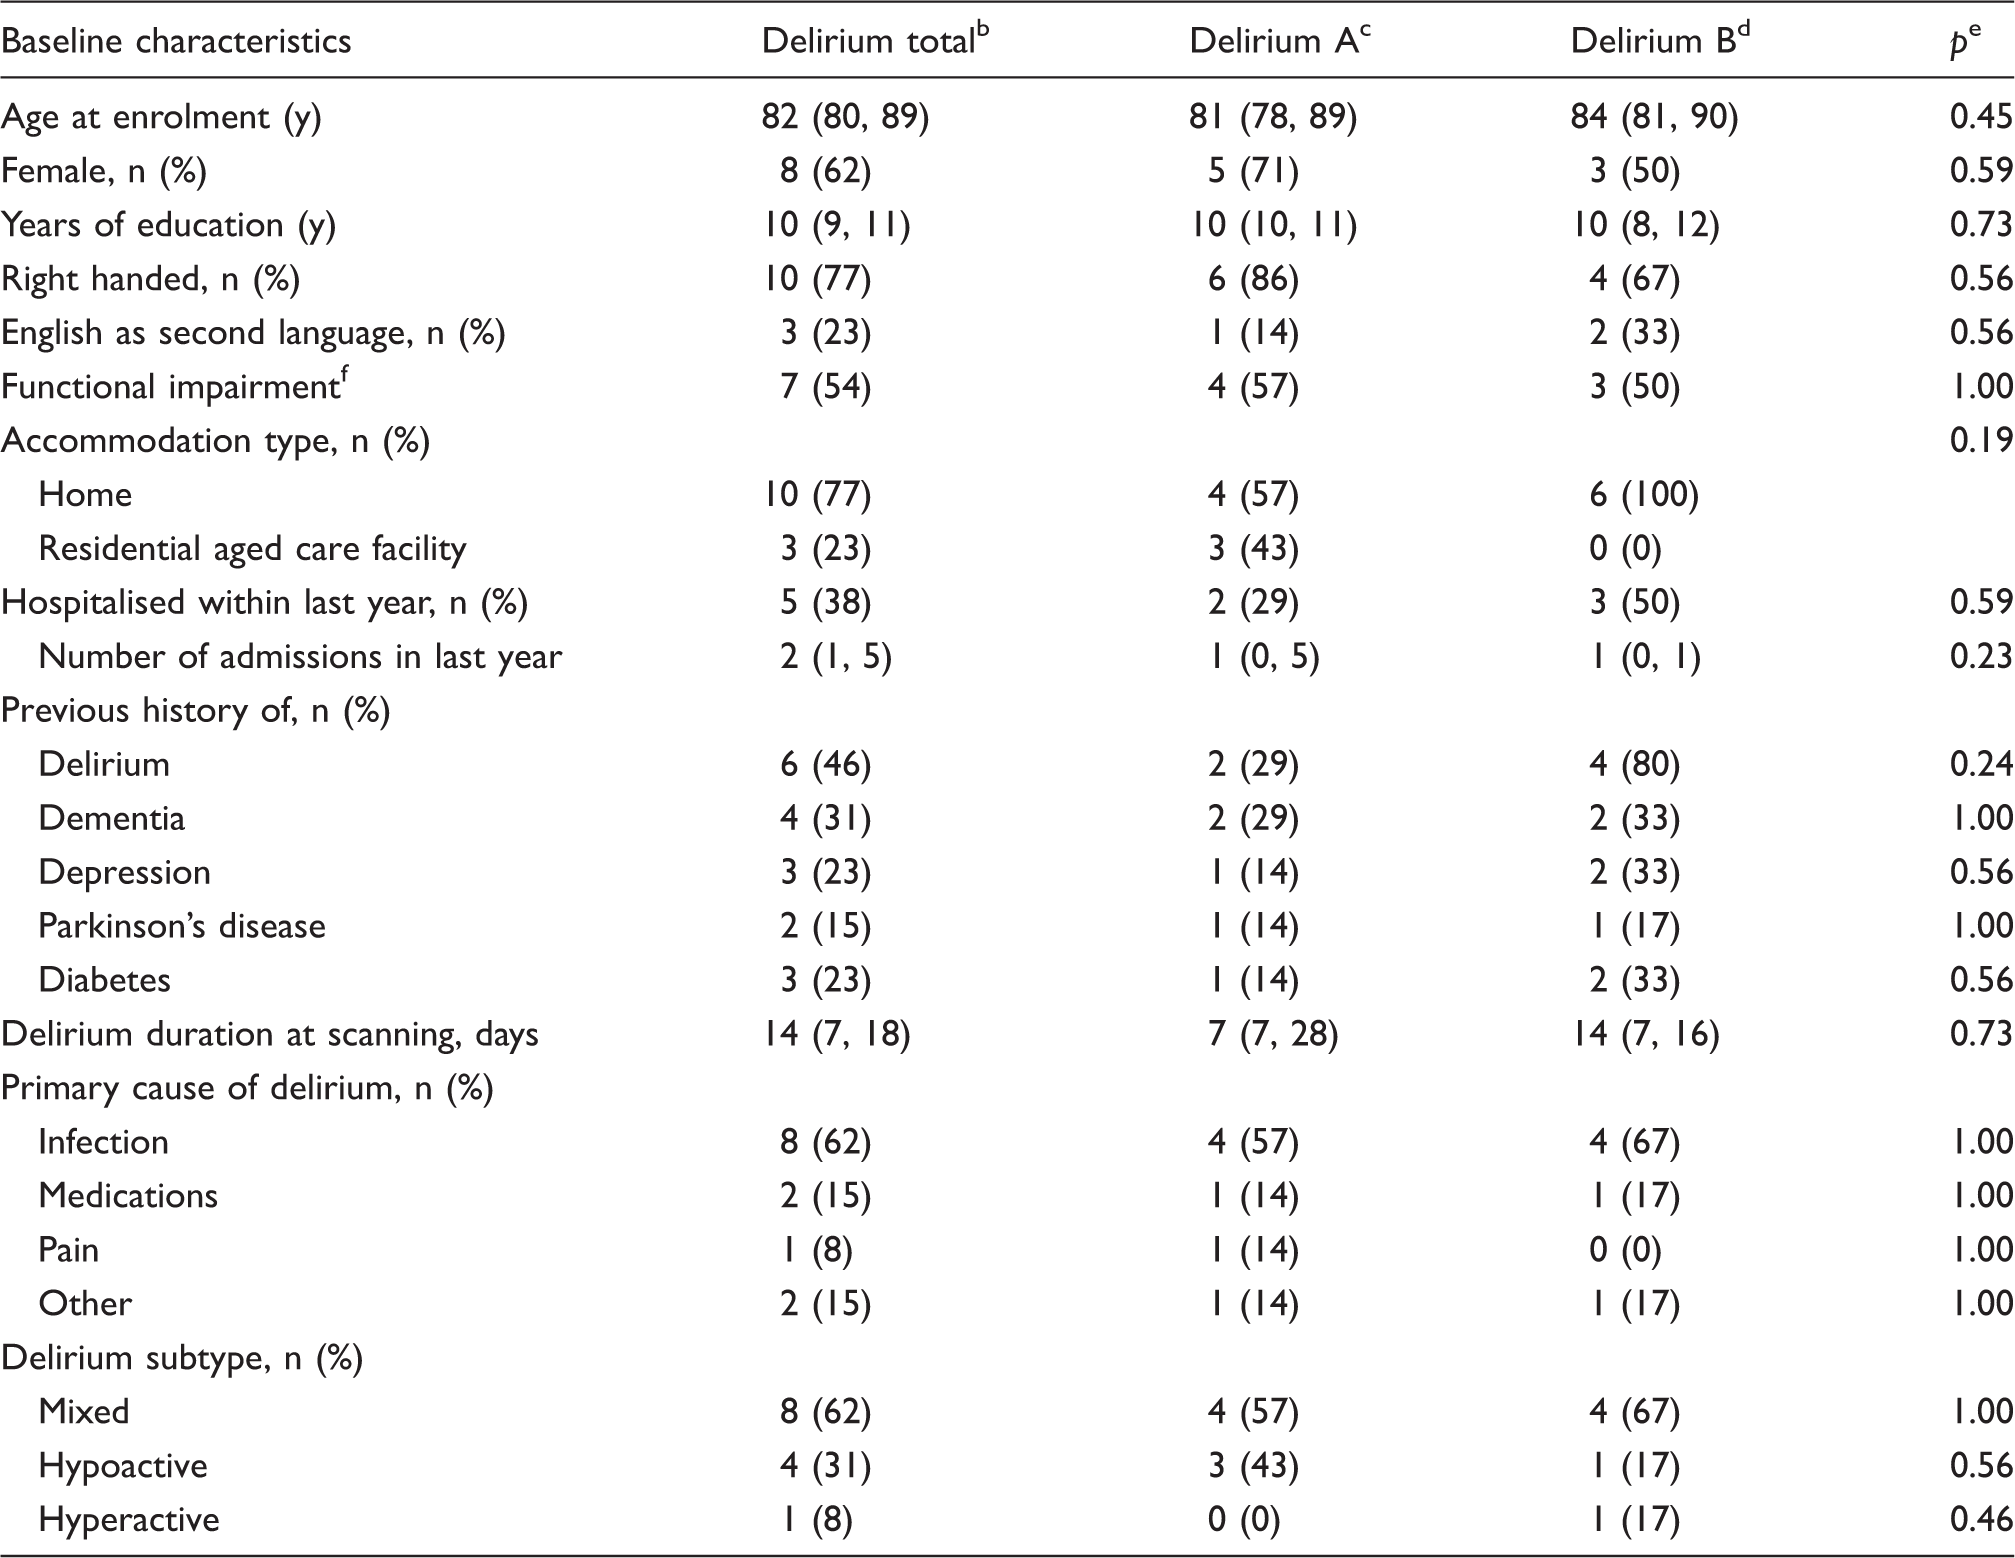
Data presented as median (Q1, Q3) unless otherwise stated.
Data taken during delirium from 13 participants with usable PET data.
Data taken during delirium from seven participants who underwent one scan.
Data taken during delirium from six participants who underwent two scans.
Comparison of data taken during delirium in participants who only underwent one scan (n = 7) against those who underwent two scans (n = 6), using either Fischer's exact test or the Mann–Whitney U test.
Functional impairment defined as impairment in at least one basic activity of daily living.
Performance on measures of delirium and neuropsychological tests. a
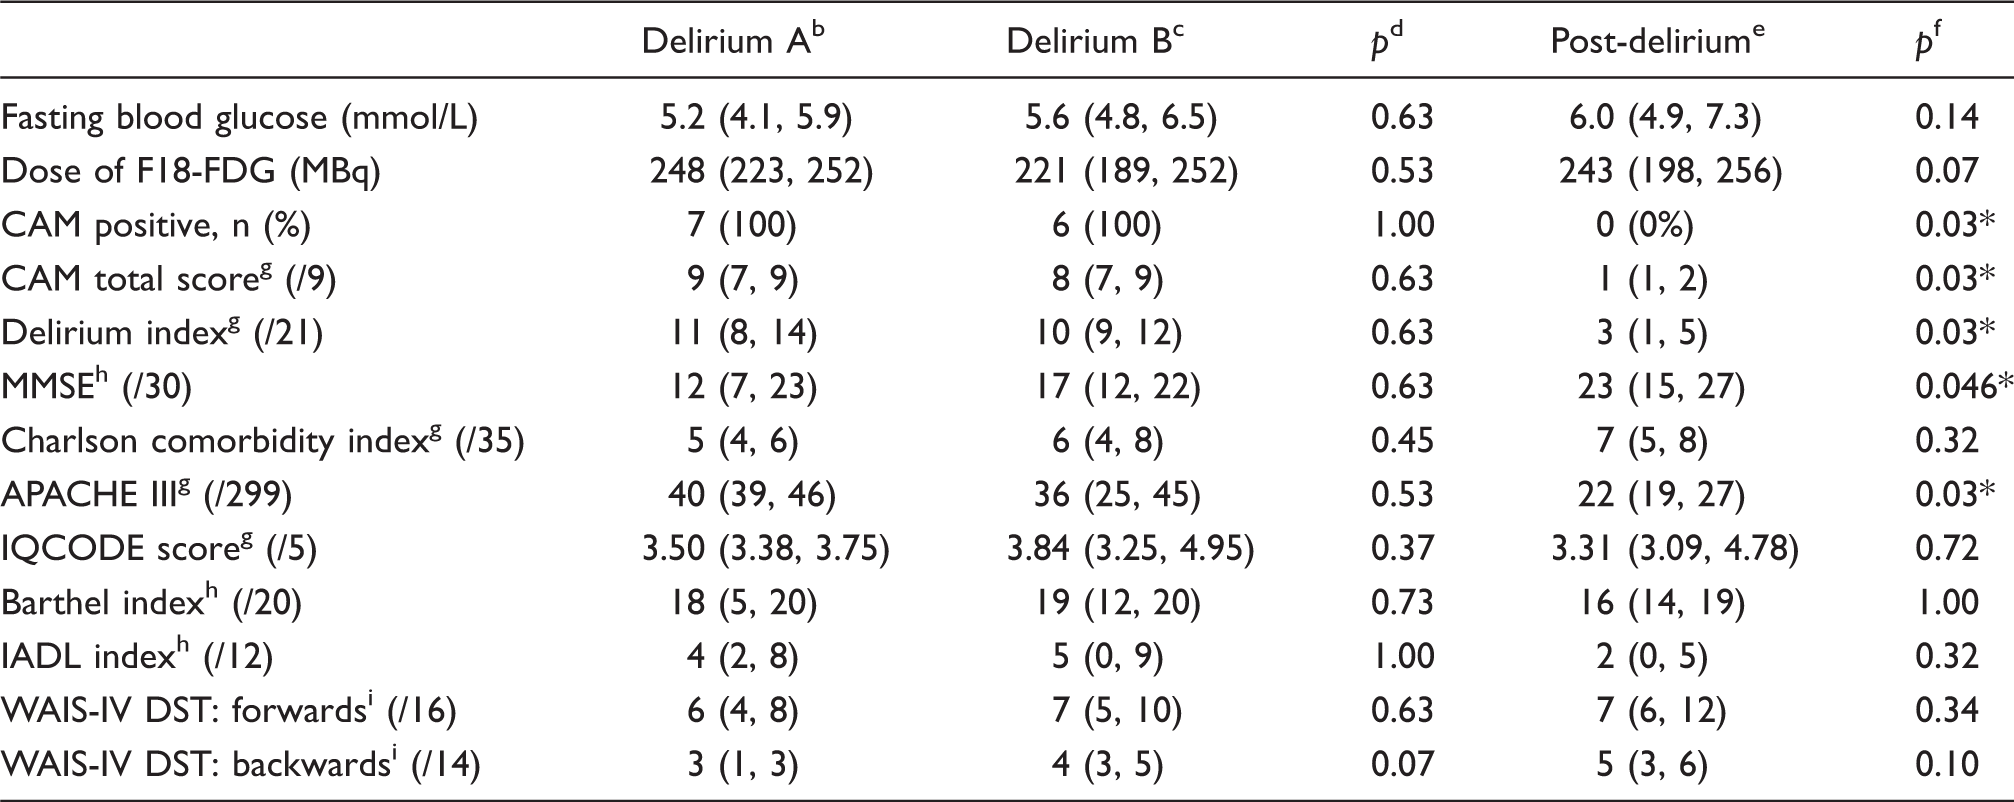
Data presented as median (Q1, Q3) unless otherwise stated.
Data taken during delirium from 7 participants who underwent one scan.
Data taken during delirium from 6 participants who underwent two scans.
Comparison of data taken during delirium in participants who only underwent one scan (n = 7) against those who underwent two scans (n = 6). See the “Statistical Analysis” section for methods.
Data taken after resolution of delirium.
Comparison of 6 participants during and after delirium. See the “Statistical Analysis” section for methods.
p < 0.05.
Higher scores indicate worse performance.
A maximum time of 300 s was allowed before test was ceased.
Higher scores indicate better performance.
FDG: fluorodeoxyglucose, CAM: confusion assessment method; MMSE: mini-mental state examination; APACHE III: acute physiology and chronic health evaluation III; IQCODE: informant questionnaire on cognitive decline in the elderly; IADL: instrumental activities of daily living; WAIS-IV DST: Wechsler adult intelligence scale IV digit span test.
Scanning was repeated after a median of 80 days (range: 42 to 87) in six participants, none of whom remained positive for delirium on the CAM. Scores on the Delirium Index, MMSE and APACHE-III significantly improved with delirium resolution (see Table 2). Fasting blood glucose levels and FDG dose injected did not differ between scans (p = 0.14 and p = 0.07, respectively). Attention measured by the WAIS-IV DST backwards tended to improve as participants recovered from delirium; however, this did not reach significance (p = 0.10).
Visual results
All participants with delirium exhibited cortical hypometabolism. A number of patterns of hypometabolism occurred during delirium (Table S1, supplementary material). Global cortical hypometabolism, affecting all cortical lobes, was observed in two patients. One of these patients had more severe regional abnormalities superimposed. The remaining 11 patients had discrete regional cortical abnormalities, which varied in severity and extent. Of all the patients with regional cortical abnormalities, bilateral frontal (11 patients), bilateral parietal (11), and bilateral temporal (8) lobes were affected most frequently, followed by the occipital lobes (2) and left temporal lobe (1). Bilateral changes, although not necessarily symmetrical, occurred in most patients.
Comparing delirium and post-delirium scans revealed that metabolism improved in all (6/6) patients: see Figure 1 for a representative case. Improvements occurred in the regions that previously had been impaired; however, metabolism did not normalise in any patient.
2-18F-fluoro-2-deoxy-D–glucose positron emission tomography during and after delirium. Legend: The top row (a) is the delirium scan, while the bottom row (b) is the scan taken after delirium. Darker colours indicate lower metabolism. The top row illustrates marked global hypometabolism during delirium. The bottom row illustrates an overall improvement, but not normalisation, in metabolism.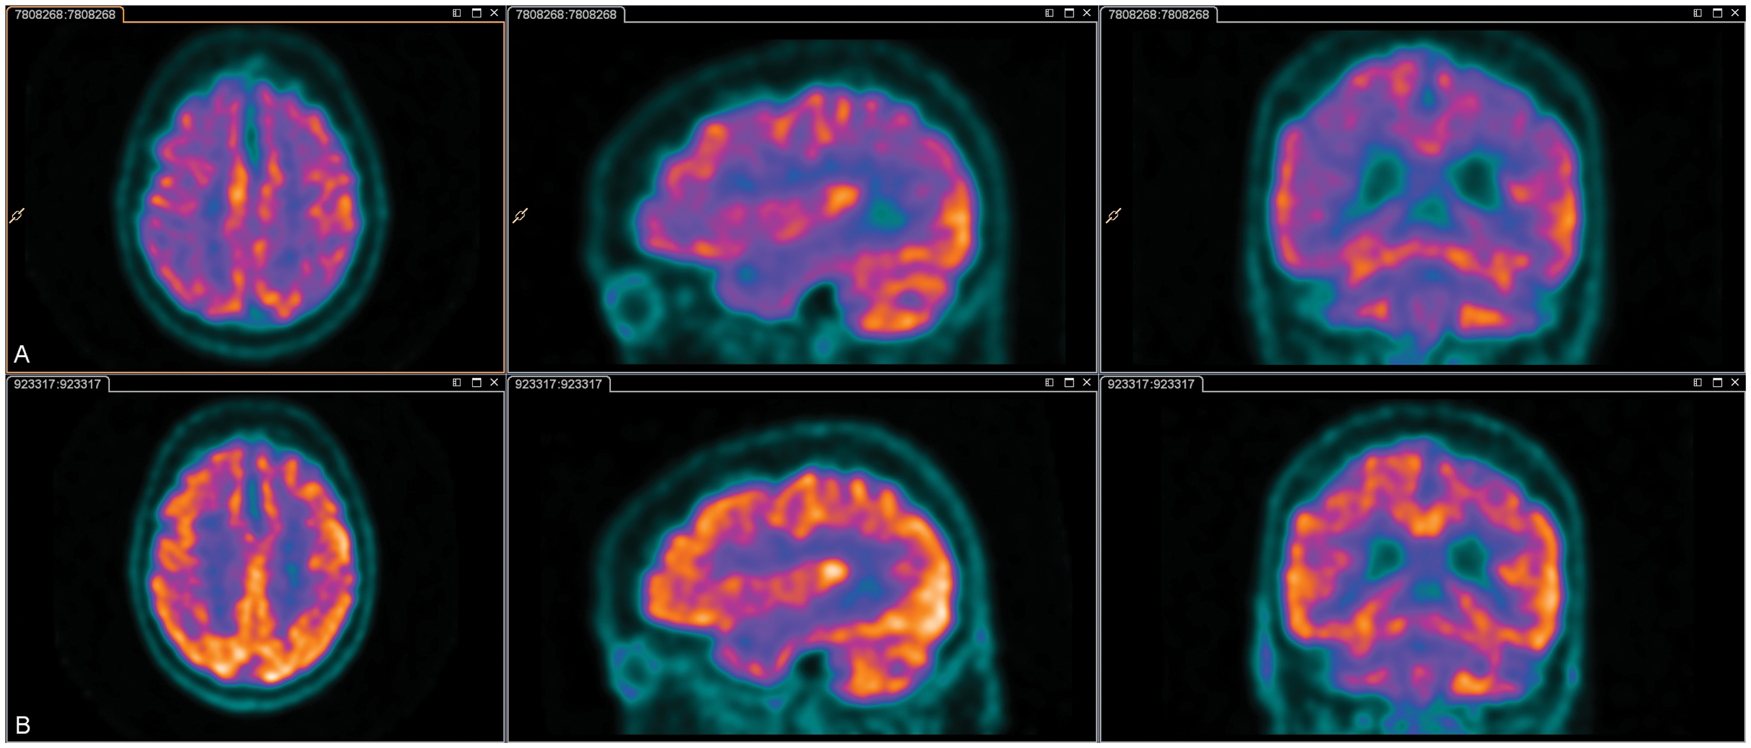
Notably, the sensorimotor cortex was relatively spared/hypermetabolic in 11 patients with delirium (see Figure 2). This relative preservation/increased metabolism resolved in 5/6 patients after recovery from delirium, while in the sixth patient, the sensorimotor strip remained prominent, although to a lesser extent, post-delirium.
Sensorimotor cortex hypermetabolism on 2-18F-fluoro-2-deoxy-D-glucose positron emission tomography during delirium. Darker colours indicate lower levels of metabolism. These representative images illustrate global hypometabolism with more prounouned regional abnormalities in the bilateral parieto-temporal lobes and intense metabolism in the sensorimotor cortices. Activity within the basal ganglia and cerebellum is within normal limits.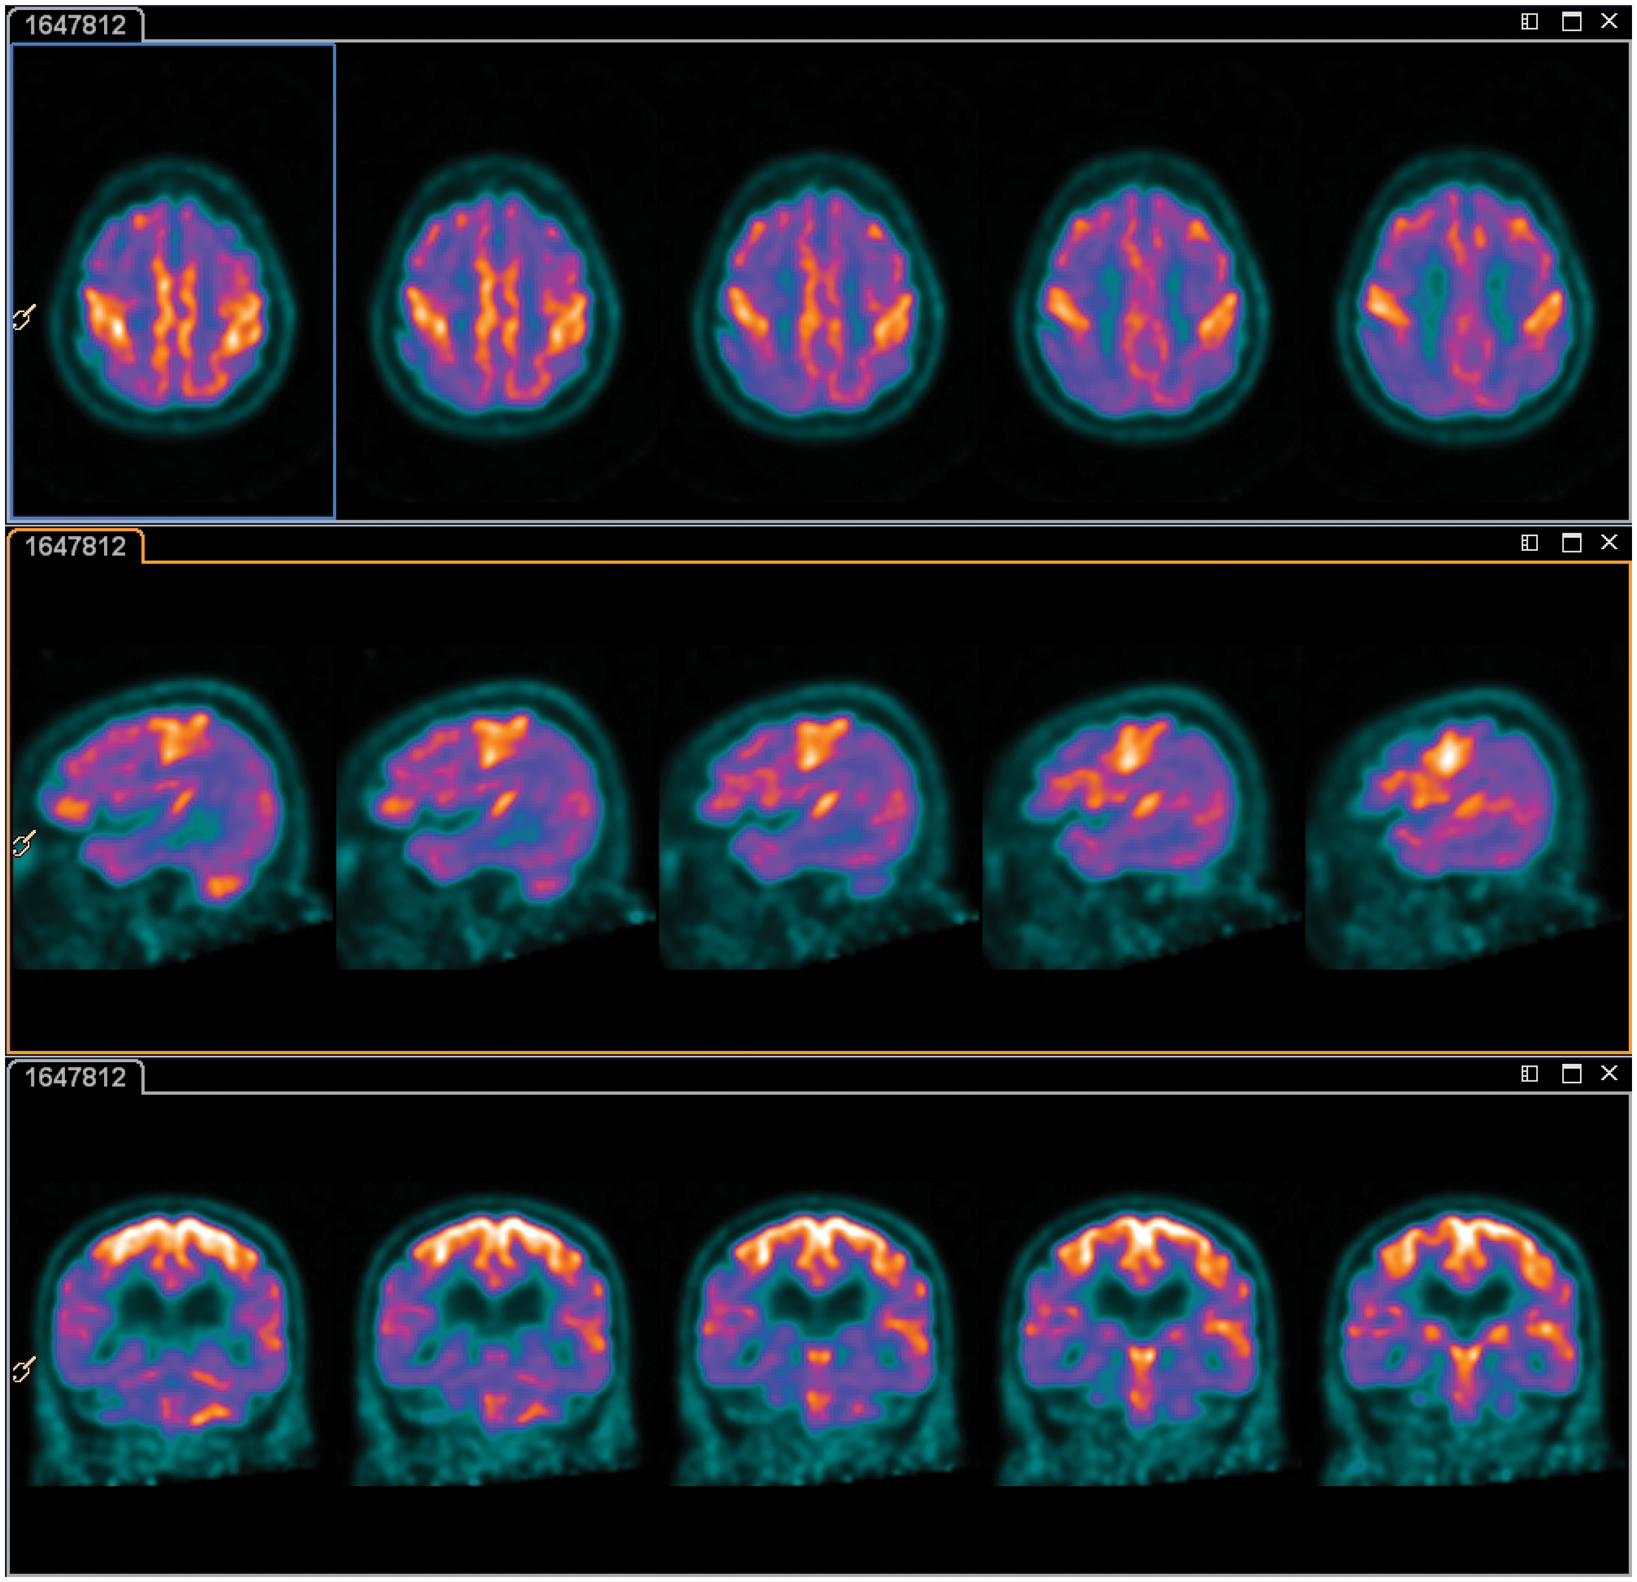
A number of less consistent findings were also observed. Pituitary uptake was attributed to a microadenoma, while markedly patchy uptake was thought to reflect vasculitis or multiple small vessel infarcts. Prominent basal ganglia uptake was observed in another participant, perhaps related to her risperidone use. Relative increases in occipital lobe metabolism in two patients may have related to excessive eye movement during the uptake period.
Semi-quantitative results
Comparing whole brain CMRG during delirium for patients who only underwent one scan against those who later underwent another scan revealed no significant differences (p = 0.63).
The regional cerebral metabolic rate of glucose consumption during and after delirium. a
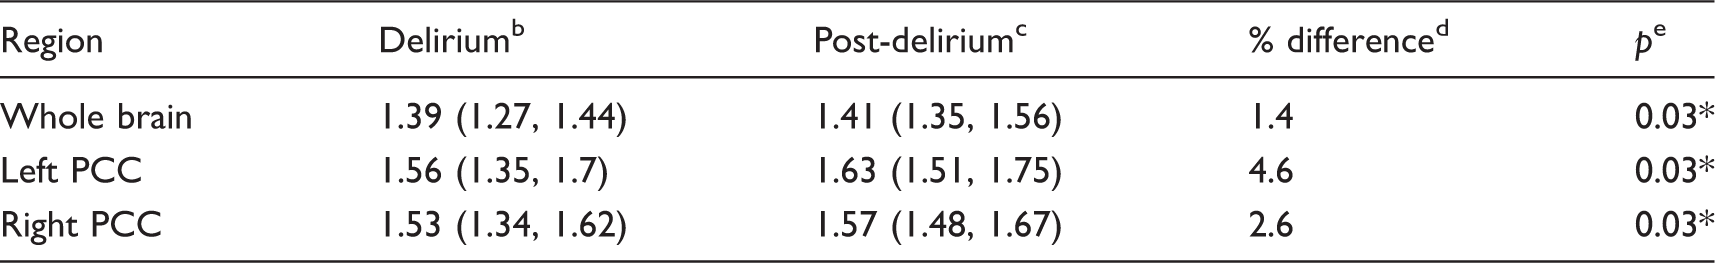
Data presented as median (Q1, Q3) unless otherwise stated.
Median rCMRG during delirium for the 6 participants who successfully underwent paired scans.
Median rCMRG after delirium resolution in the 6 participants who successfully underwent paired scans.
Median percentage difference calculated as (post-delirium minus delirium)/delirium × 100%.
Comparison of rCMRG during and after delirium, using the related-samples Wilcoxon signed rank test.
p < 0.05.
rCMRG: regional cerebral metabolic rate of glucose consumption; PCC: posterior cingulate cortex; SMC: sensorimotor cortex.
Correlation of clinical variables and neuropsychological tests with RCMRG in the PCC in participants with delirium, using pontine normalisation. a
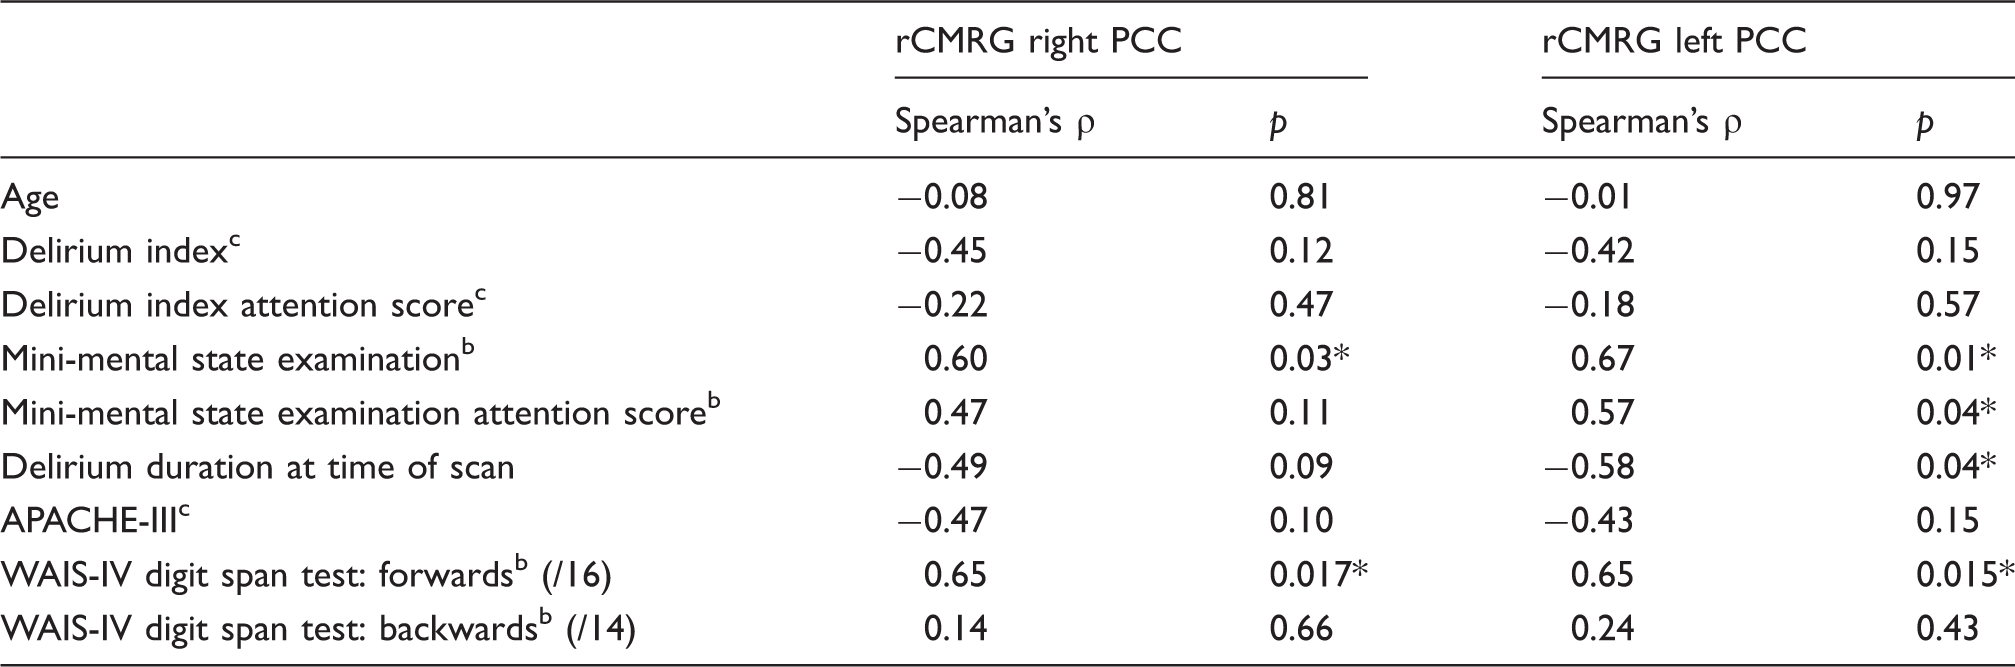
Data for 13 participants with usable data taken during delirium.
Higher scores indicate better performance.
cHigher scores indicate worse performance.
dA maximum time of 300 s was allowed before test was ceased.
p < 0.05.
rCMRG: regional cerebral metabolic rate of glucose consumption; PCC: posterior cingulate cortex; APACHE-III: acute physiology and chronic health evaluation III; WAIS-IV: Wechsler adult intelligence scale IV; WMS-III: Wechsler memory scale-III.
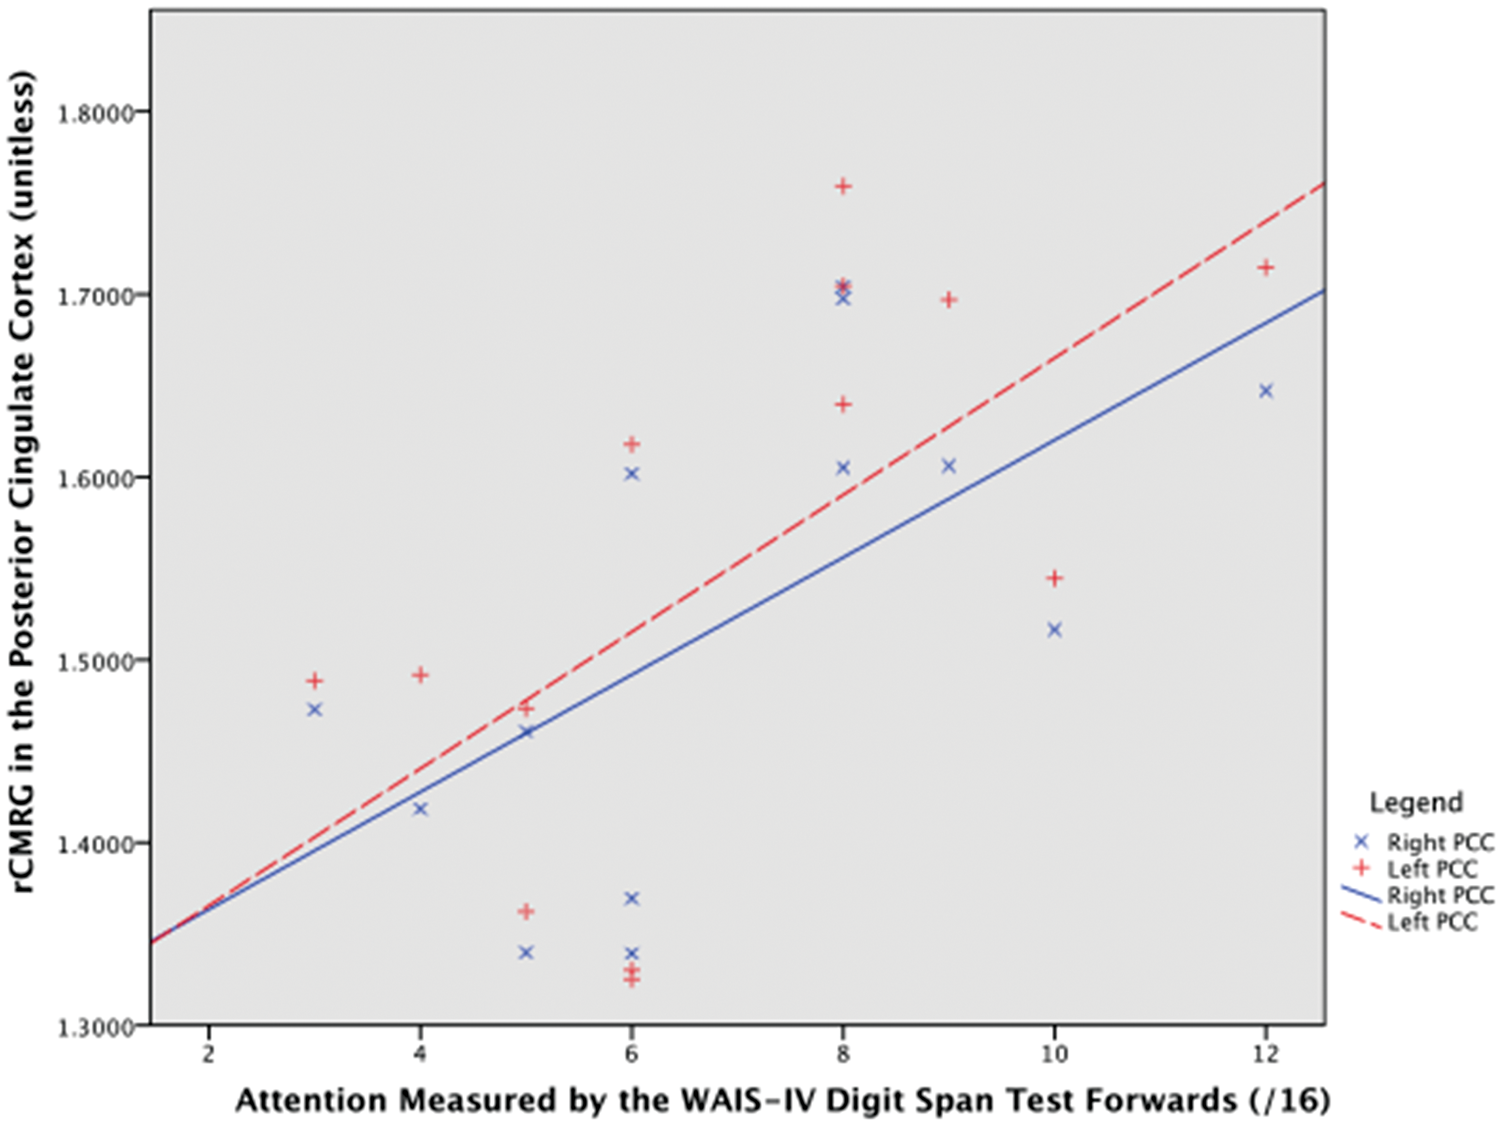
Scatter plot of regional cerebral metabolic rate of glucose consumption in the posterior cingulate cortex against attention in participants with delirium. Legend: Attention improves along the x-axis. Right PCC, Spearman's ρ = 0.65, p-value = 0.017; left PCC, ρ = 0.65, p-value = 0.015.
Discussion
This novel research using FDG PET revealed profound and widespread reductions in predominantly cortical glucose metabolism in all older inpatients with delirium studied, which improved with delirium resolution. This hypometabolism reflects reduced neuronal activity. 42 We also found hypometabolism in the PCC may underpin inattention, a clinical hallmark of delirium. Varied patterns of hypometabolism were observed on visual analysis during delirium. One common pattern emerged: extensive cortical hypometabolism with relative preservation of or intense activity in the sensorimotor cortex. Using semi-quantitative analysis, metabolism in the whole brain and bilateral PCCs increased as patients recovered from delirium. Considering the small sample, these results demonstrate that improvements in metabolism were universal in our sample, and raise the possibility metabolic impairments may be a final common pathway in delirium pathophysiology.
This study adds to growing evidence that cerebral circulation and metabolism are greatly disturbed in delirium. Across varied populations, delirium has been consistently associated with reduced cerebral blood flow13–15 and cerebral oxygen saturation.16,17 Furthermore, reduced CSF neuron specific enolase concentrations and increased CSF lactate concentrations have been observed, suggesting anaerobic metabolism is increased in delirium. 20 In septic patients with delirium, impaired cerebrovascular autoregulation has been observed.18,19,43 Additionally, animal models of sepsis-associated delirium have demonstrated neurovascular uncoupling, 44 early vasogenic oedema around the circle of Willis corresponding to blood–brain barrier disruption, 45 and reduced glucose uptake in neocortical areas 46 after lipopolysaccharide administration. While approximately two-thirds of our patients suffered from sepsis, others lacked an infective source, suggesting that in our sample, metabolic impairments may be attributable to a variety of insults and possible mechanisms.
Localising metabolic impairments may elucidate how neuronal dysfunction contributes to the clinical features of delirium. Since PCC metabolism increased with delirium resolution, and lower rCMRG during delirium correlated with more impaired attention, PCC hypometabolism may underpin inattention in delirium. Longer delirium duration also correlated with lower PCC metabolism, which may reflect a more severe delirium or illness, or that metabolic impairments relate to delirium duration. Delirium duration has been correlated with long-term cognitive impairment; 47 however, it remains uncertain from our research to what extent metabolic impairments correlate with long-term cognitive dysfunction. Interestingly, metabolism did not correlate with the Digit Span Test, backwards, likely owing to the poor performance of all delirious participants. In patients with Alzheimer's disease, where longitudinal decreases in metabolism on FDG PET predict cognitive impairment, metabolism in the PCC decreases by 5% per year. 48 Consequently, the 3–5% increase in PCC metabolism we observed in approximately two to three months represents a clinically significant result comparable in magnitude to one year of neurodegeneration in dementia.
PCC hypometabolism, indicating impaired function, is consistent with prior research demonstrating PCC dysfunction in delirium 26 and hepatic encephalopathy. 25 Although this is the first study to observe PCC hypometabolism in delirium, PCC hypometabolism has been demonstrated in many conditions which share features with delirium, including Alzheimer's disease, 49 autism spectrum disorder, 50 schizophrenia, 51 traumatic brain injury; 52 and cerebral blood flow in the PCC decreases with increasing depth of anaesthesia. 53 It remains plausible that the high baseline metabolism of the PCC contributes to its susceptibility to dysfunction during delirium.
Visual results showed primarily cortical hypometabolism, with relative sensorimotor cortex sparing, and preserved subcortical uptake. Considering that many cortical functions, including executive function and language, but not sensorimotor function, are defective in delirium, this pattern crudely aligns with the clinical features of delirium. Differences in the motor subtype, aetiology, and underlying cognitive impairment may influence patterns observed; however, the small sample size precluded an investigation of this. Our results are broadly consistent with reduced perfusion in frontal and parietal regions observed using 99mTc-HMPAO single photon emission CT (SPECT) in a similar cohort of geriatric medical inpatients. 14 Another study of 10 patients with hypoactive delirium found hypoperfusion in global, cortical (bilateral frontal, temporal and occipital lobes) and subcortical (bilateral caudate heads, thalami and lenticular nuclei) regions was associated with delirium; 13 however, they did not correct for multiple comparisons, report results for non-significant regions, and used a statistical test assuming sample independence on dependent data. Our findings contrast with structural imaging: often normal or non-specific in delirium.54,55
Metabolism did not normalise in any of our patients. Lacking a pre-delirium scan, we cannot determine whether this simply reflects our participants' pre-existing vulnerability to delirium, or are sequelae or persistence of a sub-syndromal delirium. Substantial evidence emphasises that delirium and dementia interact in many ways, including pathophysiologically. 56 In those with dementia, a history of delirium distorts the normal relationship between the severity of cognitive impairment and classical neuropathological markers (e.g. neuritic amyloid).57,58 Therefore, alternative, non-classical neuropathological processes, such as metabolic disturbances, may contribute to the acceleration of cognitive decline in those with dementia following delirium.56–58 PCC hypometabolism is one of the earliest markers of Alzheimer's disease, 49 perhaps explaining why those with dementia and less metabolic reserve are more vulnerable to delirium. Furthermore, hypometabolism in delirium may exacerbate existing hypometabolism in dementia, providing one of many possible explanations as to why delirium independently accelerates cognitive decline, increases rates of new-onset dementia, and increases mortality.5,56,59,60
Limitations
Being a preliminary study, these results need to be interpreted with caution and confirmed with future research. Although strong efforts were made to maximise inclusiveness, with all causes and subtypes of delirium included to better represent the clinical picture, and the main reason for exclusion was logistical owing to limited scanner availability, the representativeness of our sample is limited. In particular, patients who were severely ill, agitated, had strokes, or milder delirium that resolved before scanning were excluded: these may have had anatomically different or more severe metabolic abnormalities. Having the ability to conduct scans seven days per week would likely increase the number of patients who could be included and improve generalisability. Secondly, like most other neuroimaging research in delirium, 55 our preliminary study suffers from a small sample. Given this likely introduced type II error and precluded adjustment for confounding, research using a larger sample adjusting for confounding (e.g. illness severity, pre-existing cognitive impairment) is needed. Our research would be strengthened by using ill inpatients without delirium as controls. Furthermore, two patients received small doses of antipsychotic medications, potentially confounding results; however, this was clinically necessary. Visual analysis was also particularly challenging since there was no defined normal region of the brain to use as a reference standard, and logistics precluded blinding; however, we attempted to improve validity through using two reviewers and NEUROSTAT. Additionally, if the pons were to be hypometabolic during delirium, normalising to it may understimate the extent of hypometabolism in other brain regions (e.g. PCC). Ideally, future research should use quantitative rather than semi-quantitative data, obviating the need for normalisation. However, the gold-standard method for obtaining quantitative data requires continuous intra-arterial sampling; unlikely to be tolerated by delirious patients. 61 Alternatively, an extra-corporeal standard may be used; 61 however, our facilities lacked the technical capacity for this.
In conclusion, this research demonstrates that although challenging, FDG PET can offer substantial insight into the neural mechanisms and metabolic disturbances in delirium.
Footnotes
Funding
The author(s) disclosed receipt of the following financial support for the research, authorship, and/or publication of this article: The authors wish to acknowledge the generous donations of benefactor funding from the Julia Lowy Foundation and Harry Triguboff Foundation.
Acknowledgements
The authors would like to acknowledge the participants and their families, and Bruce McBride and Megan Horsfield at Prince of Wales Hospital, Sydney for their contributions.
Declaration of conflicting interests
The author(s) declared no potential conflicts of interest with respect to the research, authorship, and/or publication of this article.
Authors' contributions
All four authors contributed to study design, data analysis, acquisition and interpretation, and have approved the final version for publication. LH and JN drafted the article, and EW and GC provided important intellectual content.
References
Supplementary Material
Please find the following supplemental material available below.
For Open Access articles published under a Creative Commons License, all supplemental material carries the same license as the article it is associated with.
For non-Open Access articles published, all supplemental material carries a non-exclusive license, and permission requests for re-use of supplemental material or any part of supplemental material shall be sent directly to the copyright owner as specified in the copyright notice associated with the article.