
Abstract
We define cerebral vascular reactivity (CVR) as the ratio of the change in blood oxygen level-dependent (BOLD) magnetic resonance imaging (MRI) signal (S) to an increase in blood partial pressure of CO2 (PCO2): % Δ S/Δ PCO2 mm Hg. Our aim was to further characterize CVR into dynamic and static components and then study 46 healthy subjects collated into a reference atlas and 20 patients with unilateral carotid artery stenosis. We applied an abrupt boxcar change in PCO2 and monitored S. We convolved the PCO2 with a set of first-order exponential functions whose time constant τ was increased in 2-second intervals between 2 and 100 seconds. The τ corresponding to the best fit between S and the convolved PCO2 was used to score the speed of response. Additionally, the slope of the regression between S and the convolved PCO2 represents the steady-state CVR (ssCVR). We found that both prolongations of τ and reductions in ssCVR (compared with the reference atlas) were associated with the reductions in CVR on the side of the lesion. τ and ssCVR are respectively the dynamic and static components of measured CVR.
Keywords
INTRODUCTION
Clinical Assements of Cerebrovascular Reactivity
In asymptomatic patients with cerebrovascular steno-occlusive disease, cerebral blood flow (CBF) is maintained mainly through autoregulation, utilizing compensatory vasodilation. 1 Cerebral blood flow is usually sufficient to maintain normal capabilities such as sensation and movement, but careful surveys reveal subtle reductions in cognitive performance.2,3 As well, reductions in cerebrovascular reactivity (CVR) have been associated with structural changes such as cortical thinning, 4 white-matter microangiopathic disease, 5 and enhanced risk of stroke.6,7 These studies suggest that localizing impaired CVR and quantifying its severity would complement neurologic assessment.
Measuring Cerebrovascular Reactivity
Hypercapnia, an increase in the partial pressure of CO2 in arterial blood (PaCO2), measured in mm Hg, is a well-characterized cerebral vasodilatory stimulus. 8 Assuming no change in oxygen consumption from normocapnia to hypercapnia, the blood oxygen level-dependent magnetic resonance (BOLD MR) signal (S) can be used as a surrogate for change in CBF. 9 The BOLD signal response provides a high spatial and time resolved indication of the direction and magnitude of changes in CBF.10,11 Cerebrovascular reactivity is here defined and calculated as the per cent change in BOLD signal per change in end-tidal partial pressure of CO2 (PetCO2) and expressed as %S/mm Hg.
The speed of Cerebrovascular Reactivity Response
Another assessment of vascular function that may be useful is the
Cerebral blood flow vasodilatory response times have also been found to be consistently longer in patients with mild dementia and Alzheimer's disease than in age-matched, healthy subjects.10,15,16 In the course of a recent study of the amplitude of the BOLD signal response to hypercapnia in patients with cerebrovascular steno-occlusive disease, 17 we also noticed that the time course of signal changes can vary greatly throughout the brain within gray and white matter in healthy subjects, and between healthy subjects and patients, particularly in locations close to those experiencing vascular steal.
A Step Hypercapnia to Measure the Speed of Cerebrovascular Response
The simplest stimulus that is useful for measuring the speed of the CBF vasodilatory response is a step (i.e., square wave) increase in PaCO2. This is not provided by breath holding or even an abrupt change in
Aims of the Study
The aim of the study was to develop a method of separating CVR into (1) a dynamic component providing a voxelwise measurement of the speed of the cerebrovascular response to hypercapnia and (2) a static component providing a measure of the steady-state reactivity of the vasculature. We then applied these analyses to a cohort of patients with known localized cerebrovascular compromise, and compared the findings with those in healthy subjects.
Since our stimulus consisted of an abrupt step change in PaCO2, for our analysis, we assumed a first-order exponential response of the vasculature to the stimulus. We therefore convolved the known input signal with a first-order exponential to identify the PetCO2 series providing the best fit with the time course of the BOLD signal, voxel by voxel. We used the time constant (τ) of the exponential providing the best fit to score the response dynamics, and the slope of the regression between the BOLD signal and the convolved PetCO2 to score the steady-state CVR (ssCVR).
We illustrate this method by applying it to 20 patients with known steno-occlusive disease, and 46 healthy control subjects. Our hypothesis was that the speed of response would be abnormally slow predominantly in the hemispheres on the side of the carotid artery stenosis, when compared with that in the corresponding hemispheres of the healthy cohort, and with the contralateral hemisphere in the same patient.
MATERIALS AND METHODS
Subjects and Ethical Approval
These studies conformed to the standards set by the latest revision of the Declaration of Helsinki. They were approved by the Research Ethics Board of the University Health Network and all subjects had given written informed consent. We drew 20 patients from our database, 22 with the following inclusion criteria: the presence of unilateral severe steno-occlusive large vessels disease, abnormalities in CVR, and a normal anatomic scan. Patients could be either sex, and any age. Patient files were selected before any data analysis, and none were rejected after analysis. In addition, we analyzed test data obtained from 46 healthy volunteers who had undergone the same stimulus and scanning protocol as the patients. The anthropomorphic characteristics and CVR findings for these subjects have been reported elsewhere. 23
Experimental Protocol
The standardized sequence of PetCO2 changes is presented in Figure 1. After 60 seconds at a baseline PetCO2 of 40 mm Hg, PetCO2 was increased over one or two breaths to 50 mm Hg for 45 seconds, followed by a return to baseline for 90 seconds; a second step hypercapnia was sustained for 120 seconds followed again by return to baseline for 60 seconds. End-tidal PO2 was maintained constant at 100 mm Hg throughout testing. The system is implemented using an automated gas blender running a prospective targeting algorithm. 24 PetCO2 transitions were achieved within two breaths and PetCO2 was maintained constant within 2 mm Hg thereafter. 8 For the healthy cohort, the mean and standard deviation increase in PetCO2 was 9.2 ± 0.7 mm Hg.
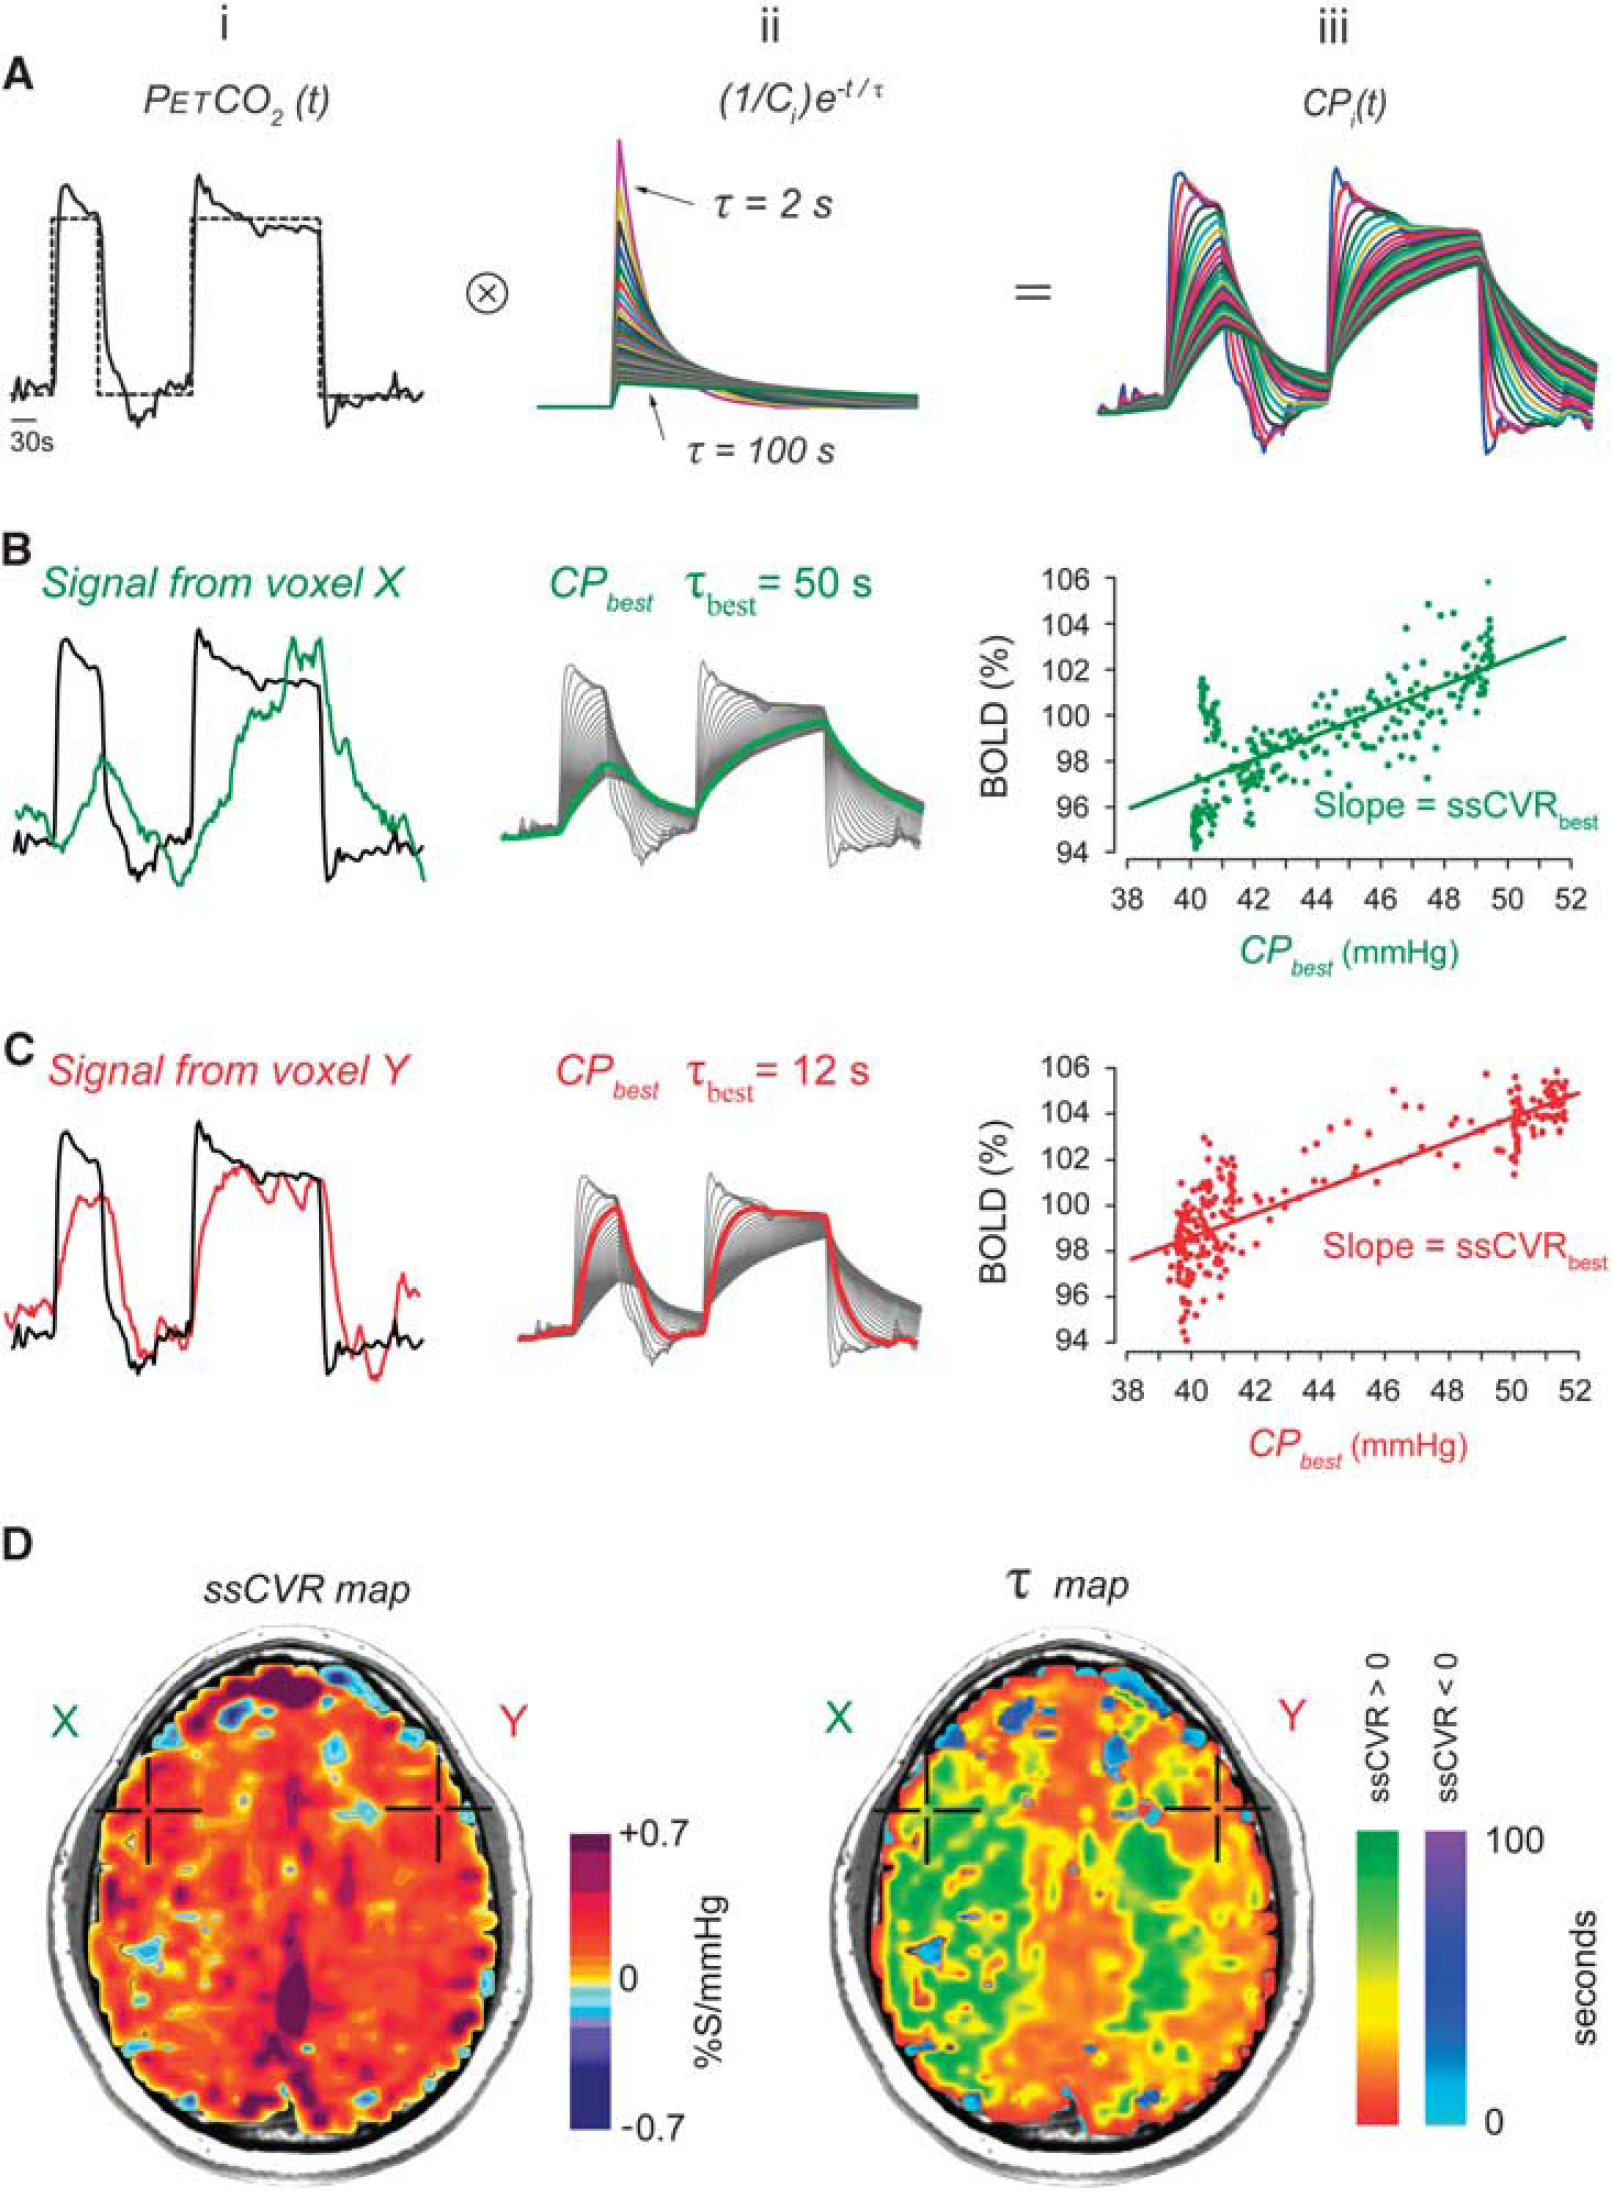
Generation of steady-state cerebrovascular reactivity (ssCVR) and time constant (τ) maps from a standardized abrupt two-step stimulus. (
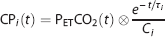
The mechanism of gas control and the rationale for its use is described elsewhere.8,24 In brief, a volume and concentration of CO2 required to increase the PetCO2 by a targeted amount, say, 10 mm Hg, is administered at the beginning of the breath, followed by rebreathed gas which displaces the initial gas bolus of CO2 into the alveoli and thereby determines alveolar gas exchange and the PetCO2. The rebreathed gas had already equilibrated with capillary blood so it has no further effect on CO2 exchange, enabling the gas exchange to be independent of ventilation. The end-inspiratory rebreathing also narrows the gradient between PetCO2 and PaCO2, resulting in PetCO2 being practically equal to the PaCO2.25,26 For clarity, we will hereafter refer to the stimulus as PetCO2 when referring to what is measured, and PaCO2 when referring to the actual physiologic stimulus. Ours is the first study in which the course of the actual stimulus, the PaCO2, was convolved with the output signal, in this case, BOLD.
Cerebrovascular reactivity images were acquired using a BOLD MR pulse sequence with the following parameters: echo planar imaging gradient echo with repetition time/echo time = 2,000/30 ms, 3.75 × 3.75 × 5 mm voxels, field of view 24 × 24 cm, 39 slices, slice thickness 5 mm, matrix size 64 × 64, number of frames = 254, flip angle = 85°. T1-weighted images were acquired for coregistration and spatial normalization purposes. An inversion recovery-prepared spoiled gradient-recalled sequence was used with the following parameters: flip angle = 20°, inversion time/echo time/repetition time = 300/5/11.5 ms, 146 slices of 1 mm thickness and a 256 × 256 matrix size with 200 mm field of view.
Data Processing
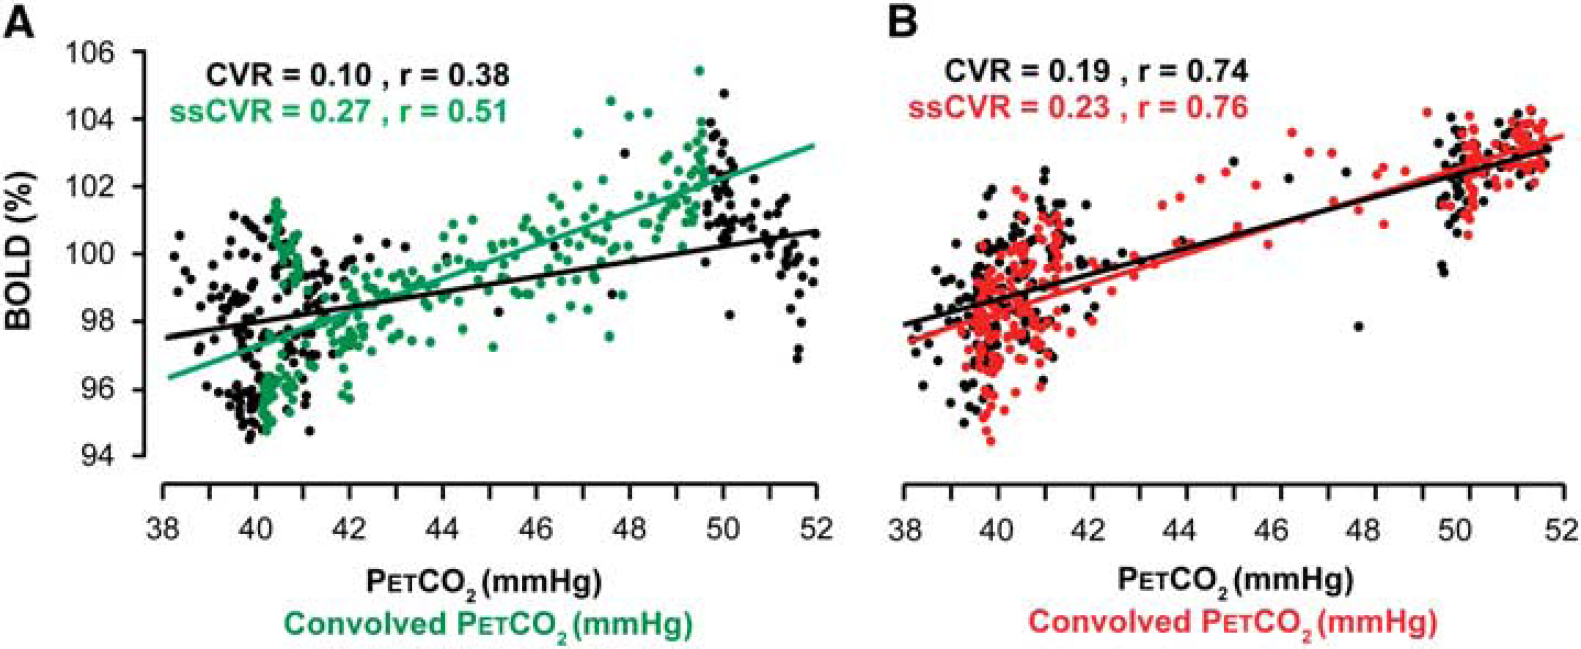
The relationship between cerebrovascular reactivity (CVR) and steady-state CVR (ssCVR). Data from the same patient as presented in Figures 1 and 5. CVR and ssCVR values are expressed in %S/mm Hg. (
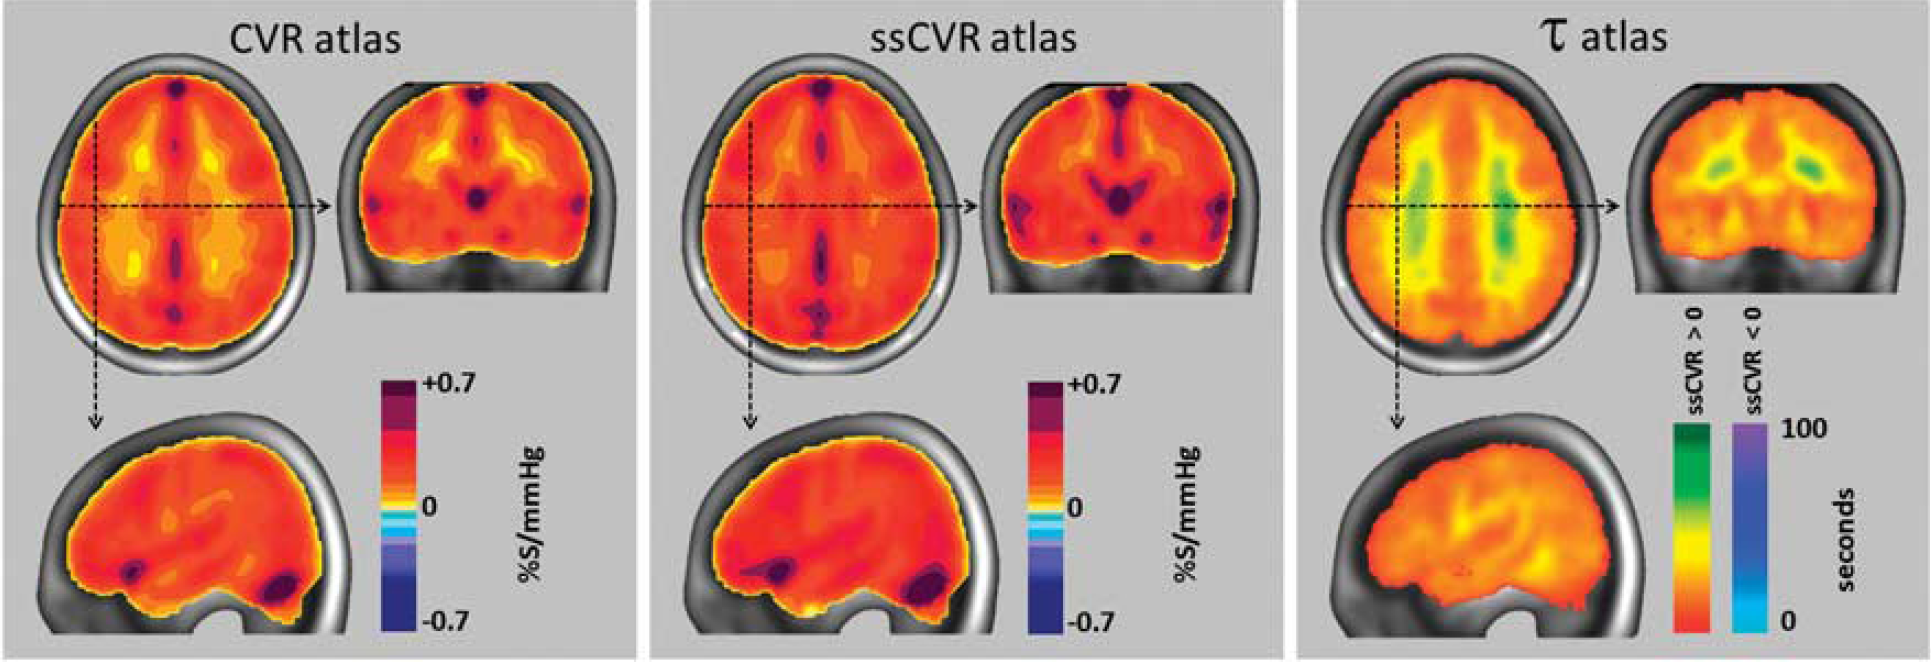
Atlas for cerebrovascular reactivity (CVR), steady-state CVR (ssCVR), and τ from 46 healthy subjects. In each view, the mean value for all corresponding voxels of the atlas was calculated and mapped onto the anatomic image of the standard space using the color scales shown (see Supplementary Table 1 for more detail characterization of the color scales). Areas containing major veins and venous sinuses register greater CVR values due to a reduction in deoxyhemoglobin, and possibly also in diameter, resulting from the reduced extraction fraction, and increased arterial blood volume, respectively, accompanying the hypercapnia-induced increased cerebral blood flow.
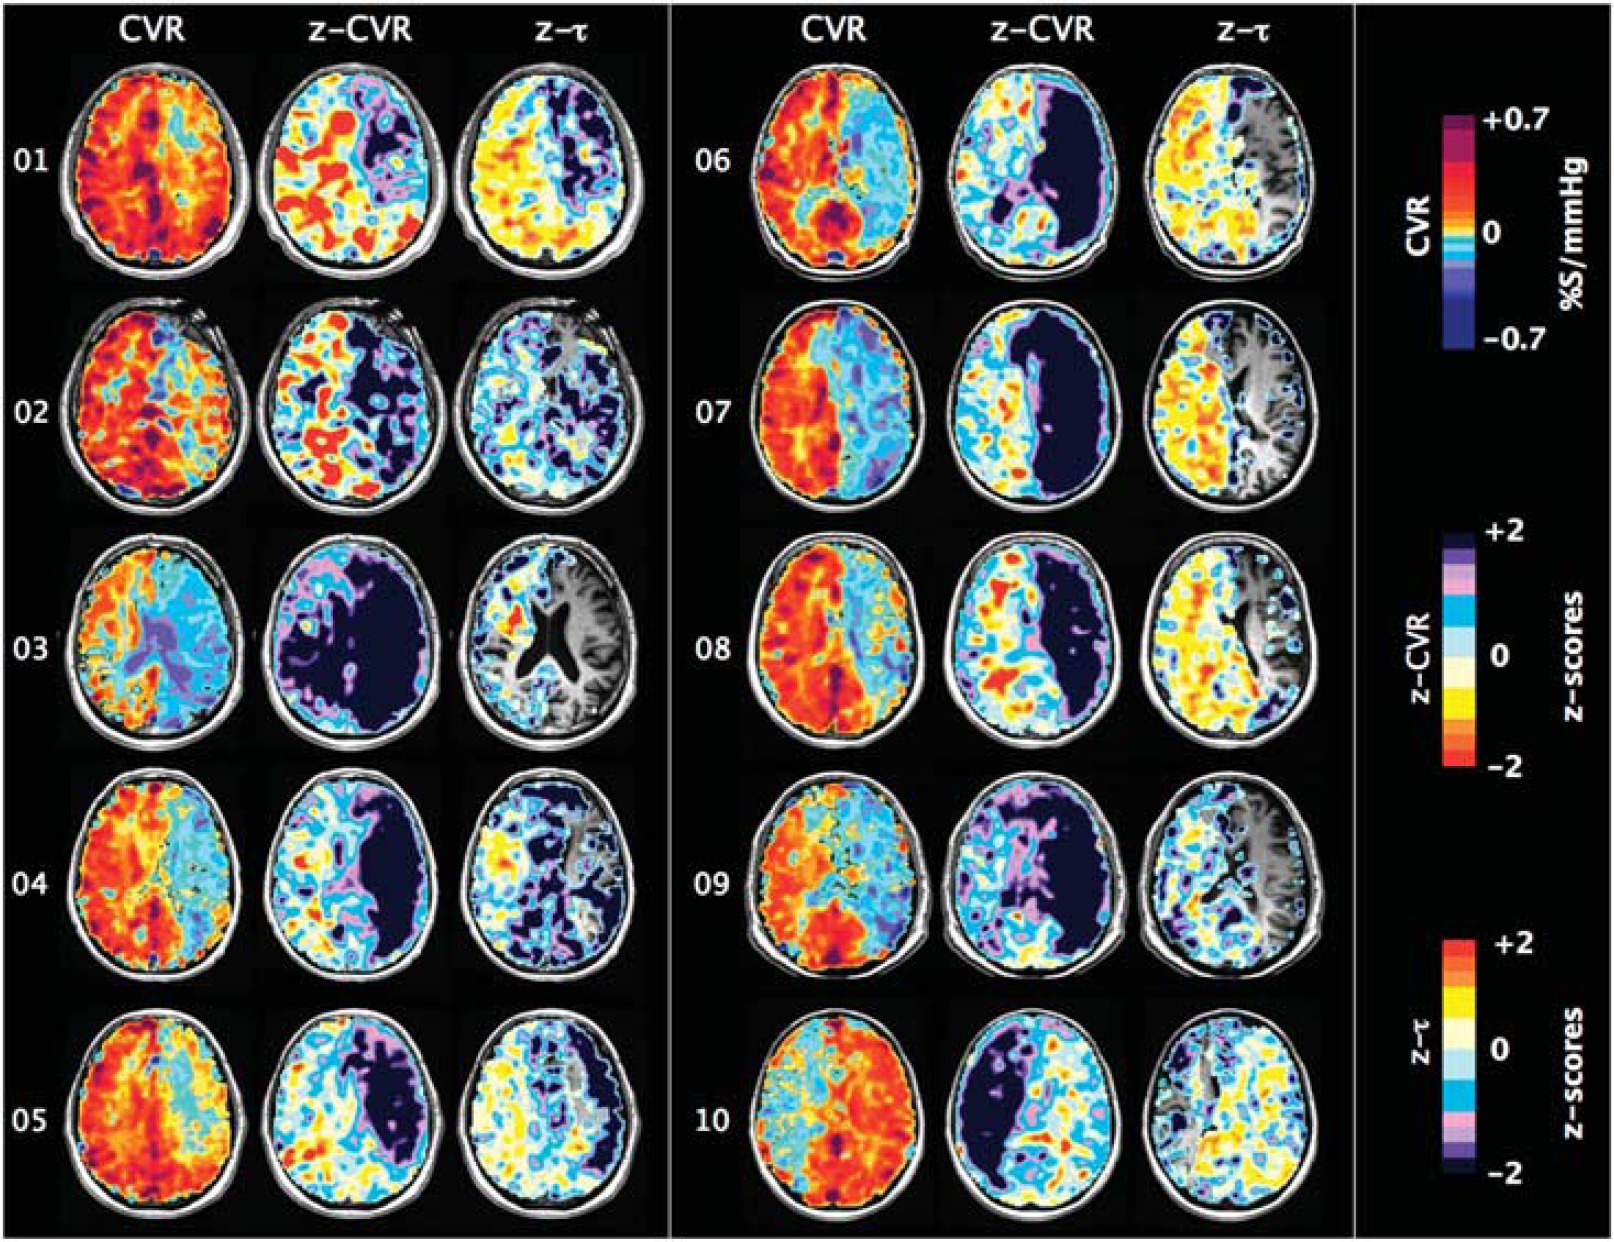
One slice of CVR, z-CVR and z-τ maps for patients number 01 to 10. Patients' characteristics are presented in Table 1.
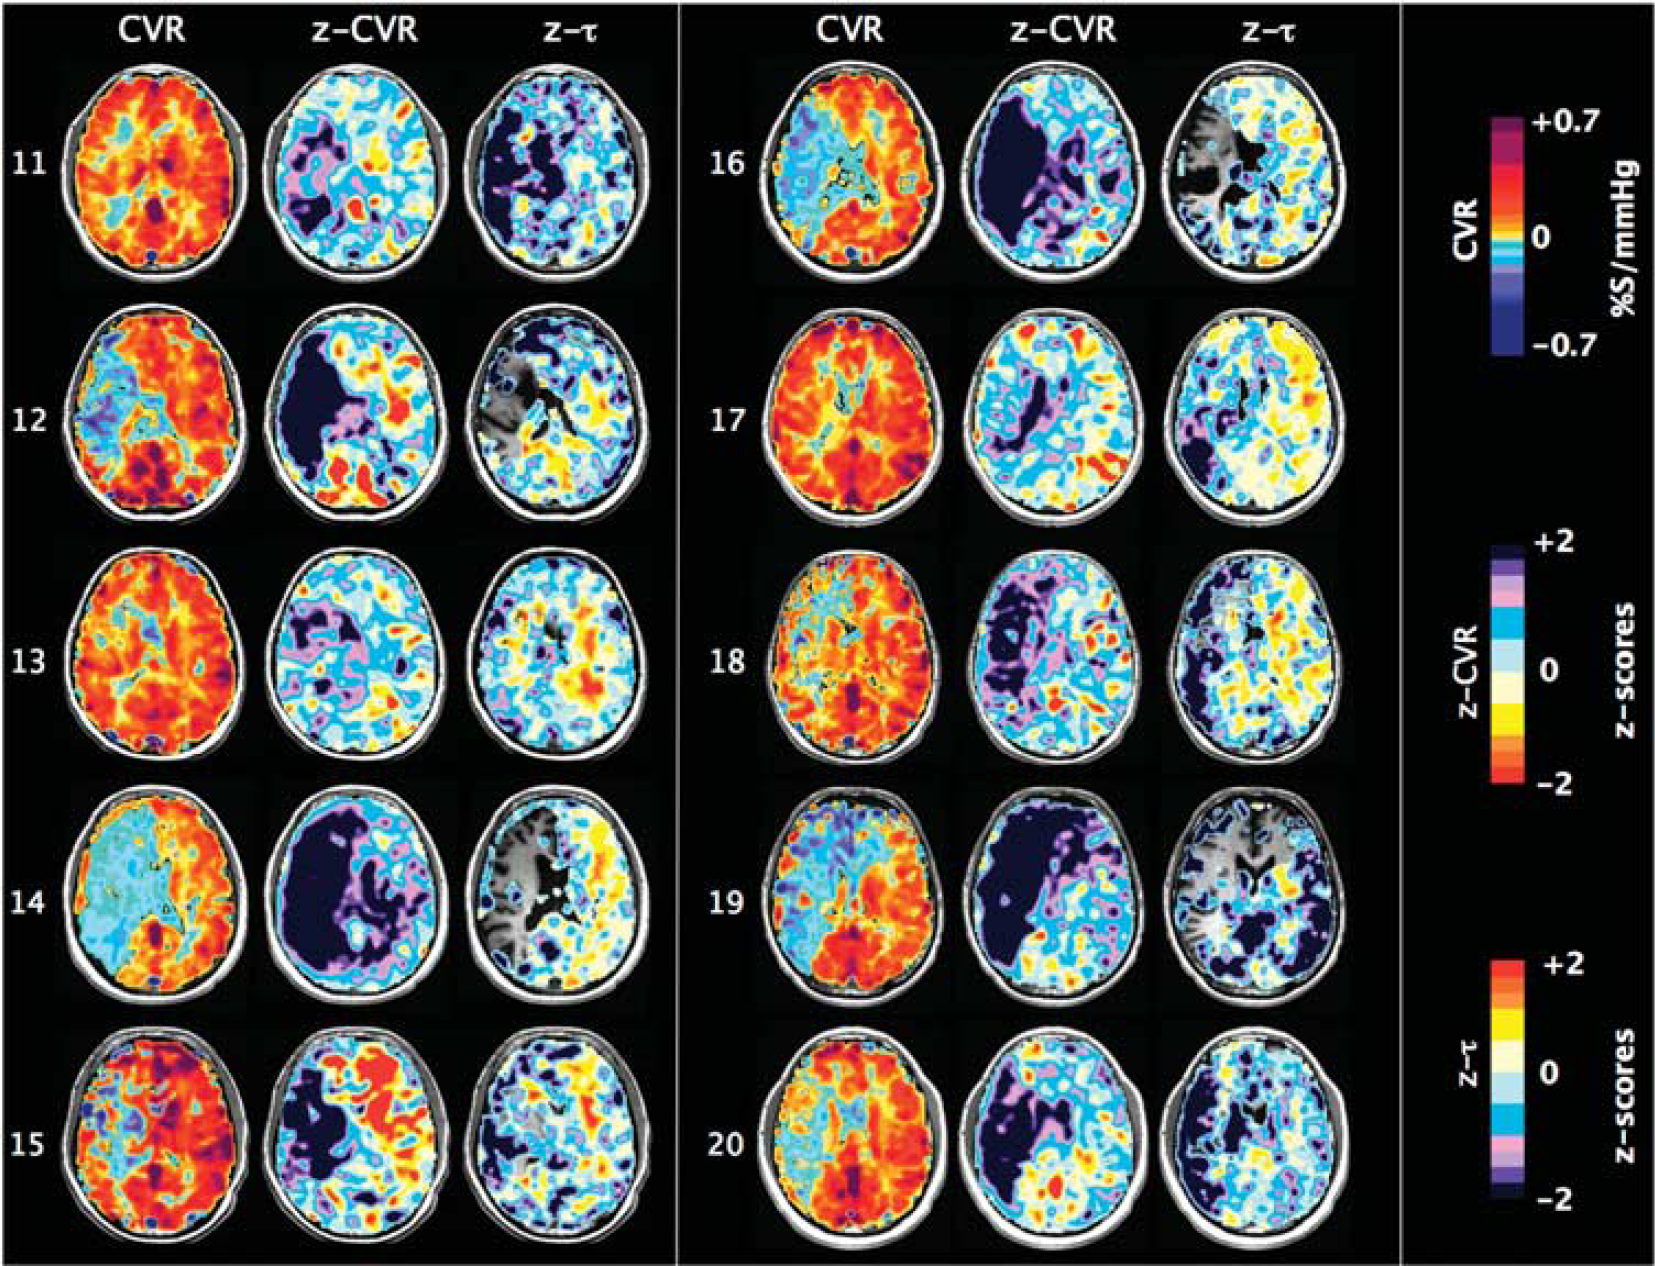
One slice of CVR, z-CVR and z-τ maps for patients number 11 to 20. Patients' characteristics are presented in Table 1.

where
Patient Characteristics
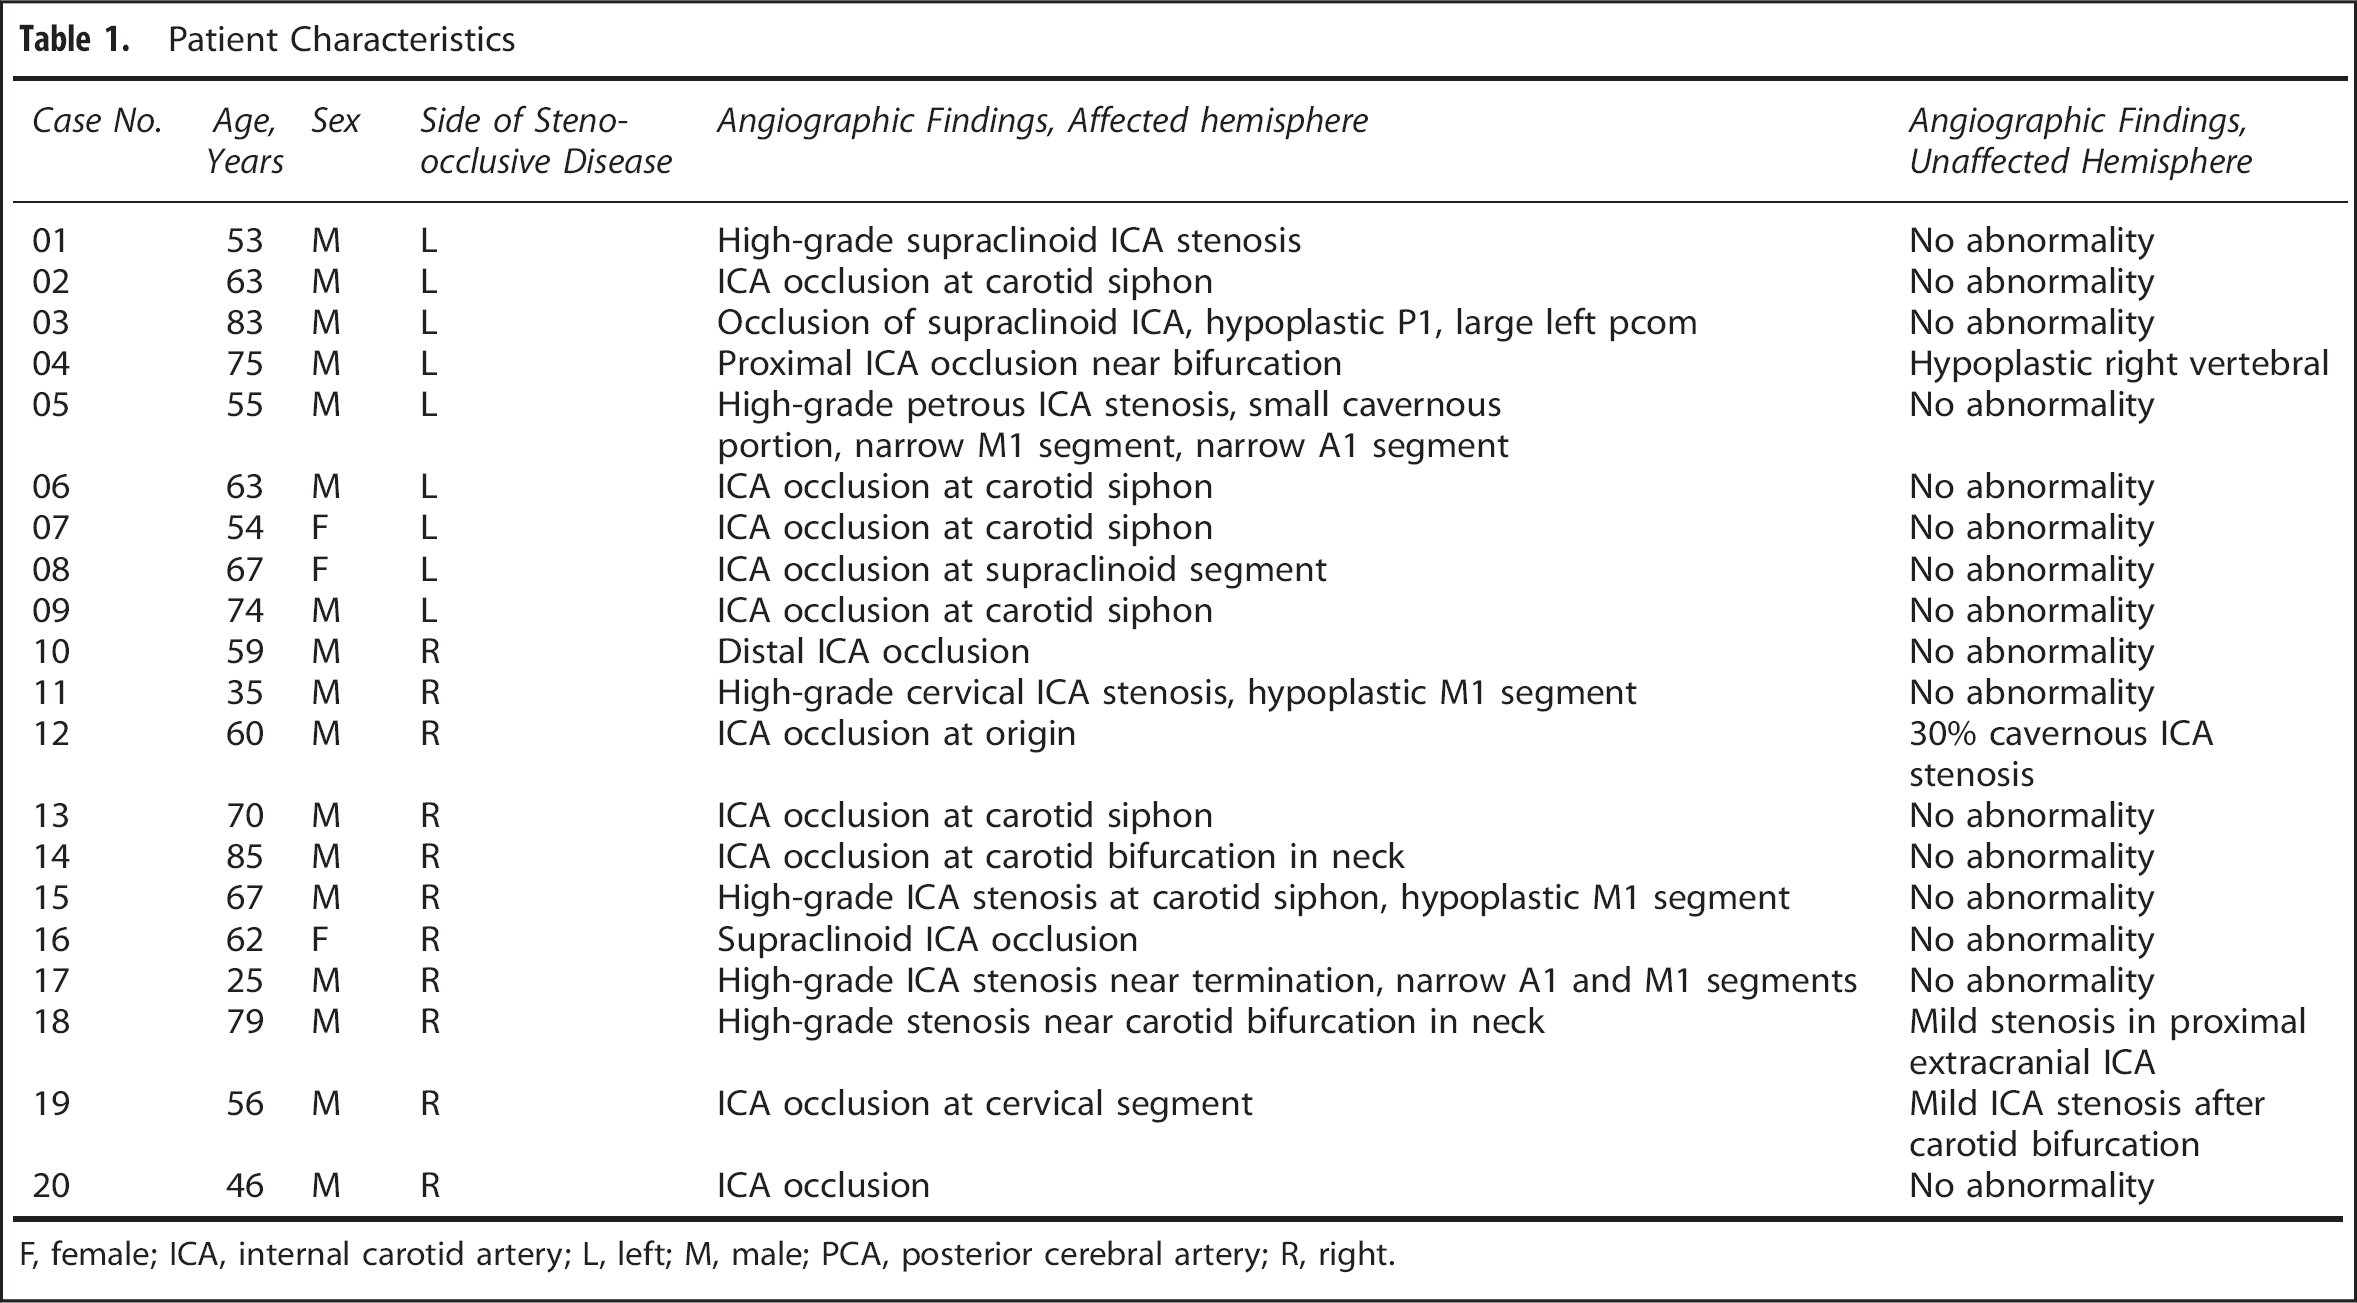
F, female; ICA, internal carotid artery; L, left; M, male; PCA, posterior cerebral artery; R, right.
τ

Note that the operation substitutes the independent variable PetCO2(
Steady-state CVR is calculated by taking the slope of the regression between the convolved PetCO2 and S and can be thought of as the CVR corrected for the speed of the response (τ). In other words, ssCVR represents the time-independent response, with the same units as CVR (% S/mm Hg). Figure 2 illustrates the difference between the traditional measure of CVR and ssCVR and how those differences can affect the reactivity measurements as well as the goodness of the fit.
Equation (2) describes the generation of a set of multiple convolved PetCO2 (CP
where
A Pearson correlation coefficient is then calculated between S and each of the 50 CP
z Maps
The data forming our normal atlases were previously reported by Sobczyk 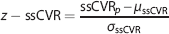

Subscript
RESULTS
Figure 3 is a graphical representation of the atlas mean values of CVR, ssCVR, and τ. Summary data from all patients are provided in Figures 4 and 5 with representative axial slices displaying CVR,
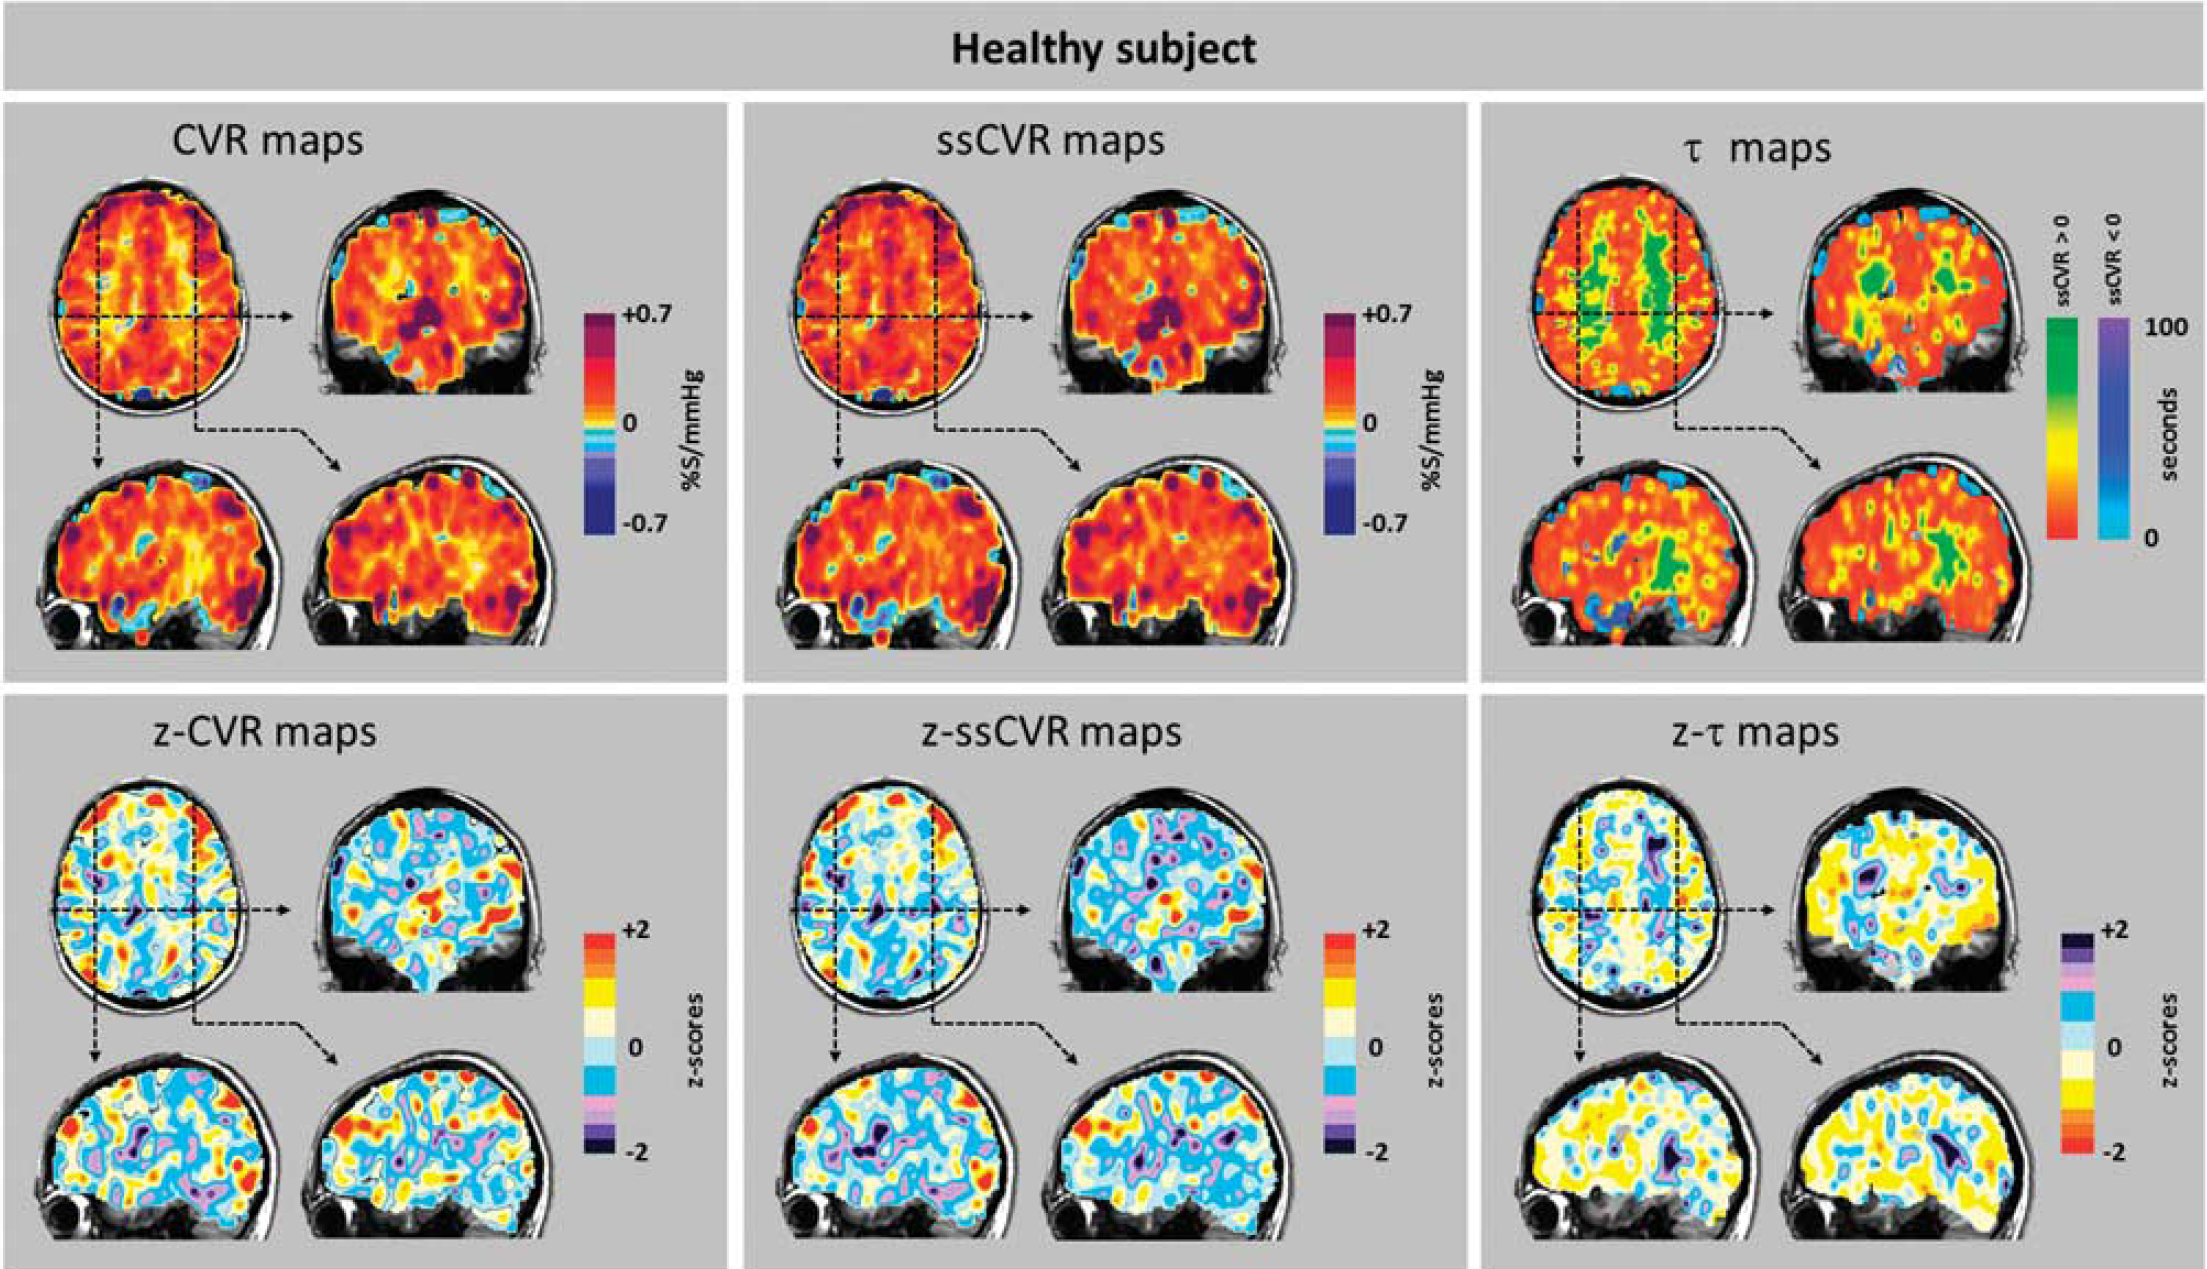
Cerebrovascular reactivity (CVR), steady-state CVR (ssCVR), τ, and respective
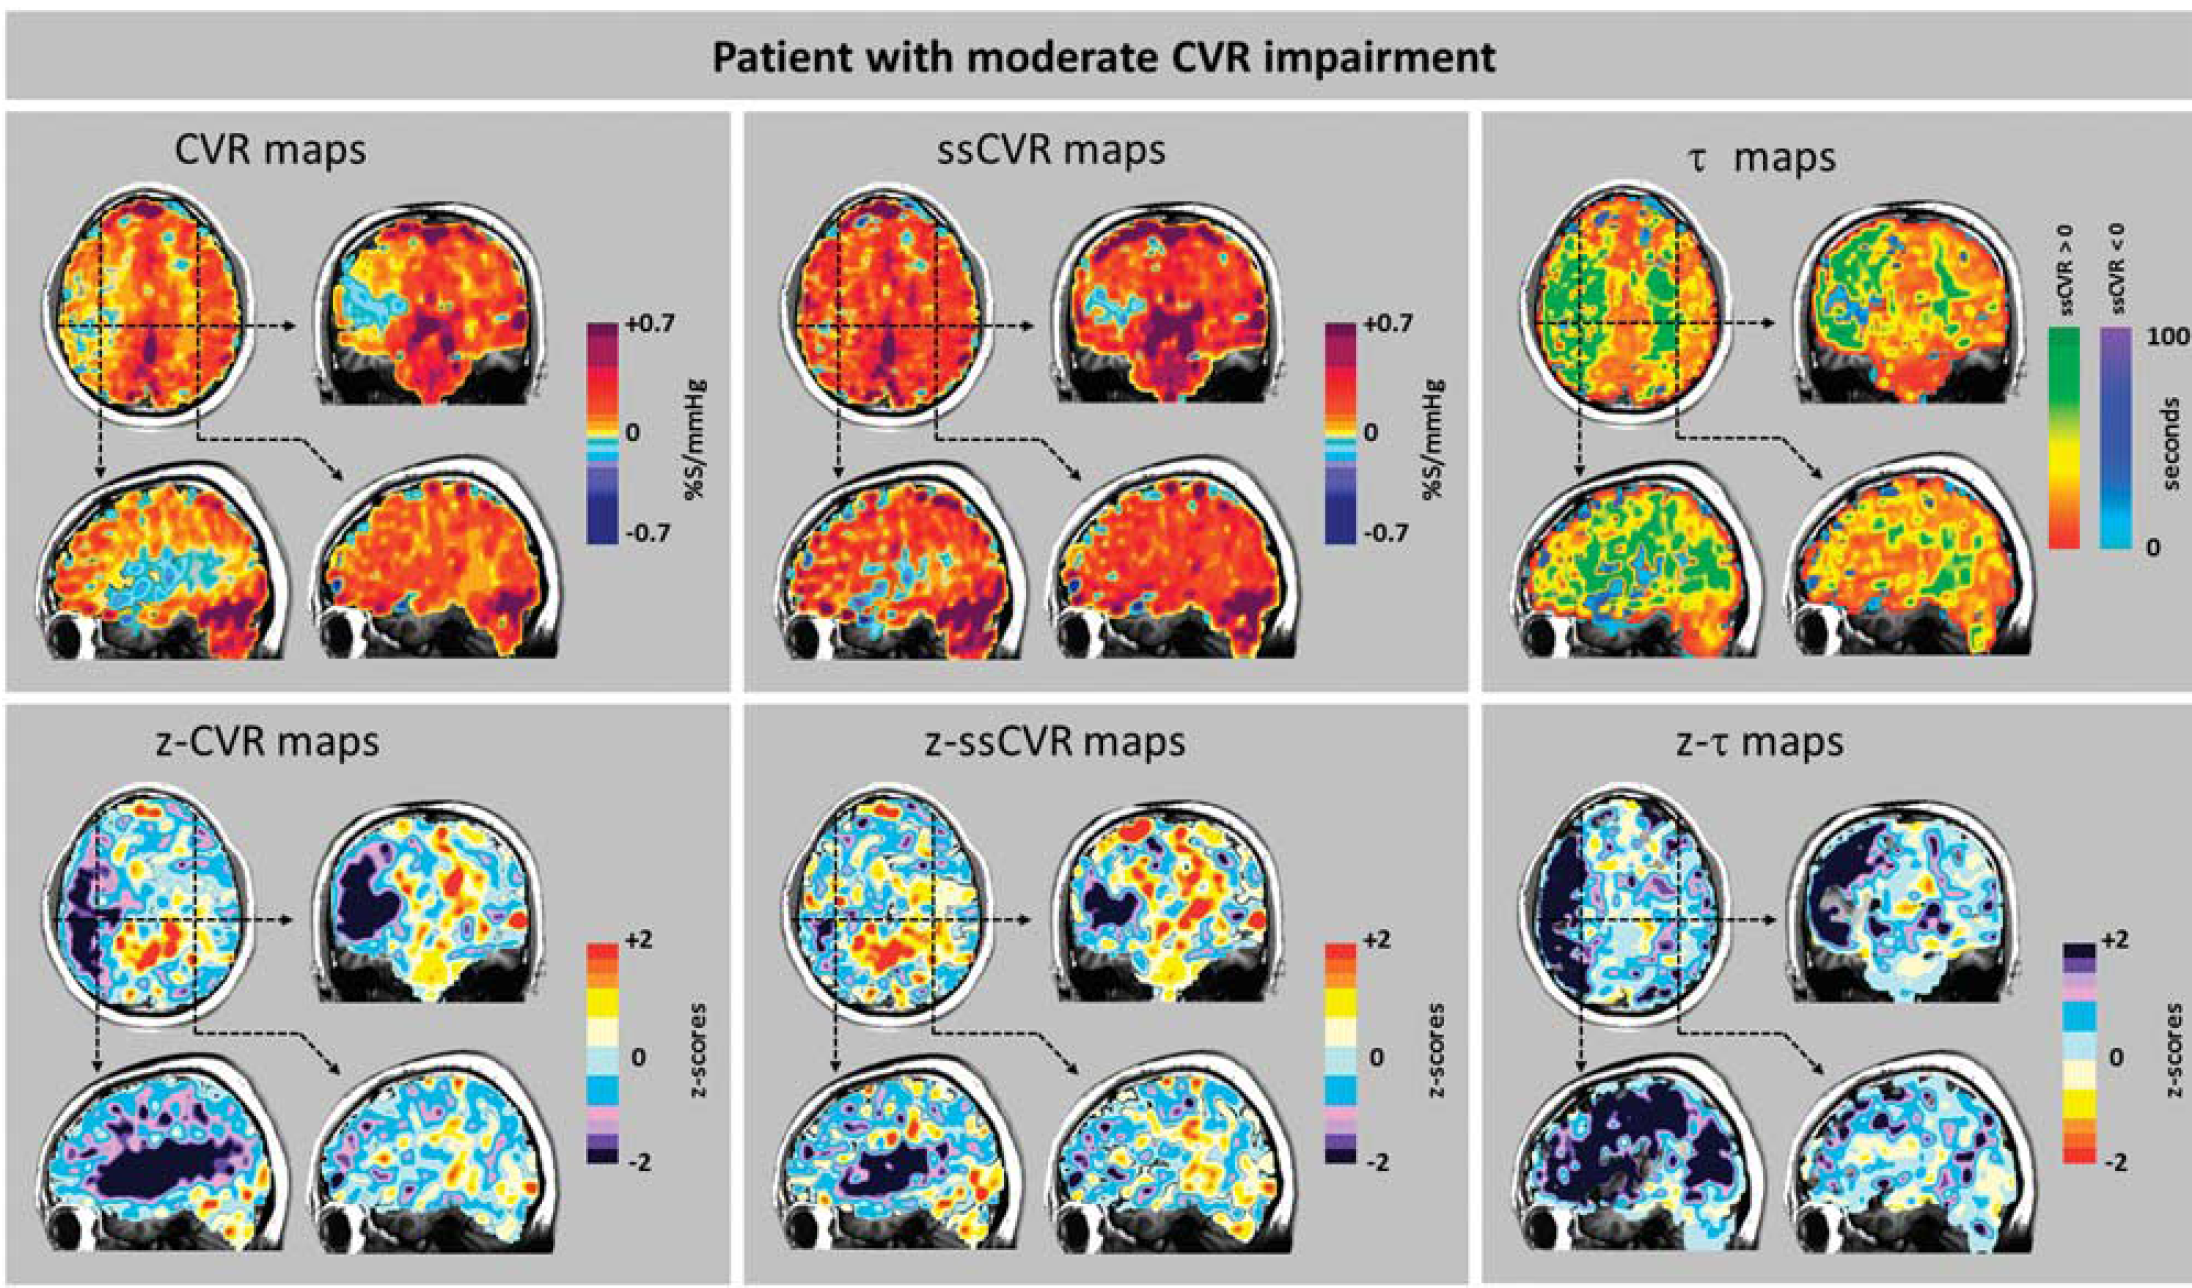
Cerebrovascular reactivity (CVR), steady-state CVR (ssCVR), τ, and respective
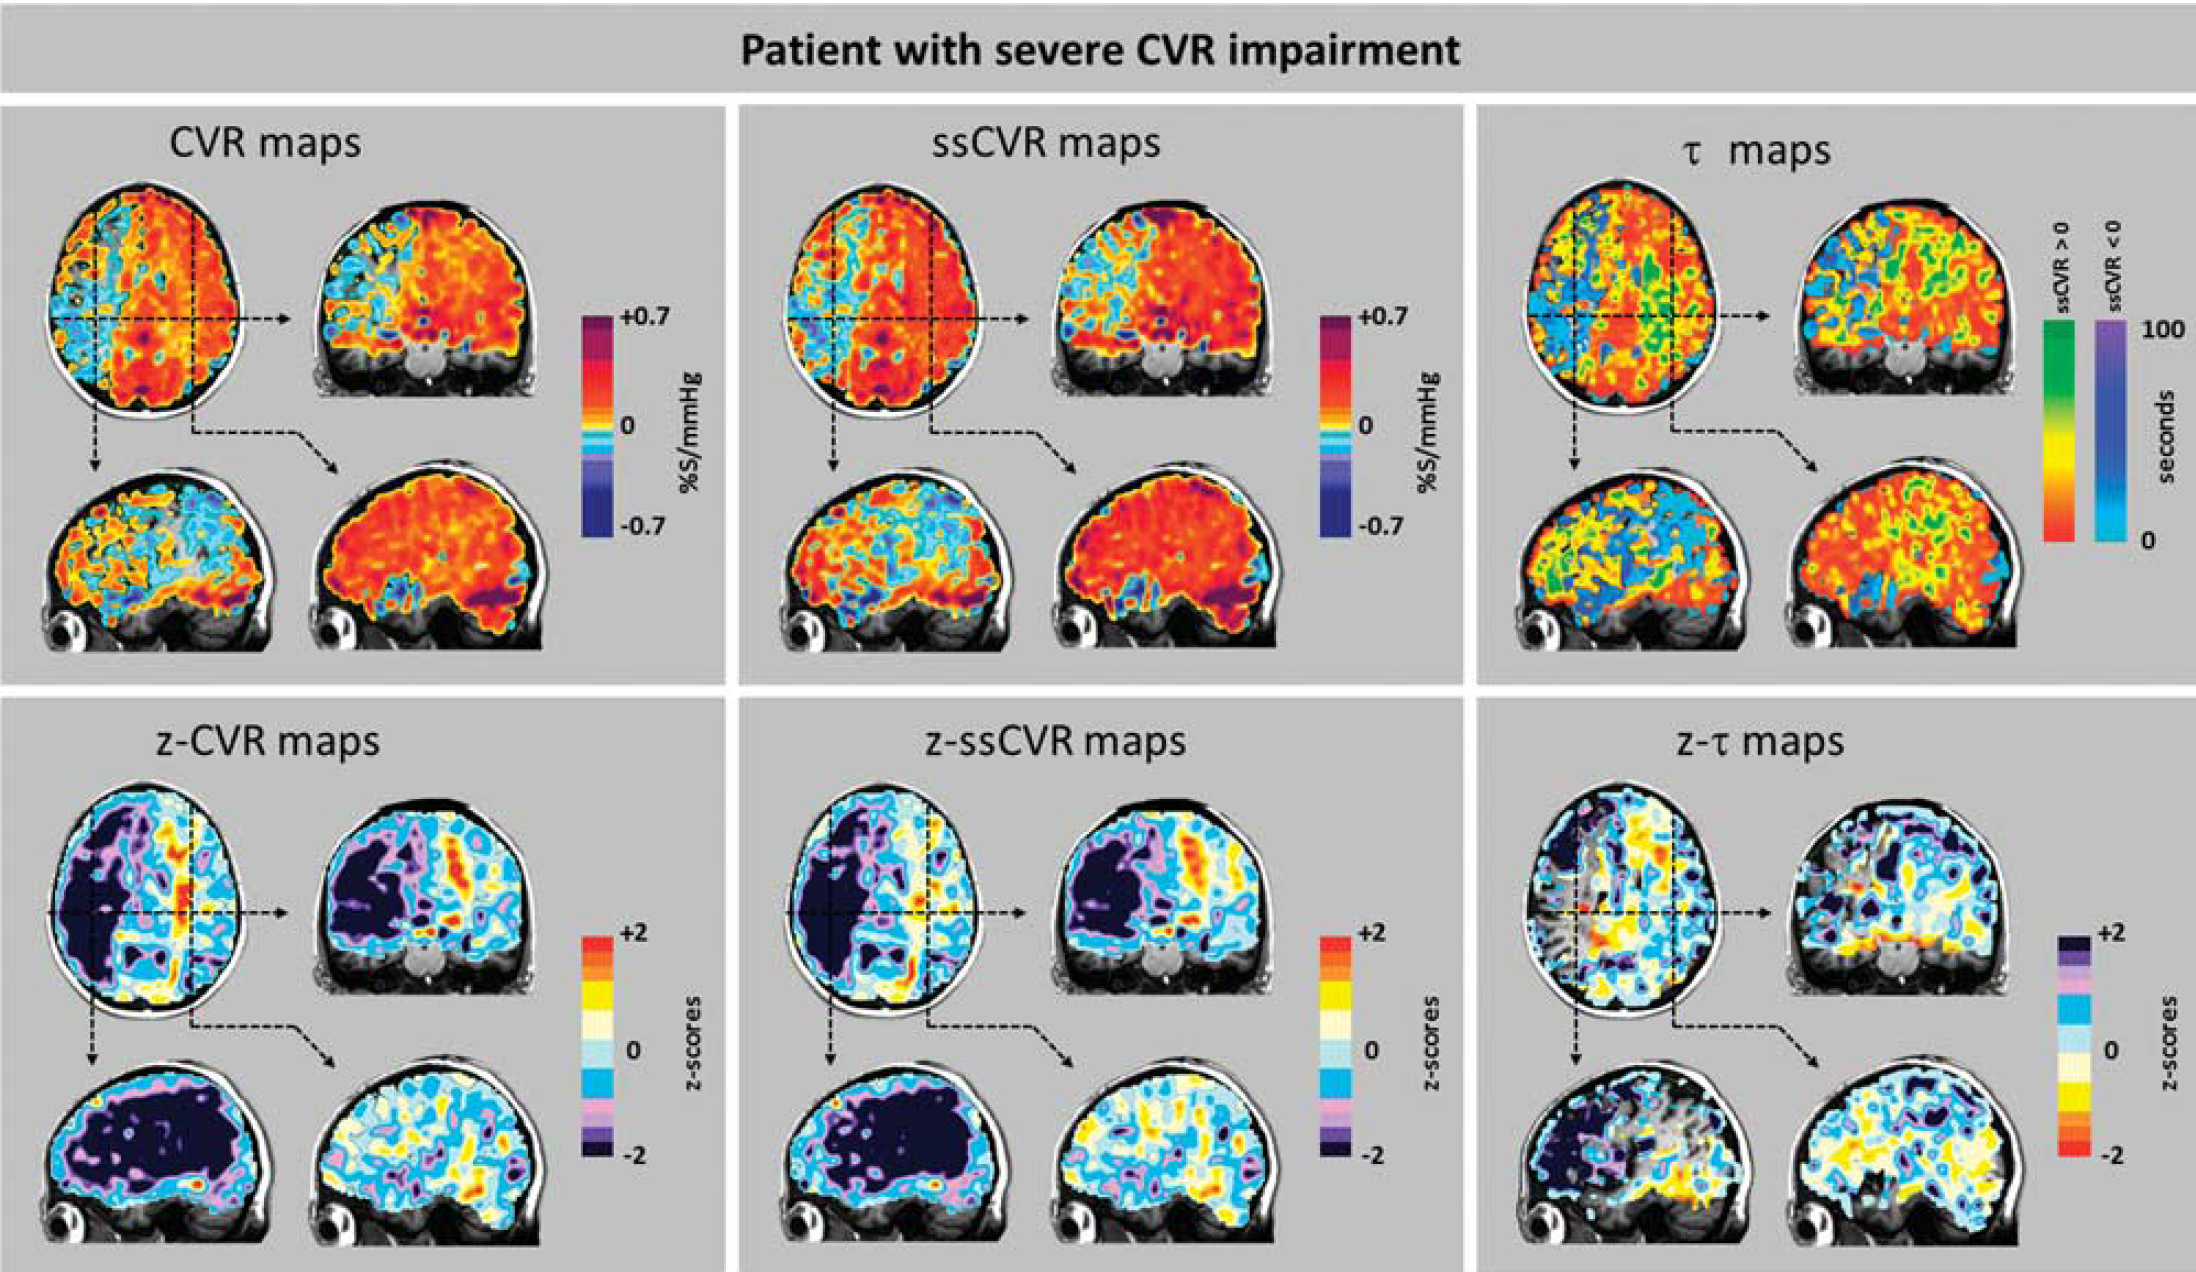
Cerebrovascular reactivity (CVR), steady-state CVR (ssCVR), τ, and respective
In all patients, the BOLD signal achieved a better fit to the convolved PetCO2 than to the actual PetCO2. Figure 2 shows the goodness of fit of the BOLD signal to actual PetCO2 and to convolved PetCO2 in a healthy and compromised voxel. In the same patient (‘Moderate’), the average
Examination of the maps in Figures 6–8 shows that, in general, CVR and ssCVR are smaller, and τ much longer in deep white matter compared with gray matter. All 20 patients showed some degree of ‘steal’ (i.e., reduction in flow from baseline in response to a hypercapnic stimulus) in the hemisphere supplied by the occluded artery; steal occurred predominantly in subcortical white matter. The
Whereas there were prolonged τ in voxels in white matter and some gray matter areas which retained positive CVR, there were, remarkably, reduced τ in the areas with negative CVR. Indeed, τ was shortest in the areas where the reduction in CVR and
In some patients (Figures 4 and 5, patients 1, 2, 4–8, 12, 15), the hemisphere contralateral to that with the carotid artery stenosis showed extensive areas with unusually increased CVR compared with normal. In some of these (patients 1, 5–8), τ was also unusually short compared with normal. However, among those patients where there was a poor CVR response in the contralateral hemisphere, some (1, 5–7, 10, 13, 17, 18) nevertheless had short τ.
Values for ssCVR were generally greater than for CVR, particularly when τ is long. This finding is a consequence of CVR reflecting both the magnitude and the speed of response to a stimulus as illustrated in Figure 2. In the ‘moderate’ patient (Figure 7) CVR was positive but diminished, corresponding to the abnormally long τ values in gray matter of the right hemisphere ipsilateral to the carotid occlusion. However, in the patient with ‘severe’ changes (Figure 8), in addition to the low CVR, long τ and positive ssCVR voxels, there were voxels where ssCVR and CVR are negative, i.e., there is vascular steal.
17
In the latter case, as discussed above, no
DISCUSSION
Main Findings
In this study, we describe a method to calculate the speed of response to a hypercapnic stimulus, designated by the time constant τ of a fit first-order exponential, and the time-independent magnitude of change of the BOLD response, named ssCVR, to a step vasoactive stimulus. The application of the method was illustrated in 20 patients with unilateral steno-occlusive large cerebral vessel disease. There were various patterns of coherence and discordance of CVR, ssCVR and τ in both the ipsilateral and contralateral hemispheres. It is therefore apparent that they do not measure exactly the same parameter of vascular physiology. We found that τ was characteristically prolonged in areas downstream from high-grade carotid stenosis while it remained closer to the normal range in the contralateral hemisphere.
τ as an Indicator of Abnormal Cerebrovascular Response
Cerebral vascular reactivity is, by definition, dynamic and it is appropriate to seek to characterize its speed of response. To examine the relationship between CVR and τ, we deliberately chose patients with known unilateral cerebrovascular disease, normal structural MRI scans, and abnormal vascular responses in the form of abnormal CVR. We considered that the presence of unilateral disease and abnormal CVR would allow comparisons of τ in areas of known vascular compromise (ipsilateral to the carotid artery occlusion), to the normal vasculature of the contralateral hemisphere in the same subject. 11 Indeed, in our patients, the distribution of severely abnormal CVR and τ was consistent with the location of the lesion shown by angiography in all 20 subjects. We suggest that the large contiguous swaths of abnormal voxels of CVR and τ consistent with each other and with angiographic findings are highly unlikely to occur by chance and more likely to result from common underlying vascular pathology.
While reductions in CVR have long been suspected to occur in dementia, reductions in the rate of vascular response have now been shown to be the strong markers of the disease.16,29 Since our method of comparison to an atlas appears to have been sufficiently sensitive to identify abnormal reductions in CVR and lengthening of τ in individual patients with steno-occlusive vascular disease, we suggest that this method may confer the same advantages in assessing patients with dementia.
Universally Accessible Data: z Scoring Relative to a Site-Specific Reference Cohort
This study, as that by Sobczyk
Normalizing data relative to a reference atlas was introduced by Minoshima
Rather than thresholding voxels of CVR, ssCVR, and τ, we provide the range of their respective
The Importance of a Standard Stimulus
All methods of quantifying the time constants of response require the fitting of a response signal to an input signal. In previous studies, the input signals were inexact, consisting of timing ‘on/off’ for the presence or absence of inspired CO2,16,29 or used the PetCO2 as an inexact surrogate for the PaCO2.14,15 Furthermore, administering the CO2 stimulus by changing the
Our system of administering the stimulus conveyed three novel and advantageous features to the study. First, the targeting system provided a consistent stimulus to all subjects and patients. The standardized stimulus substantially reduced the subject to subject variability in CVR, enabling the generation of an atlas from the healthy cohort and comparison of the patients with the atlas. Second, the end-inspiratory rebreathing feature of the system equalizes the PetCO2 with the PaCO2 enabling noninvasive breath by breath access the true input signal. Finally, the system applied a rapid step change input signal. Although the time course of signal change is affected by both the rate of change of PCO2 in the lung, and that of the vessels, in our study, the rate of change in lung PCO2, and hence in the arterial blood, was a true step; the observed τ can therefore be attributed predominantly to the speed of response of vessels.
Application of Cerebrovascular Reactivity and its Dynamic Parameter to Other Neurovascular Disease
The findings in our cohort are explained by our model 17 of steno-occlusive disease causing widespread downstream loss of vasodilatory reserve, resulting in steal, and abnormal τ and ssCVR in remaining areas with positive CVR. However, vasodilatory reserve can be lost in other ways such as through infectious disease, particularly those related to herpes zoster, 33 noninfectious inflammatory conditions, 34 drug reactions, 35 neoplastic changes, 36 dementia, 29 and traumatic brain injury. 37 We anticipate that studies of τ in these conditions may further elucidate the vascular component of their underlying pathophysiology.
Limitations
In comparison with anatomic and structural imaging, these functional tests have a unique set of challenges. They cannot be validated with independent measures such as angiography or consistency with clinical history or physical signs on examination. Cerebrovascular reactivity, ssCVR, and τ are indirect measures of vascular function; however, they are not fundamentally different from other well-established functional measures of vascular reactivity in other vascular beds such as brachial artery hyperemia in the arm and uptake of radionucleotides to measure changes in myocardial blood flow in cardiac stress testing.
While the assumption of a single exponential response for the dispersion function is reasonable for a preliminary study, a more rigorous study of the nature of the response may show other relationships, including a biexponential response.
For the
Our subjects were selected for criteria of unilateral disease, normal anatomic scan, and abnormal CVR study and thus are not necessarily representative of all patients with extracranial large vessel disease. Our reference atlas was nonspecific with respect to age, sex, co-morbidities, medication, and other issues. We also did not select our patient cohort for these characteristics. The large intersubject variability in CVR and τ reduces the sensitivity of detection of abnormalities, but conversely increases specificity. It is nevertheless remarkable that we were able to identify pathologic τ in the ipsilateral hemisphere, and normal τ in the contralateral hemisphere in all 20 subjects.
There are a number of considerations with the use of the BOLD signal as a surrogate for CBF in the convolution of the actual PetCO2. The BOLD signal does increase with CBF, but it does so as a result of the dilution of the concentration of deoxyhemoglobin ([dHb]) with oxyhemoglobin as the oxygen extraction fraction decreases, consequently veering from a linear relationship at very high, and very low flows.38,39 A second consideration is the increase of BOLD signal that accompanies the increase in cerebral blood volume (CBV) resulting from hypercapnia. A third consideration is the effect of changes in PaCO2 on cerebral metabolic rate. A fourth issue is that the relationship between change in BOLD and change in PaCO2 is strongly dependent on the baseline PaCO2.10,40 Finally, changes in PaO2 during changes in PetCO2 also affect the BOLD signal.41,42 We address each of these issues in turn.
In this study, BOLD provided a practical surrogate measure for CBF. The sequences to generate the BOLD signal are widely available in clinical magnets. Assuming a linear CBF response to PCO2 over the PaCO2 range of our study,
43
the Davis [dHb] dilution model would predict a fairly linear range of resulting BOLD signal. Indeed, the BOLD signal was strongly correlated with simultaneously measured brain oxygenation using near infrared spectroscopy during hypercapnic stimulation.
44
In normal subjects, the fractional change in baseline CBV/CBV0 = (CBF/CBF0)α where α≈0.29 indicates that its contribution to BOLD is small compared with that of CBF. In the absence of consistent evidence to the contrary, it is also widely assumed that the 10 mm Hg hypercapnic stimulus has not affected the cerebral metabolic rate (see Yezhuvath
Although a true measure of CBF such as ASL would be preferred for measuring CVR, there are issues with current implementations of ASL such as spin tag delay sensitivity that increases with increasing severity of vascular disease rendering CBF measurement less accurate. Halani
CONCLUSION
We introduce a method to calculate the time constant, τ, of the BOLD response to a step increase in a vasoactive stimulus, PaCO2, to characterize the dynamics of cerebrovascular reactivity. We illustrate the results of this analysis in a cohort of 20 patients with known unilateral carotid artery occlusion and abnormal vascular response assessed with CVR. We found that τ was prolonged in areas downstream from high-grade carotid stenosis, while the contralateral hemisphere was consistently spared. Abnormality was assessed with
We conclude that τ, or the speed of response, and ssCVR, the steady-state magnitude of response to a stimulus, provide information about aspects of vascular reactivity that otherwise cannot be discerned from the usual measure, the CVR.
Footnotes
JP contributed to study concept and design, analysis and interpretation, writing of the manuscript. APC contributed to study concept and critical revision of the manuscript for important intellectual content. OS, KS, DMM, PD, LV, JD and DJM contributed to critical revision of the manuscript for important intellectual content. GM contributed to Figures' design and critical revision of the manuscript for important intellectual content. JAF contributed to study concept and design, writing of the manuscript, and study supervision.
RespirAct is currently a noncommercial research tool assembled, and made available by Thornhill Research Inc. (TRI), a spin-off company from the University Health Network, to research institutions to enable CVR studies. JAF is the Chief Scientist and JD is the Senior Scientist at (TRI), and JP, OS, APC, DJM, and DMM have contributed to the development of RespirAct and have received payments from, or shares in, TRI.
ACKNOWLEDGMENTS
The authors thank the Toronto Western Hospital RespirActTM technologist Tien Wong, as well as the MR imaging technologists, Eugen Hlasny and Keith Ta, for their contributions to the data acquisition.
References
Supplementary Material
Please find the following supplemental material available below.
For Open Access articles published under a Creative Commons License, all supplemental material carries the same license as the article it is associated with.
For non-Open Access articles published, all supplemental material carries a non-exclusive license, and permission requests for re-use of supplemental material or any part of supplemental material shall be sent directly to the copyright owner as specified in the copyright notice associated with the article.