
Abstract
Attribution of vascular pathophysiology to reductions in cerebrovascular reactivity (CVR) is confounded by subjective assessment and the normal variation between anatomic regions. This study aimed to develop an objective scoring assessment of abnormality. CVR was measured as the ratio of the blood-oxygen-level-dependent magnetic resonance signal response divided by an increase in CO2, standardized to eliminate variability. A reference normal atlas was generated by coregistering the CVR maps from 46 healthy subjects into a standard space and calculating the mean and standard deviation (s.d.) of CVR for each voxel. Example CVR studies from 10 patients with cerebral vasculopathy were assessed for abnormality, by normalizing each patient's CVR to the same standard space as the atlas, and assigning a
Introduction
Cerebrovascular Reactivity
The measurement of cerebrovascular reactivity (CVR), whereby a strong vasoactive stimulus is applied to expose occult clinical limitations in regional cerebral blood flow (CBF) reactivity,
1
constitutes a cerebrovascular stress test. Quantitatively, CVR is defined as the change in CBF in response to a measurable stimulus. A surrogate high-resolution measure of changes in CBF can be obtained by exploiting the blood-oxygen-level-dependent (BOLD) effect of magnetic resonance imaging (MRI). A measurable increase in the end-tidal partial pressure of CO2 (P
Clinical Aspects of Cerebrovascular Reactivity Maps
Of particular interest in the CVR maps are areas of paradoxical reductions in flow after the application of a vasodilatory stimulus, termed as ‘steal’. Steal has been shown to exist in deep white matter in healthy people, 3 in CVR maps of patients with steno-occlusive vascular disease, 4 and with pathologic conditions including arteriovenous malformations 5 and vasculitis. 6 Steal physiology is associated with cortical thinning, 2 white matter microangiopathic disease, 7 cognitive decline,8, 9 and enhanced risk of stroke.10, 11
Detecting Vascular Pathophysiology with Cerebrovascular Reactivity Maps
Whereas the presence of steal is highly specific for identifying compromised CVR, the absence of steal does not necessarily imply normal CVR. For example, CVR may be considerably reduced, but steal is absent if the stimulated demand fails to exceed its supply capacity. Alternatively, if the reduction of CVR is widespread and uniform, rather than localized, a differential in vasodilatory capacity between vascular territories may not exist and therefore, steal may not occur. 1 Steal may also not occur if compromised vessels maintain some vasodilatory reserve. Under these conditions, the absolute value of CVR may be less than ‘normal’ but the extent of reduction cannot be assessed unless the normal range of CVR is known for each anatomic location.
The range of CVR across healthy subjects is large because of factors such as age 12 and gender, 13 and varies within subjects from region to region. Thus, even substantial reductions in CVR in one region will overlap with normal values in another, making it challenging to distinguish reduced CVR because of pathophysiology from normally low CVR. Because the interpretation and assessment of CVR maps currently relies on subjective assessments, it is difficult to identify reduced CVR short of that causing ‘steal’.
Aim of the Study
The aim of this study was to enhance the interpretation of CVR maps by applying an objective scoring system for CVR by statistical comparison to a reference cohort of healthy individuals. To show the effectiveness of the scoring system we examined the CVR of 10 patients with known cerebrovascular disease.
Materials and Methods
Subjects and Ethical Approval
These studies conformed to the standards set by the latest revision of the Declaration of Helsinki. All studies were approved by the Research Ethics Board of the University Health Network and all subjects gave written informed consent. We recruited 46 healthy volunteers for the creation of the reference CVR atlas by advertisement and word of mouth. This cohort consisted of subjects of both sexes and any age who claimed to be in good health, denied a history of neurologic disease, were nonsmokers, and were taking no medication. They were asked not to engage in heavy exercise or drink caffeinated drinks on the day of the scan. The characteristics of these subjects are presented in Table 1. We then drew examples from 10 patients in our database of the research ethics board-approved CVR studies in patients with known symptomatic cerebrovascular disease. 14 They were selected without regard for age, sex, diagnosis, or findings on vascular imaging or CVR studies. All 10 patients were chosen and grouped before any of their data was analyzed. None were rejected after analysis.
Demographic of healthy subject atlas
F, female; M, male.
Experimental Protocol
Hypercapnic Stimulus
The implementation of prospective end-tidal gas control has been described in detail elsewhere.
15
In brief, subjects were fitted with a face mask, and connected to a sequential gas delivery breathing circuit.
16
The patterns of P
We chose a nonperiodic stimulus function so that a steal effect (reversed sign amplitude) would not be confused with a simple delay in response close to half the period of a periodic function. However, the exact characteristics of the stimulus is unimportant as long as the independent variable (PaCO2) is known, is repeatable with high fidelity, and is the same between patients and atlas subjects.
We chose a fixed baseline PCO2 of 40 mm Hg because this resting value is found in most subjects. In some subjects this PCO2 will be higher than their resting PCO2 and affect their CVR measures,
1
but the same conditions apply to the atlas subjects and therefore will be accounted for when assessing the normal range of CVR. For the healthy and patient cohorts the mean and standard deviation (s.d.) change in P
Magnetic Resonance Imaging Protocol for Cerebrovascular Reactivity Map generation
Magnetic resonance imaging was performed with a 3.0-Tesla HDx scanner using an eight-channel phased-array receiver coil (Signa; GE Healthcare, Milwaukee, Wisconsin), and consisted of BOLD acquisitions with echo planar imaging gradient echo (TR/TE=2000/30 ms, field of view 24 × 24 cm, matrix size 64 × 64, number of frames=254, 39 slices, slice thickness 5 mm, and flip angle=85°). The acquired MRI and P
Analysis of Cerebrovascular Reactivity Maps
Constructing the Magnetic Resonance Imaging Cerebrovascular Reactivity Atlas
Analytical processing software (SPM8; Wellcome Department of Imaging Neuroscience, University College, London, UK; http://www.fil.ion.ucl.ac.uk/spm/software/spm8), was used to coregister each of the individual T1-weighted fast-spoiled gradient echo brain volumes from the healthy cohort into MNI (Montreal Neurological Institute) standard space, as defined by a T1-weighted MNI152 standard template 22 using a 12-parameter 23 affine transformation followed by nonlinear deformations. The calculated transformation for each individual was then applied to the BOLD data.
A spatial smoothing of full-width half-maximum 5 mm was applied to each voxel. Assumption for normality was tested using the Anderson—Darling test (the statistical test for normality provided in AFNI (National Institutes of Health)) with
Cerebrovascular Reactivity z -map generation
The generation of an individual's CVR
Results
Normal Cohort Cerebrovascular Reactivity Characteristics
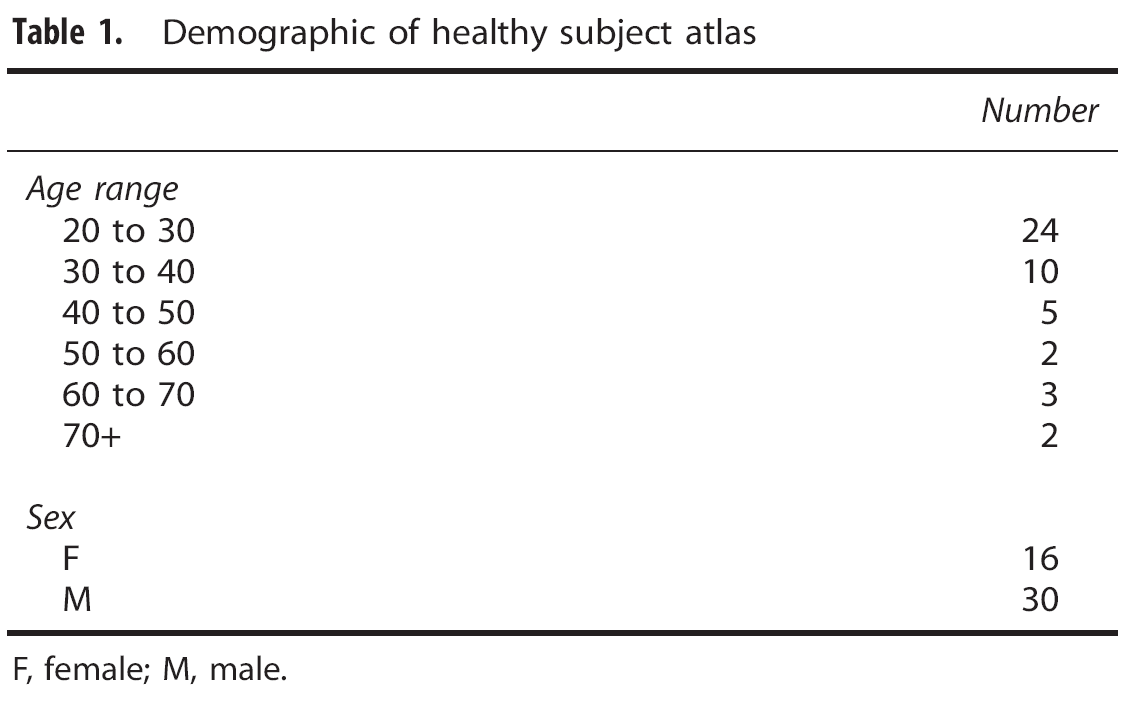
Figure 1 shows maps of the mean CVR and coefficient of variation of the reference atlas. It illustrates the large and complex pattern of regional variability that remains after deliberate smoothing and the effects of misregistration and partial voluming. These color patterns represent the voxel means from which the
Axial slices for the normal cohort atlas displaying spatial distributions. (
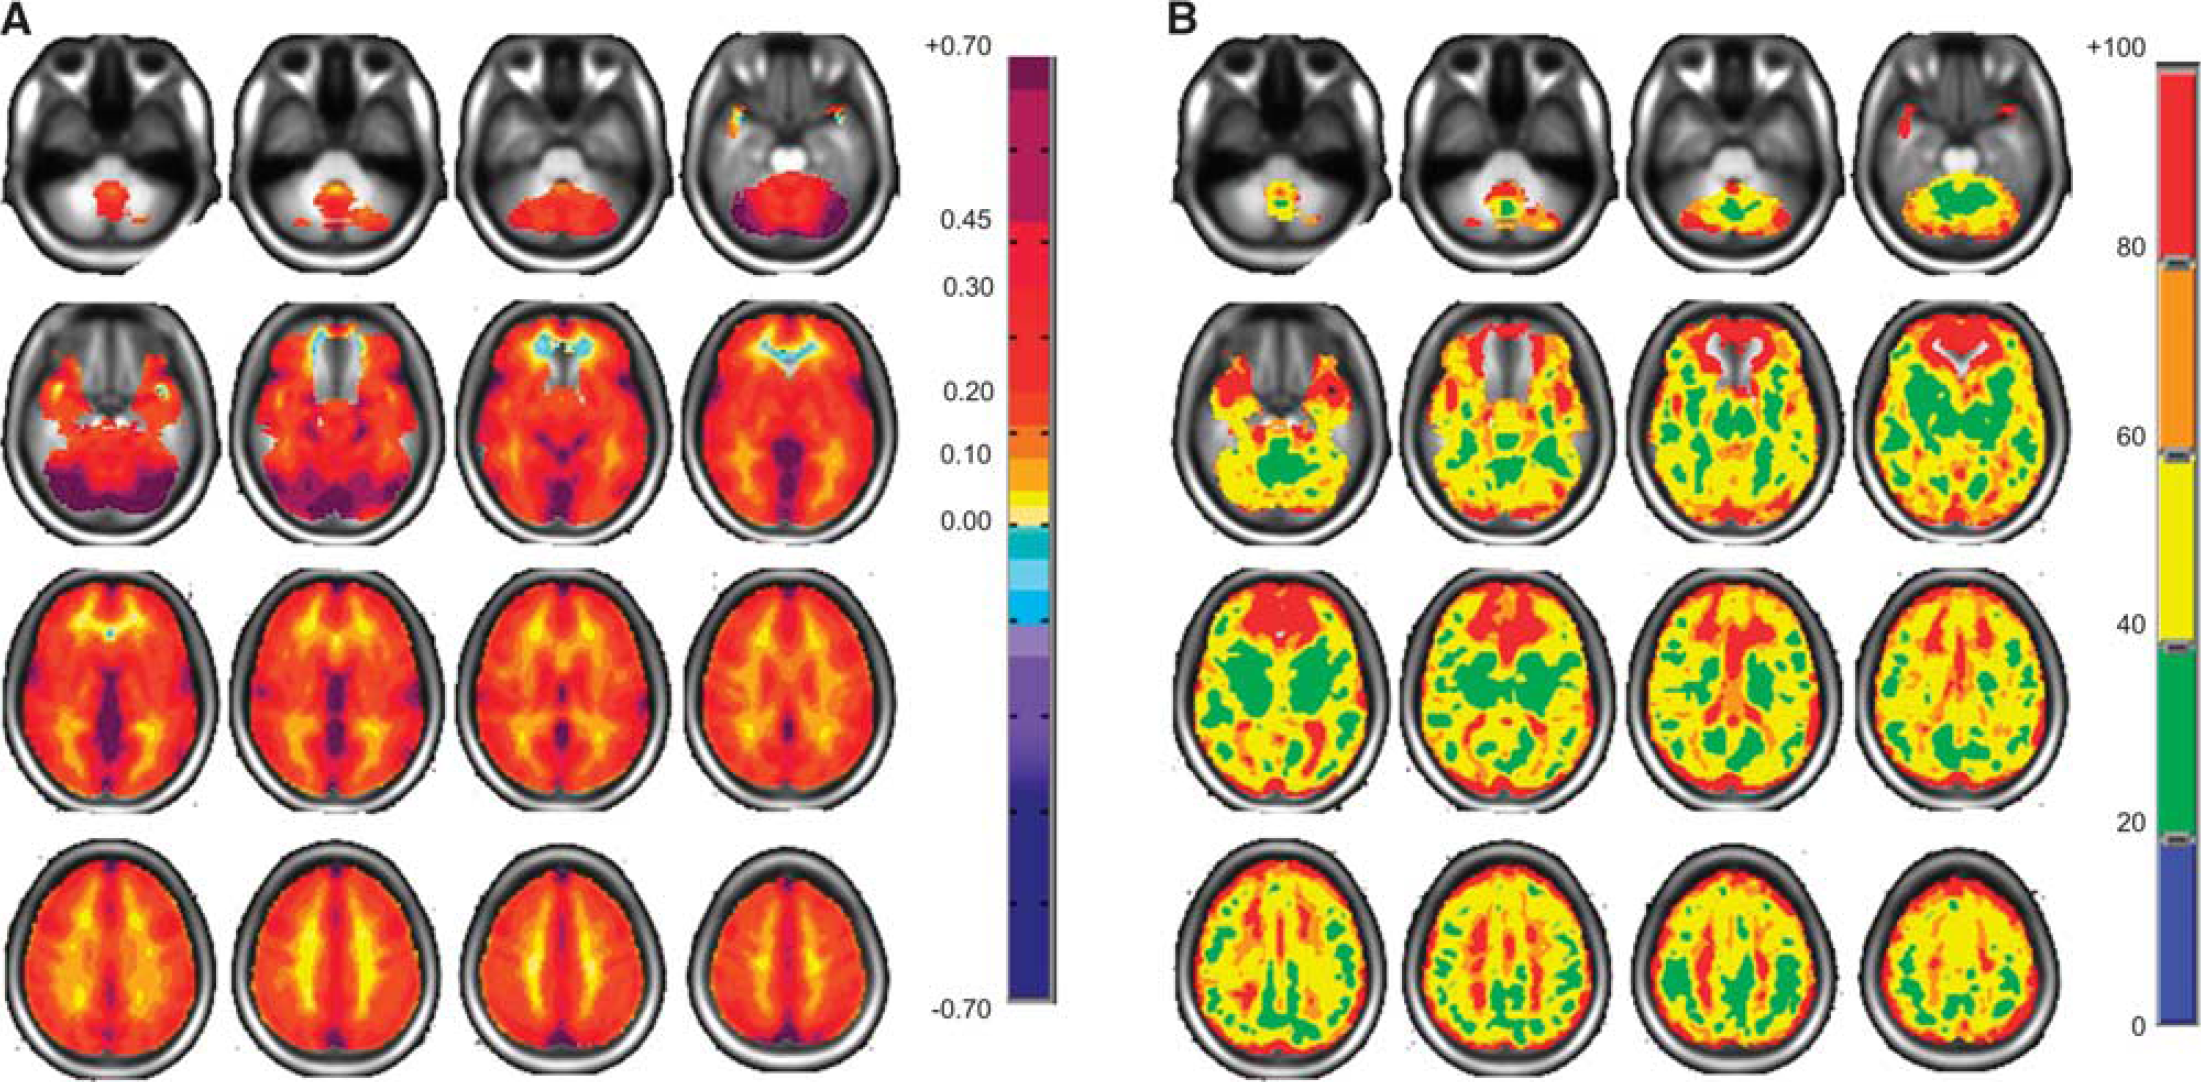
The spatial distribution of the results of the Anderson—Darling statistical test of normality applied to the 46 healthy subjects CVRs graphed into the MNI standard brain is shown in Figure 2. At least 60% of the voxels had a
Axial slices displaying the spatial
Z -Map Examples
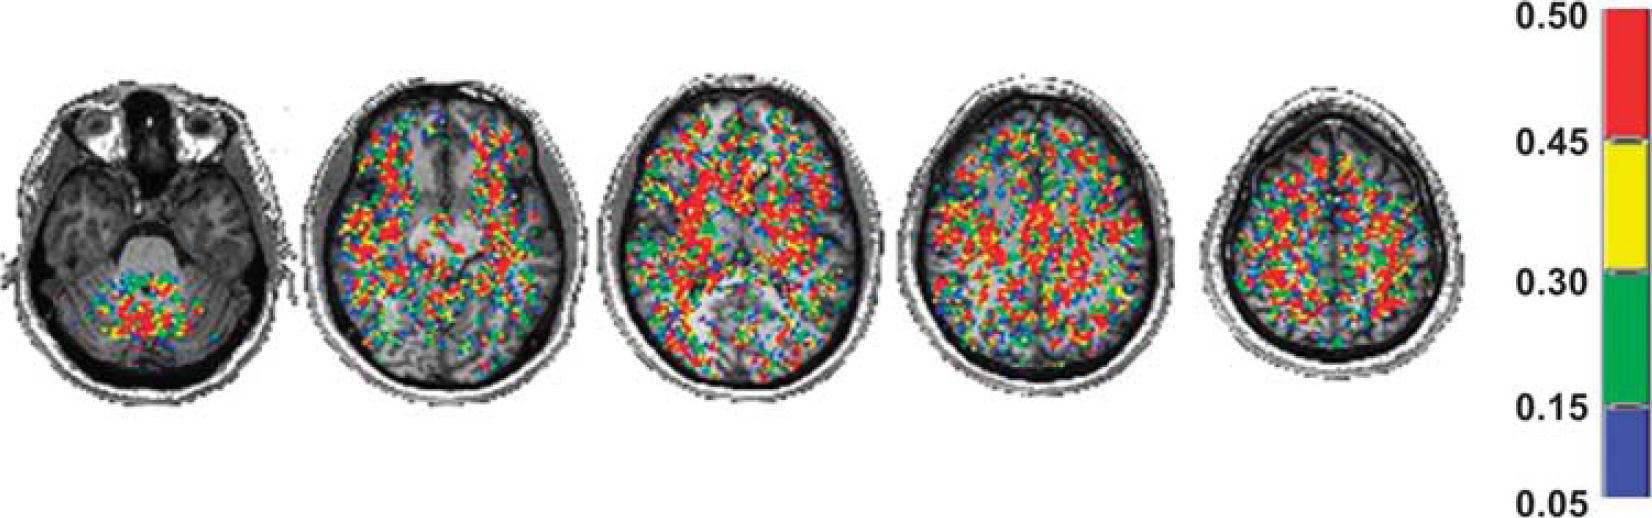
For comparison purposes, we present the CVR and its accompanying
An axial slice from a healthy subject's CVR map is shown on the left displaying the spatial distribution of CVR values colored according to the scale shown on the right in percentage of BOLD change per mm Hg P
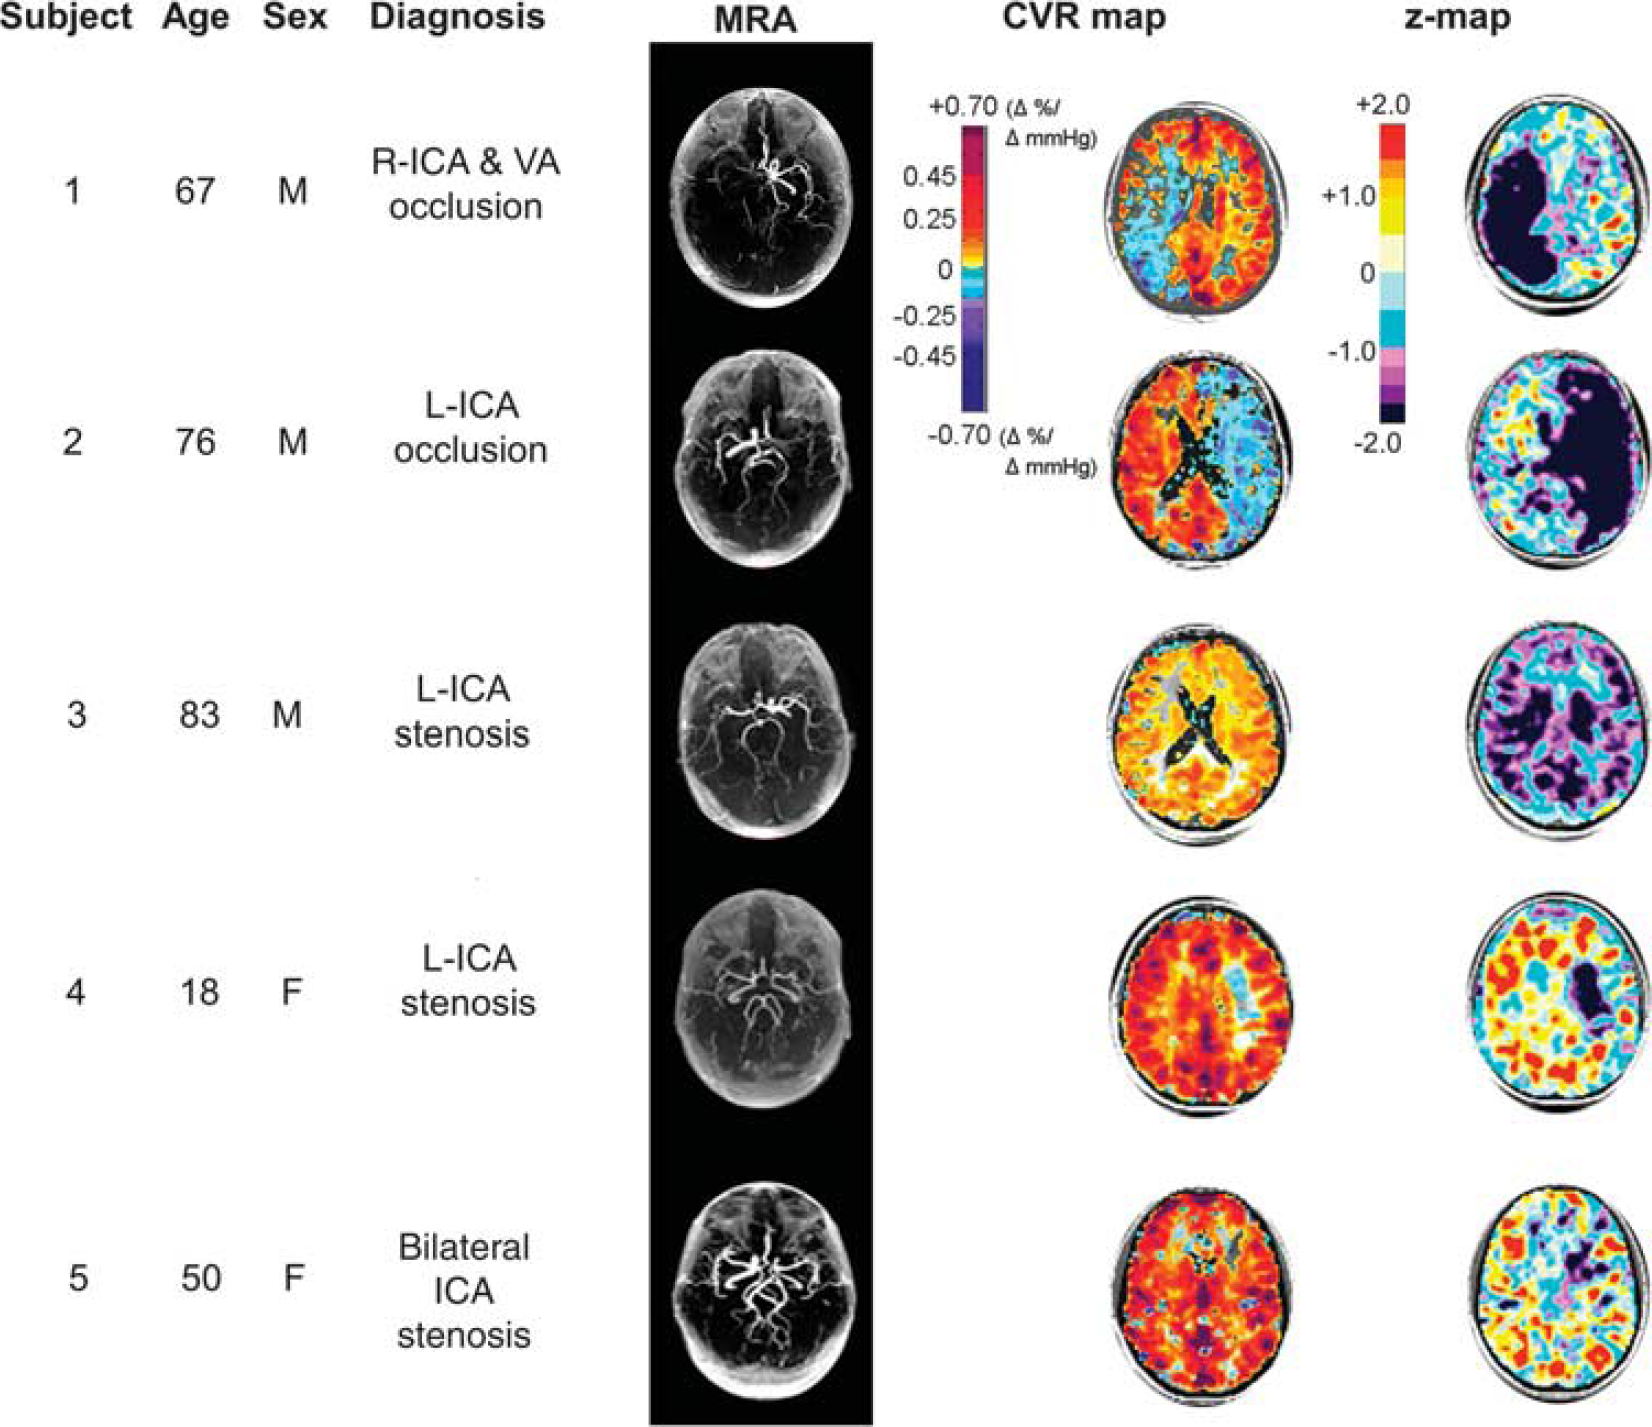
Example set of five patients with varying levels of large vessel cerebral vascular disease chosen from our database and then further analyzed by
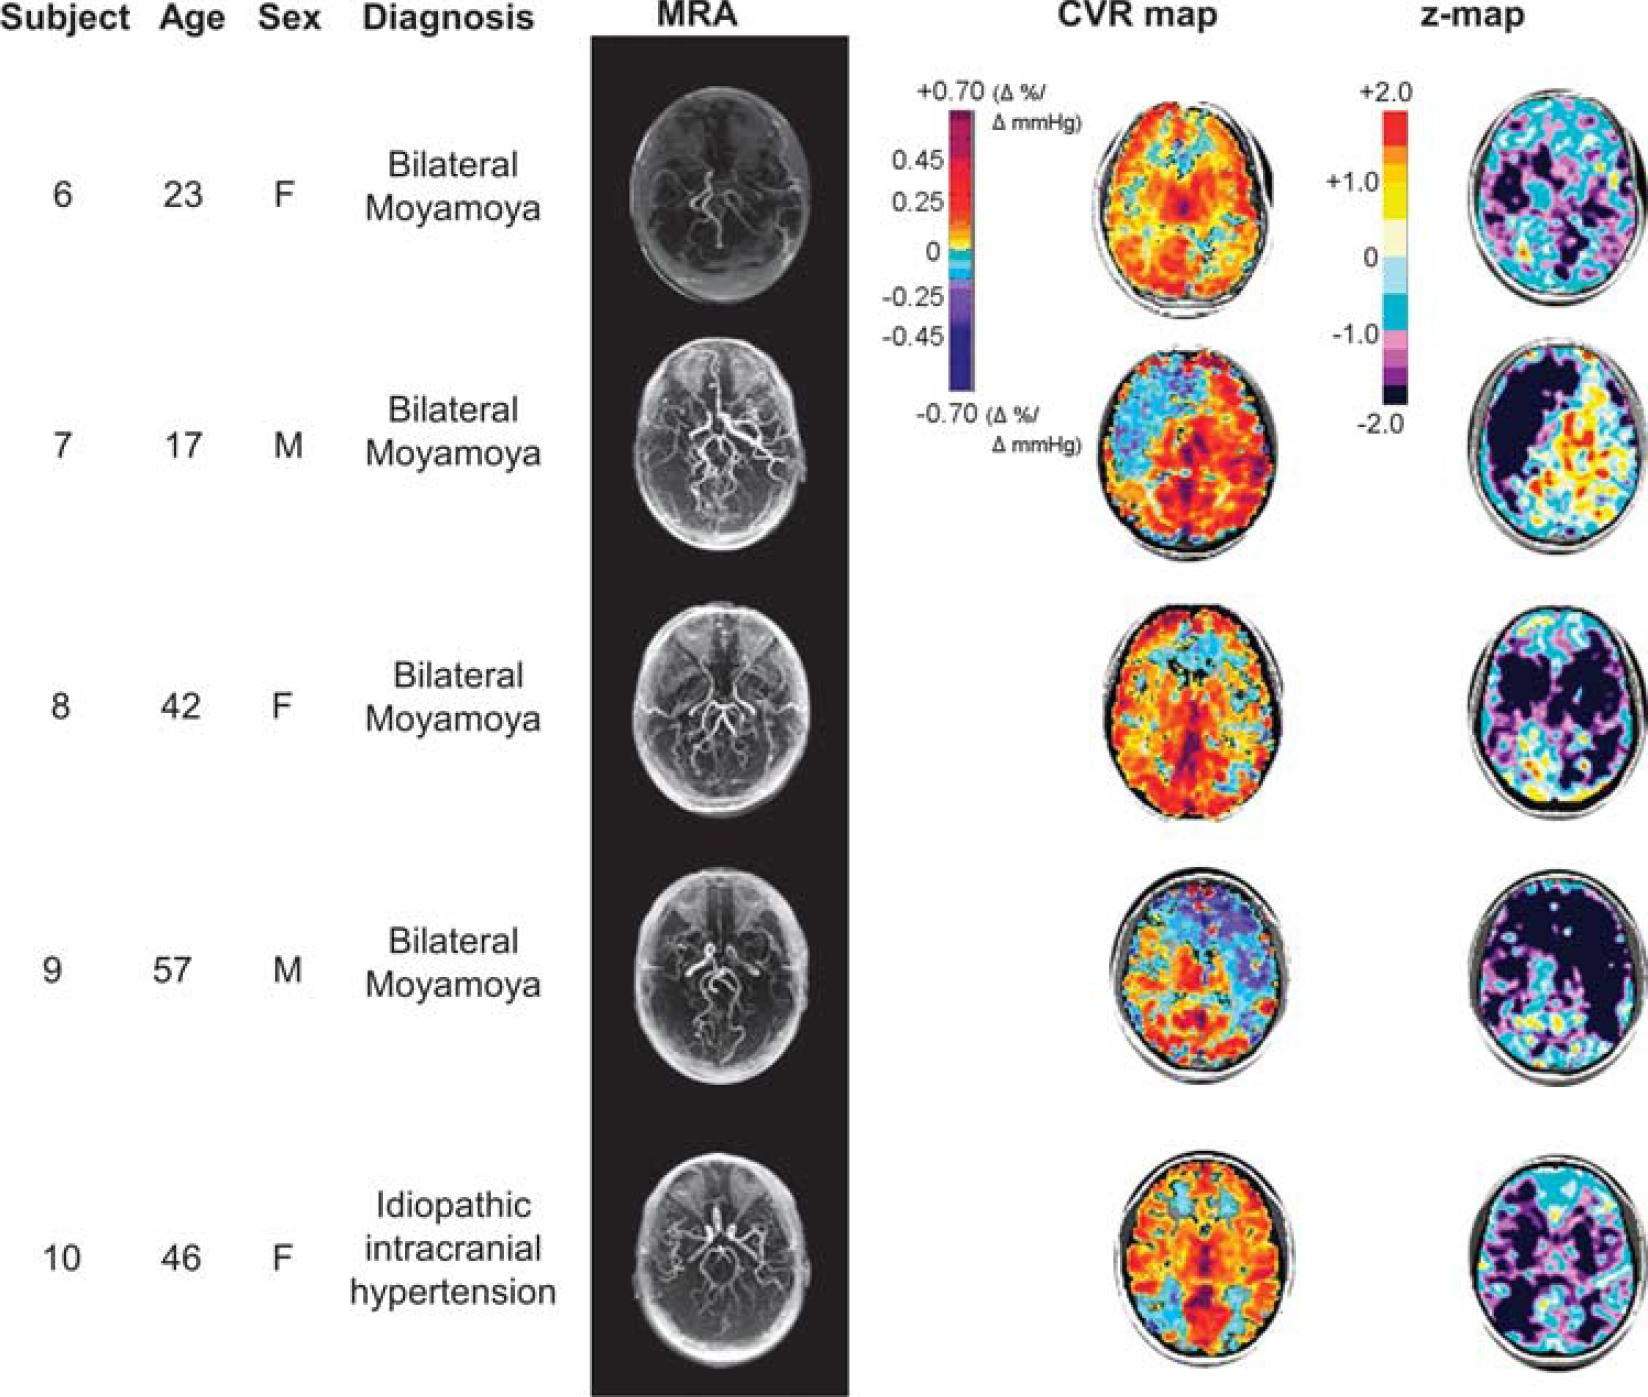
Example set of four patients with Moyamoya disease and one patient with idiopathic intracranial hypertension, chosen from our database and then further analyzed by
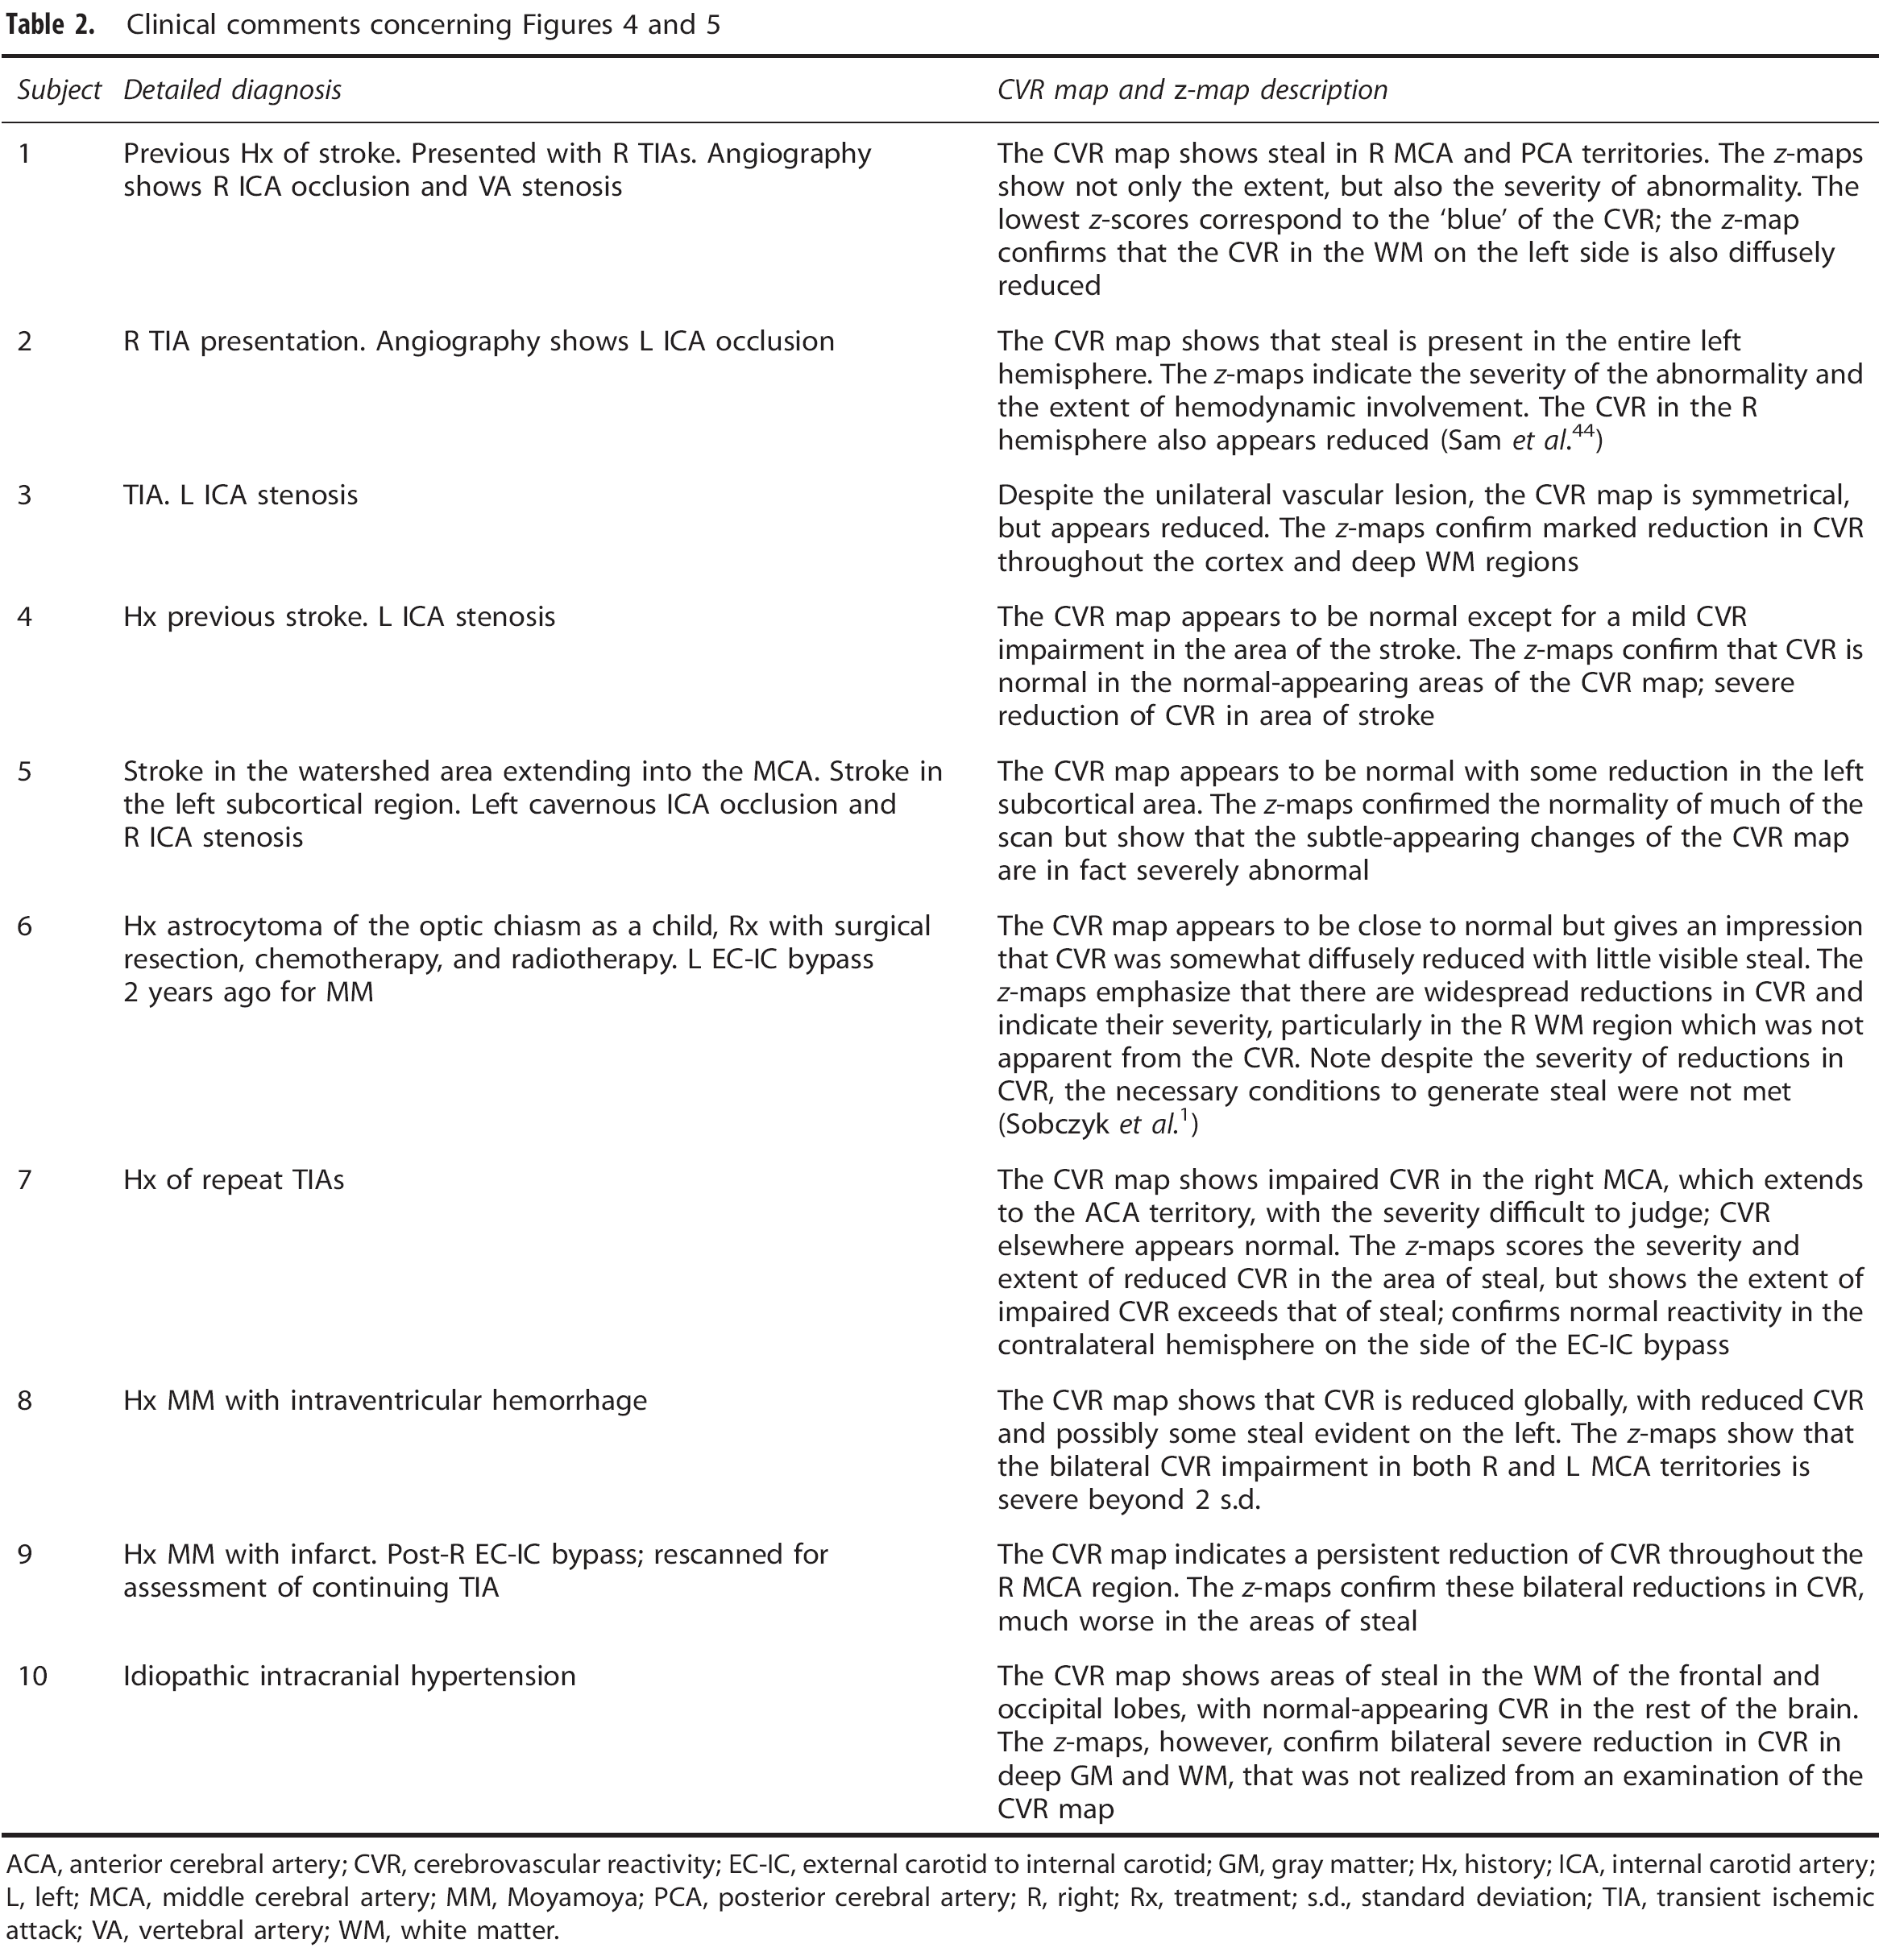
ACA, anterior cerebral artery; CVR, cerebrovascular reactivity; EC-IC, external carotid to internal carotid; GM, gray matter; Hx, history; ICA, internal carotid artery; L, left; MCA, middle cerebral artery; MM, Moyamoya; PCA, posterior cerebral artery; R, right; Rx, treatment; s.d., standard deviation; TIA, transient ischemic attack; VA, vertebral artery; WM, white matter.
Discussion
Main Findings
The main outcomes of this study are, first, the generation of an atlas of the normal distribution of MRI BOLD-generated CVR in 46 healthy subjects. Second, the application of this reference atlas to statistically score MRI BOLD-based CVR maps in a case series of patients with symptomatic neurovascular disease; controlling the CVR for anatomic location, and scanner-specific technical and acquisition sequence idiosyncrasies. The
Optimizing z -Maps
Previously,
A further issue to consider with the
To illustrate this point, consider the following situation. In a
Characteristics of the Reference Atlas
The CVR atlas represents the distribution of CVR and its variance in the human brain, as reflected by our sample. It incorporates the regional anatomic differences in the response of the BOLD signal resulting from (1) tissue factors, such as age, sex, O2 consumption, capillary density, changes in blood volume, differences in blood arrival time, and vascular response time; (2) physiologic factors such as genetic makeup, variations in diet, sleep pattern, time of day, hormonal level, physical fitness, blood pressure and blood pressure response to hypercapnia, and state of mind; and (3) possible uncertainties in technical and mechanical changes in the MRI system over time. These form the background ‘noise’, from which a patient's abnormal voxels, their distribution, and the extent of their deviation, must be discerned.
In principle, controlling for sources of variability such as age, sex, medication, and presence of comorbidities in the reference atlas would tend to isolate the disease process as the dominant source of divergence of CVR; for example, matching age, sex, medication, and other physiologic features to the target study group (for example young men with multiple sclerosis), and reducing all technical and methodological sources of variability, would leave the disease process as the dominant source of divergence of CVR from that of the reference cohort.
Characteristics of the Patient Cohort
The examination of our patient data illustrates the value added to CVR interpretation by
Summary of comparison of CVR and its
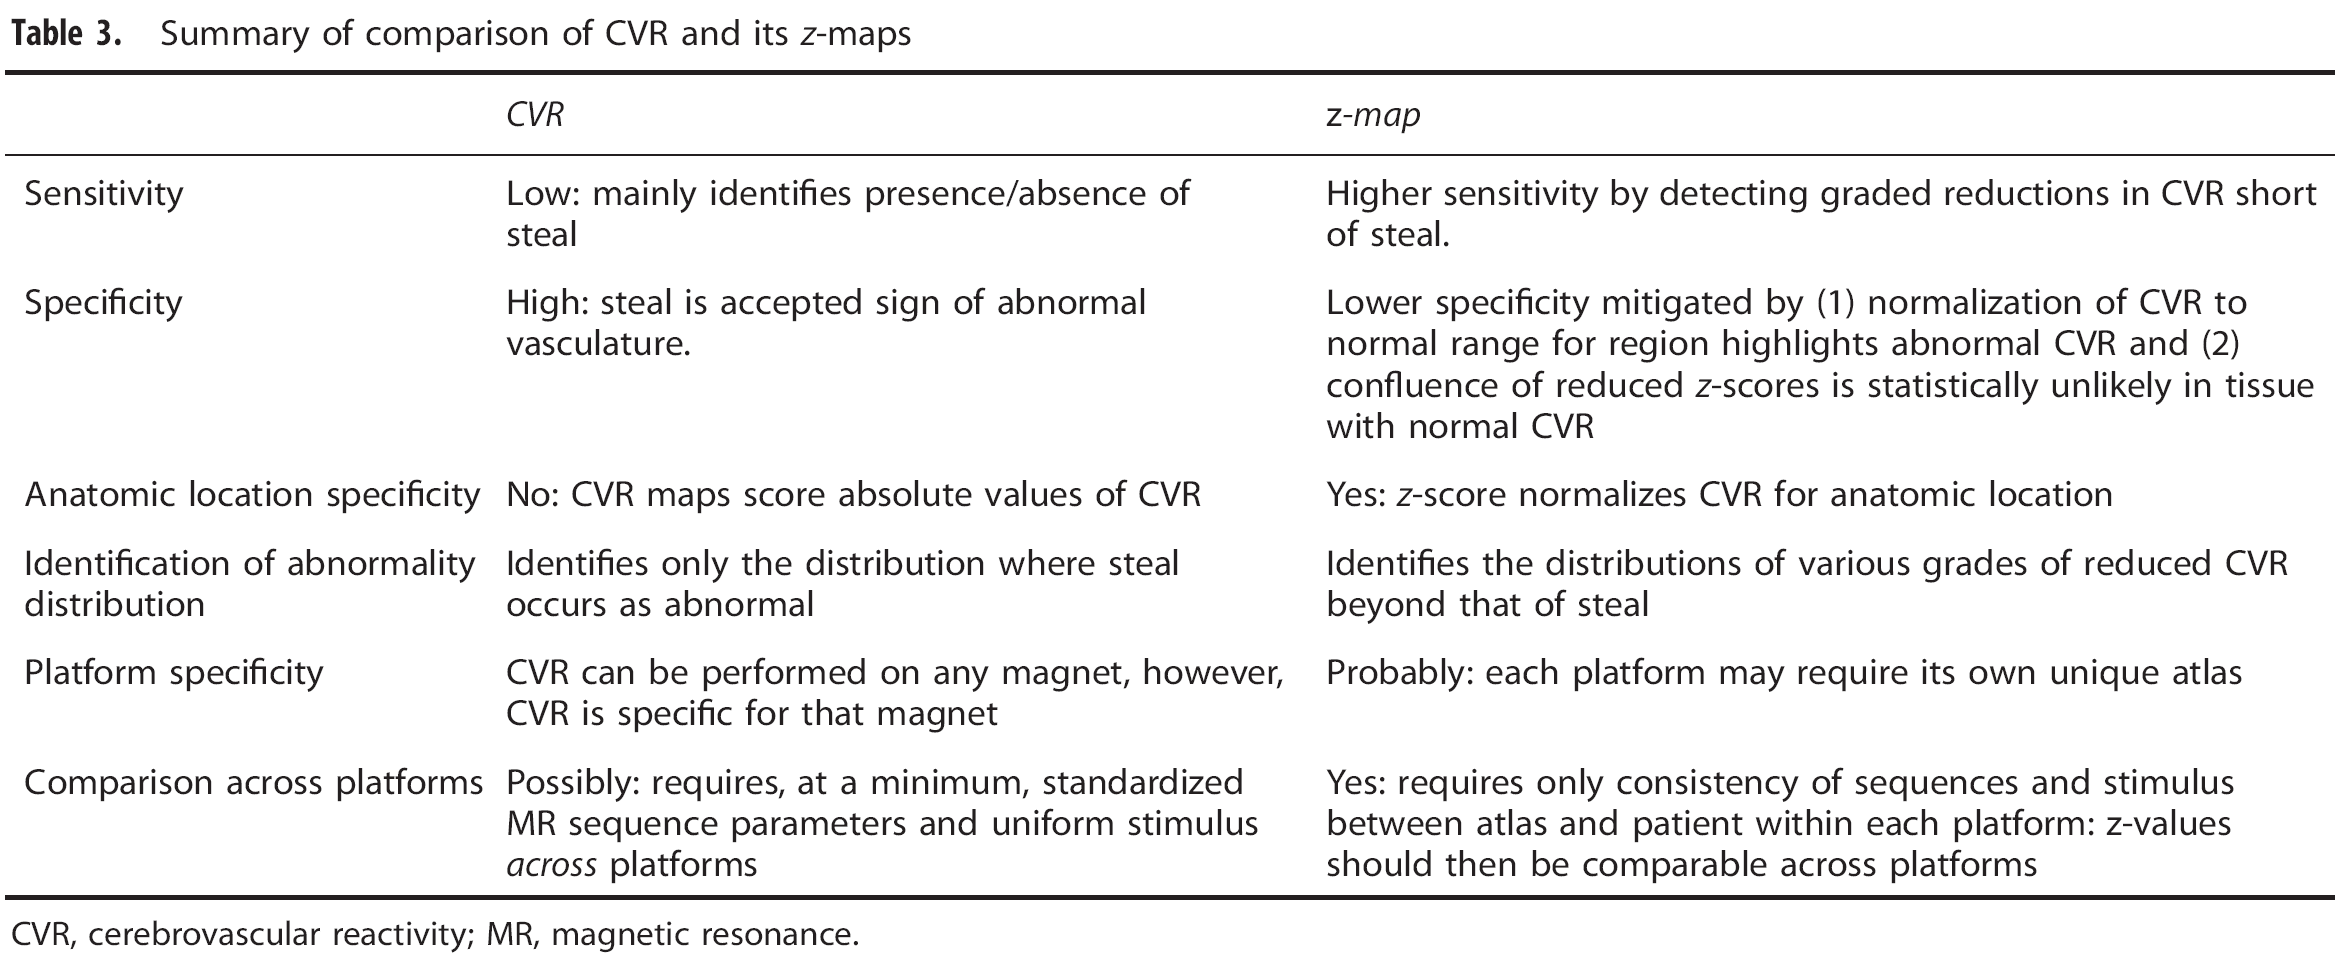
CVR, cerebrovascular reactivity; MR, magnetic resonance.
One aspect of the
We also note that most of the patients presented with protean transient symptoms and were otherwise remarkably asymptomatic. Furthermore, the extent of the neurovascular changes provoked by the hypercapnic challenge and measured by the CVR and their
Using z -Maps to Compare Cerebrovascular Reactivity Across Platforms
An early use of the
Nevertheless, at least initially, we suggest that it is safest to generate a unique atlas for each scanner, which involves the time and expense of obtaining ethics board approval, generating the data, and performing the analysis. Furthermore, the
Limitations
We used BOLD as a surrogate for CBF, which has been accepted as valid for CBF during functional MRI measurements for a considerable time.
37
Flow sensitive alternating inversion recovery and BOLD MRI methods have been favorably compared with other surrogate measures of CBF such as positron emission tomography and arterial spin labeling, including comparisons in patients with steno-occlusive vascular disease.38, 39 Blood oxygen level-dependent has advantages over positron emission tomography, in that it is noninvasive, generally available, and less expensive. It has greater time and spatial resolution than arterial spin labeling, provides greater coverage, requires shorter scan times, and is a sequence more commonly available on clinical scanners. Specific artefacts associated with BOLD, such as those arising from differences in baseline metabolism, alterations in cerebral blood volume (such as increased signal changes over venous pools of blood), and hemoglobin concentration—all these artefacts contribute to the atlas variability and are therefore controlled by the
This atlas of 46 healthy subjects was not developed for a specific disease, age group or sex, and commensurate with this aspect, neither did we select our study cohort by these criteria. Thus, the atlas contains a wide range of ages, and we accepted the possible limitation in sensitivity for this study when studying a cohort of a narrower age range. If age is a large determinant of CVR, the extensive age range in the atlas will result in a reduction in sensitivity of the
Our atlas included about twice as many subjects as other
The example patients we chose were not intended to represent typical findings for any particular pathology, but to illustrate the range of images produced by
Blood pressure is a key confounding factor, which effects the interpretation of CVR. 43 However, in these experiments we were limited by the constraints the MRI environment imposes on blood pressure measurement.
Summary and Conclusion
In this paper we describe a secondary analysis of CVR maps consisting of a voxel-by-voxel scoring of CVR maps about a reference atlas leading to a quantitative approach to the assessment of pathologic CVR. In the example analyses of individual subject CVR maps in patients with known steno-occlusive diseases of the cervico-cerebral vasculature, the
Footnotes
ACKNOWLEDGMENTS
The authors thank the Toronto Western Hospital MRI technologists, in particular Eugen Hlasny and Keith Ta for their help in acquiring the data.
JAF is the Chief Scientist and JD is the Senior Scientist at Thornhill Research (TRI), a spin-off company from the University Health Network that developed the RespirAct™. RespirAct™ is currently a noncommercial research tool assembled, and made available by TRI to research institutions to enable CVR studies.