
Abstract
Clinical and experimental in vivo 1H-magnetic resonance spectroscopy (1H-MRS) studies have demonstrated that type 1 diabetes mellitus (T1DM) is associated with cerebral metabolic abnormalities. However, less is known whether T1DM induces different metabolic disturbances in different brain regions. In this study, in vivo 1H-MRS was used to measure metabolic alterations in the visual cortex, striatum, and hippocampus of streptozotocin (STZ)-induced uncontrolled T1DM rats at 4 days and 4 weeks after induction. It was observed that altered neuronal metabolism occurred in STZ-treated rats as early as 4 days after induction. At 4 weeks, T1DM-related metabolic disturbances were clearly region specific. The diabetic visual cortex had more or less normal-appearing metabolic profile; while the striatum and hippocampus showed similar abnormalities in neuronal metabolism involving N-acetyl aspartate and glutamate; but only the hippocampus exhibited significant changes in glial markers such as taurine and myo-inositol. It is concluded that cerebral metabolic perturbations in STZ-induced T1DM rats are region specific at 4 weeks after induction, perhaps as a manifestation of varied vulnerability among the brain regions to sustained hyperglycemia.
INTRODUCTION
Diabetes mellitus (DM), in particular when blood glucose level is poorly controlled, affects the brain adversely. 1 Patients with long-standing DM often show cognitive impairments, brain atrophy, lesions, or microstructural alterations in white matter (WM) and cerebral metabolic abnormalities. 1 In vivo proton magnetic resonance spectroscopy ( 1 H-MRS) has been used to assess cerebral metabolic changes associated with clinical and experimental DM. Northam et al 2 showed that patients with type 1 DM (T1DM) had decreased N-acetyl aspartate (NAA) level in basal ganglia and frontal lobe, but not in temporal lobe. Decreased NAA level was also found in frontal WM, occipital lobe, pons, and left posterior parietal WM of T1DM patients.3–5 In contrast, other studies found no changes of NAA level in left basal ganglion, thalamus, frontal cortex, WM-rich parieto-occipital cortex, and posterior frontal WM.3–6 Increased myo-inositol (Ins) level was frequently observed in frontal lobe, basal ganglia, temporal, and frontal cortex,2,3,6 but not in thalamus, occipital lobe, and WM-rich parieto-occipital region in T1DM patients.3,5,6 These clinical studies suggested that T1DM-related cerebral metabolic changes may be region specific. Metabolic alterations in the brain of type 2 DM (T2DM) patients also appeared to be region specific. For instance, increased Ins was found in left lenticular nucleus but not in left frontal WM and left optic radiation. 7
Most of in vivo 1H-MRS studies investigating cerebral metabolic abnormalities in animal models of DM focused only on the hippocampus. In a rat model of streptozotocin (STZ)-induced T1DM, hippocampal NAA level at hyperglycemia was found increased 8 or unchanged 9 up to 30 days after induction, but becoming significantly reduced after 45 days. 9 Hippocampal Ins level at hyperglycemia showed significant increase as early as 3 days after induction, and remained elevated thereafter. 9 With the STZ-induced T1DM model, Biessels et al 10 observed decreased NAA level in a voxel including parts of cortex, caudate-putamen, thalamus, hippocampus, corpus callosum, and ventricular system at 2 weeks after induction. Few animal studies have assessed DM-related metabolic changes in brain regions other than hippocampus.
In this study, we used in vivo 1H-MRS to measure metabolic changes in the visual cortex, striatum, and hippocampus of STZ-induced T1DM rats at 4 days and 4 weeks after induction. Type 1 DM-induced metabolic changes were compared among different brain regions at different time points. The aim is to investigate whether STZ-induced T1DM with uncontrolled blood glucose level could induce region-specific metabolic changes in rat brain.
MATERIALS AND METHODS
Animal Handling
All animal protocols followed the National Institutes of Health (NIH) Guide for the Care and Use of Laboratory Animals, and were approved by the Institutional Animal Care and Use Committee. Male Sprague-Dawley rats were purchased from the Experimental Animal Center, the Wuhan University. The animals were let to adapt to the laboratory environment for 2 weeks before the experiments. For each animal (about 7 weeks old, weighted 234 ± 18 g), a single dose of STZ (62 mg/kg; Sigma, St. Louis, MO, USA) dissolved in 0.01 mol/L citric acid solution (pH = 4.5) or the solvent was injected intraperitoneally. The animals were then housed individually in a temperature and humidity-controlled environment on a 12-h light/dark cycle. To prevent hypoglycemia, the STZ-treated rats were allowed to have free access to D5W (water with 5% dextrose) during the first 24 hours after STZ injection. The fasting blood glucose levels in the STZ-treated and control animals were measured 3 days after the treatments. Those STZ-treated animals having a fasting blood glucose level < 13.5 mmol/L or random blood glucose level < 20 mmol/L were excluded from further experiments.
Three experiments using different cohorts of animals were performed (Table 1). The rats were anesthetized with 1.8% to 2.5% isoflurane in pure O2 delivered via a nose cone during the spectroscopy experiments. For the control animals, in vivo 1H-MRS experiments were performed only at euglycemia (Figure 1). For the STZ-treated animals (except those in Experiment 2), localized spectra from different brain regions were first acquired at hyperglycemia, followed by an intraperitoneal injection of insulin (0.5 U/mL, 4 mL, Novolin 30R, Novo Nordisk, Clayton, NC, USA) and blood glucose level measurement at 23 ± 5 minutes later (Figure 1). In vivo 1H-MRS experiments were then repeated. Blood glucose level was measured again immediately on completion of spectroscopy experiments (i.e., ~80 minutes after insulin injection). For the STZ-treated animals in Experiment 2, spectra were acquired only at hyperglycemia. For all animals, the rectal temperature and respiratory rate were monitored continuously throughout the experiments. Body temperature of the animals was maintained at 37 ± 1°C with a warm water circulation system.
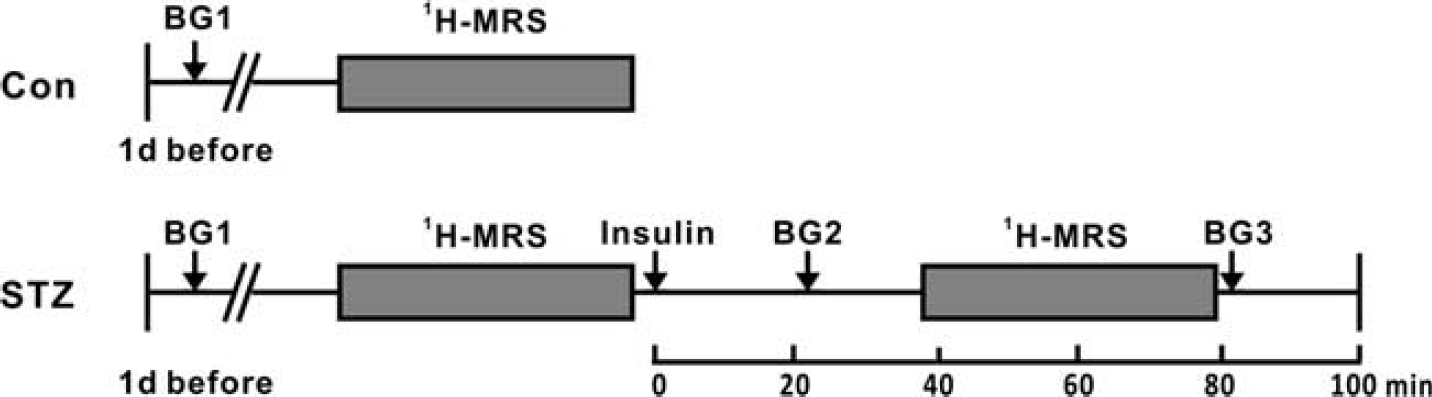
Timeline of Experiments 1 and 3. 1H-MRS, 1H-magnetic resonance spectroscopy; BG, blood glucose measurement; Con, control group; STZ, streptozotocin-treated group.
Experimental design
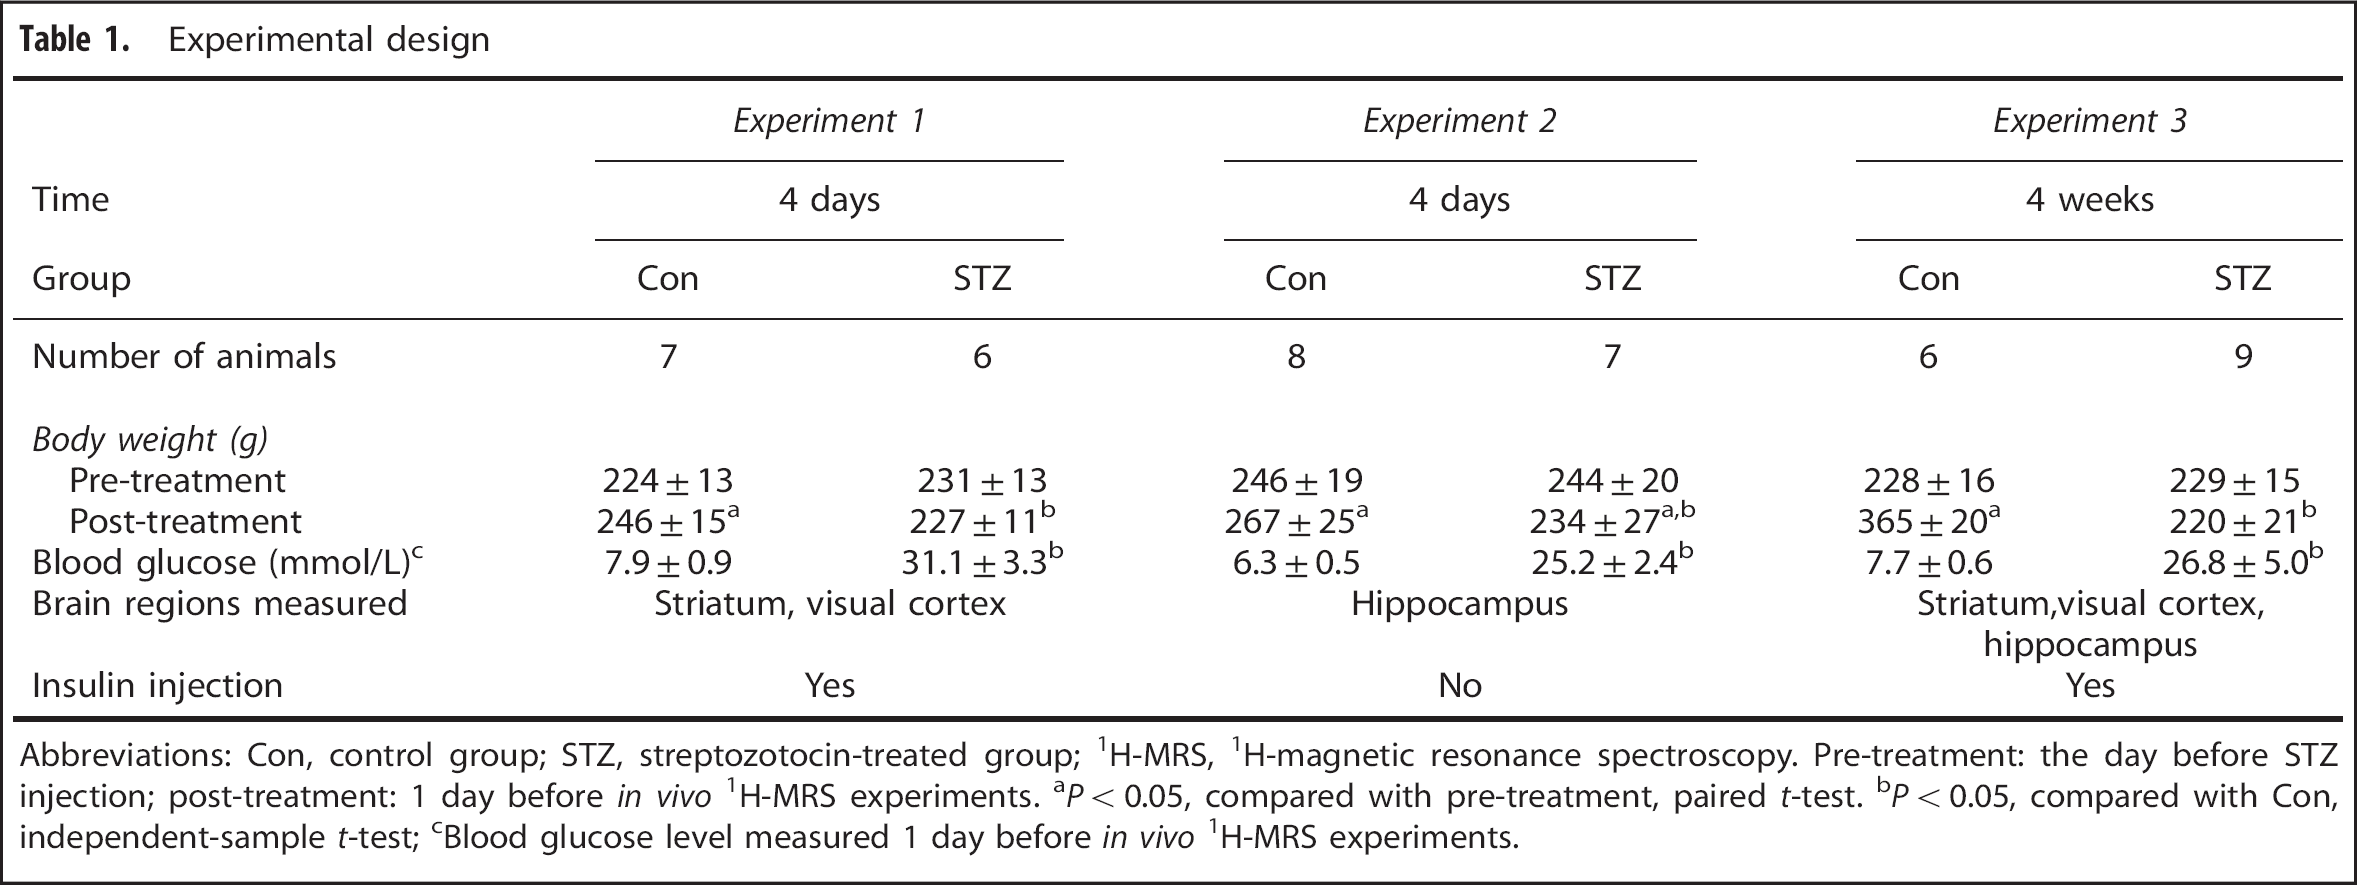
Abbreviations: Con, control group; STZ, streptozotocin-treated group; 1H-MRS, 1H-magnetic resonance spectroscopy. Pre-treatment: the day before STZ injection; post-treatment: 1 day before in vivo 1H-MRS experiments.
P < 0.05, compared with pre-treatment, paired t-test.
P < 0.05, compared with Con, independent-sample t-test;
Blood glucose level measured 1 day before in vivo 1H-MRS experiments.
In Vivo 1H-MRS
In vivo 1H-MRS experiments were performed on a 7 T/20 cm Bruker Biospec scanner (Ettlingen, Germany), with a 72 mm-diameter volume coil for radiofrequency pulse transmission and a 40 mm-diameter quadrature surface coil for signal reception. Anatomical images were acquired with a two-dimensional rapid acquisition with relaxation enhancement (RARE) sequence, field of view 3.0 × 3.0 cm, matrix size 256 × 128, 20 contiguous slices covering the whole brain, slice thickness 0.8 mm, repetition time (TR) 2,000 ms, effective echo time (TE) 40 ms, and RARE factor 4 and 2 averages. These images were used as localizers to position the voxels for in vivo 1H-MRS (Figure 2). Single-voxel spectra were acquired sequentially from the right striatum (voxel size: 2.0 × 1.8 × 2.5 mm), visual cortex (voxel size: 4 × 1 × 4 mm), and hippocampus (voxel size: 1 × 4 × 4 mm) using a point-resolved spectroscopy sequence, TR 2,500 ms, TE 15 ms, spectral bandwidth 4 kHz, 2,048 data points, and 256 averages. First- and second-order shimming was performed automatically with the FieldMap protocol provided by the Bruker console, resulting in an average full width at half maximum of the unsuppressed water signal ~ 10 Hz. To acquire the spectra of metabolites, the water signal was suppressed using variable power radiofrequency pulses with optimized relaxation delays water suppression, which was interleaved with outer volume suppression. 11
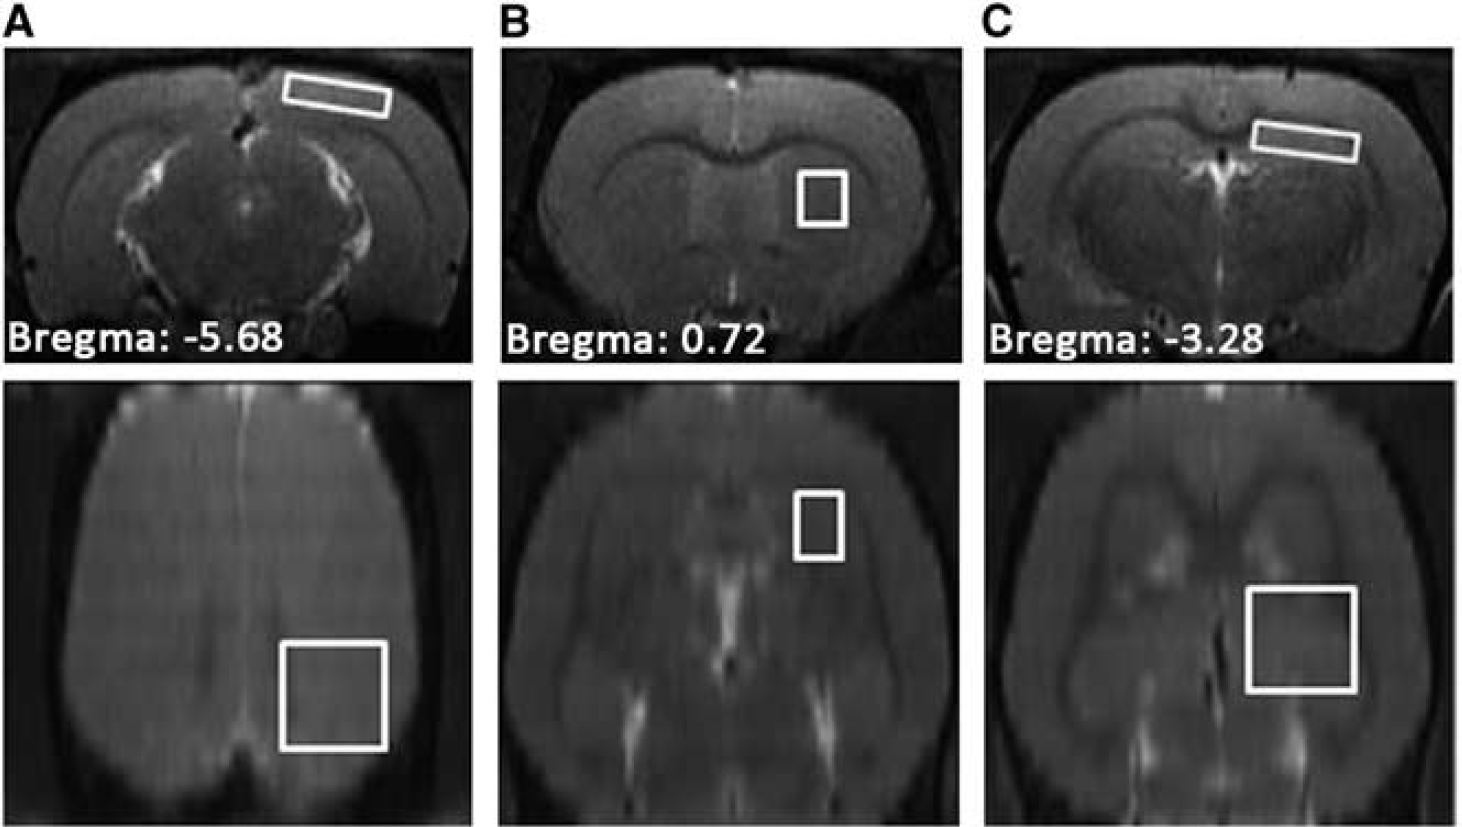
T2-weighted images from a control rat at 4 weeks. Regions of interest for in vivo 1H-MRS are depicted as white rectangles. (
Data Processing and Statistical Analysis
The LCModel software (LCModel version 6.3–1A; Stephen Provencher, Oakville, ON, Canada) was used to quantify the metabolite concentrations. No extra data processing steps were employed other than those incorporated inside LCModel. The signals within the chemical shift range of 0.2 to 4.2 p.p.m. were fitted as a superposition of a set of in vitro basis spectra provided by the LCModel package using a constrained regularization algorithm without setting concentration ratio prior for glucose and taurine (Tau). The lipids and macromolecules signals were simulated automatically by LCModel. Only the fitting results with Cramér–Rao lower bound < 15% were considered reliable, and subjected to further analysis, and reported. For each spectrum, the level of total creatine (tCr) was used as the internal reference to quantify other metabolites.
All data were expressed as mean ± s.d. Inter-group comparison of body weight was performed with two-sample t-test. For Experiments 1 and 3, comparisons of blood glucose level and metabolite concentration between the STZ-treated group (i.e., before and after insulin injection) and the corresponding control group were performed by analysis of variance with post-hoc Dunnett's test; paired t-test was used to compare the metabolite concentrations measured before and after insulin injection in the STZ-treated animals. For Experiment 2, all comparisons were performed by independent-sample t-test. The Benjamini–Yekutieli method was used for false discovery rate correction for multiple comparisons of different metabolites in each brain region. A false discovery rate-corrected P < 0.05 was considered to be statistically significant.
RESULTS
The body weight data and random blood glucose levels measured at 1 day before the in vivo 1H- MRS experiments (BG1, Figure 1) are shown in Table 1. Figure 3 shows the results of blood glucose measurements in Experiments 1 and 3. For the STZ-treated animals in these two experiments, a single dose of insulin was injected to lower the blood glucose level after acquiring spectra at hyperglycemia. The animals in the 4 days cohort reached euglycemia (BG2: 9.2 ± 2.3 mmol/L, Figure 1) before the second in vivo 1H-MRS session, but developed hypoglycemia (BG3: 1.8 ± 0.9 mmol/L, Figure 1) after the session. In comparison, the animals in the 4-weeks cohort showed mild hyperglycemia (BG2: 13.0 ± 1.8 mmol/L) before the second in vivo 1H-MRS session, and reached euglycemia (BG3: 7.5 ± 2.2 mmol/L) after the session.
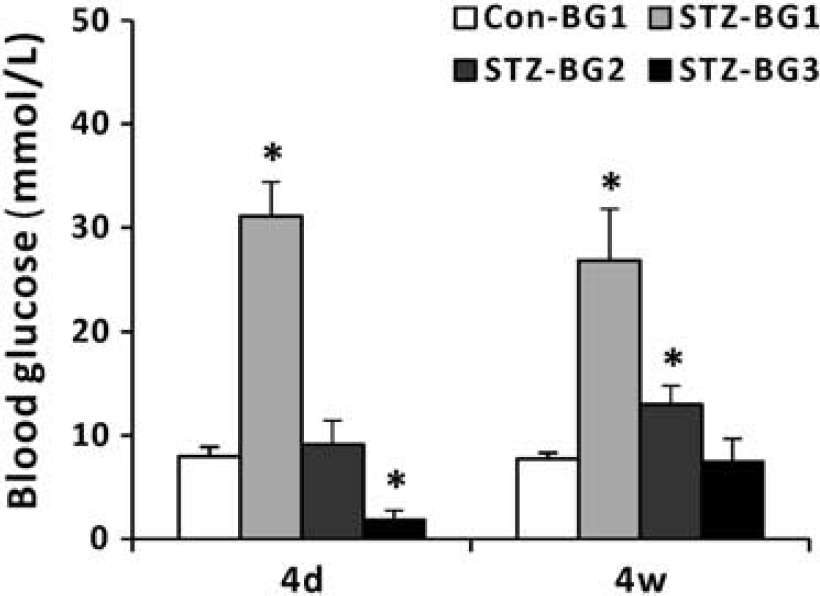
Blood glucose level measurements in Experiments 1 (4 days) and 3 (4 weeks). The definitions of BG1, BG2 and BG3 can be found in Figure 1. *P < 0.05, analysis of variance (ANOVA) with Dunnett's post-hoc test using Con-BG1 as the control category. BG, blood glucose measurement; Con, control group.
Figure 4 shows representative spectra and corresponding LCModel fits from the three brain regions in a control rat and an STZ-treated rat at 4 weeks. The results of quantitative analysis are shown in Figure 5. Under the hyperglycemia state, the diabetic visual cortex showed little metabolic perturbations relative to the controls. After insulin injection, the NAA (P = 0.06, false discovery rate corrected) and tNAA levels in the diabetic visual cortex became significantly decreased when compared with control at 4 days, but not at 4 weeks. Insulin injection also induced a trend of glutamate (Glu) reduction at 4 days (P = 0.08, false discovery rate corrected) and significantly reduced tPC (glycerophosphocholine+phosphocholine) level at 4 weeks, relative to the level measured at hyperglycemia.
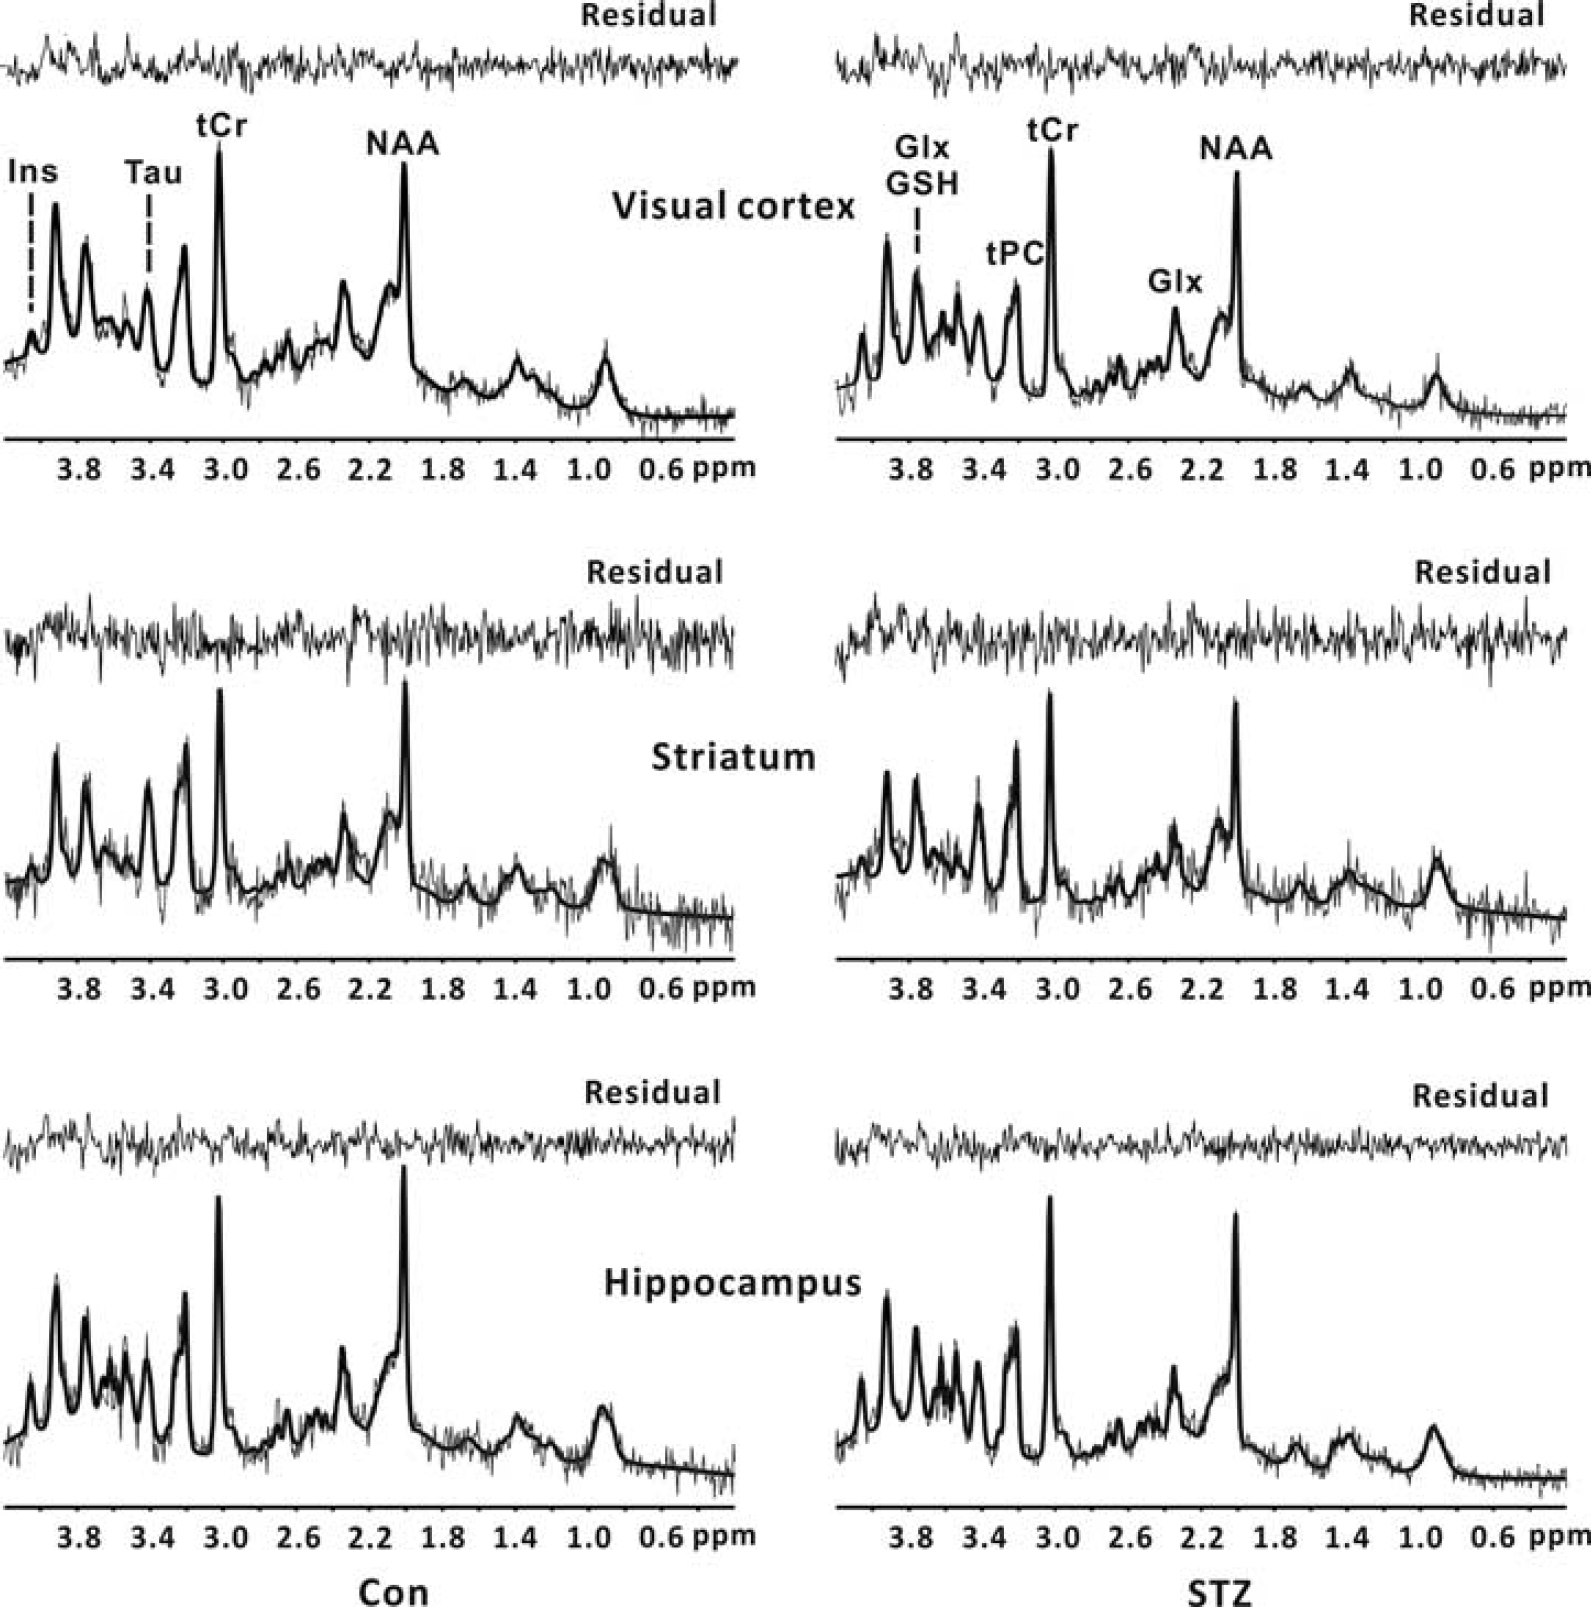
Localized 1H spectra (thin gray lines) acquired from a control rat and a STZ-treated rat at 4 weeks. Corresponding LCModel fits to the raw spectra (thick black lines) and fitting residuals are also shown. Top panel: visual cortex; middle panel: striatum; bottom panel: hippocampus. Only the metabolites with CRLB < 15% were reported. Con, control group; CRLB, Cramér–Rao lower bound; Glx, glutamate + glutamine; GSH, glutathione; Ins, myo-inositol; NAA, N-acetyl aspartate; STZ, streptozotocin; Tau, taurine; tCr, total creatine; tPC, (glycerophosphocholine+phosphocholine).
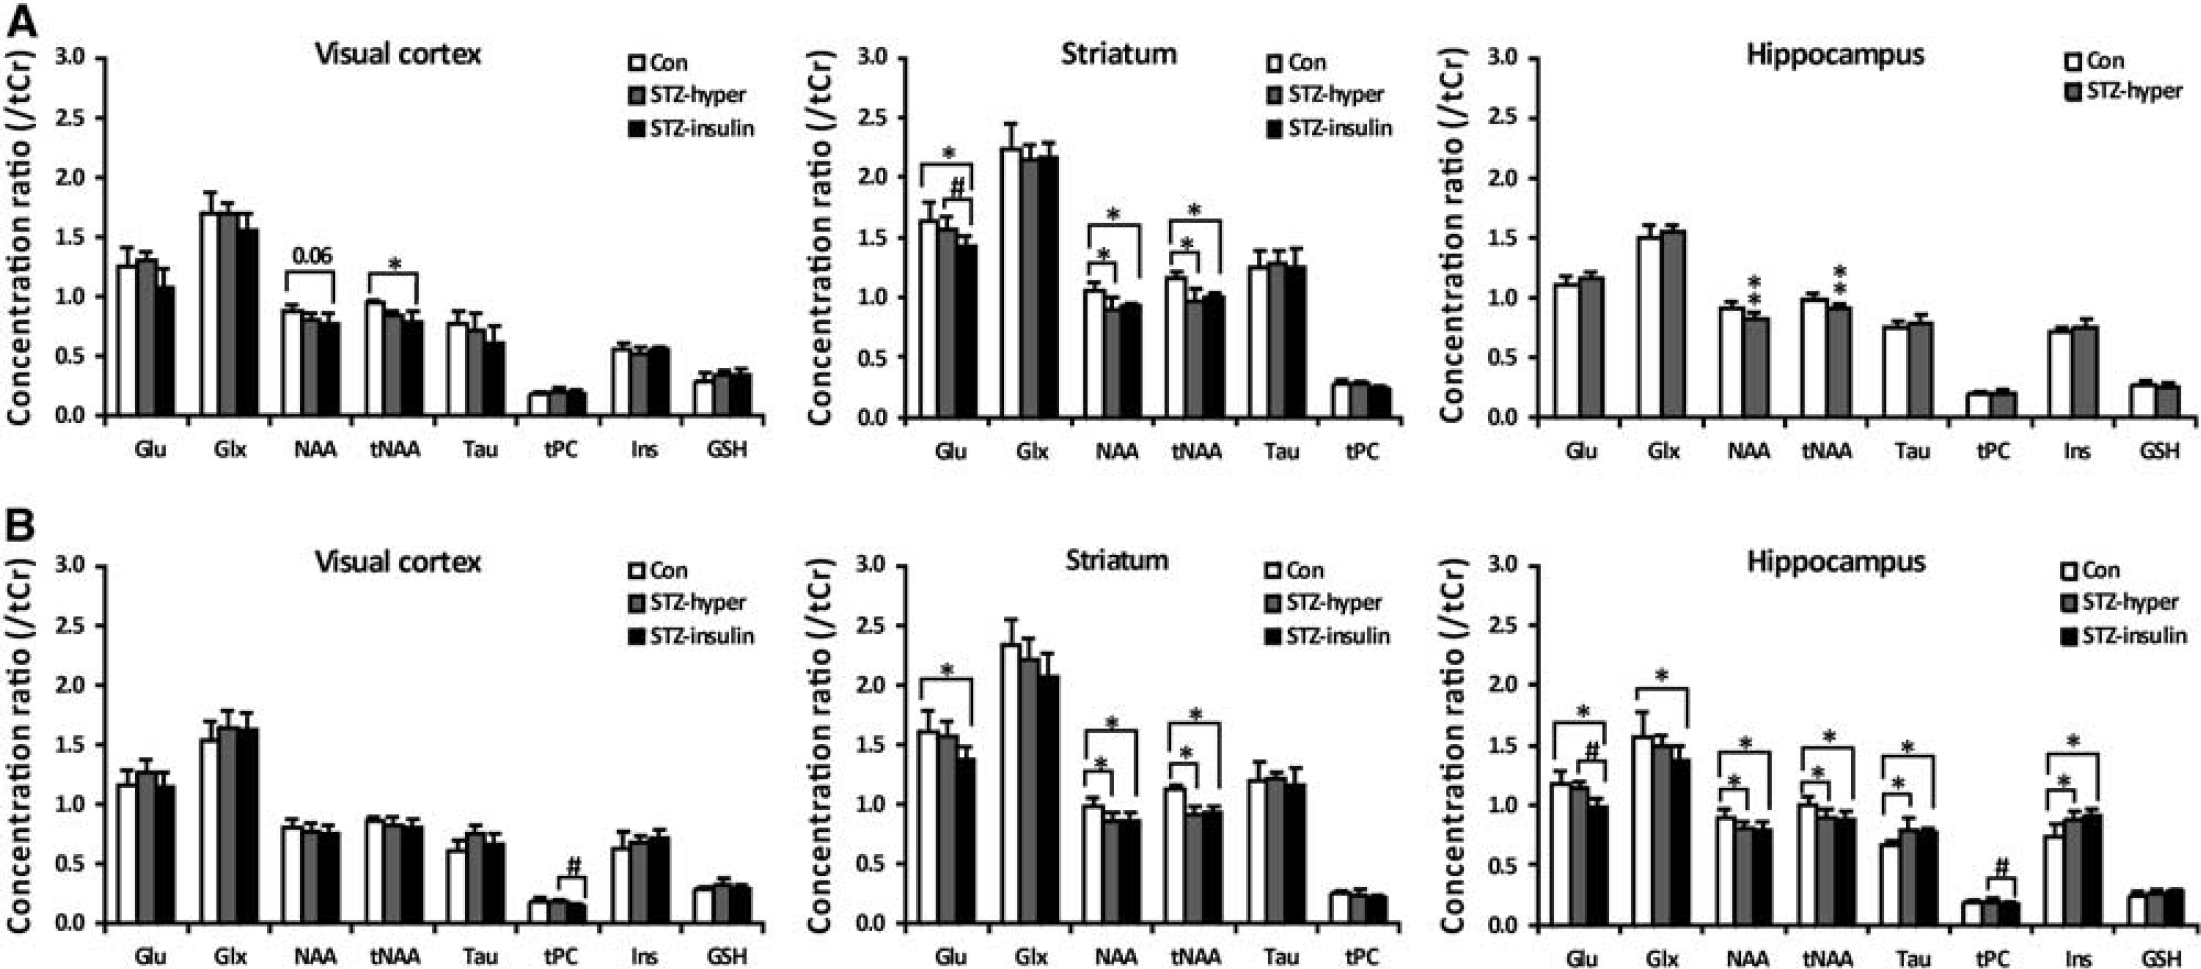
Relative concentration of cerebral metabolites of control rats, STZ-treated rats at hyperglycemia (STZ-hyper), STZ-treated rats after insulin injection (STZ-insulin) at 4 days (
The diabetic striatum showed significant reductions in the NAA and tNAA levels already at 4 days, regardless of the blood glucose level. Such perturbations in neuronal metabolism persisted at 4 weeks. At 4 days and 4 weeks, the Glu level in the diabetic striatum was found to be significantly decreased when compared with control after insulin injection. Like the diabetic striatum, the diabetic hippocampus showed significant reductions in the hyperglycemia NAA and tNAA levels already at 4 days. At 4 weeks, the hippocampus had more severe metabolic perturbations than the visual cortex and striatum, involving both neuronal and glial metabolites. The NAA and tNAA levels were found reduced, and the Tau and Ins levels were found significantly increased, regardless of the blood glucose level. Insulin injection induced significant reduction of hippocampal Glu and tPC levels in the STZ-treated rats. The Glu and Glu+glutamine (i.e., Glx) levels in the diabetic hippocampus were significantly decreased when compared with control after insulin injection at 4 weeks.
DISCUSSION
In this study, in vivo 1H-MRS was used to measure metabolic alterations in the visual cortex, striatum, and hippocampus of STZ-treated diabetic rats at 4 days and 4 weeks after induction. The main findings are: (1) the STZ-treated rats showed significant reductions in NAA and tNAA levels in the striatum and hippocampus, respectively, already at 4 days; (2) the NAA and tNAA levels remained significantly reduced in the striatum and hippocampus, respectively, at 4 weeks; (3) the striatum and hippocampus, but not the visual cortex, showed perturbed Glu metabolism at 4 weeks; (4) among the three brain regions investigated, only the hippocampus showed significant perturbation in glial metabolism (i.e., elevated Tau and Ins levels) at 4 weeks. It is therefore concluded that STZ-induced T1DM causes region-specific metabolic perturbations in rat brain at 4 weeks, perhaps as a manifestation of varied vulnerability among the brain regions to sustained uncontrolled hyperglycemia.
Early Metabolic Alterations at 4 Days
Although there are a few previous in vivo 1H-MRS studies that have investigated cerebral metabolic abnormalities in animal models of STZ-induced T1DM,8–10,12 few of them measured metabolic changes in brain regions other than the hippocampus, nor at the time points earlier than 2 weeks after induction. In this study, we found that, under the hyperglycemia state, the STZ-treated animals had significantly reduced tNAA/NAA levels in the striatum and hippocampus already at 4 days after induction. In addition, the visual cortex had significantly reduced tNAA/NAA levels after insulin injection. While Wang et al 9 found NAA and tNAA levels unchanged in a voxel containing hippocampus and parts of cortex, the observations in this study are consistent with the results of a previous ex vivo 1H-MRS study showing that the average NAA level across the whole brain is significantly reduced in the STZ-treated rats at 7 days after induction. 12
NAA constitutes ~ 3–4% of total brain osmolarity, and may serve osmoregulatory roles under certain circumstances. 13 However, it is unlikely that the early reduction of NAA/tNAA levels is an osmoregulatory response of the brain to hyperglycemia, given that such metabolic changes persisted after insulin injection. Previous studies have shown that hypoglycemia induced by single-dose insulin injection has no effects on the hippocampal NAA level in developing rats. 14 The absence of any significant changes of the NAA/tNAA levels at 3 days after STZ induction, when the animal is already at the hyperglycemic state, 9 also rules out the possibility that reduction in NAA/tNAA levels being merely an osmoregulatory response.
NAA and NAAG are localized almost exclusively to neurons, and synthesized primarily in the mitochondria. The two metabolites are thus important markers of neuronal loss or mitochondria dysfunction. 15 Mitochondrial dysfunction, such as impairment of the respiratory activity and increased production of superoxide anion, is already evident at 4 days after induction. 16 The hippocampal CA3 region showed changes of neuronal morphology after 9 days of uncontrolled hyperglycemia induced by STZ treatment. 1 Astrocytes are the storage site of brain glycogen, and may metabolize glucose to lactate or other intermediates that are then shuttled to neurons as energy substrates. 18 Astroglial reactions to STZ-induced hyperglycemia occurred in the hippocampus as early as 3 days after induction, 19 suggesting that cerebral glucose/energy metabolism in hippocampus may already be impaired at this early time point. It is thus likely that the early reduction in NAA/tNAA levels is a result of increases in oxidative stress or impairment in glucose/energy metabolism associated with lasting hyperglycemia.
Region-Specific Metabolic Alterations at 4 Weeks
To avoid confounding effects from long-term diabetic complications such as diabetic retinopathy (DR), 20 we measured metabolic changes only at 4 weeks after STZ treatment. It was shown that cerebral metabolic alterations at this stage are clearly region specific. The diabetic visual cortex had more or less normal-appearing metabolic profile, while the striatum and hippocampus showed similar abnormalities in neuronal metabolism involving NAA, tNAA, and Glu; but only the hippocampus exhibited significant changes in glial markers Tau and Ins. 21
Hippocampus
A number of previous in vivo 1H-MRS studies have investigated metabolic changes in the hippocampus of STZ-treated rats.8–10 At 30 days after STZ induction, Duarte et al 8 observed increased hippocampal NAA, tCr, Tau, Ins, and tPC levels (i.e., absolute concentration) for the diabetic rats at hyperglycemia, and most of such metabolic alterations restored to the control levels on normalization of the blood glucose level to euglycemia via insulin administration. At 31 days after STZ induction, Wang et al 9 found significantly decreased tNAA concentration, increased Tau and Ins concentrations, and unchanged tCr and tPC concentrations in the hippocampus at hyperglycemia. The two studies showed consistent results with regard to the changes of glial markers (i.e., Ins and Tau), 21 but inconsistency in terms of the changes of other metabolites such as tCr, tPC, and NAA. The reasons underlying such discrepancies are unclear. Our results also demonstrated significant increases in Ins and Tau levels, and unchanged Glu/Glx level in the diabetic hippocampus at hyperglycemia, agreeing with the results of these two previous studies. The observation of decreased NAA/tNAA level and unchanged tPC level is in accordance with the report by Wang et al. 9
In animal models of STZ-induced T1DM with uncontrolled blood glucose level, functional/structural hippocampal abnormalities are already prominent at 4 weeks or even earlier. The reported hippocampal injuries associated with STZ-induced T1DM involve both neurons and astrocytes, and range from behavioral deficits to ultrastructural changes, including impairments in hippocampus-dependent learning and memory, 22 functional and morphological abnormalities in neurons, 8 astroglial reactions, 8 and ultrastructural changes such as swollen mitochondria and increased heterochromatin accumulation in neurons. 22 In general, the metabolic changes in the diabetic hippocampus observed in this study corroborate these previous results.
Striatum
Metabolic changes in the striatum of STZ-treated animals have not been reported previously. However, there are a couple of clinical in vivo 1H-MRS studies that investigated T1DM-related metabolic changes in the basal ganglia. It was reported by Sarac et al 4 that there were no significant changes in NAA/tCr and tPC/tCr ratios in the left basal ganglion of 8–19-year-old children with poorly controlled T1DM. With a larger sample of T1DM patients having an average age of 20.5 years, Northam et al 2 showed significantly reduced NAA concentration and significantly increased Ins and tPC concentrations in the basal ganglion. Metabolic perturbations were also observed in the lenticular nucleus of T2DM patients. 7
Our results showed that, like the hippocampus, the striatum of diabetic rats had significantly reduced NAA/tNAA level at 4 weeks, indicative of neuronal dysfunction. This result agrees well with the clinical observations in young T1DM patients by Northam et al. 2 It is also consistent with our early diffusion tensor imaging (DTI) results showing that the STZ-treated rats had already significantly reduced fractional anisotropy (FA) in the striatum at 4 weeks, and the FA changes were accompanied by demyelination and axonal degradation of striatal fiber bundles. 23
Unlike the case in hippocampus, we observed no significant changes in Tau level in the diabetic striatum. Owing to the low signal noise ratio from the small voxel size used in striatum, the striatal Ins level could not be measured reliably, and thus not reported. Taurine and Ins primarily exist in glia cells, and both of them are major osmolytes in the brain. 21 In the hippocampus of STZ-induced diabetic rats, the parallel increases in Tau and Ins levels were shown to be accompanied by elevated glial fibrillary acidic protein expression. 8 It has also been suggested that increased intracellular osmotic pressure via polyol (sorbitol) pathway would attribute to the changes in Tau and Ins levels observed in the diabetic brain. 24 The reasons underlying the differential changes of Tau in the striatum and hippocampus are unclear, but could be related to the fact that STZ-induced T1DM results in more severely perturbed glucose metabolism in the hippocampus than in the striatum. 25
Visual Cortex
A number of clinical studies have investigated T1DM-related metabolic changes in the frontal3,6 and occipital5,26 cortex. While the results from the frontal cortex are rather consistent, the observations from the occipital cortex appeared to be varied. For instance, Kreis et al 26 found unchanged tNAA/tCr peak ratio and increased Ins/tCr peak ratio in the occipital cortex of T1DM patients with an average age of 43 years. However, Mangia et al 5 reported that, relative to nondiabetic controls, T1DM patients with a disease duration of 22 ± 12 years had decreased NAA level and unchanged Ins level in the GM-rich occipital lobe. Metabolic disturbances have also been reported in the occipital GM of T2DM patients. 27
No previous studies have investigated metabolic changes in the visual cortex of STZ-treated animals. It was observed in this study that the visual cortex of diabetic animals had somewhat disturbed NAA/tNAA metabolism at 4 days, but normal-appearing metabolic profile at 4 weeks. Recovery of NAA metabolism after an initial perturbation has been observed in rat models of cerebral ischemia, probably as a manifestation of restoration of neuronal function or reactive neurogenesis/gliosis. 28 It has been shown that the visual cortex of STZ-treated rats had normal cerebral blood flow and cerebral glucose metabolic rate (CMRglu) between 3 and 4 weeks.25,29 A electrophysiological study demonstrated normalization of visually evoked potential, after an earlier perturbation, in the occipital cortex of STZ-treated rats at 1 month. 30 The normalization of NAA metabolism in the visual cortex at 4 weeks perhaps reflect acclimation of neuronal function to elevated oxidative stress or impairment in glucose/energy metabolism imposed by sustained hyperglycemia. The in vivo 1H-MRS results are also consistent with our early diffusion tensor imaging observations showing that, in contrast to the frontal cortex, the visual cortex had rather intact WM microstructure at 4 weeks. 23
In addition to the sustained high blood glucose level, long-term diabetic complications, such as DR, could also affect cerebral metabolism. For example, Tong et al 7 found significant metabolic changes in the optic radiation only in T2DM patients with DR, but not in T2DM patients without DR, and the metabolic abnormalities were negatively associated with DR severity. In the rat model of STZ-induced T1DM, prominent functional and structural changes in retina occur between 2 and 3 months after induction. 20 It is therefore expected that DR would have little, if any, effects on the metabolic profile of visual cortex at 4 weeks.
Clinical Relevance
It has been frequently shown that clinical T1DM patients have abnormalities in the hippocampus/temporal lobe and basal ganglia on their MRI readings,2,31–33 suggesting that these two brain regions are particular susceptible to diabetes-related injuries. In contrast, few imaging studies have observed abnormalities in the occipital cortex of T1DM patients, except for those with a long disease duration 32 or DR. 34 In a group of T1DM patients with an average of 20.3 years and an average disease duration of 12.7 years, Northam et al 2 observed significantly altered T2 in the temporal gyrus, lentiform nucleus, and caudate nucleus, but not in the occipital lobe. In 20.3 ± 4.3-year-old T1DM patients, Pell et al 33 found decrease of GM volume or T2 relaxation time with age in the temporal lobe, caudate, and lentiform nucleus, but not in the occipital lobe. All these clinical findings suggested that the basal ganglia and temporal lobe are more vulnerable to hyperglycemia-related injuries, while occipital lesions may occur only as a secondary effect of microangiopathy or DR. 34 There are results in the literature suggesting this may also be true for T2DM. 35 The regional-specific metabolic alterations in the brain of STZ-treated animals found in this study are consistent with this notion.
Glutamate Reduction After Insulin Injection
The STZ-treated animals were injected with a single dose (0.5 U/mL, 4 mL) of intermediate-acting insulin to decrease the blood glucose level. The rats in the 4-days group had severe hypoglycemia, while those in the 4-weeks group reached only euglycemia at ~80 minutes post injection when the in vivo 1H-MRS experiments were finished. This observation is consistent with previous reports showing that development of a decreased insulin response occurs rapidly within the first 2 weeks after the onset of diabetes in STZ-treated rats. 36 Such long-term hyperglycemia induced insulin resistance has been attributed to downregulation of the glucose-transport system and effects related to glucose toxicity. 37
Insulin injection to the STZ-treated animals caused significant decreases of the Glu level in the striatum at 4 days, and in the striatum and hippocampus at 4 weeks (Figure 5). Previous studies have demonstrated reduced Glu level in the brain of nondiabetic rats 14 and T1DM patients 38 after insulin injection. It has been suggested that the mechanism underlying these observations is likely related to the fact that the brain can use Glu as an alternative substrate for energy metabolism in response to insulin-induced hypoglycemia.14,38
It is interesting to note that insulin-induced reductions of Glu level at 4 weeks were observed in the absence of severe hypoglycemia. In the model of STZ-induced T1DM with uncontrolled blood glucose level, the brain appears to be in a hypermetabolic state, and uses greater amounts of energy substrate than normal. 25 It has been shown that the STZ-treated rats had globally increased CMRglu and cerebral ketone utilization at 1 week.25,39 The regional CMRglu in almost all the brain regions recovered to normal level at 4 weeks, but this is accompanied by further increased contribution of ketone bodies to brain energy metabolism25,39 and reduced regional cerebral blood flow in selected brain regions including the striatum. 29 It thus appears that, in response to the evolving consequences of sustained hyperglycemia, the diabetic brain must be in a constant process of adaption trying to reach a new homeostasis state for energy metabolism, and it may make use of alternative substrates such as Glu, in a region-specific manner, 39 under circumstances when these substrates are needed and available.
Limitations of The Study
There are several limitations to this study that need to be pointed out. (1) Because a relatively short TR was used, we calculated only relative concentrations of cerebral metabolites using tCr level as the internal reference, and interpret the data under the assumption that regional tCr level remained unchanged in the brain of STZ-treated animals. With the same STZ-induced T1DM model, Wang et al 9 measured absolute Cr, PCr and tCr concentrations in a voxel containing mainly hippocampus and partially cortex at hyperglycemia from 3 to 73 days after induction, and found no statistically significant changes. The absolute concentrations of Cr and PCr may be sensitive to blood glucose level in normal nondiabetic rats and STZ-treated T1DM rat, but the absolute concentration of tCr is rather stable under such circumstances.9,14,25 Absolute tCr concentration was also measured by in vivo 1H-MRS in the basal ganglia, frontal lobe, temporal lobe, GM-rich occipital lobe, thalamus, posterior frontal WM, and WM-rich parieto-occipital region of clinical T1DM patients, and none of these studies reported any significant changes in the tCr level.2,3,5,6 One previous study showed that absolute hyperglycemia tCr level in the hippocampus of STZ-treated rats were ~ 10% higher than control at 30 days after induction. 8 However, it was reported that the brain water content was reduced in STZ-treated T1DM rats since 1 week after induction, 40 and such dehydration would potentially lead to overestimation of absolute concentration of cerebral metabolites in diabetic animals. However, we should admit that the possibility that STZ treatment induces significant time- and (or) region-dependent changes of tCr level could not be ruled out completely. The metabolite levels reported in this study would therefore have been underestimated under the circumstance that absolute tCr level increases after STZ treatment. (2) The level of ketone bodies in the plasma of diabetic rats was not monitored in this study, such that the possible occurrence of ketoacidosis cannot be ruled out. However, we observed no cerebral edema, a hallmark for ketoacidosis, in the brain of diabetic animals on T2-weighted anatomical images (data not shown). In addition, acetone peak (2.22 p.p.m.) was not observed in all the spectra collected, suggesting low possibility of occurrence of ketoacidosis. (3) No histological/immunohistological assessments were performed to identify the molecular/cellular mechanisms underlying the region-specific metabolic changes. (4) Future longitudinal studies across a longer time frame should be performed to investigate how glycemic control and long-term diabetic complications, such as DR, affect regional cerebral metabolism.
CONCLUSION
The current study revealed that STZ-induced T1DM is associated with evolving and region-specific metabolic changes in the brain. Significantly perturbed neuronal metabolism could be observed as early as 4 days after induction, perhaps as a manifestation of neuronal adaptation to increased oxidative stress or impairment in glucose/energy metabolism associated with acute hyperglycemia. The T1DM-related metabolic changes in the brain of STZ-treated rats were clearly region specific at 4 weeks. The diabetic visual cortex had more or less normal-appearing metabolic profile; while the striatum and hippocampus showed similar abnormalities with regard to neuronal metabolism; only the hippocampus exhibited significantly perturbed glial metabolism. The region-specific metabolic changes in the brain of STZ-treated rats at 4 weeks perhaps reflect varied vulnerability among the brain regions to sustained hyperglycemia.
Footnotes
MH and HL designed the study; HZ, MH, and LG performed the experiments; HZ and MH analyzed the data; HZ and HL wrote the paper.
The authors declare no conflict of interest.