
Abstract
The impact of type 1 diabetes mellitus (T1DM) on a comprehensive neurochemical profile of the human brain has not been reported yet. Our previous proton magnetic resonance spectroscopy (1H-MRS) studies on T1DM were focused exclusively on the assessment of brain glucose levels. In this study, we reexamined our previously acquired data to investigate concentration differences of a broad range of neurochemicals in T1DM subjects relative to nondiabetic controls. We selected MRS data from 13 subjects (4 F/9 M, age = 41 ± 11 years, body mass index = 26 ± 3 kg/m2) with well-controlled T1DM (disease duration = 22 ± 12 years, A1C = 7.5% ± 2.0%) and 32 nondiabetic controls (14 F/18 M, age = 36 ± 10 years, body mass index = 27 ± 6 kg/m2) acquired during a hyperglycemic clamp (target [Glc]plasma = 300 ± 15 mg/dL). The 1H-MR spectra were collected from two 15.6-mL voxels localized in gray-matter-rich occipital lobe and in white-matter-rich parieto-occipital region using ultra-short echo-time STEAM at 4 T. LCModel analysis allowed reliable quantification of 17 brain metabolites. Lower levels of N-acetylaspartate (by 6%, P = 0.007) and glutamate (by 6%, P = 0.045) were observed in the gray matter of T1DM patients as compared with controls, which might indicate a partial neuronal loss or dysfunction as a consequence of long-term T1DM. No other differences in metabolites were observed between subjects with T1DM and controls.
INTRODUCTION
The steady-state concentration of various metabolites can be quantified noninvasively in the human brain using proton magnetic resonance spectroscopy ( 1 H-MRS). Gaining information on pathological alterations of metabolite concentrations is critical for characterizing and understanding the impact of diseases on brain function at the molecular level.
The prevalence of diabetes mellitus around the globe is reaching epidemic proportions and according to the Center for Disease Control and Prevention >20 million US adults were diagnosed with this disease in 2010 (http://www.cdc.gov/diabetes/statistics/prevalence_national.htm). Nearly 27% of persons over 65 years of age have diabetes and if current trends continue, one in three US adults could have diabetes by 2050. Ninety percent of Americans with diabetes have type 2 diabetes, a form of the disease that is often accompanied by hypertension, hyperlipidemia, obesity, and other conditions that increase the risk of vascular disease. Because of the confounding effects of these associated diseases, examination of the neurochemical profile of the brains of humans with type 2 diabetes does not necessarily provide insights into the impact of this disease on the brain. However, patients with type 1 diabetes mellitus (T1DM) generally do not have these associated conditions and examination of their brains does permit assessment of the unique effect of diabetes on cerebral metabolism. Previous studies in which 1 H-MRS was employed to compare the neurochemistry of T1DM patients with controls reported only data of a limited number of brain metabolites, namely N-acetylaspartate (NAA), total choline, total creatine, glucose (Glc), myo-inositol (myo-Ins), and the sum of glutamine (Gln) + glutamate (Glu), generically identified as Glx.1–15 In most cases, metabolite concentrations were quantified in relative terms as ratio to NAA or to total creatine.
The goal of the present study was to investigate differences in the comprehensive neurochemical profiles of T1DM subjects relative to nondiabetic controls. To achieve this goal, we reexamined our previously acquired 1 H-MRS data from which only glucose levels have been reported.2,3,8,9
MATERIALS AND METHODS
Subjects and General Protocol
The 1 H-MRS data were selected from the database of our previous T1DM studies in which metabolic conditions were controlled by the use of the hyperinsulinemic (0.5 mU per kg per minute) hyperglycemic (target = 300 mg/dL or 16.7 mmol/L) clamp technique with somatostatin infusion (0.16 μg per kg per minute). Details regarding the protocol for blood glucose management have been published elsewhere.2,3,8,9 Published results from those studies were focused only on the assessment of the brain glucose levels using the resonance of H-1 proton of α-Glc at 5.23 p.p.m. However, the quantification of entire neurochemical profiles was not performed. For the present study, we selected from our 1 H-MRS T1DM database only studies that were in agreement with the following requirements: (1) the target plasma glucose concentration was maintained at steady state for at least 20 minutes before MRS data were acquired; (2) during the 1 H-MRS acquisition glycemia was clamped at the target level of 300 ± 15 mg/dL (16.7 ± 0.8 mmol/L); (3) subjects were not exposed to any experimental protocol that might have affected their baseline physiology (e.g., induced recurrent hypoglycemia); and (4) duration of diabetes for subjects with T1DM was longer than 5 years. Exclusion criteria for both groups of subjects included history of stroke, seizures, neurosurgical procedures, or arrhythmias, and use of drugs that can alter glucose metabolism (other than insulin for the patients with diabetes). All subjects gave informed consent using procedures approved by the Institutional Review Board: Human Subjects Committee of the University of Minnesota. A summary of subject characteristics enrolled in this study is presented in Table 1.
Characteristics of subjects with type 1 diabetes mellitus (T1DM) and nondiabetic controls included in this study
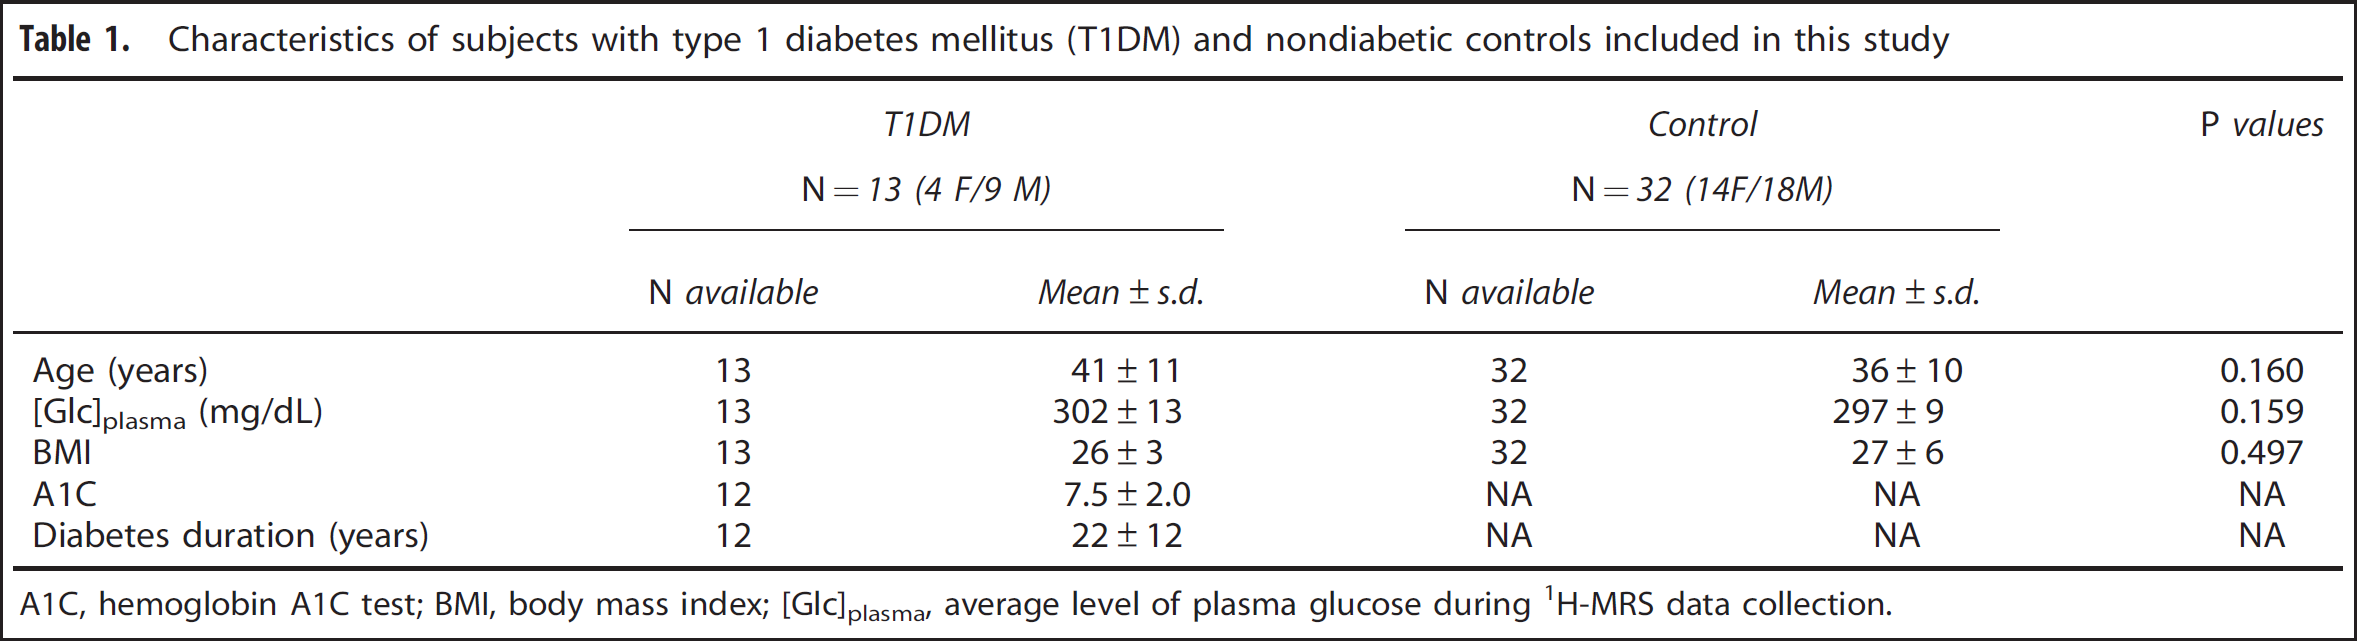
A1C, hemoglobin A1C test; BMI, body mass index; [Glc]plasma, average level of plasma glucose during 1H-MRS data collection.
Magnetic Resonance Imaging and Spectroscopy
Experiments were carried out on a 90-cm-bore 4 T magnet (Siemens/Oxford Magnet Technology, Eynsham, UK) with Varian INOVA console (Varian, Palo Alto, CA, USA). A quadrature half-volume RF coil with two geometrically decoupled loops of 14 cm was used for RF signal transmission and reception. Multislice fast spin echo MR imaging (echo spacing = 15 milliseconds, echo train length = 8) was used for positioning of the volume of interest (VOI). The 1 H-MRS data were acquired from two brain regions. The first VOI location encompassed a region predominantly rich in gray matter in the occipital lobe, while the second VOI encompassed an area predominantly rich in white matter in the parieto-occipital region (Figure 1). The VOI in the parieto-occipital region was carefully selected to avoid the partial volume effect caused by enlarged ventricles in some T1DM subjects. For convenience, we will subsequently refer to these regions simply as gray or white matter. The 1 H-MRS data were acquired using ultra-short echo-time STEAM (echo-time TE = 4 milliseconds; repetition time TR = 4.5 seconds) combined with outer volume suppression and VAPOR water suppression.16,17 All first- and second-order shim terms were automatically adjusted using FASTMAP with EPI readout.18,19 Data were collected from gray- and white-matter VOIs in an interleaved manner in blocks of 16 scans over a period of ~25 to 50 minutes, with duration depending on the stability of plasma Glc level close to the target value of 300 mg/dL.
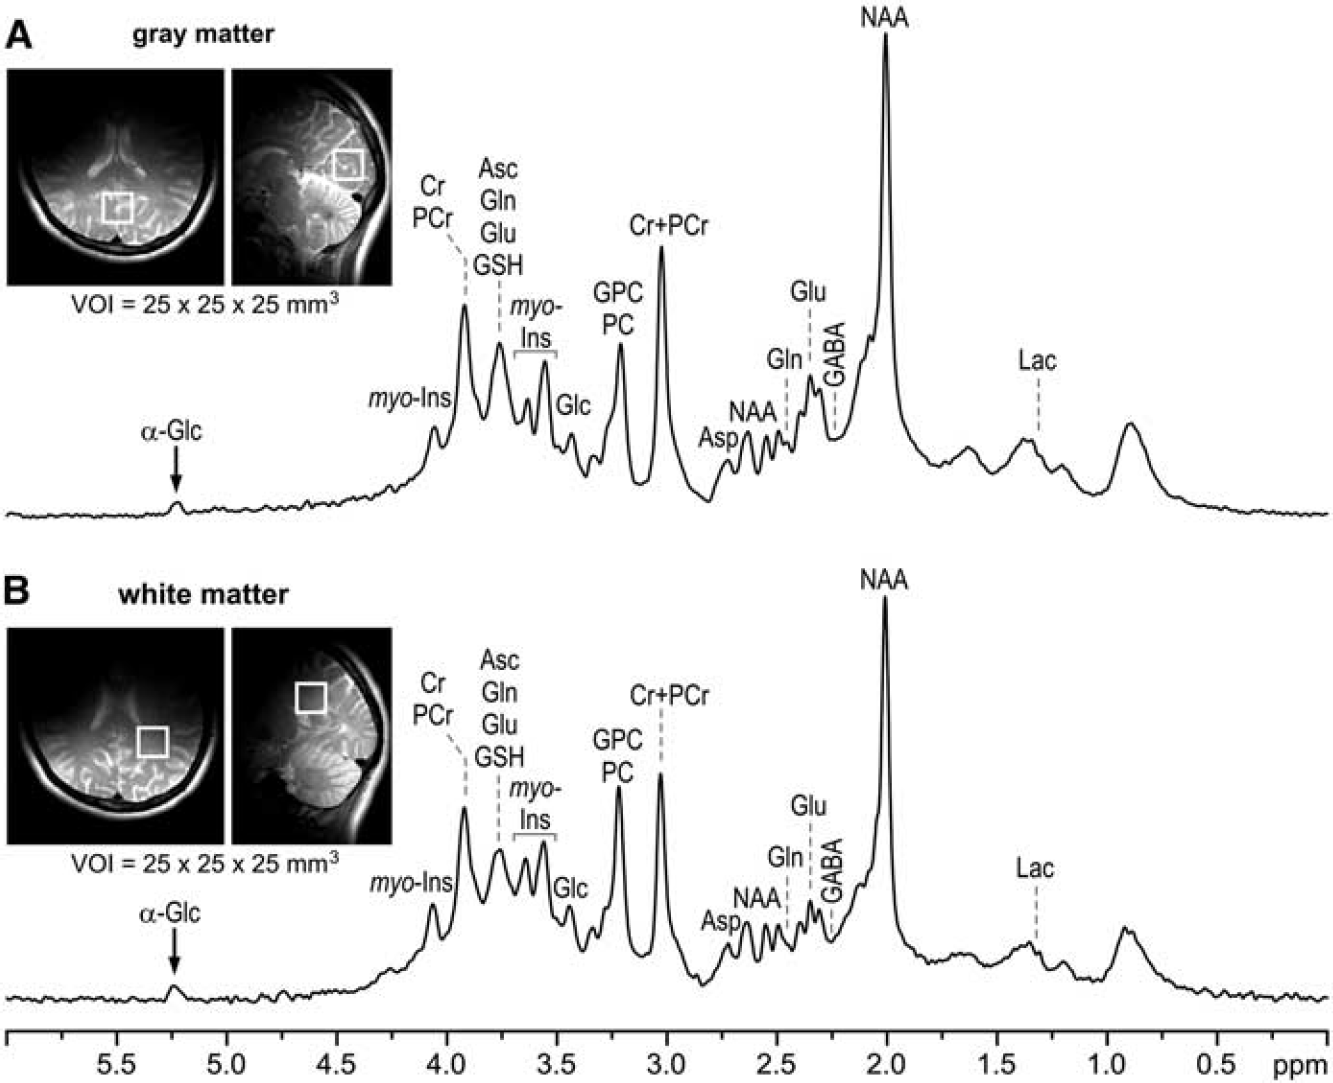
Representative proton magnetic resonance (
1
H-MR) spectra acquired at 4 T from a nondiabetic control in the (
Magnetic Resonance Spectroscopy Data Processing and Statistical Analysis
Spectroscopic data were averaged in blocks of 16 scans and stored separately in memory for subsequent frequency correction. Only data blocks that met the strict criterion of stable concurrent plasma glucose levels (300 ± 15 mg/dL) were retained. On average, 8 ± 2 and 9 ± 2 blocks were summed for gray and white matter, respectively. Summed spectra were corrected for residual eddy currents using unsuppressed water signal. 20 The residual water signal, which never exceeded 30% of the signal intensity of NAA methyl resonance, was removed using the HSVD algorithm. 21 Metabolites in each of gray and white matter were quantified using LCModel, 22 with a simulated basis set that included a spectrum of fast relaxing macromolecules (inversion time = 0.675 seconds, repetition time = 2 seconds, removed residual signal of phosphocreatine) measured from gray- and white-matter brain regions, respectively. Unsuppressed water signal was used as an internal reference assuming 80% and 72% brain water content in gray and white matter, respectively.23–25 LCModel analysis was performed on the chemical shift range 0.5 to 6.0 p.p.m., including the H-1 resonance of α-Glc at 5.23 p.p.m. Only metabolites quantified with Cramér-Rao lower bounds (CRLB) <50% were used for further analysis. The following 17 metabolites were consistently quantified from gray- and white-matter spectra: alanine (Ala), aspartate (Asp), ascorbate (Asc), the sum of glycerophosphocholine and phosphocholine (GPC + PC), creatine (Cr), phosphocreatine (PCr), γ-aminobutyric acid (GABA), Glc, Gln, Glu, glutathione (GSH), myo-Ins, scyllo-inositol (scyllo-Ins), lactate (Lac), NAA, N-acetylaspartylglutamate (NAAG), phosphoethanolamine (PE), and taurine (Tau). In addition, the content of fast relaxing macromolecules (MM), predominantly originated from intercellular proteins, was quantified. For white matter and gray matter separately, the concentrations of the various metabolites were compared between the nondiabetic controls and the T1DM subjects using unpaired two-sided t-tests assuming equal variances. Regressions were performed to establish if metabolites were significantly correlated with age in the nondiabetic controls, to determine whether T1DM versus control comparisons needed to be repeated including adjustment for an age effect. The type I error level was set at 0.05.
RESULTS
The subjects in the T1DM group and the control group had similar age and body mass index distributions, and their plasma glucose was clamped at the same level of 300 ± 15 mg/dL while 1 H-MRS data were acquired (Table 1).
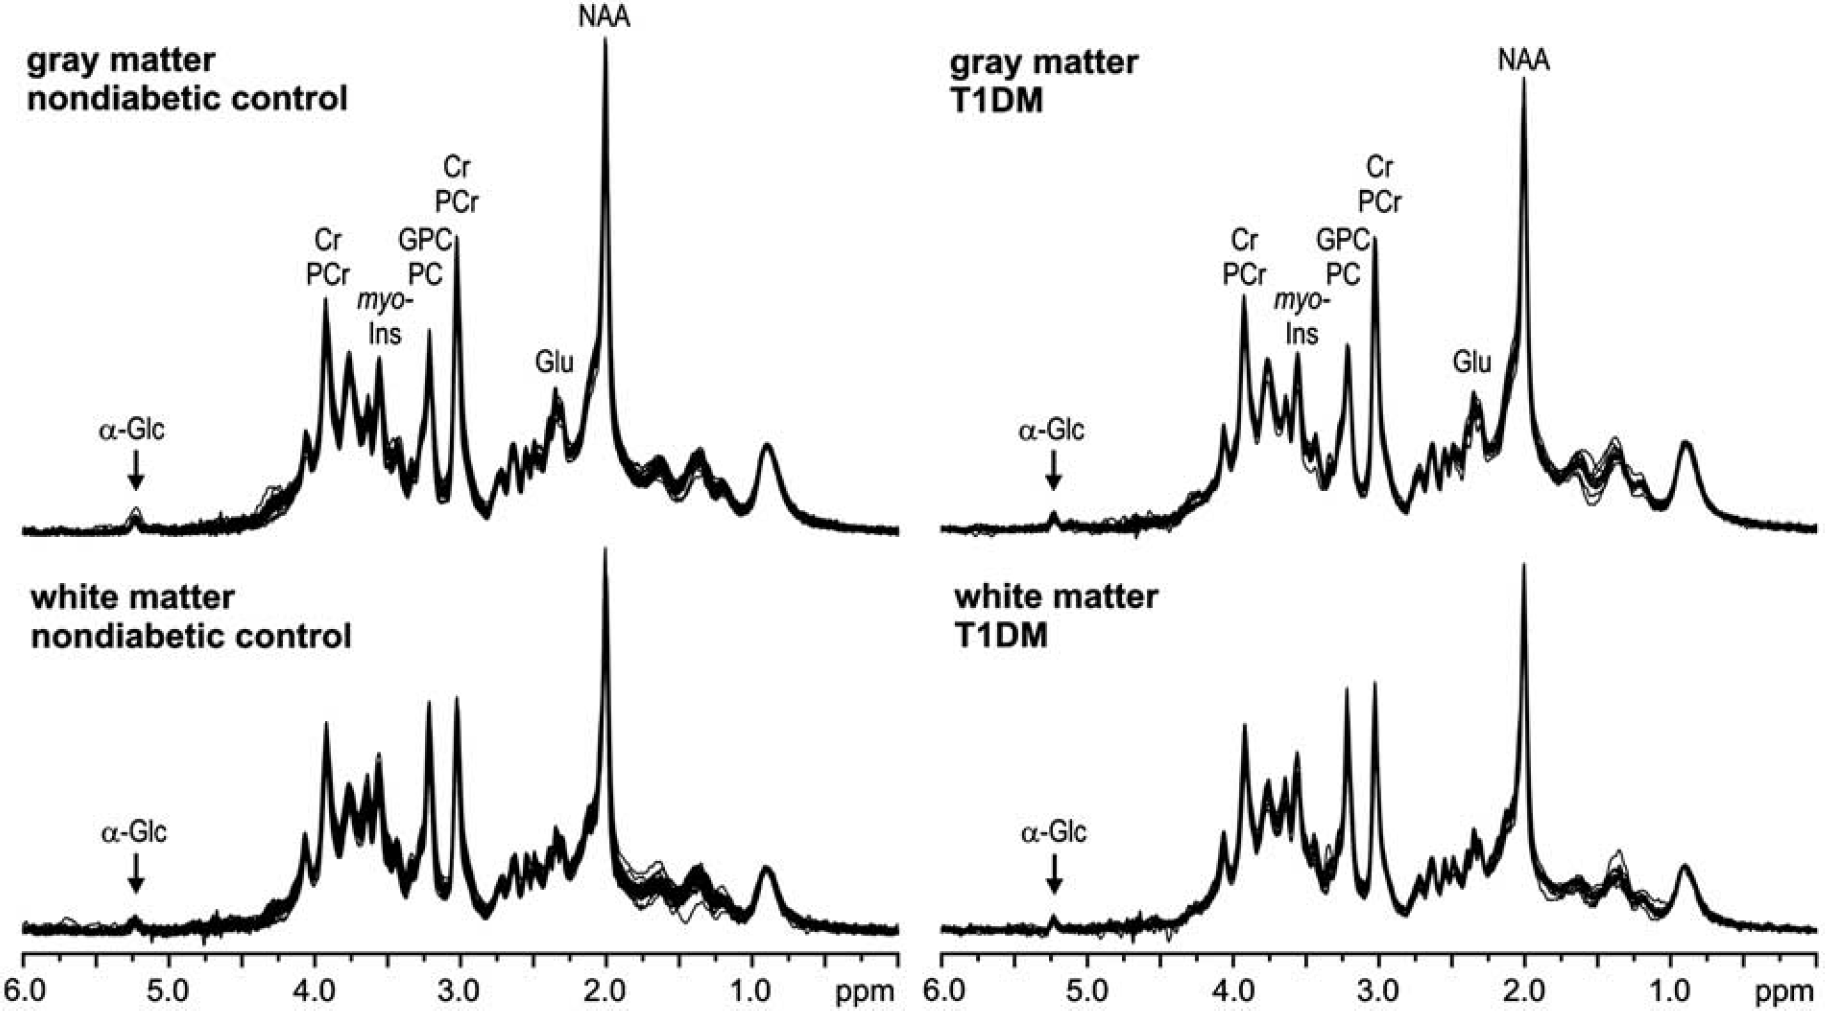
The spectral quality achieved in this study and the typical locations of VOIs in the occipital and parieto-occipital regions for acquiring gray- and white-matter spectra are shown in Figure 1. The automatic FASTMAP shimming resulted in reproducible spectral resolution, corresponding to the unsuppressed water signal linewidth of 7 to 9 Hz. The reproducibility of the spectral quality throughout this study is evident when superimposing all spectra acquired from all subjects (Figure 2). In addition, 1 H-MR spectra had artifact free flat baselines and their patterns in the 0.7 to 1.8 p.p.m. region indicate very good localization performance resulting from eliminating signals of subcutaneous lipids from outside of the VOI. The principle of metabolite quantification using LCModel is shown in Figure 3, which illustrates how the experimental in vivo 1 H-MR spectrum from the brain was decomposed into spectra corresponding to metabolites included in the basis set. Seventeen brain metabolites were consistently quantified from both locations (Figure 4) with average CRLB < 10% for Cr, PCr, Glc, Gln, Glu, myo-Ins, NAA, GPC + PC, and with CRLB < 30% for the remaining weakly represented metabolites Asc, Asp, GABA, GSH, scyllo-Ins, Lac, NAAG, PE, and Tau. In absolute units, the average CRLBs (i.e., the estimated errors of quantification) in the controls were below 0.27 μmol/g for all quantified metabolites in both brain regions (Table 2). Robustness of metabolite quantification was demonstrated by small intersubject coefficient of variation of the total creatine (Cr + PCr) concentration in gray-matter (CV = 6%) and white-matter (CV = 8%) regions in controls and T1DM patients combined.
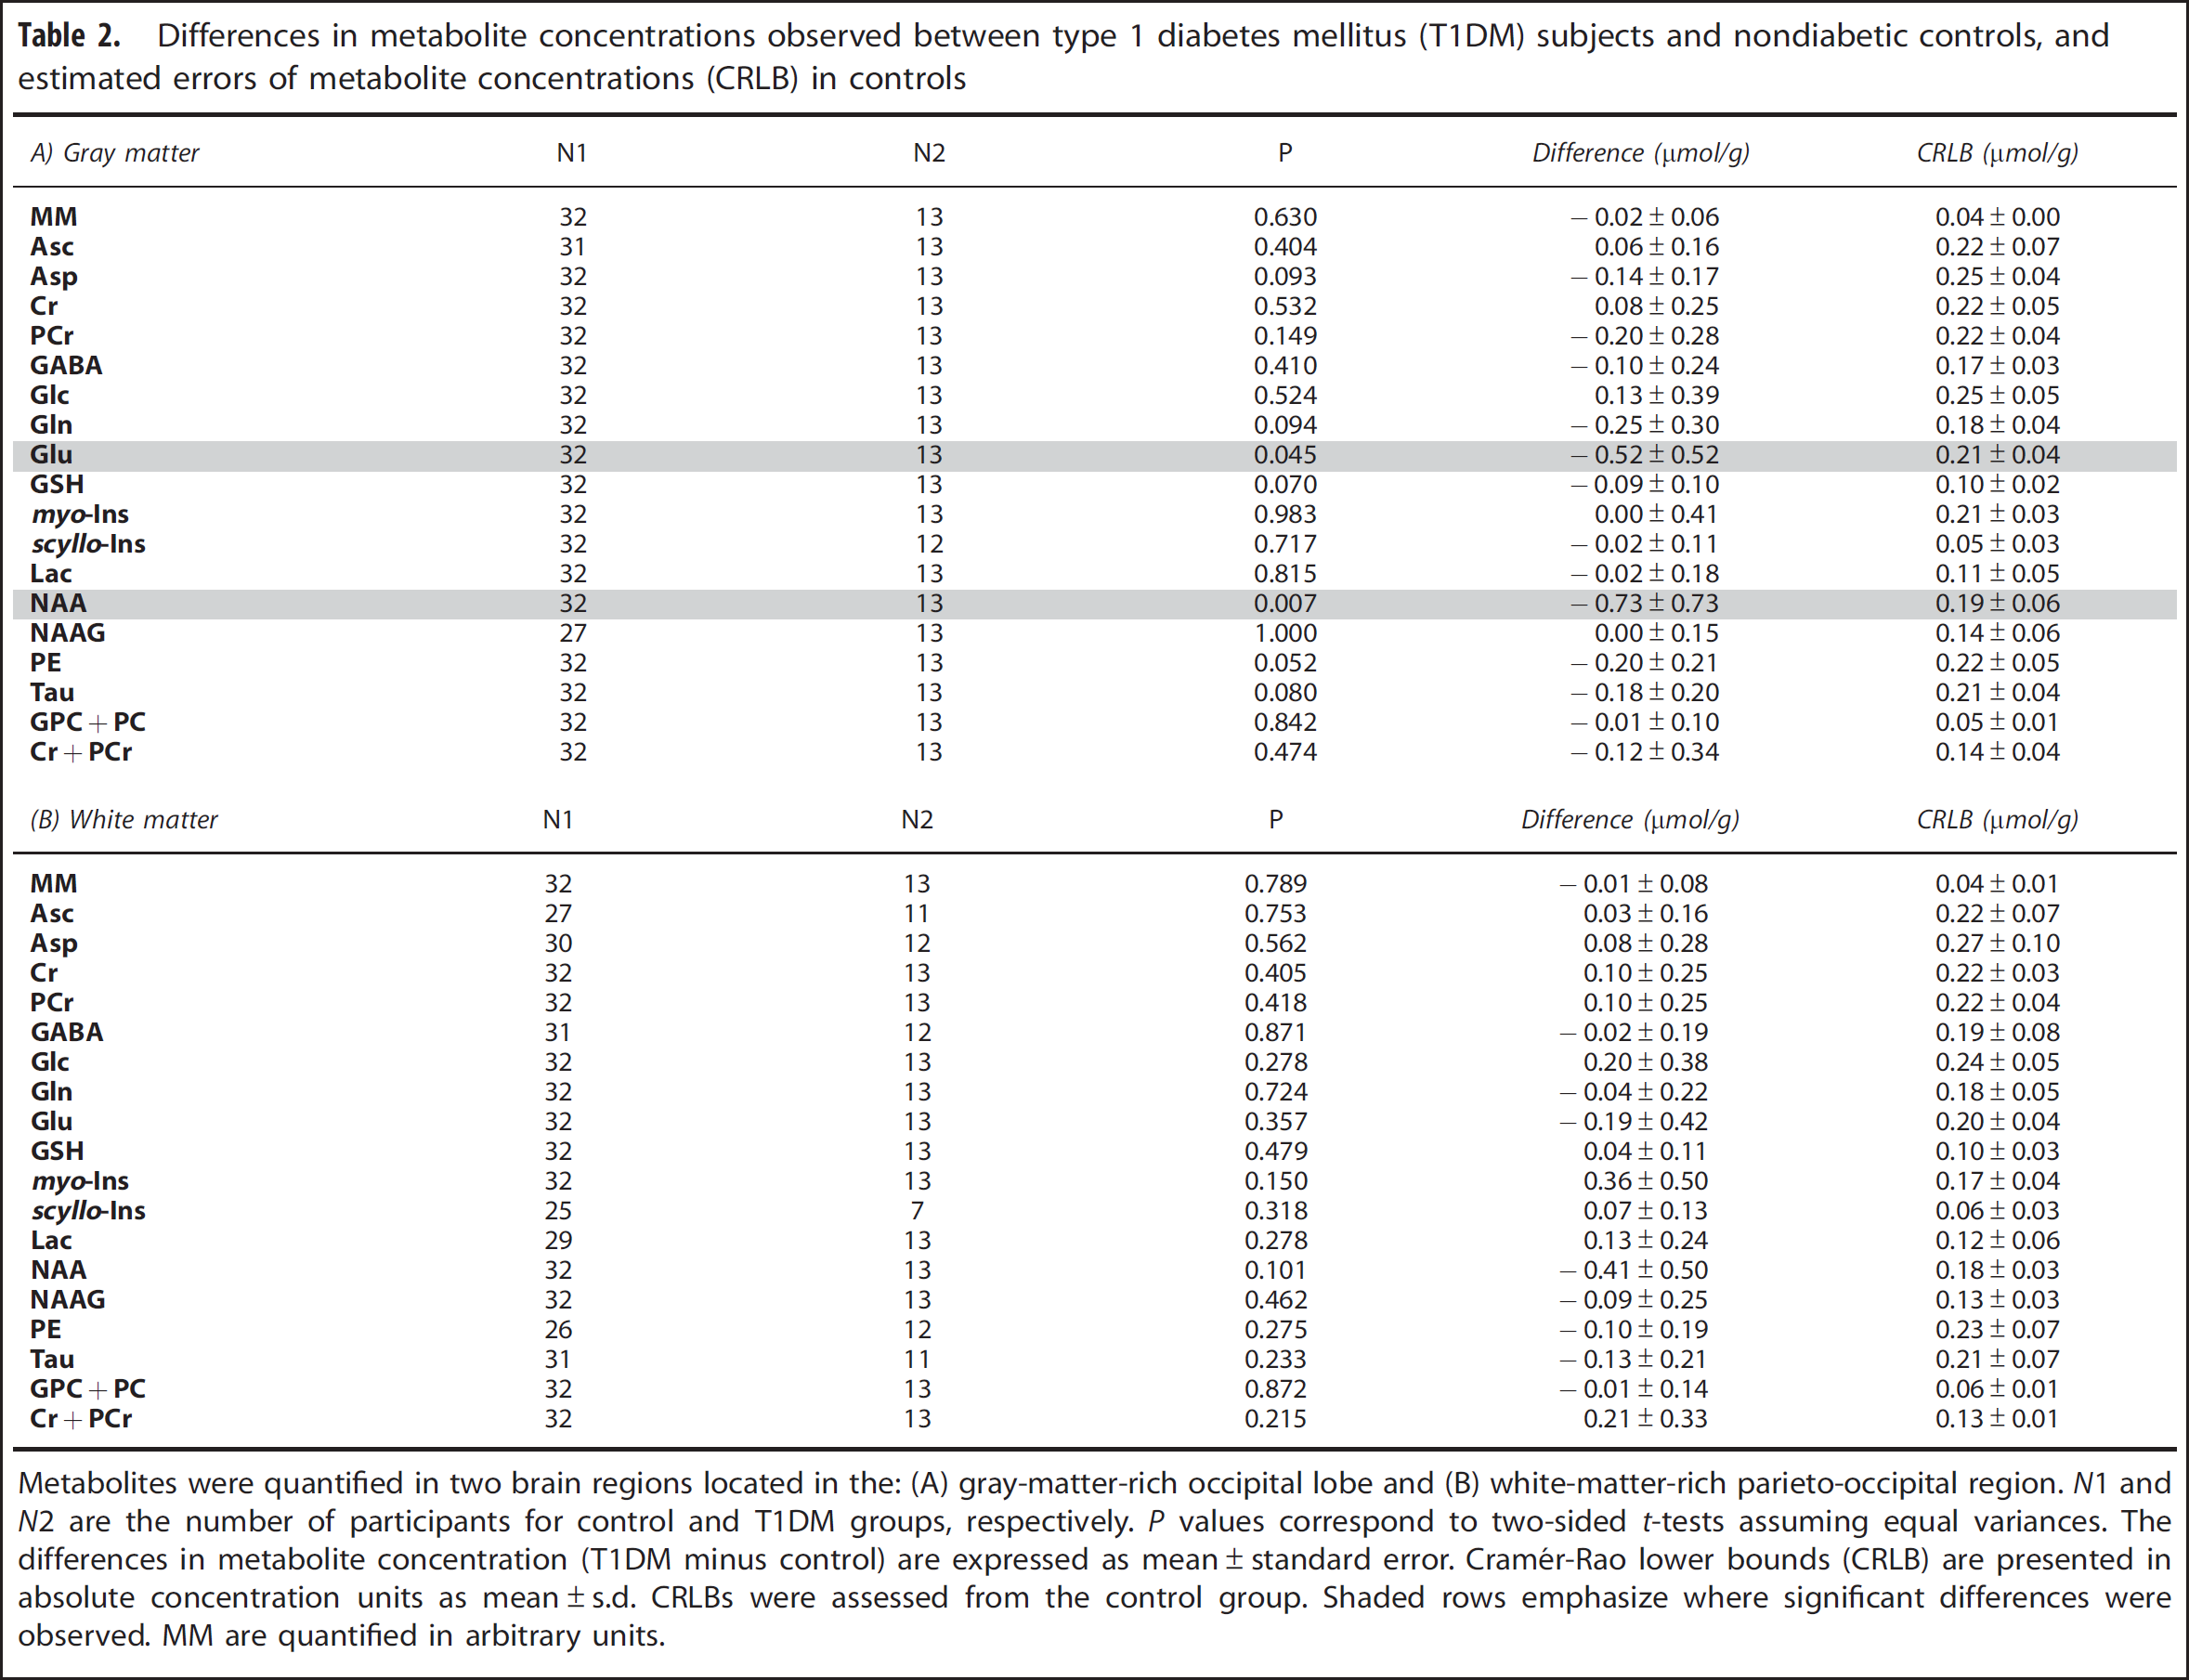
Differences in metabolite concentrations observed between type 1 diabetes mellitus (T1DM) subjects and nondiabetic controls, and estimated errors of metabolite concentrations (CRLB) in controls
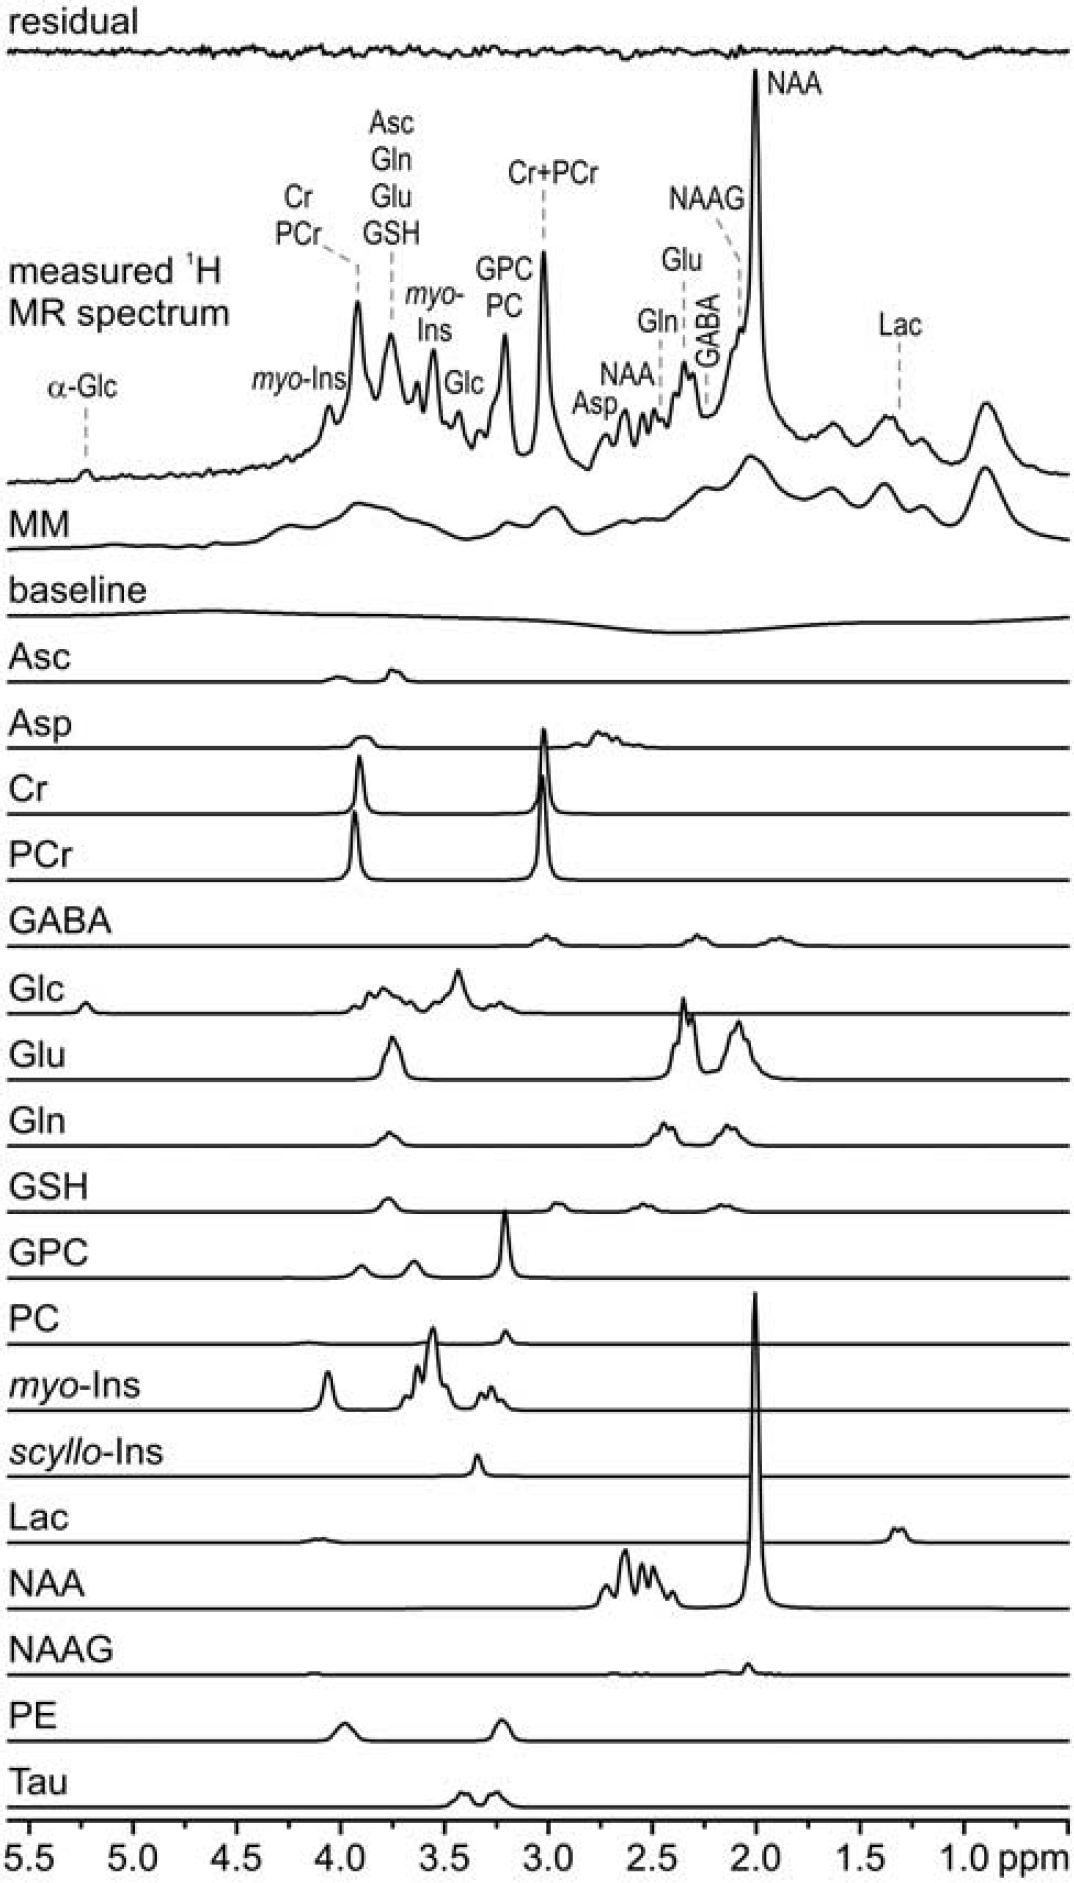
LCModel analysis of the proton magnetic resonance ( 1 H-MR) spectrum acquired from the gray-matter-rich occipital lobe of a nondiabetic control. The simulated LCModel basis set included an experimentally measured spectrum of fast relaxing macromolecules. LCModel analysis was performed in the 0.5 to 6.0 p.p.m. chemical shift region including the H-1 resonance of α-glucose.
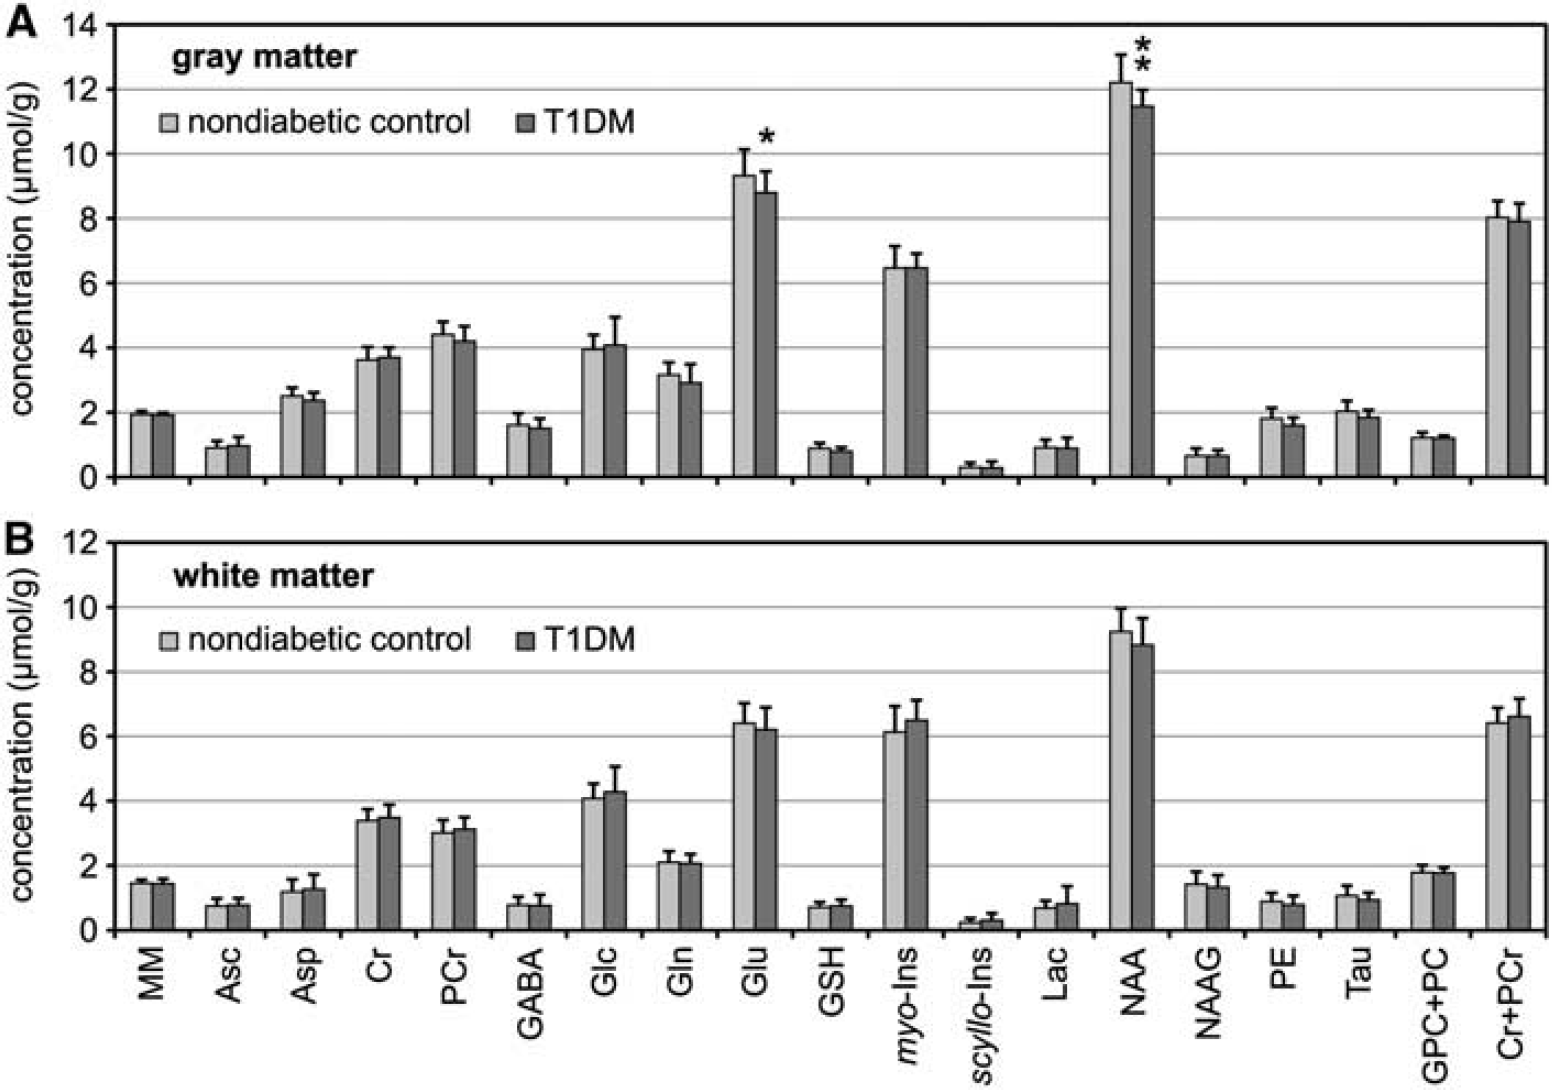
Comparison of neurochemical profiles of type 1 diabetes mellitus (T1DM) patients (N = 13) relative to nondiabetic controls (N = 32). Metabolite concenrations were measured from the (
Differences in total creatine levels between T1DM patients and controls were not observed in either gray- or white-matter regions (differences relative to controls of −2% (P = 0.474) and 3% (P = 0.215), respectively). Of all quantified metabolites in both brain regions (Table 2), lower levels of NAA (–6%, P = 0.007) and Glu (–6%, P = 0.045) were observed in the gray matter of T1DM patients relative to controls (Figure 4). A trend for decreased concentration of PE (–11%, P = 0.052) and GSH (–10%, P = 0.070) were also observed in the gray-matter region of T1DM patients compared with controls. No other significant group differences were observed despite relatively narrow confidence intervals (Table 2) determining the precision of metabolite quantification. No significant correlations of metabolite levels with age were observed in the nondiabetic controls for either brain region, expect for PCr in the white matter (r = 0.432, P = 0.014).
DISCUSSION
In the present study we compared neurochemical profiles of subjects with T1DM with those of nondiabetic controls. The 1 H-MRS data were acquired from two regions localized in the gray-matter-rich occipital lobe and white-matter-rich parieto-occipital region (Figure 1). High reproducibility of our experimental protocol is discernible from superimposed spectra of all subjects (Figure 2). The achieved spectral quality (Figure 1) and its consistency over the various subjects (Figure 2) enabled reliable quantification of 17 brain metabolites at 4 T using LCModel analysis. This approach also provided reasonable estimates of weakly represented metabolites, such as GABA, GSH, or Asc, that typically require editing sequences for their quantification.
The robustness of these data was also emphasized by small coefficients of variations in the levels of total creatine (Cr + PCr), which are generally used as an internal reference for metabolite quantification. Finally, metabolite concentrations reported in this paper can be considered as ‘absolute’, because the chosen acquisition parameters of long TR and ultra-short TE substantially reduced the signal attenuation due to T1 and T2 relaxation processes.
The impact of long-term diabetes on the brain neurochemical profile observed in this study was overall marginal. In fact, of all 17 detected metabolites, only NAA and Glu levels in the occipital gray matter were found to be significantly different between controls and T1DM patients with average disease duration of 22 ± 12 years. Other metabolites did not show significant differences between groups in either brain region despite low coefficients of variation in metabolite levels across the groups. Our data did not show significant correlation of NAA levels with age in the group of nondiabetic subjects, in agreement with previous findings,26–29 and in disagreement with others.30–32 However, it should be noted that the age range of nondiabetic subjects investigated in this study (20 to 54 years) was not sufficiently broad for a fair comparison with previous studies.26–32
Lower levels of NAA and Glu in the gray matter of T1DM subjects cannot be ascribed to a possible bias in metabolite quantification, such as altered water content or partial volume effect resulting from brain atrophy, because this type of systematic error in underestimating concentration should have been observed for all metabolites as well as for the content of MM. Since NAA and Glu are exclusively present in the neuronal compartment, our findings might indicate a partial neuronal loss or dysfunction within the gray-matter-rich region as a consequence of long-term T1DM, which is in agreement with reduced gray-matter density found by others using voxel-based morphometry.25,26 Findings of slightly lower levels of NAA similar to ours were reported by other investigators in the occipital cortex of T1DM subjects with increased A1C levels, 14 as well as in other brain regions of T1DM subjects, including frontal white matter, 4 frontal lobes and basal ganglia, 6 parietal cortex, 13 pons and posterior-parietal white matter of children with poorly controlled diabetes, 6 and thalamus of subjects with diabetic peripheral neuropathy. 10 Those findings were also generally interpreted as a manifestation of neuronal loss or dysfunction.
Bischof et al 1 have also compared neurochemical profiles acquired from regions of the brains of T1DM and controls similar to those examined in the current study. In their work, no differences were found for any of the six quantified metabolites, including NAA, between subjects with T1DM and nondiabetic controls. 1 These findings were collected under euglycemic conditions and thus the discrepancy between the NAA results could be due to the hyperglycemic condition under which our data were acquired. However, hyperglycemia has been shown to have no effect on metabolite concentrations other than glucose in nondiabetic controls, 33 so we think it is unlikely that this explains the discrepancy between findings. In our approach, we used higher field strength and a larger sample size than did Bischoff et al, which raises the possibility that our study had greater power to detect group differences.
The concentration of brain glucose depends on plasma glucose levels,33,34 and may be influenced by the ability of the subject to detect symptoms of hypoglycemia. 3 In this study, the plasma glucose levels were tightly clamped to the target hyperglycemic value of 300 mg/dL and subjects had variable ability to detect hypoglycemia. Under these conditions, differences in brain glucose concentration between groups of T1DM subjects and nondiabetic controls were observed neither in gray matter nor in white-matter brain regions. These results are in agreement with our previously reported results on brain glucose in T1DM, which were based on brain glucose quantification using exclusively the
H-1 resonance of α-Glc at 5.23 p.p.m. 9 Finally, previous studies have reported small alterations of a few other metabolites in other brain regions of T1DM subjects, including higher Glx level in the prefrontal cortex,5,15 higher concentration of myo-Ins in the frontal cortex, 4 and higher level of choline in frontal/temporal lobes and basal ganglia. 6 Higher levels of myo-Ins have been reported also in the occipital cortex11,13 and in the parietal white matter. 13 However, in the occipital gray matter and parieto-occipital white-matter regions measured in our study we did not observe consistent differences between groups in any of the remaining 15 quantified metabolites. All together, these observations suggest that differences in brain neurochemical profiles of subjects with T1DM relative to nondiabetic controls are small and likely region-dependent.
We conclude that long-standing type 1 diabetes likely does not substantially impact the brain neurochemical profile in either white matter or gray matter as measured by 1 H-MRS. Slightly lower NAA and Glu levels were observed in the occipital gray matter of subjects that had T1DM for 22 ± 12 years, which might indicate a partial neuronal loss or dysfunction as a consequence of long-term T1DM. Future study will be necessary to define the clinical significance of these findings.
DISCLOSURE/CONFLICT OF INTEREST
The authors declare no conflict of interest.
Footnotes
ACKNOWLEDGEMENTS
The authors are grateful for the participation of their research volunteers, and to the nursing personnel for helping to conduct the studies.