
Abstract
[11C]TMSX ([7-
Introduction
[11C]TMSX ([7-
Analyzing the binding of a radioligand in neurodegenerative diseases with wide spread pathologic assessment—as in multiple sclerosis (MS)—is not without challenges: for the estimation of specific binding (either as distribution volume ratio, DVR; or binding potential, BPND) in a target area, an anatomically distinct reference region, that is both assumingly free of disease pathologic assessment, and has negligible specific binding of the radioligand, cannot always be defined. Previous studies with A2AR radioligands have used the centrum semiovale,3, 4 cerebral cortex,5, 6 and the cerebellum 12 as reference regions, which are not always feasible reference regions in MS patients because of possible disease pathologic assessment and thus specific binding occurring in these regions. The comparability of different studies with [11C]TMSX PET is so far hindered by the lack of optimal reference region, and the heterogeneity of the data-modeling methods. Moreover, despite being the golden standard for acquiring the plasma-input function for the kinetic modeling of neuroreceptor imaging, the evaluation of radiotracer activity and metabolism via arterial blood sampling during imaging is not only uncomfortable for the study subjects, but also susceptible for errors, and often logistically demanding.
To provide alternative input function acquisition methods for brain [11C]TMSX PET imaging, we implemented and compared two different approaches: first, a noninvasive, automated method for the extraction of GM reference region using supervised clustering, and second, a method for obtaining a population-based arterial input function. These methods were compared with the methodology using original, metabolite-corrected arterial input and cerebellum reference region. Corresponding clustering methods have previously been validated for [11C]PK1119513, 14, 15 and [11C]PIB 16 brain PET image analyses, and population-based input as an option for individual arterial sampling has successfully been proposed for brain [11C]rolipram 17 and [18F]FMPEP-d2 18 PET imaging, but neither of these methods have been reported for A2AR radioligands to date. In addition, we evaluated the ability of these methods to detect neuroinflammatory changes in the brain of SPMS patients compared with healthy controls. 7
Materials and Methods
The study protocol was approved by the Ethical Committee of the Hospital District of Southwestern Finland, and the study was performed according to the ethical principles of the declaration of Helsinki.
For the development of the supervised cluster algorithm (SCA) and population-based input function (PBIF) for brain [11C]TMSX PET imaging, we used all the available [11C]TMSX PET imaging data with arterial blood samples from clinical study cohorts in our center consisting of 7 healthy controls (2 men and 5 women; mean age 49.3 years), 12 patients with MS, of whom 8 patients with SPMS (2 men and 6 women; mean age 49.4 years) and 4 with relapsing-remitting multiple sclerosis (RRMS; 1 man and 3 women; mean age 27.8), and 9 PD patients (4 men, 5 women; mean age 64.7). The main inclusion criteria for the MS patients was definite diagnosis of MS according to Poser
[11C]TMSX Radioligand Production
The radiochemical synthesis of [11C]TMSX, and the consequent arterial blood activity and metabolite analyses were performed according to the methods described in our previous work. 7 The mean radiochemical purity of [11C]TMSX at the time of the ligand injection was 97.6%, and the mean specific radioactivity was 425.2 MBq/nmol (s.d. 160.17) corresponding to a mean mass of 0.5 μg (s.d. 0.2 μg). The mean (s.d.) injected dose of [11C]TMSX was 470 MBq (46) for controls, 459 MBq (75) for MS patients, and 483 MBq (26) for PD patients, with no significant differences between groups.
[11C]TMSX PET and Magnetic Resonance Imaging, Data Processing and Nonmetabolized Tracer Fraction Analyses
A dynamic 60-minute PET scan was performed using high resolution research tomograph scanner (CTI/Siemens, Knoxville, TN, USA) 21 starting at the time of slow intravenous bolus injection of [11C]TMSX. The [11C]TMSX PET and magnetic resonance imaging (MRI), data reconstruction protocols, and the methodology for coregistrating the PET and MR images have been described in detail previously. 7 The procedures used for the segmentation of WM and GM were performed according to the methods explained in our recent study on SPMS using [11C]PK11195. 22 Individual binary masks of the cerebellum and cerebral cortical GM (neocortex; composed of bilateral frontal, parietal, occipital, and temporal regions of interest (ROIs) masked with the GM segment) were created using the automated anatomic labeling template after the procedure described in our former study. 22 The corresponding time-activity curves (TACs) for cerebellum and neocortex masks, in addition to the manually delineated normal-appearing WM (NAWM), striatum and thalamus ROIs were extracted from dynamic PET data using the in-house developed software (Carimas 2.4, Turku PET Centre, Turku, Finland). The metabolite and activity analyses of [11C]TMSX from the arterial blood were performed according to the same methodology as in our previous study. 7
Supervised Clustering of Reference Region from Brain [11C]TMSX PET Images
The automated reference region extraction from dynamic brain [11C]TMSX images was based on the methodology used in supervised clustering algorithm for brain [11C]PK11195 PET image analyses (SuperPK software; Imperial College, London, UK). 14 Briefly, a set of predefined kinetic tissue class TACs describing the average kinetics of the radioligand in different types of brain tissue is first formed. Then a weighted linear combination of tissue class TACs is fitted to each voxelwise TAC of the dynamic PET image, which is standardised using frame-wise means and s.d. 15 This procedure provides a weight coefficient for each PET image voxel representing the contribution of each kinetic class to the corresponding TAC.
For [11C]TMSX, four kinetic tissue class TACs were defined characterizing the average GM, WM, high-specific binding (HSB), and vasculature binding. The segmented GM and WM MRI volumes of healthy controls were first transformed into binary masks (thresholded using a value of 0.9) and then used for extracting WM and GM TACs from the PET image. The TACs representing HSB and vasculature binding were obtained from the PET image by using manually delineated ROIs drawn to the thalami of SPMS patients and venous sinuses of healthy controls, respectively. For evaluating the effect of different HSB class to clustering results, we derived another HSB class from ROIs drawn to the anterior putamen of the PD patients showing HSB. This alternative HSB class yielded similar results with no significant differences when compared with the MS HSB class (data not shown), and thus, only the results obtained using MS HSB class are regarded here. Finally, an individual set of kinetic class TACs were composed for each subject in a leave-one-out procedure by first standardising all class TACs to match the aforementioned standardised PET data, and then leaving out the specific subject before calculating the average standardised TAC for each class.
For reducing the possible effect of misclassification in the clustering process, the following strategy was applied: we first calculated for all the gray map voxels the ratio of the gray coefficient to the sum of all the weight coefficients. Then the gray coefficient map was thresholded to contain values above 0.25 of the gray ratio map. 16 In addition, we excluded all those gray coefficient map voxels that had also HSB and vascular binding coefficients above zero. Finally, the remaining gray map coefficients were used to calculate a weighted average of the dynamic PET image, hence creating the clustered SCA-based gray matter reference region (SCgm) TAC.
Population-Based Input Function for Brain [11C]TMSX PET Image Analyses
The population-based plasma-input function was created using data from all 28 study subjects consisting of healthy volunteers (
Evaluation of the Specific Binding of [11C]TMSX
[11C]TMSX binding was evaluated using VT (distribution volume) and DVR for validating the PBIF inputs as an option for original arterial plasma input (OPIF), and SCgm as an alternative reference region to ROI-based cerebellum. Logan's method (from 10 to 60 minutes) with OPIF and both PBIFs were used for VT estimation, and similarly the reference region inputs from both cerebellum and SCgm were used for estimating DVR within the same time interval. The range of 10 to 60 minutes was selected from different timings, by considering the plasma-input model fits in the thalamus. For each subject the initial equilibrating time (
First, the VT of the cerebellum and SCgm were compared using the data from healthy control subjects and patients with MS and PD. Second, an indirect estimate of DVR was evaluated in four target ROIs (thalamus, striatum, NAWM, and combined ROI of the neocortex) of healthy controls and SPMS patients using the target to reference VT ratio calculated with OPIF, PBIFnis, and PBIFis inputs. The VT results of this age- and sex-matched study have previously been published in our earlier study using OPIF. 7 These results were also compared with direct DVR estimates from reference-input Logan 25 (RefLog) using the aforementioned reference region inputs.
Statistical Analyses
The statistical analyses of the results were executed with SPSS software (SPSS Statistics, version 21; IBM, New York, NY, USA). The normality of the variable distributions was evaluated using Shapiro—Wilk test. The group characteristics were reported as mean and s.d. values if the distribution of the variables was normal, otherwise median and interquartile range was used. Because of few study subjects per group, and the nonnormal distribution of some of the variables, nonparametric Mann—Whitney
Results
[11C]TMSX Radioligand Metabolism
The metabolism of [11C]TMSX remained slow throughout the imaging with the mean fraction of nonmetabolized ligand being 93.4% (s.d. 4.7) at the 50 minute's time point, and no significant differences between the groups were noted (mean (s.d.) percentages in controls 90.5 (6.7); in MS group 92.7 (4.6) and in PD group 95.5 (2.8)), even though the mean in PD group was five percentage points higher compared with controls.
Reference Region Extraction using Supervised Cluster Algorithm
The TACs of the four tissue classes for [11C]TMSX SCA reference region extraction are shown in Figure 1. The resulting coefficient maps of the SCgm showed similar distribution in all study groups with majority of the voxels contributing to the reference cluster situated in the cerebral cortices and to lesser extent in the cerebellar cortices (Figure 2). The TACs in the SCgm reference region showed lower uptake in the latter part of the curve when compared with the cerebellum. The average TACs of standardised SCgm and cerebellum are illustrated in Figure 3. The [11C]TMSX VT of SCgm and ROI-based cerebellum reference, estimated using both the OPIFnis and PBIFis (see below) are shown in Figure 4. These VT results are discussed in more detail in the following chapter.
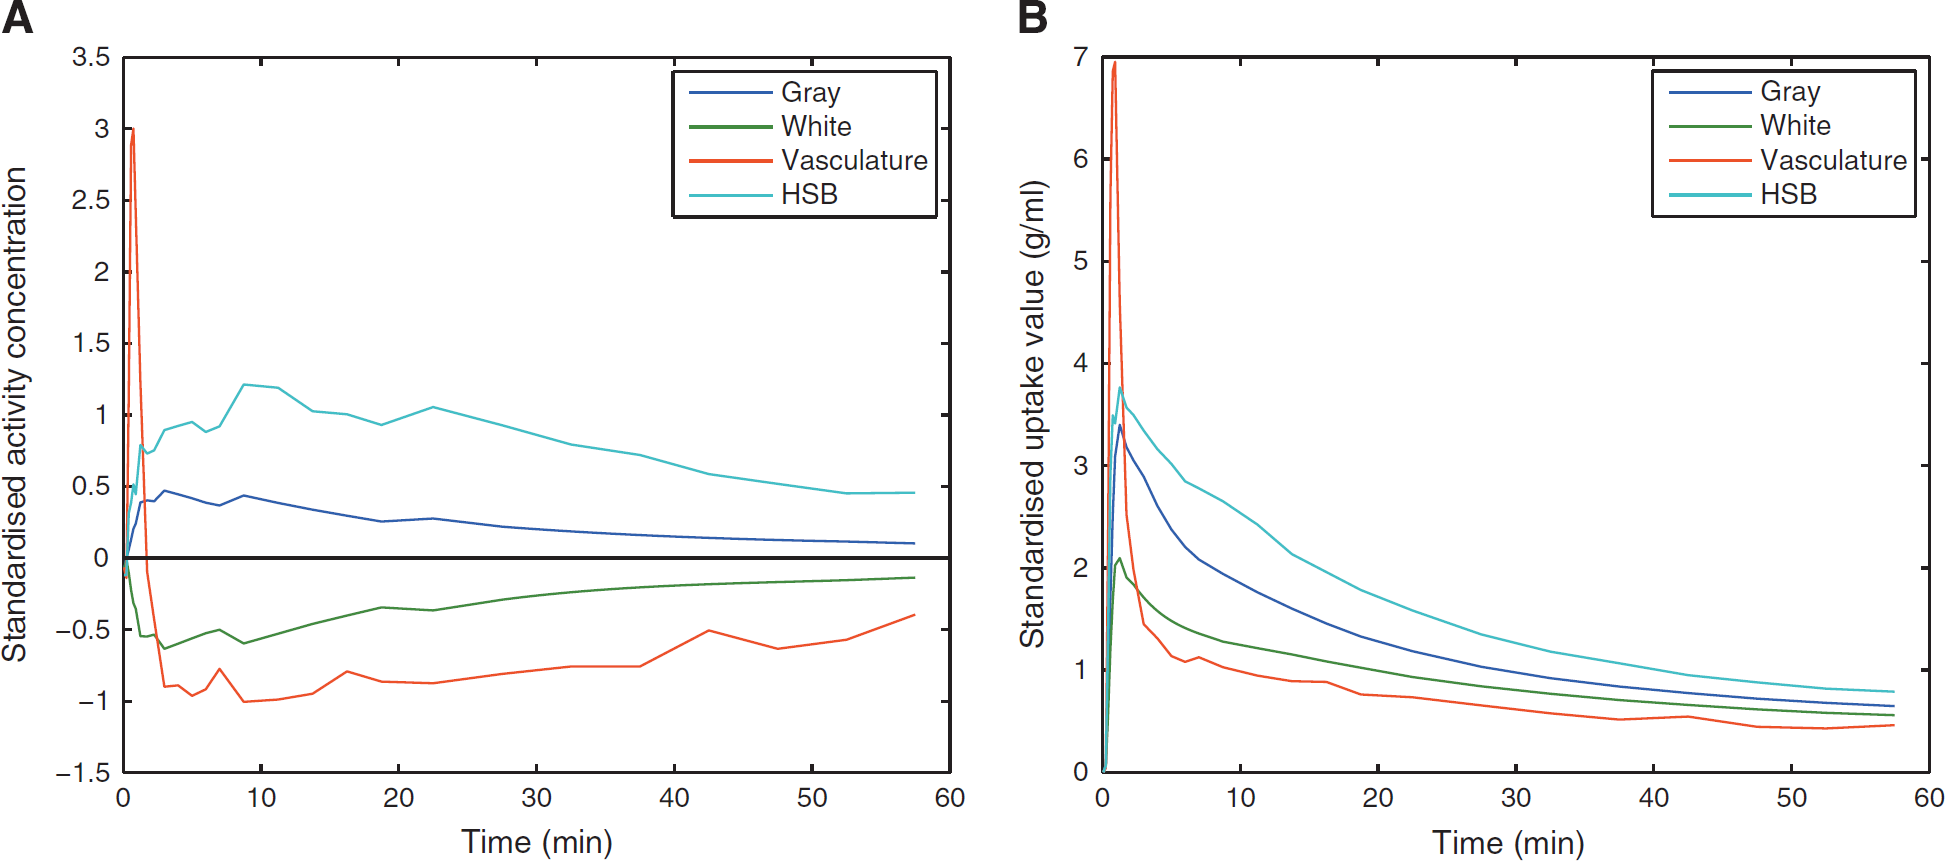
The time-activity curves (TACs) representing the average kinetics of the four predefined classes for [11C]TMSX ([7-
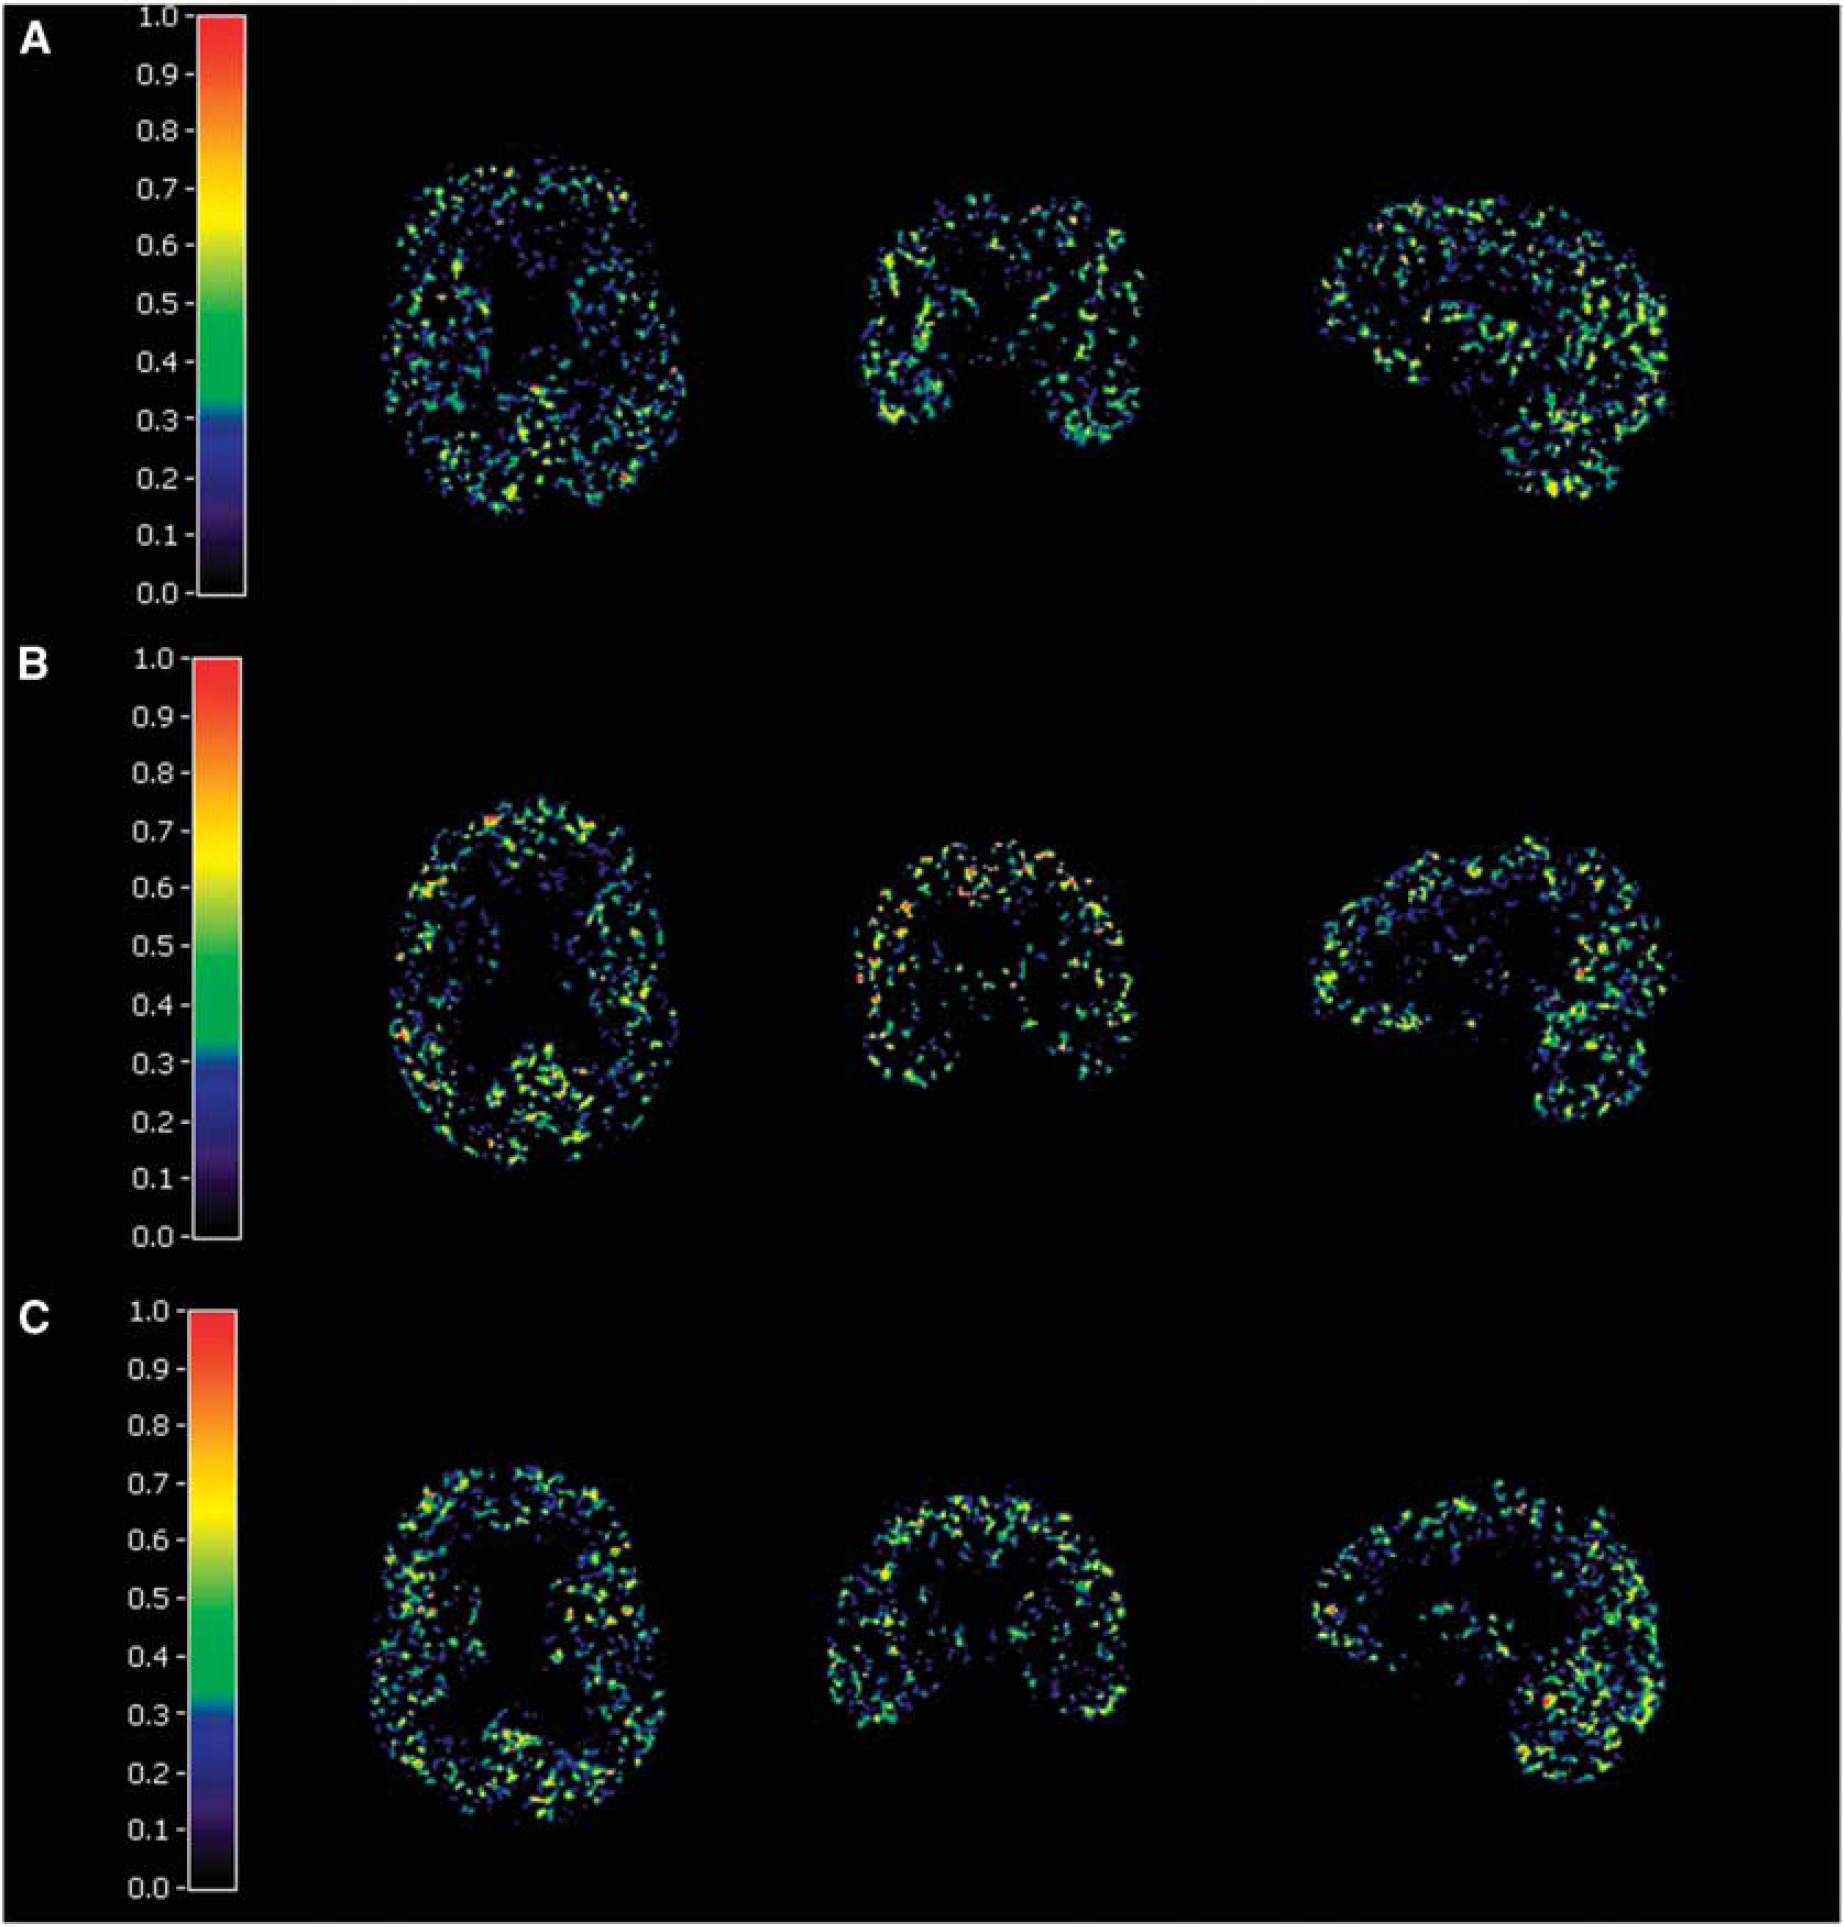
Examples of the SCA gray matter weight coefficient maps in (
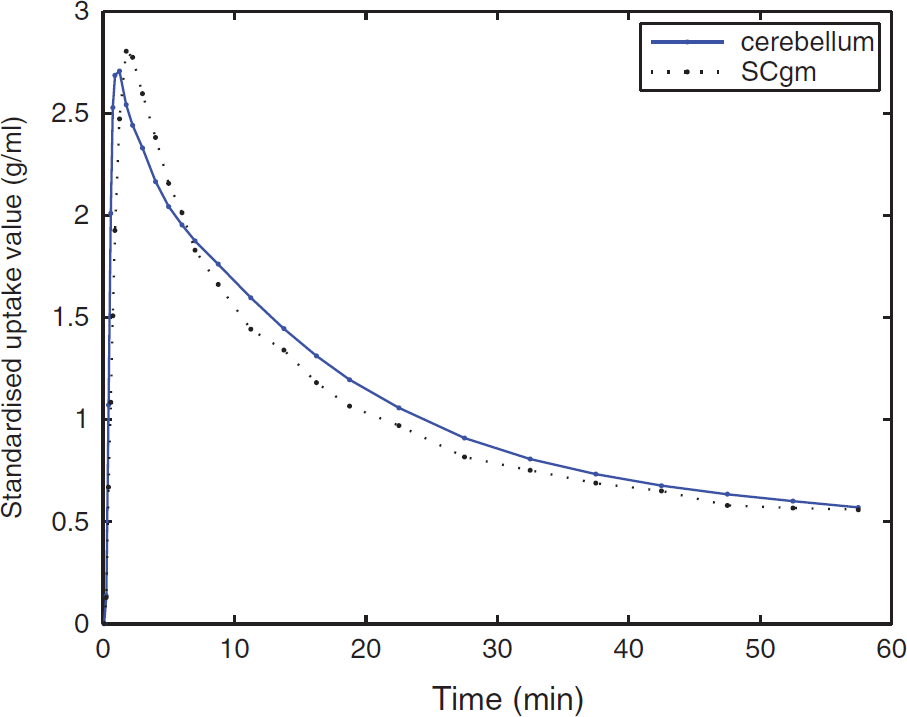
Average cerebellum and mean SCA-based gray matter reference region (SCgm) standardised time-activity curves of all 28 subjects.
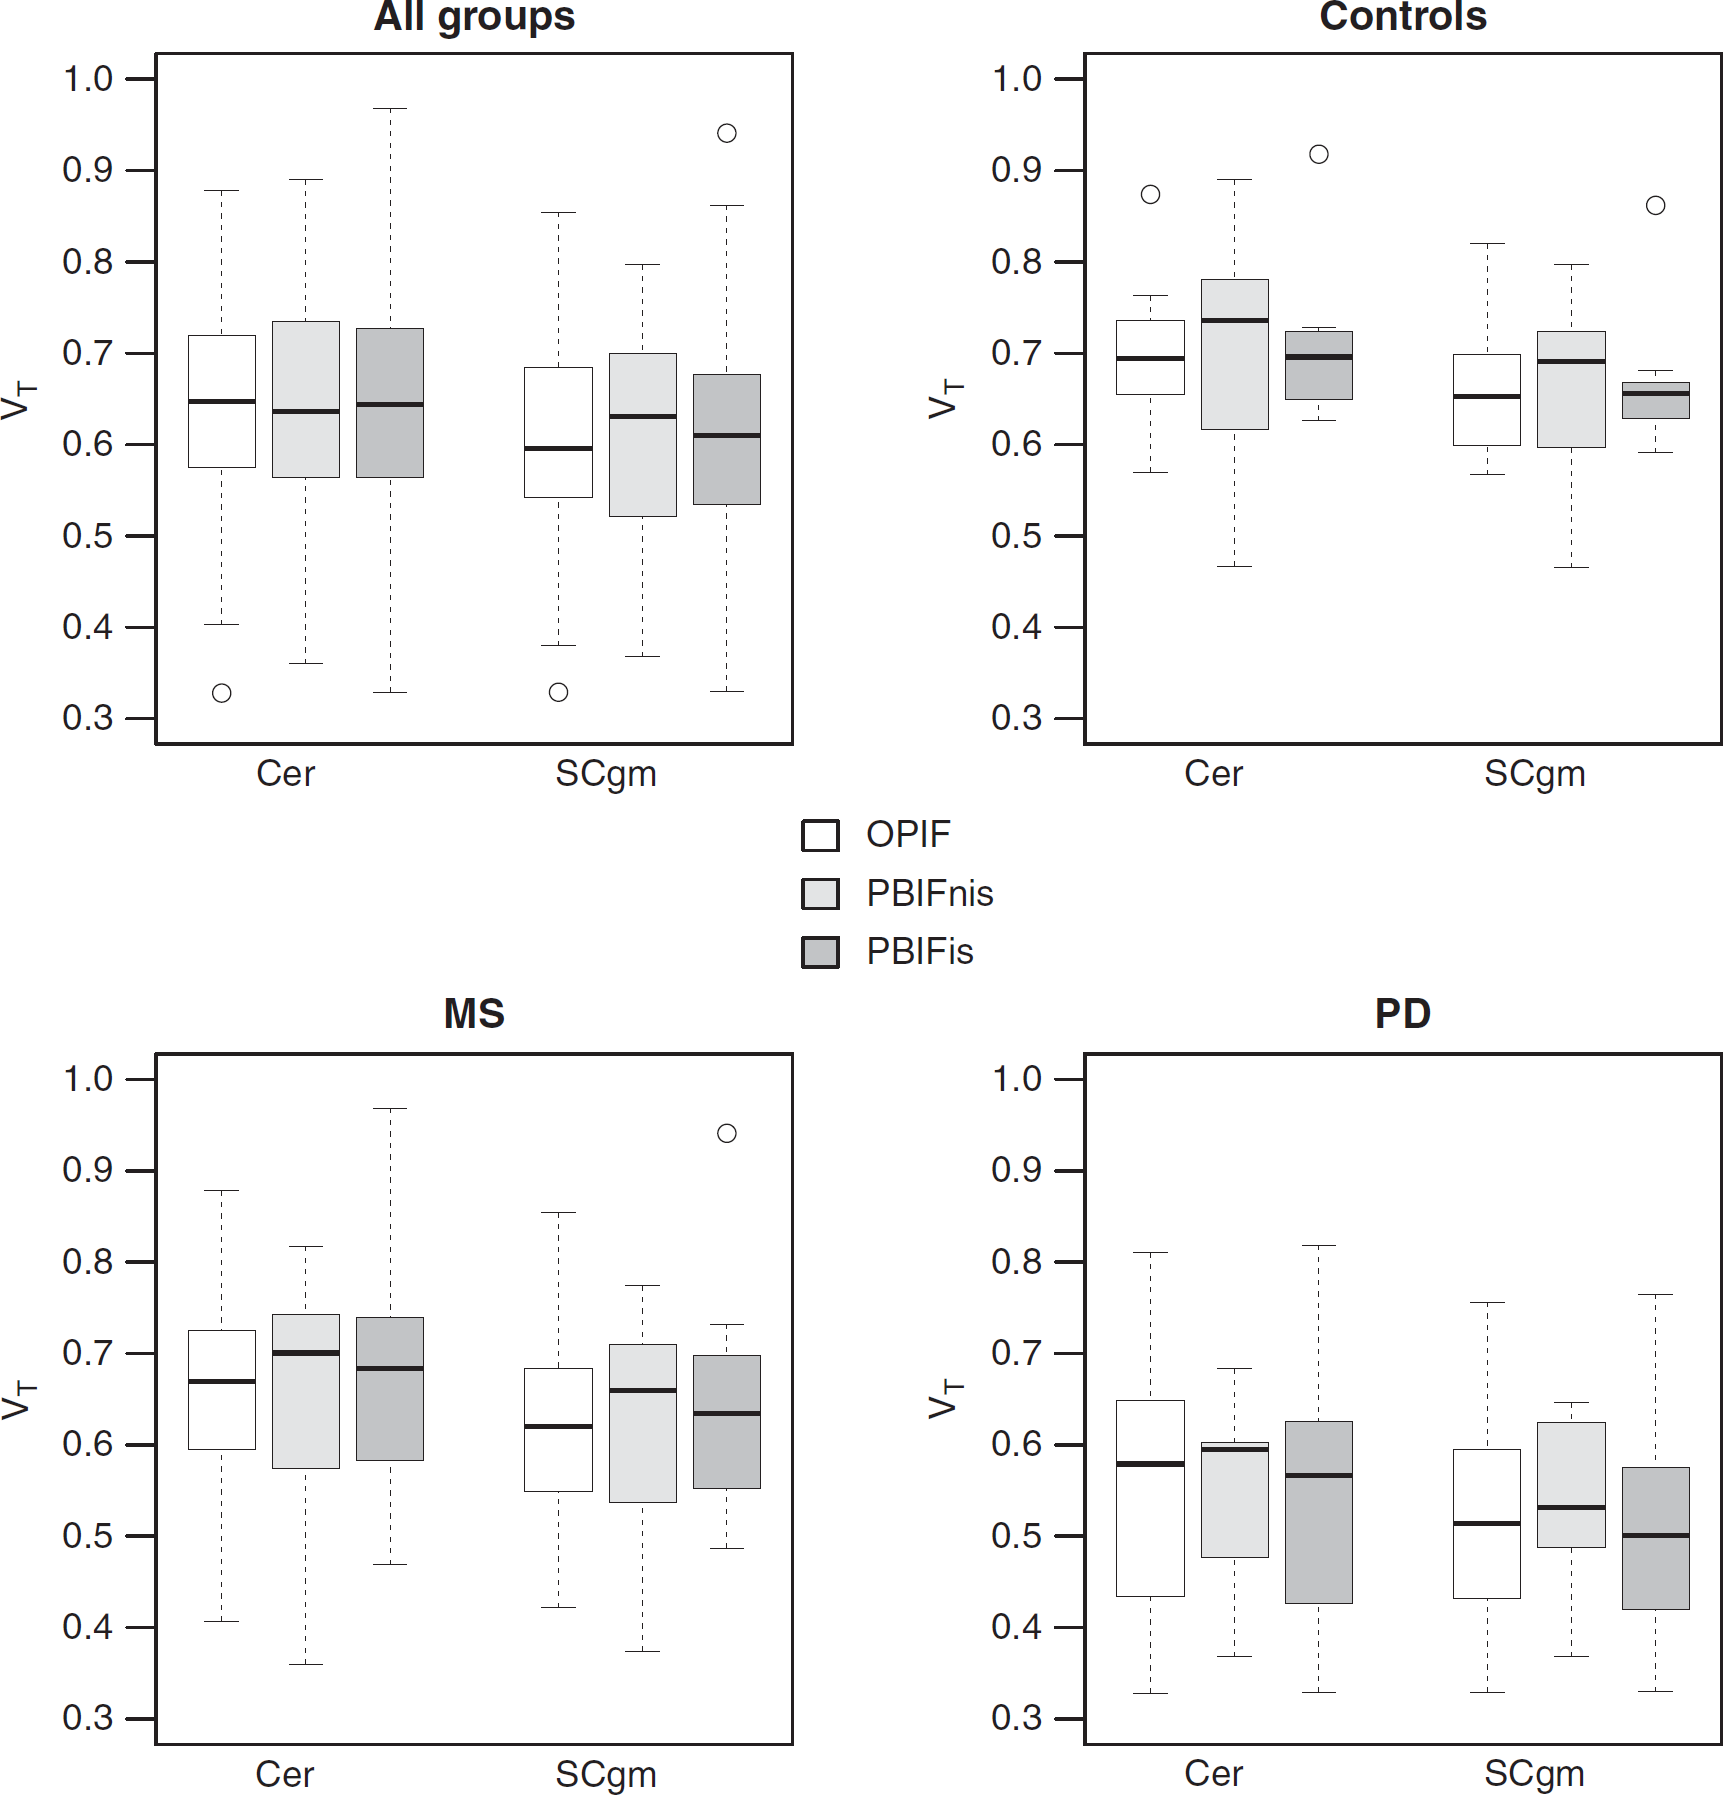
Comparison of the regional VT (correlation of distribution volume) results in the cerebellum (Cer) and clustered gray matter (SCgm) regions estimated using the Logan's method with original arterial plasma input (OPIF), noninvasively scaled population-based arterial input function (PBIFnis) and invasively scaled PBIF (PBIFis) in all subgroups visualized as boxplots showing median, minimum and maximum values and interquartile ranges. MS, multiple sclerosis; PD, Parkinson's disease.
Distribution Volumes of SCgm and Cerebellum Reference Regions
The VT of SCA-based SCgm and ROI-based cerebellum reference regions were compared in all study subjects by using OPIF and both PBIFs as input for the Logan's method. The noninvasive and invasive PBIFs yielded similar VT estimates with no statistically significant differences between the methods, and with moderate to good correlations in the cerebellum and SCgm when compared with the results of OPIF. For PBIFnis, Pearson's correlations to OPIF were 0.76 (
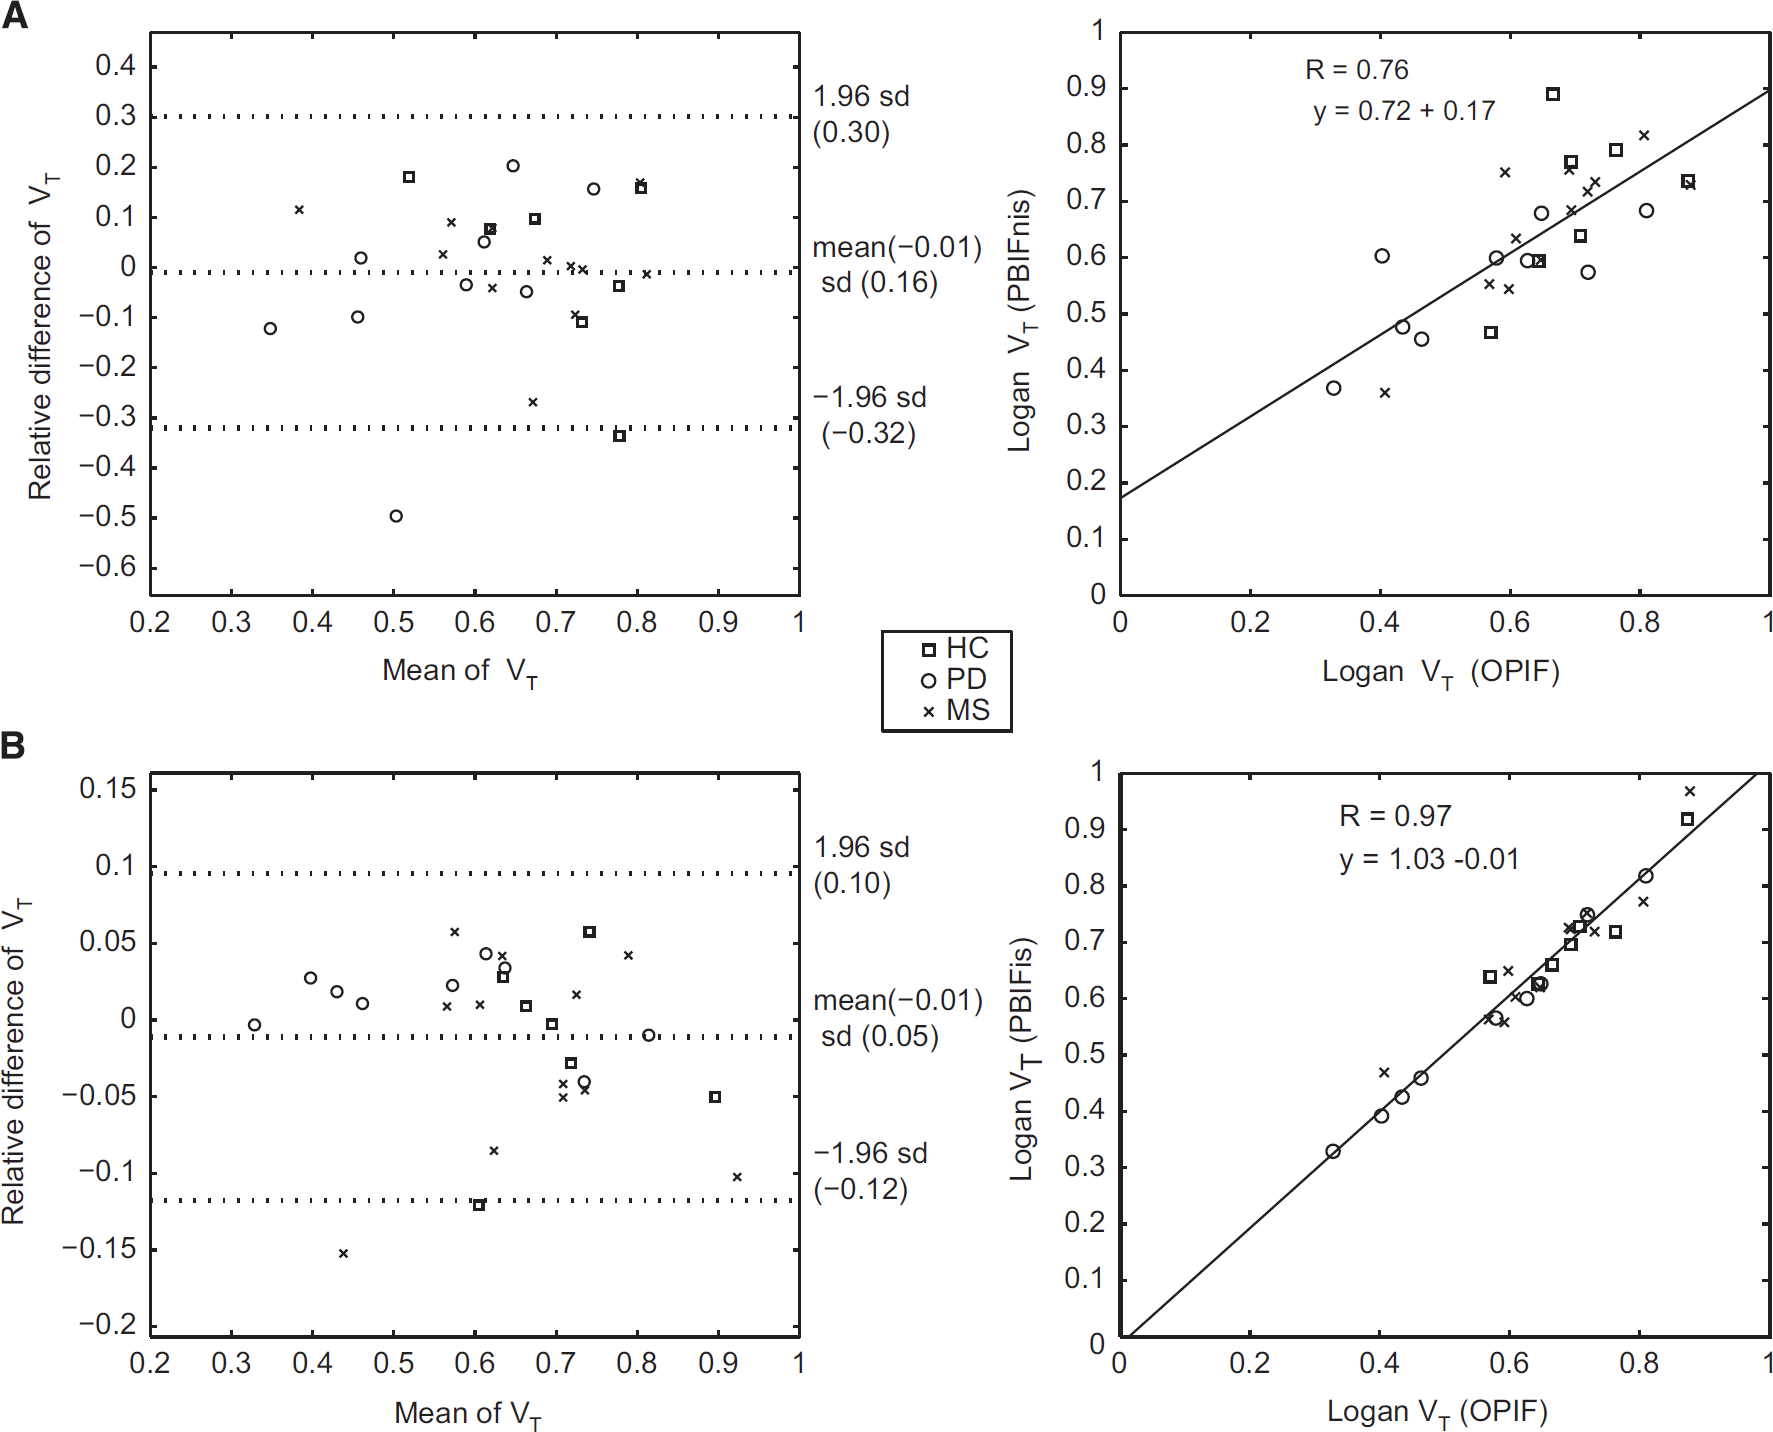
Correlations of distribution volumes (VTs) in the cerebellum using original arterial plasma input (OPIF) to VTs acquired with (
In the PD group, the VT values were generally lower when compared with the healthy controls (Figure 4): in SCgm a significant difference was found with all inputs (OPIF:
Performance of PBIFs and SCgm in the Evaluation of Specific [11C]TMSX Binding
The performance of PBIFs as input function, and SCgm as reference region in evaluating the specific binding of [11C]TMSX was tested in the clinical data of healthy controls and SPMS patients. The previously published VT results compared well with the results obtained by using PBIFs, although the VT estimates of both PBIFs had a small positive bias when comparing the group median values in different ROIs, whereas when evaluated as the median VT ratio to OPIF, the bias appeared negative for PBIFnis and negligibly positive for PBIFis (Table 1). As a measure of specific binding, DVRs from plasma-input Logan (with OPIF, PBIFnis, or PBIFis as input) and reference-input Logan with both SCgm and cerebellum ROI reference regions were estimated. Both PBIFs and the SCgm reference yielded similar results as the OPIF and the cerebellum reference. The VT results and corresponding DVR values with group differences are shown in Tables 1, and 2, respectively. The correlations of DVR estimated using PBIFnis, PBIFis, and reference Logan (RefLog) to the DVR estimates yielded using OPIF with both reference region options were highly significant in both groups in the neocortex, striatum, and the thalamus ROIs. For these regions the Spearman's correlation coefficients (ρ) were 0.99 to 1.00 (
Distribution volumes (mL/cm3; median (CV%)) with Logan using original plasma input and population-based plasma inputs in healthy controls (
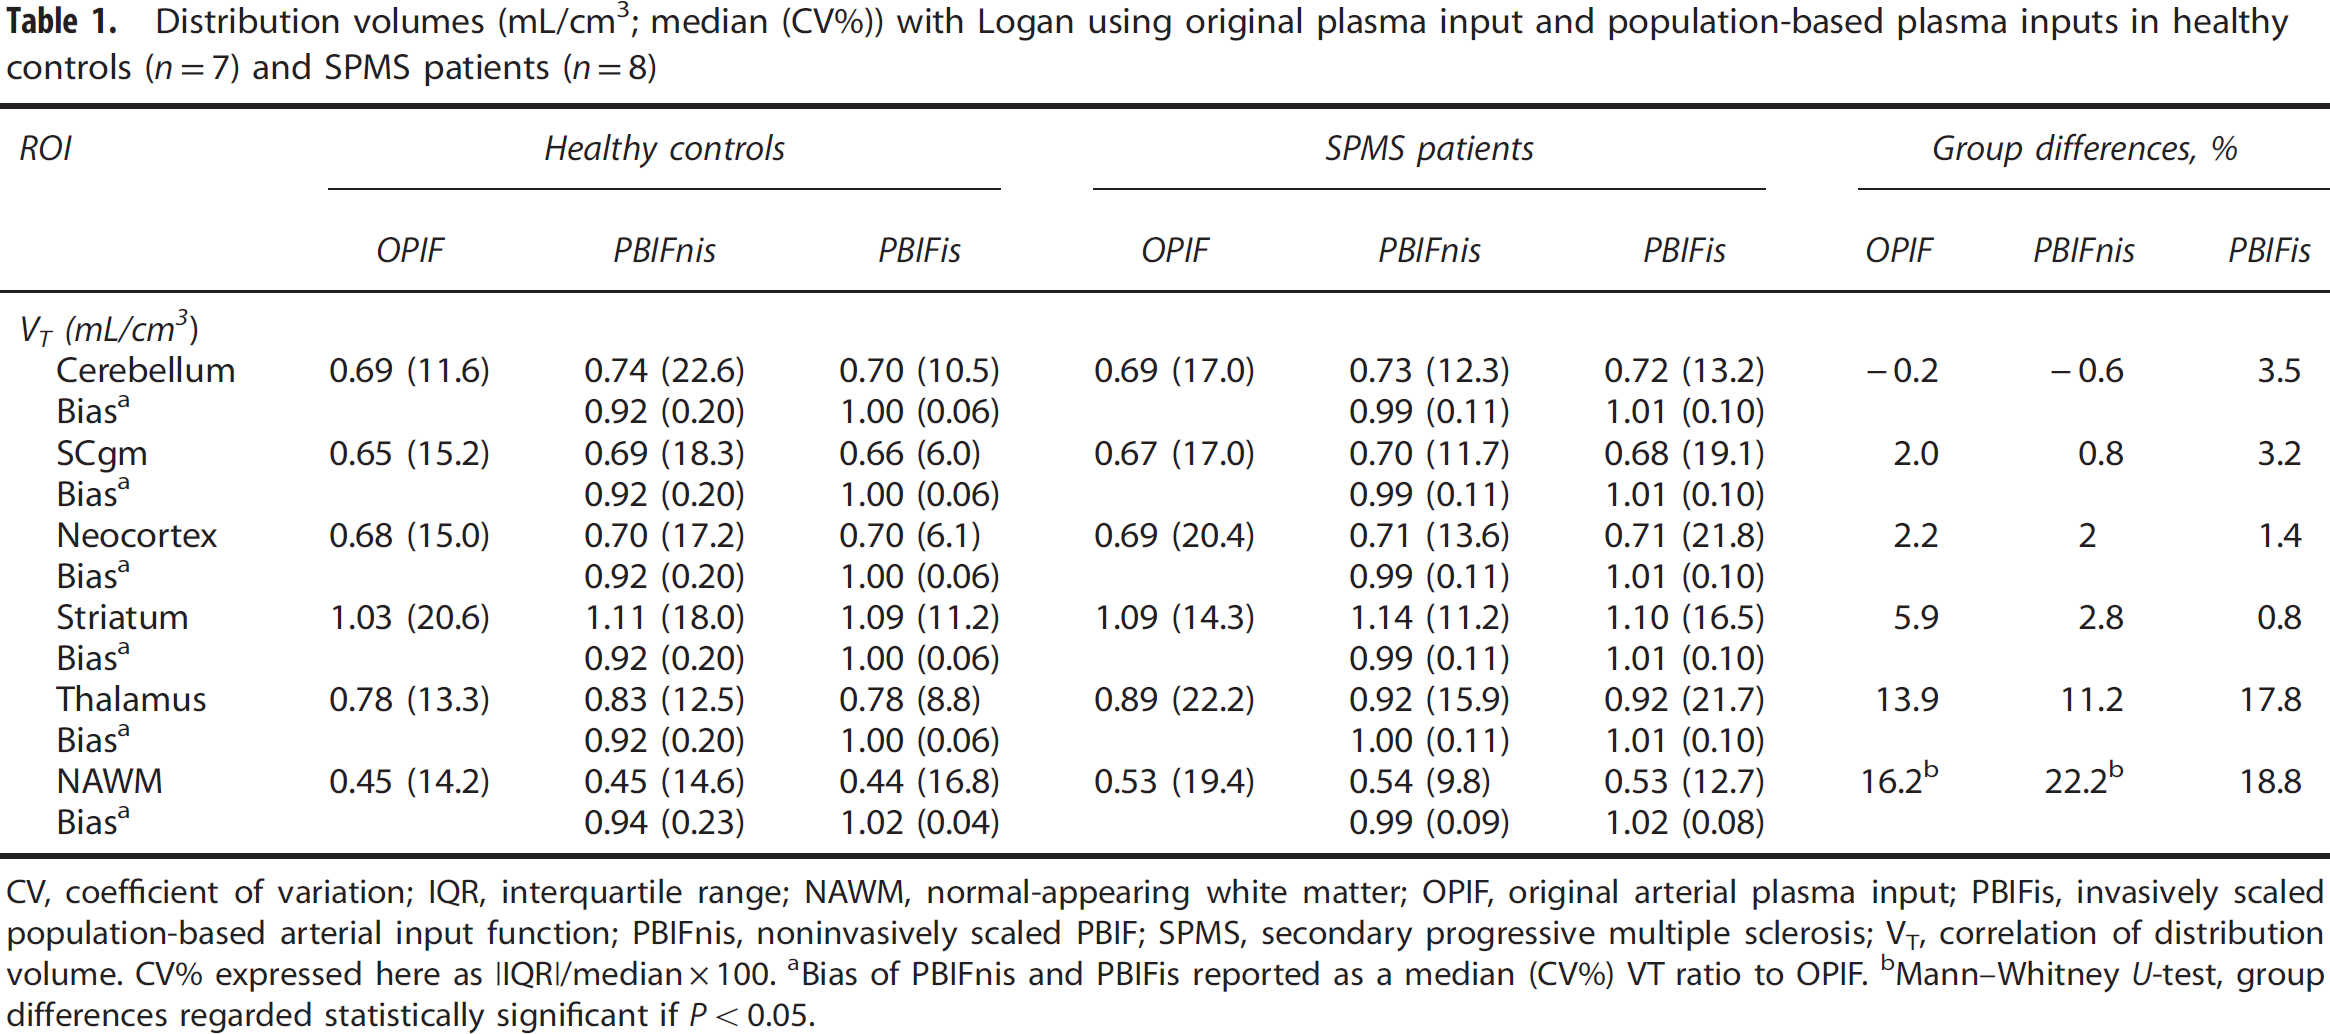
CV, coefficient of variation; IQR, interquartile range; NAWM, normal-appearing white matter; OPIF, original arterial plasma input; PBIFis, invasively scaled population-based arterial input function; PBIFnis, noninvasively scaled PBIF; SPMS, secondary progressive multiple sclerosis; VT, correlation of distribution volume. CV% expressed here as |IQR|/median × 100.
Bias of PBIFnis and PBIFis reported as a median (CV%) VT ratio to OPIF.
Mann—Whitney
Distribution volume ratios (median (CV%)) with Logan using different plasma inputs and reference Logan, and using the cerebellum and SCgm clustered gray matter (SCgm) reference regions (rr) in healthy controls (
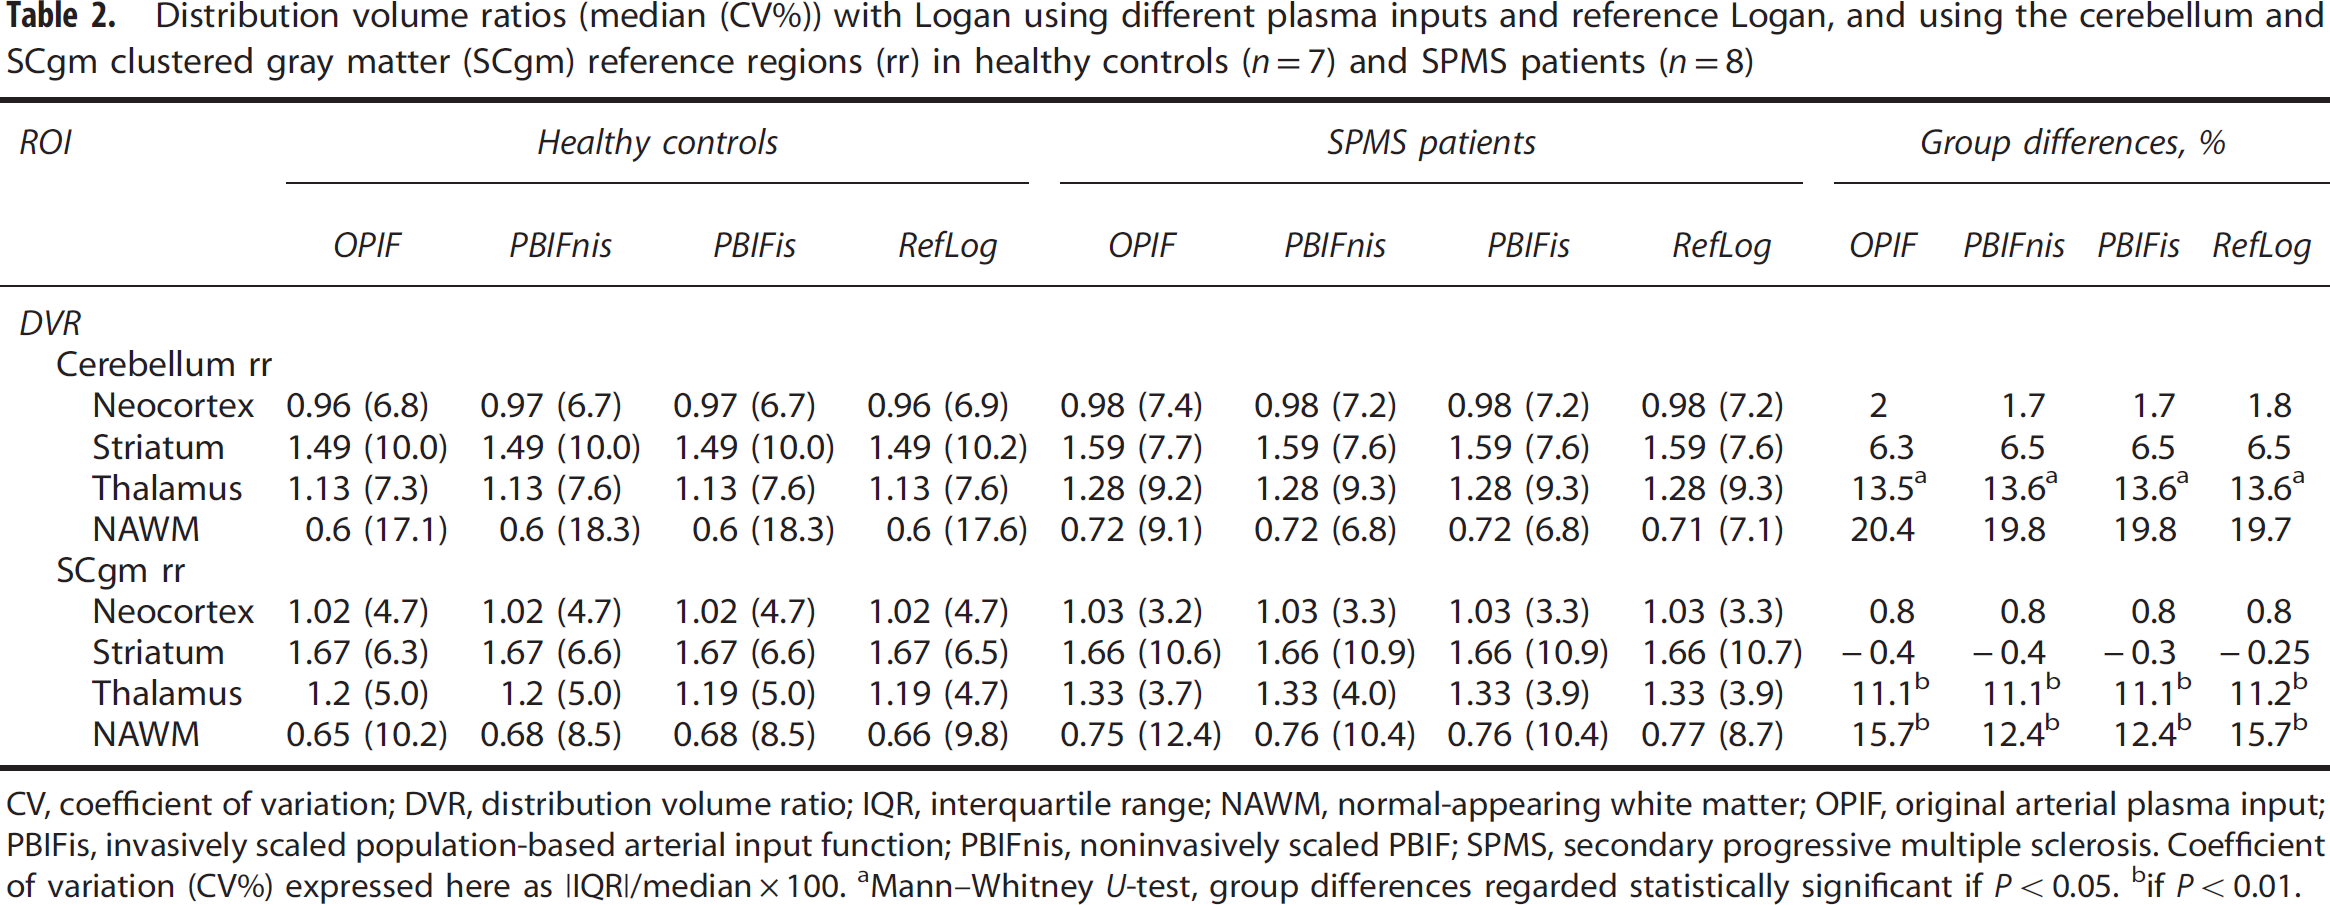
CV, coefficient of variation; DVR, distribution volume ratio; IQR, interquartile range; NAWM, normal-appearing white matter; OPIF, original arterial plasma input; PBIFis, invasively scaled population-based arterial input function; PBIFnis, noninvasively scaled PBIF; SPMS, secondary progressive multiple sclerosis. Coefficient of variation (CV%) expressed here as |IQR|/median × 100.
Mann—Whitney
if
When comparing the VT values in the cerebellum and SCgm reference regions within the groups and within the different inputs, the VTs were lower in SCgm, with statistically significant differences in the MS group (
Discussion
Our aim was to evaluate the usability of two input function acquisition methods, that are novel for [11C]TMSX PET brain imaging. The automated method for the extraction of SCgm using supervised clustering was developed to replace the ROI-based method. The population-based arterial input method was implemented to possibly obviate the individual arterial sampling.
The PBIF methods estimated VT with good concordance to original metabolite-corrected plasma-input function, although with invasive scaling of the population-based input with two blood samples, the correlation to original plasma input was stronger and the variation was smaller when compared with the noninvasive scaling using body surface area. Thus, PBIF with invasive scaling can be used instead of arterial plasma-input function, and is preferrable to noninvasive scaling because of its better accuracy in VT estimation. However, when comparing the DVR estimates, the differences between original plasma input and both population-based inputs were negligible. Hence, using noninvasively scaled population-based input also appears feasible, especially because of its noninvasiveness.
The DVR estimates with reference-input Logan and clustered SCgm correlated well with the indirect DVR results from arterial input function and cerebellum reference in healthy controls and MS patients. The DVRs with SCgm were slightly higher than with cerebellum because of the lower reference region VT in SCgm. However, the variance in DVR with SCgm was smaller in healthy controls when compared with the cerebellum. In conclusion, supervised clustering of the SCgm is a robust option for traditional ROI-based method, and with reference-input models provides a noninvasive method for DVR estimation. Moreover, by using these noninvasive DVR estimation methods, we were able to confirm our previous findings of the increased [11C]TMSX binding in the NAWM of SPMS patients compared with healthy controls based on the VT estimates with arterial input function. In addition, the previous borderline finding of the increased binding in thalami of SPMS patients became more pronounced reaching statistical significance
Some caveats, however, need to be taken into account. Generally, PBIFs may be less sensitive at individual level when compared with OPIF, and hence, may not reveal more subtle group differences as well as OPIF. Also, although the differences between group-specific average PBIFs were subtle, using a shared average PBIF for all subject groups would likely add bias in the VT estimates. 18 Therefore, we recommend the PBIFs of different patient groups and healthy controls to be derived independently. Even though PBIFnis is free from the methodological and logistical challenges related to OPIF, the scaling in PBIFis is still dependent on few blood samples. However, considerably fewer blood samples are needed for PBIFis than when using OPIF. Consequently, arterialized venous blood might be a feasible, less invasive option in this regard. Supervised clustering of the reference region is equally automated method as atlas ROI-based methods, but it is not dependent on reliable coregistration of the atlas template, which might be unsatisfactory with patients having atrophic brains. However, although no significant differences were observed in the clustered SCgm when an alternative HSB class was used, the results of SCA rely on the data from where the tissue kinetic classes are defined. The different image reconstruction protocols and PET scanner features effect on the shape of the kinetic classes, which might limit the usability of the method to data from different PET scanners. 15 Therefore standardising the imaging procedures would make the method more widely applicable.
The methodology used for the evaluation of specific [11C]TMSX PET binding thus far has been very varied. The first reported brain [11C]TMSX PET study on healthy humans using arterial metabolite-corrected input and two-tissue compartmental model showed the lowest VTs in centrum semiovale, whereas the highest values were observed in the putamen, followed by head of caudate, thalamus and cerebellum, and cerebral cortices.
3
Because of the low VT in the centrum semiovale, supported by the findings in a postmortem study showing negligibly low A2AR density in corresponding regions,
8
centrum semiovale was regarded as the optimal reference region for future studies.
3
Also in the following study,
4
the VT was reported to be higher in cerebellum than in cerebral cortices, and the same order of magnitude was observed in BPND estimation using the centrum semiovale as the reference region. The rate of specific binding (SB, calculated as BP/VT) of [11C]TMSX was reported to exceed 30% in the cerebellum (53.0%) and cerebral cortex (37.8 in frontal, percentage, 42.1% in temporal, 42.7% in occipital, and 40.6% in parietal lobe) in addition to the high SB in the striatum (caudate nucleus 58.4%, anterior putamen 62.7%, posterior putamen 61.8%). The existence of specific A2AR binding in the cortices and cerebellum has also been proven with another A2AR radioligand, [11C]SCH442416, in primate
26
and human
27
studies; the administration of selective A2AR agonists (istradefylline and vipadenant, respectively) reduced the binding of the A2AR radioligand also in the cerebellum and cerebral cortex in addition to striatum. However, in later human PET studies, both cerebellum and cerebral cortex have been used as reference regions for the estimation of specific binding of [11C]TMSX5, 6 and [11C]SCH442416.
12
It's indeed challenging to find a suitable reference region taken into account the requirements of the reference region: the nondisplaceable distribution volume should be constant across the regions and the region should be devoid of the target receptors. Since the specific binding estimates are dependable on the VT value in the reference region, the results are not fully comparable between different studies using various reference regions. Nevertheless, in our study the voxels representing HSB and vascular binding were additionally excluded from the clustered SCgm, and thus it should contain less specific A2AR binding. The method for defining the ROIs should also be taken into account when comparing the results from different studies. For instance, in the study by Mishina
For Logan's method, in addition to the standard metabolite-corrected arterial input,3, 7 alternative methods have been proposed for estimating the integrated plasma TAC to be used as input in brain [11C]TMSX PET studies: extracting the plasma-related information using independent component analysis, 3 and intersectional searching algorithm with averaging and clustering of PET data to reduce the noise in measured PET data (robust EPISA) 28 have been proposed. However, one of the disadvantages of these methods is the inability of intersectional searching algorithm to estimate the absolute integrated plasma TAC value. In addition, plasma-input methods are also affected by the fraction of radioactive metabolites. It has been reported, that using nonmetabolite corrected input underestimates the [11C]TMSX VT by ∼5% when compared with metabolite-corrected plasma input. 3 When using PBIFs, the correction for metabolites is included in the average population-based TAC, thus reducing the bias. In our data, the correlations between the original metabolite-corrected plasma-input function and the population-based inputs, both with invasive and noninvasive scaling, in VT and DVR were good and the group differences in these estimates were small. The variation in VT with the noninvasive scaling using body surface area was larger than with the invasive scaling using two arterial blood samples, consequently causing a decreased sensitivity to detect changes in VT. However, both methods yielded equivalent DVR estimates with robust correlations to indirect estimates of the original plasma input. Thus, both PBIFs appear as feasible methods.
For another A2AR PET ligand, [11C]SCH442416, presence of an additional vascular component with reversible binding has been proposed based on spectral analyses. 29 Similar phenomenon has not been reported for [11C]TMSX in the literature, even though A2AR are known to be expressed on the vascular endothelial wall, 30 and therefore it cannot be excluded that vascular binding would occur with [11C]TMSX. In our preliminary analyses with compartmental modeling, a blood volume fraction of 5% to 7% was observed (data not shown), being slightly higher than expected and possibly accounted by vascular binding with faster kinetics. Because the compartmental modeling is sensitive to input function shape, which might not be accurately reproduced by PBIF, we chose to use Logan's method for VT and DVR estimation. The Logan's method is independent of any particular model structure, and it uses the input function area under the curve, which can be more accurately reproduced using PBIFs compared with the actual shape of the original input function. 18
Interestingly, there was a tendency for lower VT both in the cerebellum and SCgm in PD and RRMS groups when compared with control and SPMS groups in our study. It has been reported, that the binding of [11C]TMSX in the striatal A2AR does not change with age in healthy subjects, even though A1AR binding decreases with age measured with [11C]MPDX. 6 However, the effects of age on the whole body biodistribution of [11C]TMSX are not available. In a whole body radiation dosimetry study in healthy controls with 120 minutes emission scanning, the highest [11C]TMSX uptake was seen in the liver for the whole period, followed by high uptakes in the heart and kidneys in the early phase and in the gallbladder an urinary bladder in later phase. 31 Since A2AR densities in the cardiac and skeletal muscles have been reported to be greater in endurance-trained men compared with healthy men, 32 it could be postulated that increasing age and physical disability caused by chronic diseases (such as MS and PD), could cause differences in the biodistribution when compared with healthy controls. However, VT estimates should be independent from the plasma clearance (and thus the biodistribution of the radioligand), because the tissue TAC is estimated in relation to the plasma activity. Moreover, the possible effects of age and disability would not solely explain the differences between the groups in our study, since PD patients being the oldest group had VT levels similar to RRMS patients with no significant disability.
It has been reported, that MS patients have significant A2AR upregulation in the peripheral blood lymphocytes compared with healthy controls, and that the upregulation of A2AR in MS was not affected by the disease subtype or the possible immunomodulatory medication used. 33 Even though it could be hypothesized, that this might affect the ratio of availability of [11C]TMSX into brain in MS patients compared with healthy controls, it would not explain the observed differences in the reference region VTs between RRMS and SPMS patients in our study. Moreover, the original arterial input representing the free nonmetabolized fraction of the ligand in plasma is not biased by the possible metabolic differences between groups. In this study, age or disease state did not significantly alter the metabolism of the ligand, even though the metabolism rate was slightly lower in the PD group compared with healthy controls. On the other hand, we did not have age- and sex-matched controls for the RRMS and PD patients in our study, and the number of the study subjects, especially in the RRMS group, was relatively small, which limits the interpretation of the results, and the evaluation of DVR estimates in these groups were not deemed justifiable. Consequently, the supervised clustering of brain [11C]TMSX cannot be readily applied for older controls and patients with other neurologic diseases without further studies, even though the method's performance was robust for SPMS patients and healthy controls. Moreover, if PBIF was to be used in studies with matched controls and patients with other central nervous system pathologies, it should be confirmed first, that the disease state itself does not affect the metabolism of the radioligand.
Using the supervised clustering method on acquiring the reference region has several advantages. In addition to saving time on manual ROI drawing, the automated extraction is also free from operator bias. Also, as a result from the supervised classification process, the voxels in the clustered reference region have negligible specific binding, and thus free of disease pathologic assessment regarding the ligand used. In addition, segmentation and masking of the MR images can be used to exclude areas with disease pathologic assessment in MRI. Moreover, the SCgm performed equally well in our study when the DVR estimates were compared with indirect estimates of plasma-input Logan, thus providing a plausible noninvasive method for the estimation of specific [11C]TMSX binding when used with reference-input Logan.
Regarding the location and function of A2AR, the striatal receptors linked to the modulation of dopaminergic transmission have been called the classical or typical A2AR, whereas others (in the cerebral cortex, cerebellum, and thalami) are regarded as the atypical A2AR.4, 34, 35, 36 According to animal studies, the A2AR have also been reported to be associated with the modulation of striatopallidal GABA receptors, 37 glutamate receptors in striatum 38 and in astrocytes within striatum and cortex, 39 and also with microglial activation. 40 It can be hypothesized, that the increased A2AR binding in the NAWM and thalami in SPMS might be linked to the activation of microglia and astrocytes associated with the disease, thus providing an alternative route for developing antiinflammatory therapeutic interventions.
Taken together, [11C]TMSX brain PET imaging provides a means to study pathologic processes in neuroinflammatory and neurodegenerative diseases
Footnotes
ACKNOWLEDGMENTS
The authors thank Dr Federico Turkheimer for providing the SuperPK software, which was used as a template for developing the [11C]TMSX SCA. The authors also thank the expertise and assistance of the radiochemistry, radiology, and laboratory personnel in the Turku PET Centre, and the tuition provided by Dr Jere Virta.
The authors declare no conflict of interest.
References
Supplementary Material
Please find the following supplemental material available below.
For Open Access articles published under a Creative Commons License, all supplemental material carries the same license as the article it is associated with.
For non-Open Access articles published, all supplemental material carries a non-exclusive license, and permission requests for re-use of supplemental material or any part of supplemental material shall be sent directly to the copyright owner as specified in the copyright notice associated with the article.