
Abstract
The goal is to quantify the fraction of tissues that exhibit specific tracer binding in dynamic brain positron emission tomography (PET). It is achieved using a new method of dynamic image processing: clustering-initiated factor analysis (CIFA). Standard processing of such data relies on region of interest analysis and approximate models of the tracer kinetics and of tissue properties, which can degrade accuracy and reproducibility of the analysis. Clustering-initiated factor analysis allows accurate determination of the time–activity curves and spatial distributions for tissues that exhibit significant radiotracer concentration at any stage of the emission scan, including the arterial input function. We used this approach in the analysis of PET images obtained using 11C-Pittsburgh Compound B in which specific binding reflects the presence of β-amyloid. The fraction of the specific binding tissues determined using our approach correlated with that computed using the Logan graphical analysis. We believe that CIFA can be an accurate and convenient tool for measuring specific binding tissue concentration and for analyzing tracer kinetics from dynamic images for a variety of PET tracers. As an illustration, we show that four-factor CIFA allows extraction of two blood curves and the corresponding distributions of arterial and venous blood from PET images even with a coarse temporal resolution.
INTRODUCTION
The principal data processing tasks in dynamic brain positron emission tomography (PET) are determining the amount of radiotracer in the blood or arterial input function (IF) and tissue classification. Image-derived IF is important because arterial cannulation, the standard method for determining the IF, is an invasive and potentially risky procedure 1 that should be avoided for patient health and clinical efficiency considerations. Tissue classification groups voxels into tissue types based on the fact that the shape of the time–activity curve (TAC) for the same input function is determined by the interaction of the tissue and the radiotracer. In this manuscript, we describe an application of an extension of factor analysis of dynamic structures (FADS) technique to solve these two data processing tasks.
Despite a physical impossibility to differentiate between plasma concentration and metabolites or bound tracer, a variety of data-based techniques of determining the IF have been suggested in the last decades.2–4 In these and other reports, the IF is determined from the reconstructed images with some amount of bias caused by partial volume and/or inaccurate determination of the region of interest (ROI) of the image where the blood activity is digitally sampled, usually in the carotid artery. A recent review 2 concludes that for most PET tracers and dynamic protocols, the IF cannot be determined accurately only from the dynamic images. Some of the limitations of image-derived IF techniques are not present in FADS, a powerful method used in both SPECT and PET for over a decade,5–8 although still underused. The FADS circumvents the purely methodological constraint of voxel-sampling-based analysis by decoupling the temporal and the spatial components of the tracer concentration distribution. It has been demonstrated to measure the IF in cardiac imaging by estimating the concentration in both right and left ventricular blood pools. 9 In brain imaging, the IF is more challenging because of the lack of large blood pools as seen in the heart chambers. Nevertheless, in this manuscript, we demonstrate the ability of FADS to recover the IF from dynamic brain PET data.
The quantitative task addressed in the paper is related to dynamic tissue separation. Most reported methods of quantifying tissues from dynamic images are based on kinetic modeling, e.g., the graphical analysis method 10 or alternative approaches. 11 The FADS can serve as the tissue classification tool that does not imply the knowledge of the IF or a specific kinetic model. A state-of-the-art application of FADS methodology to brain imaging 8 achieves successful separation of tissue types and TACs for two different radiotracers injected simultaneously. For a single tracer, a typical classification task is differentiating tissues that exhibit nonspecific binding and specific binding. Specific binding reflects binding of a PET ligand to a receptor, which is saturable and which can be blocked by another ligand with known activity at the receptor, whereas nonspecific binding is neither saturable nor blockable. A variety of methodologies have been used for this task.10,12 These analyses generally rely on a reference tissue model, 13 which assumes the knowledge of the tracer dynamics in a region of the brain that contains only the nonspecific binding tissue. When such a region is known, the dynamic data from the ROIs and from the reference region are analyzed using any of the standard techniques10–12 to provide the quantitative estimate of the amount of specific binding tissue in the target ROIs. Although well-studied, the reference tissue model can yield results that are inaccurate or biased as the result of manual reference region selection; spatial inhomogeneity of the tissue concentrations; patient-to-patient or study-to-study variability of the tissue properties; and the time when the tracer concentrations in the target and reference regions reach a steady state. We seek to avoid some of these problems by using FADS, which does not rely on the named assumptions and on significant operator intervention.
One of the common tracers in dynamic brain imaging is 11 C-labeled Pittsburgh Compound B ( 11 C-PIB). It binds to β-amyloid, a protein commonly linked to Alzheimer's disease.14–15 The physiological mechanisms and the diagnostic value of this link are outside the scope of the presented work; we are interested in the very fact that there is persistent need for quantitative evaluation of β-amyloid. All the images and analysis presented in this paper are based on the 11 C-PIB imaging data acquired in an Alzheimer research study, 16 however, the presented methodology is tracer-independent and can be used for other tracers, imaging protocols, and diagnostic objectives.
One of the challenges of FADS in dynamic emission tomography is the initial choice of the factors. 17 This paper presents our modification of the factor analysis-based approach, CIFA, with the novel way of initializing the factors. We select the starting values of the factors using a representative clustering algorithm developed by us. It operates on the dynamic voxels similar to the independent-component analysis 18 and principal component analysis 19 techniques. Our approach establishes a number of small clusters in the space of dynamic image voxels, so that the elements of one cluster are as distinctive from the elements of other clusters as possible, thus corresponding to different dynamics. Clustering helps to estimate the number of factors for the FADS calculation, and average intensities for different clusters are used to initialize the factors.
The paper is organized as follows. First, we explain the theory of CIFA components and the complete algorithm and describe the dynamic 11 C-PIB PET experiments to which we apply our algorithm. Then, the algorithm is applied to 13 human subject data sets and our estimates of β-amyloid in the brain are compared with the results obtained from the Logan graphical analysis. The results are followed by the discussion of the new method and by conclusions of our work.
MATERIALS AND METHODS
CIFA: Clustering-Initiated Factor Analysis
Clustering-initiated factor analysis is an extension of the FADS algorithm obtained by adding a specially designed clustering method for initial processing of dynamic data.
In
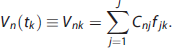

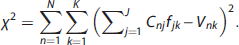
The key challenges in FADS include non-uniqueness and the underdetermined nature of the optimization problem, ambiguity in the choice of the optimal number of factors


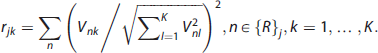
The distinction between a time series 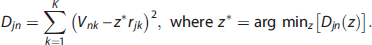
R-clustering is a recursive process of selecting time series with maximal functional distance from previously computed clusters. In terms of
The process of clustering is best explained using a visual analogy. Let each
The clustering is performed until either the pre-defined number of clusters has been reached or until adding a new cluster (
After the self-consistent calculation for
CIFA: Algorithm
The CIFA procedure is performed in six steps:
Input data: Decay-corrected and normalized to the same time frame duration dynamic images, represented as


Output data: Factor arrays
Step 3 is the most resource-consuming part of the calculation, its computation time is directly proportional to the number of voxels N. To reduce the overall computation time and to ensure that only the brain voxels are used to determine the tissue factors, at first steps 2 through 5 of CIFA are applied to a smaller subset of the brain voxels. Once the factors are computed for the brain tissues, one to two repetitions of steps 2 through 5 for the larger set of voxels are sufficient to refine the blood factors and to compute the factor images. The initial subset is defined by selecting only brighter voxels (with higher threshold values) that are localized within the brain.
Tissue Analysis
Upon completion of the CIFA algorithm, its results need to be analyzed to produce a quantitative variable that is proportional to the amount of β-amyloid in the brain. First, the
A blood curve (can be more than one).
A nonspecific binding tissue curve, characterized by both visible tracer uptake and tracer wash-out. Let the index of the factor corresponding to this curve be denoted by
A specific binding tissue curve, characterized by the slower uptake and much slower wash-out. The factor index for this curve is denoted by
In the above expressions, numerators denote the integrals of the selected tissue type coefficients over the reconstruction volume. The denominators denote the integral of all tissue coefficients, they serve as normalization factors that allow interstudy comparison. 
Experiment
Clustering-initiated factor analysis was tested on dynamic PET images for
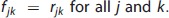
After the scan, the list-mode data were binned into 35 time frames: 4 × 15 seconds, 8 × 30 seconds, 9 × 1 minutes, 2 × 3 minutes, 10 × 5 minutes, 2 × 10 minutes and reconstructed using an ordered subset expectation maximization algorithm with attenuation correction (four iterations, 16 subsets), Gaussian smoothing of 4 mm, zoom of 2, and scatter corrected using the Siemens scanner software. The reconstructed images were normalized to correct for the radioactive decay and for the different time frame durations. The voxel size of the reconstructed images was 1.0182 mm in-plane and 2.027 mm axially. In Figure 1, we show sagittal maximum-intensity projection images for four of the time frames for one of the subjects, a recent Alzheimer's disease diagnosis.
Sagittal maximum-intensity projection (MIP) for four time frames, left-to-right: 15-second frame starting 30 seconds after injection, 30 seconds/3 minutes after injection, 1 minute/10 minutes after injection, and 5 minutes/30 minutes after injection.
The dynamic images were analyzed using the Logan graphical analysis, cerebellar gray matter was used as the reference tissue ROI, and the distribution volume ratio (DVR) was computed for each patient data set using the Logan graphical analysis20,21 with frames corresponding to 35 to 90 minutes post injection. This value is expected to be proportional to the amount of β-amyloid in the brain.
RESULTS
Thirteen dynamic PET data sets were processed using the CIFA algorithm. The algorithm was implemented in Matlab 2012b using the linear least squares fitting function lsqlin to implement step 3 and the Optimization Toolbox function fmincon to implement step 4. Each input data set contained 35 reconstructed volumes of 336 × 336 × 109 voxels. First, the algorithm was applied to the ~ 120 × 120 × 30-voxel region that contained approximately 75% of the brain. On reconstructing the factors, an ~ 200 × 200 × 100 volume that contained the complete patient head was analyzed. (The exact region sizes varied on the basis of the size of the subject's head.) The following adjustable parameters were used:
Pre-filtering thresholds: ε
Number of clusters/factors:
Cluster size in R-clustering:
Cost-function
Of these free parameters, the exact value of importance was only J. Varying
For all the 13 patients, CIFA produced meaningful TAC-like factors and the coefficient distributions. Figure 2 shows R-clustering-generated curves and the same curves refined by FADS for the same subject as shown in Figure 1. The algorithm recovered two similar but separate curves for the tracer concentration in the blood with a time lag of 15 seconds or less. As the blood circulation time in the head is approximately 10 to 12 seconds, these peaks are likely to capture the tracer concentration ‘upstream’ and ‘downstream’ in the head vasculature, possibly showing the arterial and venous blood vessels. Indeed, the color-matched surface renderings of the corresponding coefficient arrays in Figure 3 show that the first (red) factor is concentrated in carotid arteries, while the second (blue) factor image appears to show a mass of smaller vessels in the brain, venous sinuses, and facial/nasal vasculature. The artery-vein separation is approximate and varies slightly from study to study, likely influenced by the patient's anatomy, physical state, and by the relative timing of the injection and PET data acquisition. In Figure 2A, we can observe that the R-clustering curves that have become the blood factors are non-zero after the first minute or two, which can be attributed to the contribution of the tissue caused by the partial volume effect. It should be noted, that as with other image-based IF detection techniques, CIFA recovers the total amount of radioactivity in the blood, not only the plasma tracer concentration.
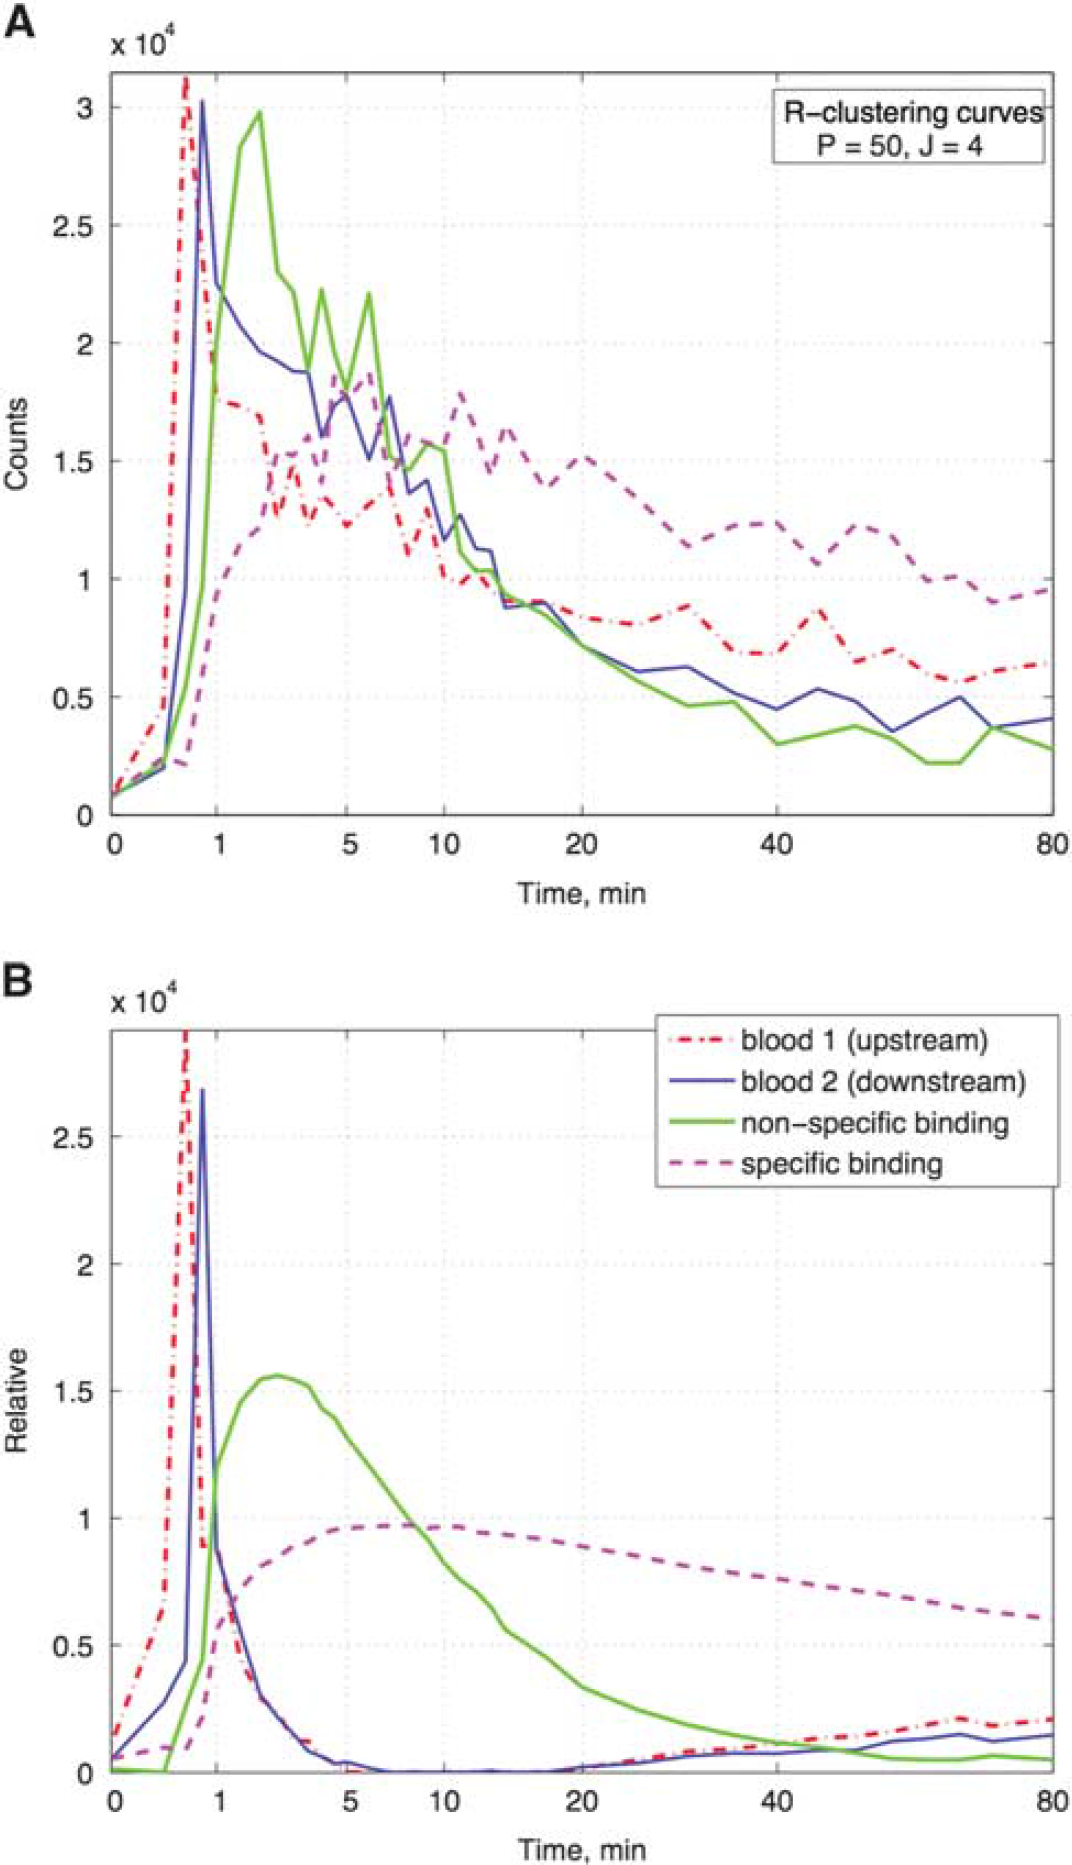
(
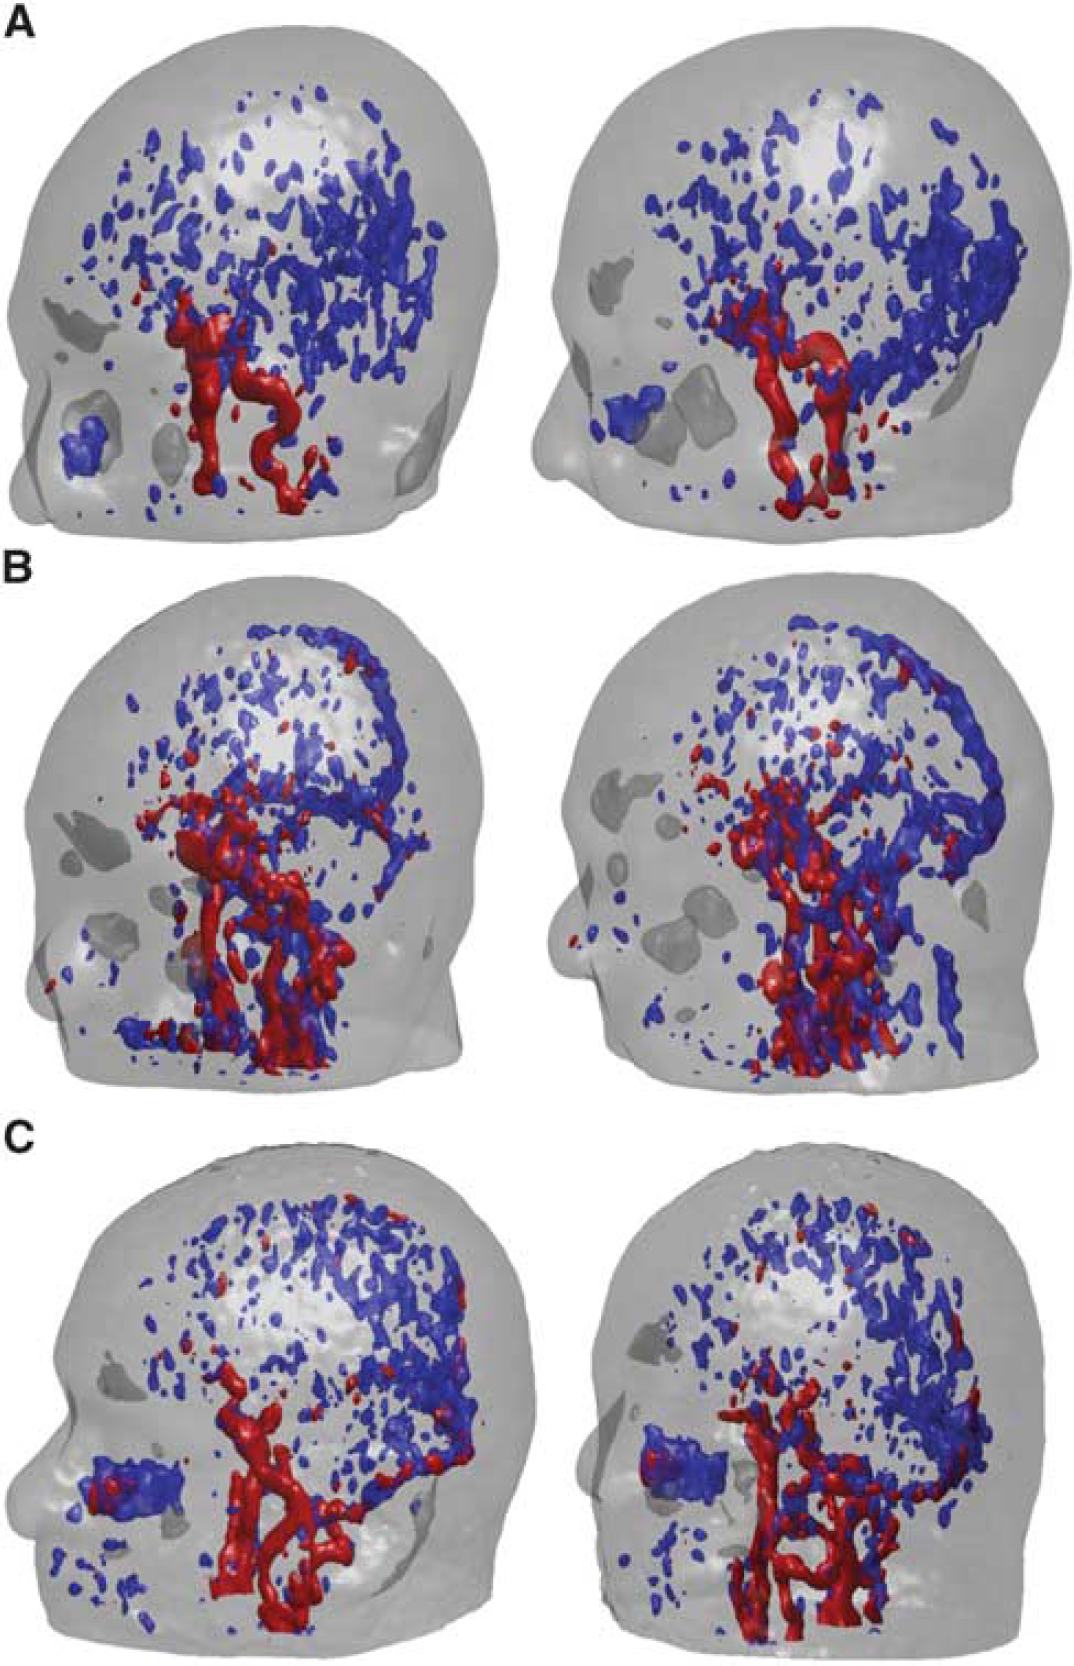
Surface rendering of blood coefficient distributions for three of the patients, two views each: front-right and front-back. Rendering thresholds are selected for optimal viewing at ~25% of the maximum. The outline of the head is obtained by thresholding the temporal mean of the dynamic PET images at 2% of the maximum. (
The distributions of the specific and nonspecific binding tissues are shown in Figure 4 along with the DVR images obtained using standard graphical analysis method. In the cerebral cortex, both tissues are present, whereas in the cerebellum region the concentration of the nonspecific binding tissue is the highest and the specific binding tissue is expectedly absent there. The distribution of the specific binding tissue within the brain closely matches the DVR images.
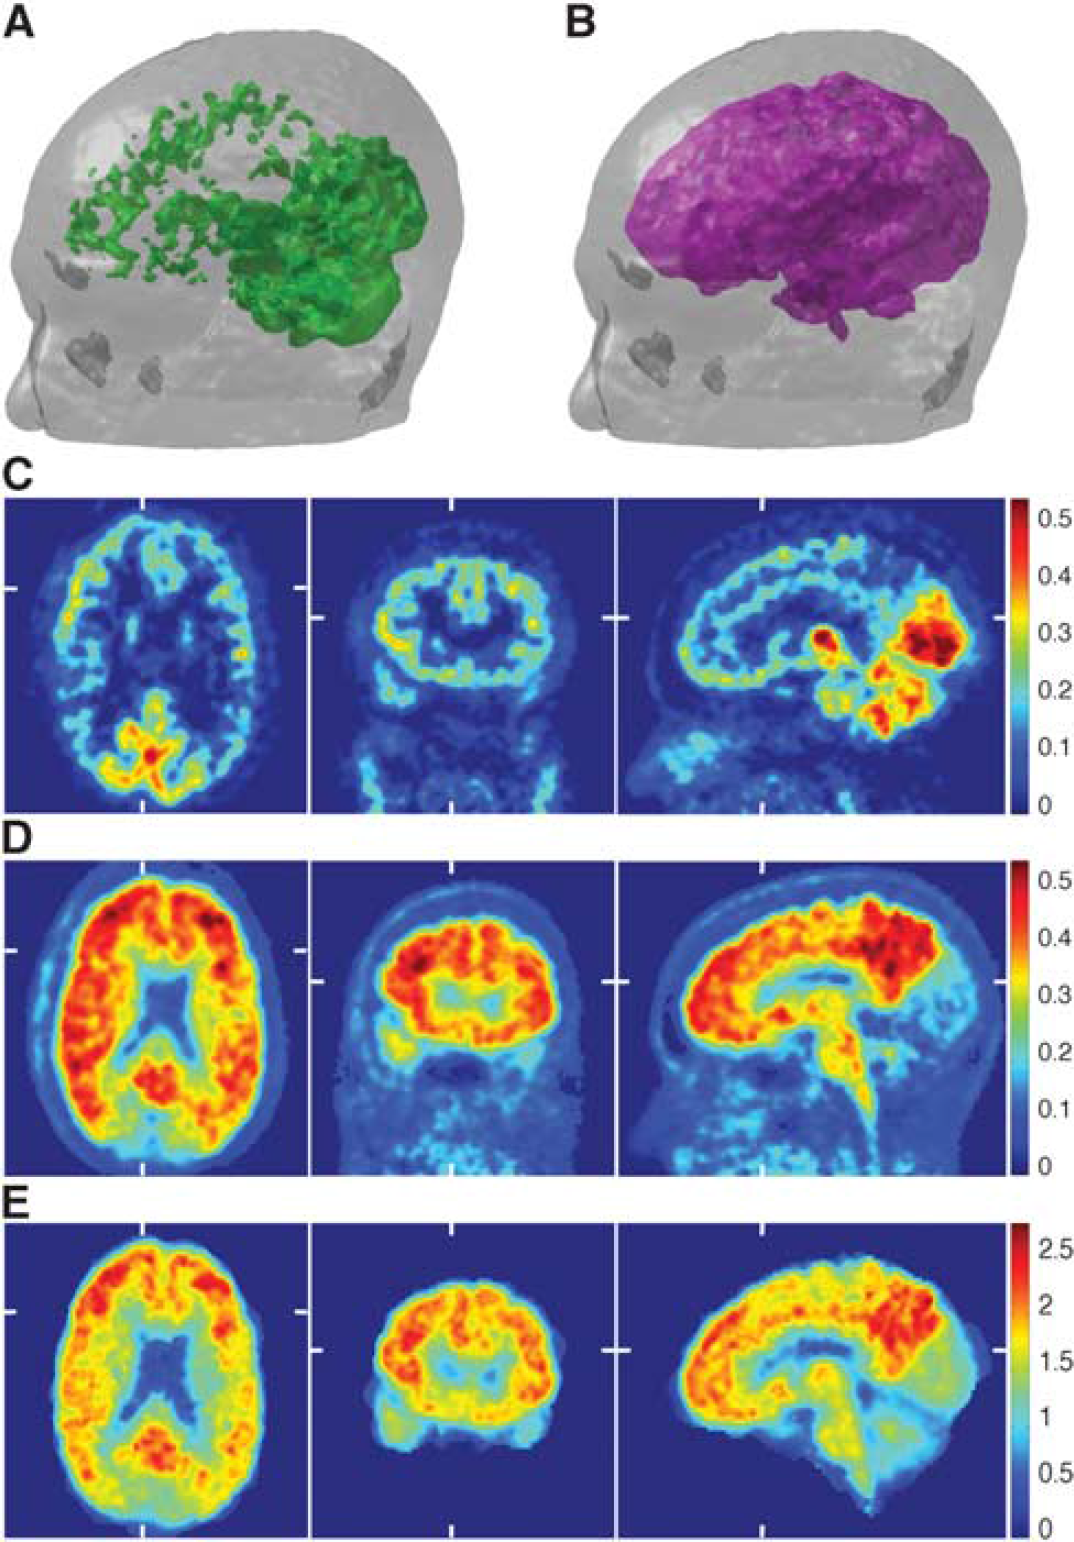
Tissue coefficient distributions for the same patient as in Figures 1, 2, and 3A. (
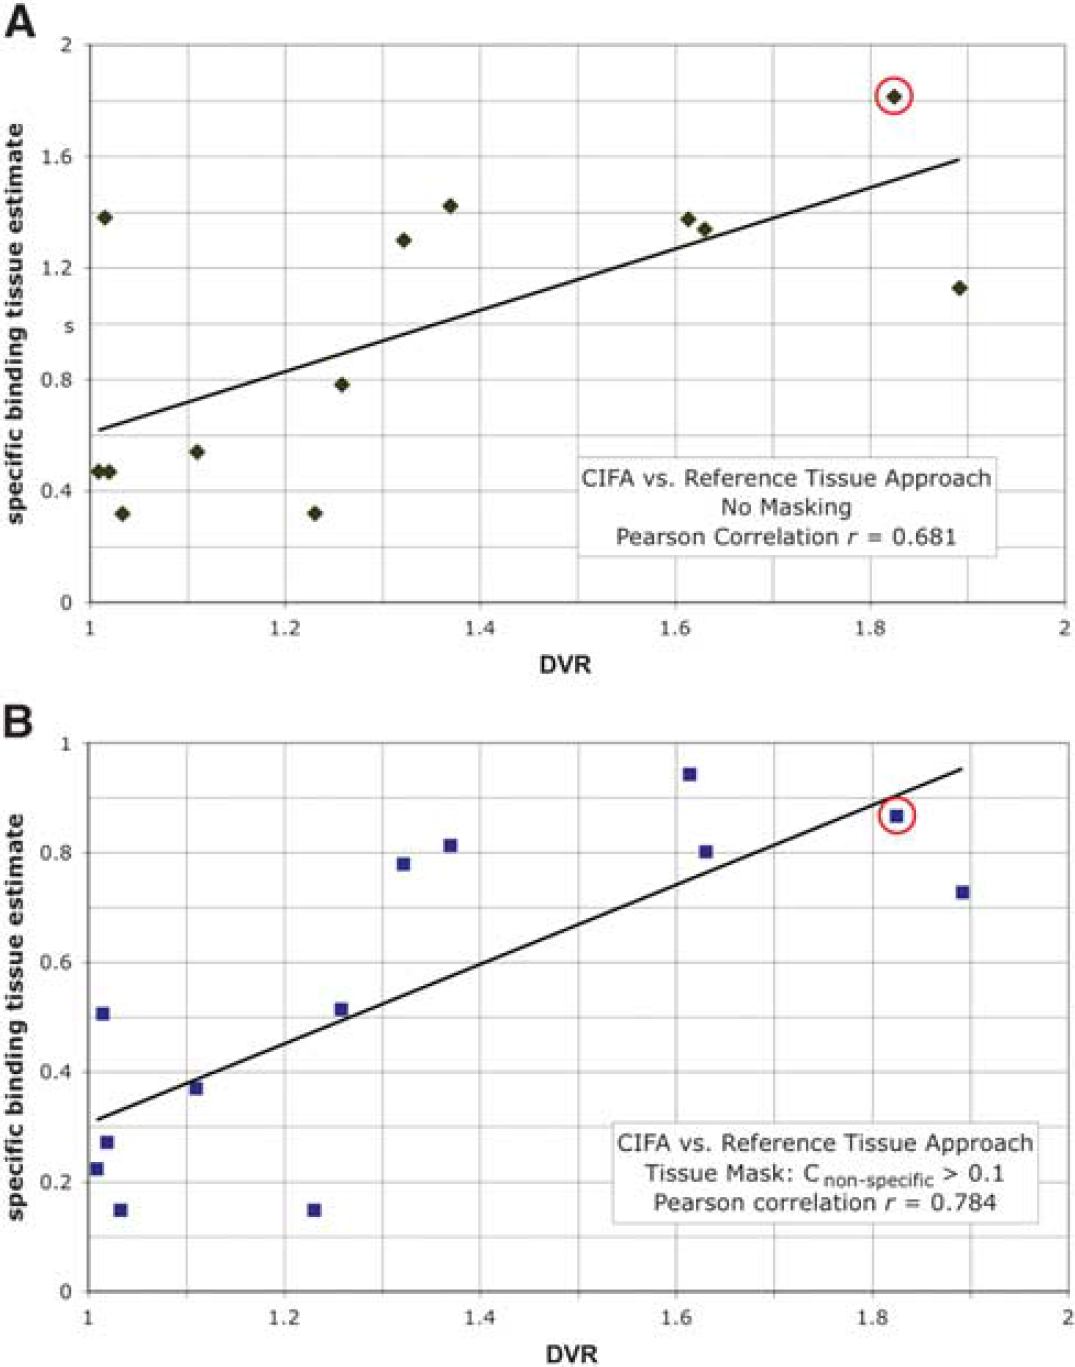
For each of the 13 data sets, we computed the integral tissue estimates
(
As both the
DISCUSSION
To the best of our knowledge, this paper presents one of the first systematic applications of FADS-based image analysis to 11 C-PIB β-amyloid dynamic brain PET. The new CIFA technique provides a tool for evaluating the amount of specific binding tissue in the brain with minimal participation of a human operator. Currently, the operator interference is needed only for (a) selecting the volume fraction for the initial calculation, (b) identifying blood and tissue factors from the segmentation results, and (c) semi-manual smoothing of the blood factors after the first pass of the algorithm implementation. All these tasks can be implemented in computer code, thus providing a completely automated tool for the analysis of specific binding tissue in dynamic PET using 11 C-PIB or other tracers.
The main novelty of CIFA is adding the R-clustering algorithm to FADS, which reduces the computation time and increases the overall effectiveness of the method by providing a fast and accurate initial guess of the tissue TACs. Performing FADS with randomly or uniformly initiated factors on several test data sets required 8 to 10 iterations and sometimes converged to unrealistic local minima, whereas two to four iterations were sufficient for basic convergence after R-clustering. This is significant since clustering requires approximately 10 to 20 times less computational time than a single FADS iteration. Also, FADS initialized with R-clustering was noticeably less likely to converge to local minima. Finally, R-clustering was instrumental in making the decision to use
Neither the clustering nor the factor analysis in CIFA were subjected to any spatial or temporal regularization, only basic non-negativity (11 to 12) and scaling (13) constraints were used. This simplified and accelerated the computation, and provided a strong evidence of the validity of our approach. Nevertheless, we feel that CIFA can be further improved by incorporating regularization in the temporal domain. A smoothness constraint may be applied to the factors almost everywhere excluding the sharp blood peaks during the injection. Although in some reported applications of FADS,6,7,17 smoothness, tissue overlap, or other spatial regularization constraints were included in the optimization, we think that in amyloid imaging such constraints may not be productive. Unlike in cardiac imaging, large volumes of blood are not present. Moreover, as most blood vessels are smaller than the voxel size, very few voxels contain only the blood factors. The nonspecific tissue may occupy large volumes, but is not completely homogeneous. Finally, the specific-uptake tissue is expected to be highly nonhomogeneous by nature. For example, the β-amyloid is a distribution of plaques with size ranging from a tenth of a micron to tens of microns.
Even though knowledge of the TACs and of the input function can be used in kinetic modeling, at this stage, our claims are limited to tissue classification and to quantitation of the specific binding tissue. We believe that the fraction of this tissue computed using the coefficient concentration arrays is potentially a better measure of the amount of tracer uptake in the tissue than currently used variables of DVR or standardized uptake volume ratio. Unfortunately, at this stage, we can only compare our estimate of the amount of β-amyloid to these variables. Therefore, we cannot estimate how much of the discrepancy between the two approaches can be attributed to the imperfections of the CIFA implementation and how much can be attributed to the weaknesses of the reference tissue model and implementation of the graphical analysis methods. The primary focus of our future work on CIFA is validation of its accuracy in evaluating the amount of irreversible uptake tissues by comparison with independent metrics. More work should be done for incorporating physiologically meaningful constraints in the optimization portion of CIFA. Upon initial validation, the use of
Amyloid imaging has been widely applied in the study of aging and dementia. Currently three PET radioligands are approved by the US Food and Drug Administration. Although the clinical application of these tracers is still somewhat controversial in the absence of an effective treatment, the tracers are also used widely in clinical trials for the development of new anti-β-amyloid drugs. 24 These studies require precise measurements including the detection of longitudinal change related to disease progression and treatment. Such measurement techniques are also crucial for the development of new diagnostic and research tracers in other brain PET areas, a popular research direction in modern diagnostic imaging.25,26 Technical problems related to changes in the reference region can introduce noise and bias in the results of longitudinal studies. While the dynamic nature of the scan acquisition required for our approach certainly introduces complexity into PET studies, this may be offset by greater precision that could benefit disease detection and drug development.
The main potential advantages of CIFA in comparison with the graphical analysis methods are related to its
CONCLUSIONS
We have developed the CIFA procedure, which combines basic factor analysis with a factor initialization technique based on a novel R-clustering method. Clustering-initiated factor analysis was successfully implemented and applied to a series of dynamic 11 C-PIB PET data sets. The ability of the method to extract the input function and to detect some aspects of the time lag between the arterial and the venous blood was demonstrated. The time–activity curves for the tissues with specific binding and nonspecific binding uptake were obtained. The factor images (coefficient distributions) for two blood factors exhibited strong visual correspondence to the anatomic features of the brain vasculature, providing indirect validation of the method. The factor images for the tissue factors were used to estimate the fractions of specific and nonspecific tissue types in the brain. The ratio of these two fractions was expected to be proportional to the amount of the specific binding tissue. On the basis of 13 patient scans, the CIFA-derived estimate was compared with the DVR evaluated using the Logan graphical analysis and the reference tissue model. The two variables exhibited significant proportionality. The proposed technique may prove to be a better way of quantitative estimation of the amount of specific binding tissue in dynamic PET than currently used techniques; however, it needs to be further improved and validated by direct comparisons with PET-independent methods.
AUTHOR CONTRIBUTIONS
The original development of CIFA, its software implementation, and its application to patient data processing, as well as the principal manuscript preparation were performed by RB. DM and GTG contributed to the algorithm development (R-clustering and FADS parts, respectively) and to manuscript preparation and revision. SLB and WJJ performed all the activities related to acquiring, reconstructing, and conventional processing of the patient dynamic PET data and prepared the portions of the manuscript related to the imaging experiments and to neuroscientific motivation of our work.
DISCLOSURE/CONFLICT OF INTEREST
WJJ has served as a consultant for Genentech and Synarch. The remaining authors declare no conflict of interest.