
Abstract
The hemodynamic and metabolic response of the cortex depends spatially and temporally on the activity of multiple cell types. Optogenetics enables specific cell types to be modulated with high temporal precision and is therefore an emerging method for studying neurovascular and neurometabolic coupling. Going beyond temporal investigations, we developed a microprojection system to apply spatial photostimulus patterns
Keywords
Introduction
The spatial relationship between neural activity, metabolism, and hemodynamics is central to the function of the neurovascular system within the cortex. This system could be studied in greater detail by spatially and genetically targeting specific sets of neurons within the cortex. An integration of optical and optogenetic technology enables a spatial investigation of neurovascular and neurometabolic coupling.
The emerging field of optogenetics offers a variety of tools for modulating specific sets of neurons. Optogenetics involves the insertion of light-sensitive opsins into the cell membrane to infer optical excitation or inhibition in neural cells.1, 2 The most commonly used techniques involve the use of optically driven cationic channels (e.g., channelrhodopsin-2 (ChR2)) to excite activity and ionic pumps (e.g., halorhodopsin and archaerhodopsin) to inhibit neural activity. As a genetic technique, promotors can be used to express opsins in specific cell types. The specificity can be further increased by carefully controlling the photostimulus.
Optogenetics enables precise spatial activation of nervous tissue with spatial patterning. Although the functional organization of the brain and cortex can also enable spatial investigations (e.g., the spatial localization of individual whiskers in rat barrel cortex), optogenetics provides a much more direct route to recruit activity of different neural volumes through spatial light patterning. Modern optical hardware has enabled the patterning of light at high resolution through the development of microprojection systems and spatial light modulators, such as digital micromirror devices (DMDs) and liquid-crystal displays. 3 The use of DMD technology has already been adopted to achieve spatial patterning in a variety of optogenetic applications, such as isolation of single neurons and spatial activation of structures in brain slices.4, 5, 6, 7, 8 Such a spatial approach in the cortex would build upon previous temporal approaches for studying the hemodynamic response with optogenetics. Laser speckle contrast imaging,9, 10, 11 intrinsic optical signal imaging,9, 12, 13 and functional magnetic resonance imaging (fMRI)14, 15, 16 have been combined with temporal optogenetic modulation to investigate cerebral hemodynamics.
In addition to understanding the hemodynamic response to direct neural activation, it is equally important to understand the corresponding metabolic coupling. Active neurons consume a large amount of their adenosine triphosphate budget maintaining transmembrane gradients.
17
Nevertheless, the metabolic impact of optogenetically inducing large transmembrane currents and the corresponding homeostatic feedback mechanisms have not been reported. It is known that adenosine triphosphate levels are restored through glycolysis and oxidative phosphorylation. Therefore, positron emission tomography (PET) with 2-deoxy-2-fluoro-
In this article we describe a novel integrated approach to studying neurovascular and neurometabolic coupling by imaging cerebral blood vessels and fluorescence
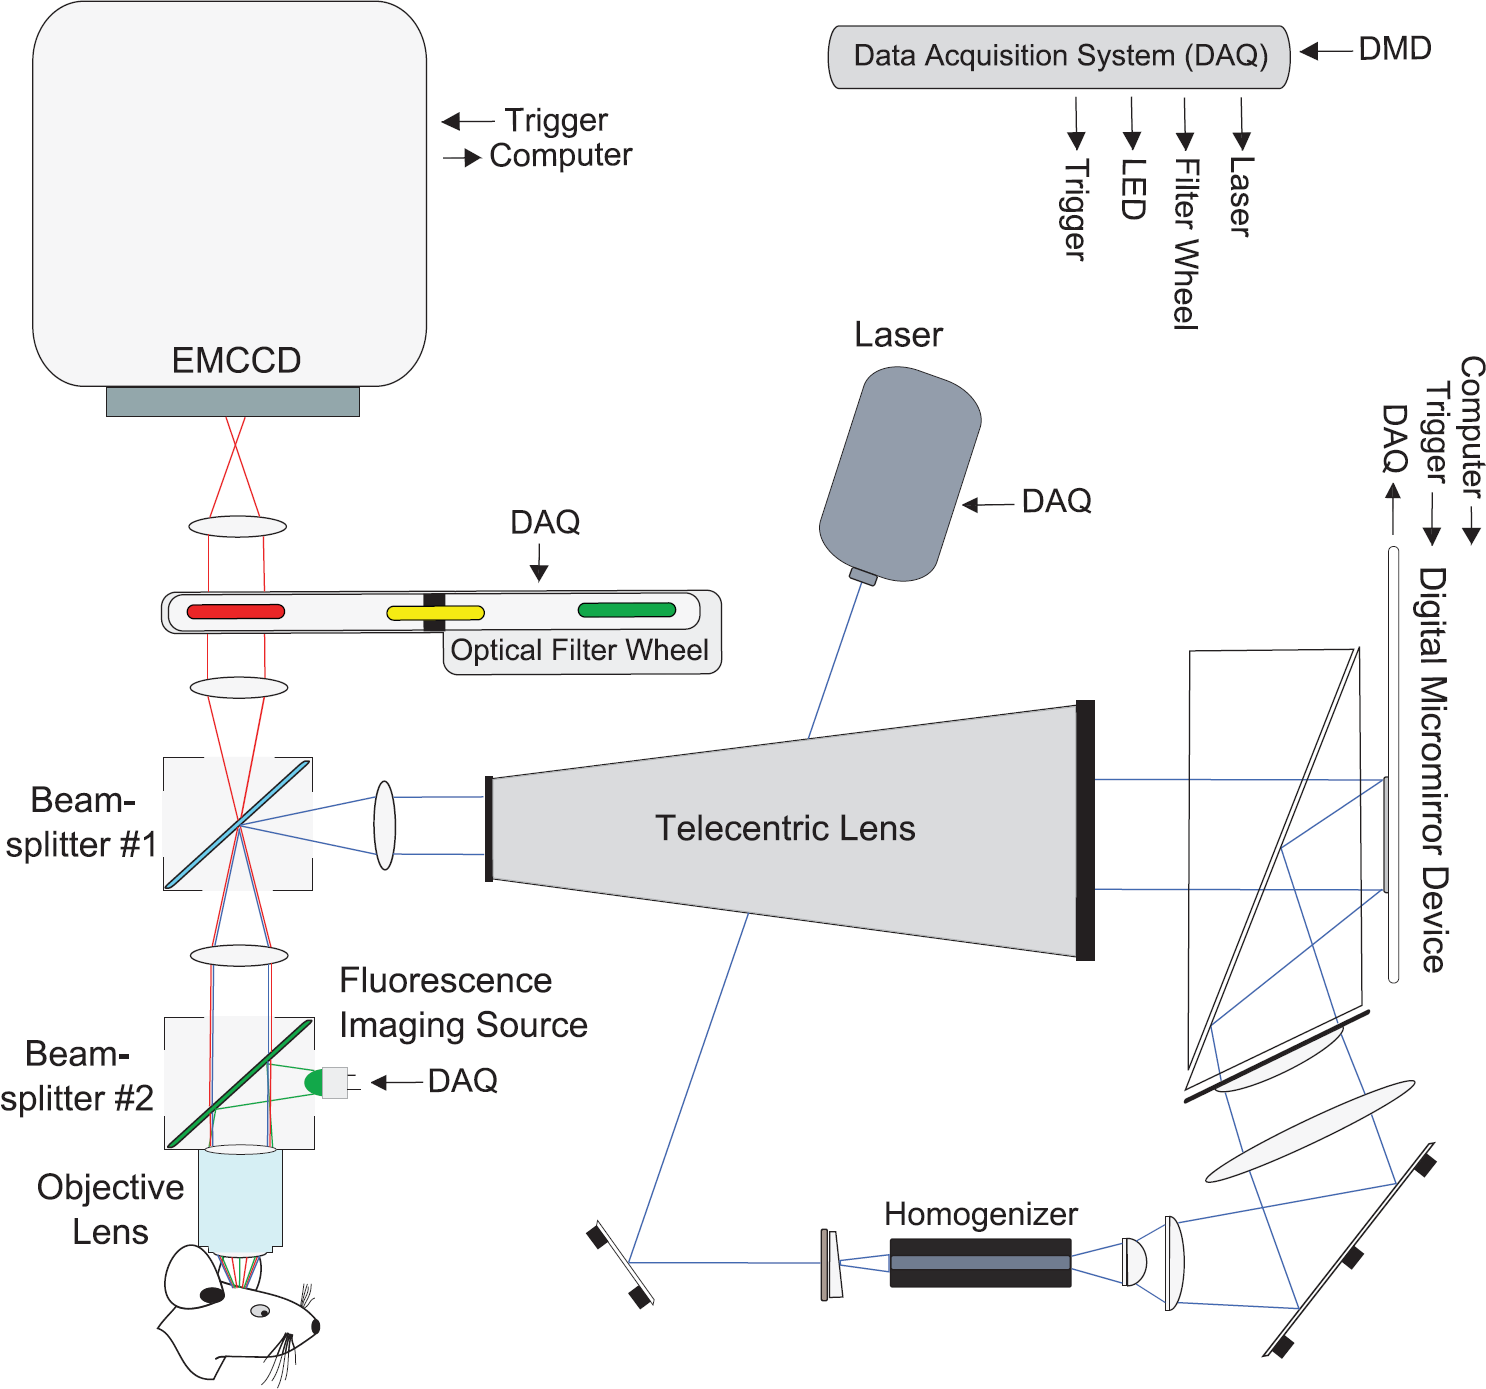
Schematic of the microprojection and fluorescence imaging system. A high-powered laser is reflected off a digital micromirror device (DMD) and combined into an epifluorescence light path. This optical system is automated with a data acquisition (DAQ) card, which also receives real-time information from the electrophysiology system's digital signal processor.
Materials and Methods
Our overall experimental approach involved imaging cerebral blood vessels and NADH fluorescence
Microprojection and Imaging System
We built a custom optical system to project patterns of blue light for ChR2 excitation of cortical neurons
To visualize fluorescently labeled blood vessels and NADH fluorescence intensity, we included an epifluorescence light path in our optical system. This single photon approach also enabled us to image the photostimuli patterns. We combined the projection and imaging arms of the system with a set of two beamsplitters (Figure 1). One beamsplitter was the location where we introduced the fluorescence excitation light, while the other beamsplitter introduced the patterned optogenetic stimulation light. By carefully selecting dichroic mirrors and beamsplitters for each experimental setup (Table 1), we were able to apply the patterned optogenetic stimulation light and fluorescence excitation light to the cortex and pass the emitted light through to the camera. We used an electron multiplying charge-coupled device camera (Evolve 512, Photometrics, Tucson, AZ, USA), which provides high sensitivity, to help pick up the relatively faint NADH signal.
Configurations of the imaging and microprojection system for each experiment
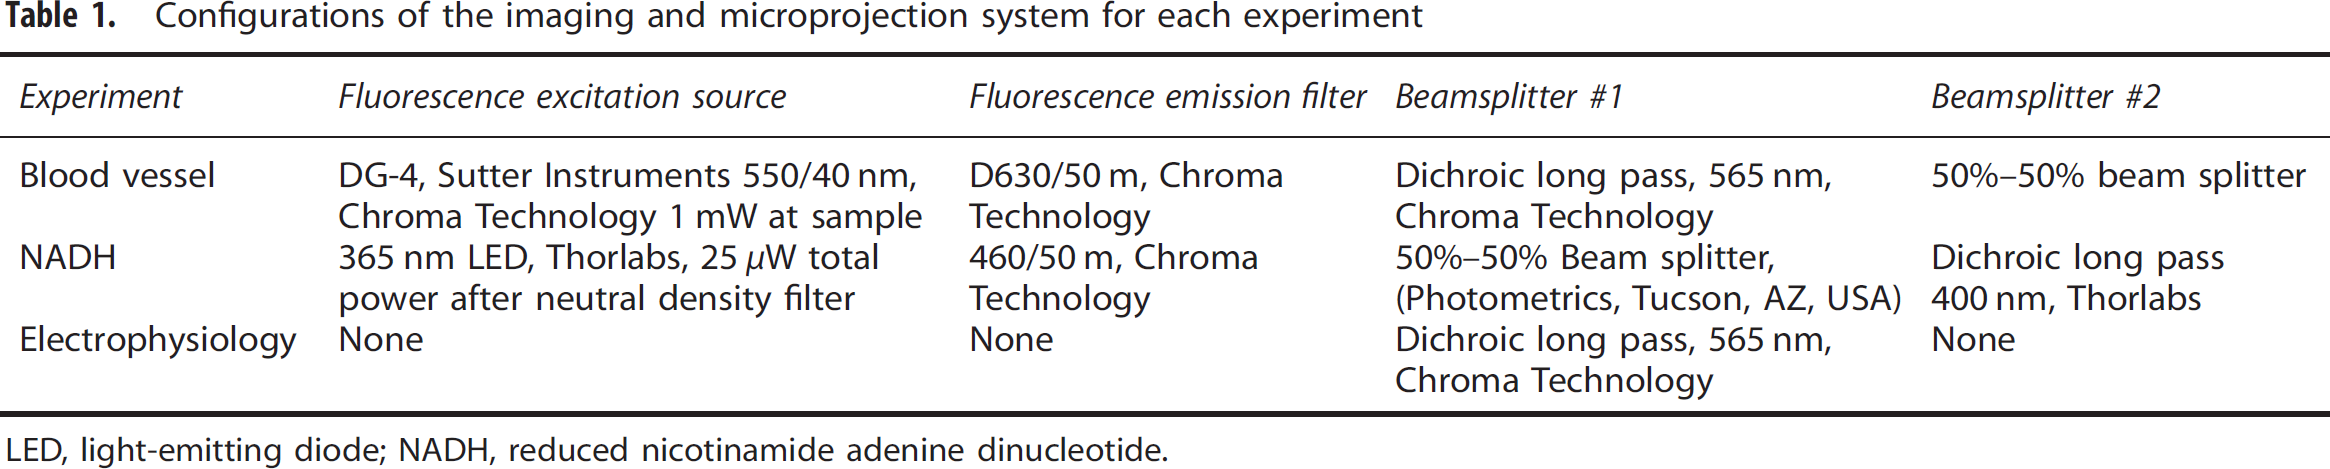
LED, light-emitting diode; NADH, reduced nicotinamide adenine dinucleotide.
The control software for the optical setup was implemented in Labview (National Instruments, Austin, TX, USA). We controlled the laser and other light sources with a digital acquisition card (NI-USB 6211, National Instruments, Austin, TX, USA), and the DMD and electron multiplying charge-coupled device are directly connected to the computer via manufacturer electronics. We also used the digital acquisition to synchronize the optical system with the electrophysiology system.
Cranial Window Implantation
All procedures were approved by the Institutional Animal Care and Use Committee at the University of Wisconsin-Madison. These studies were performed in accordance with the National Institutes of Health Guide for the Care and Use of Laboratory Animals and in accordance with the ARRIVE (Animal Research: Reporting
We implanted five Thy1::ChR2/H134R-YFP mice (Jackson #012350) and five wild-type (WT) mice (10 to 20 weeks, males and females) with a reinforced thinned-skull cranial window. 19 One ChR2 and one WT mouse were excluded because the middle cerebral artery was not visible under the cranial window. The remaining group size was sufficient to power the comparison given the large effect. No researcher blinding of mouse genotype was used in this study. Animals were anesthetized with isoflurane (1.5% to 2.0% in oxygen) and administered buprenorphine (50 μg/kg subcutaneously) for analgesia. The calvarium was exposed and a thin titanium plate was fixed to the bone with cyanoacrylate to stabilize the head during surgery and imaging. The titanium piece was held by a clamp, while a 4-mm diameter area of the skull was thinned with a high-speed surgical drill (FM3545, Foredom Electric, Bethel, CT, USA) and spherical burr (#105 and #106 Dremel, Mount Prospect, IL, USA). A 3-mm diameter piece of #1 cover glass (Warner Instruments, Hamden, CT, USA) was glued over the thinned area. Blue light, which could excite ChR2, was removed from the surgical lights with a 550 nm longpass optical filter (FGL550, Thorlabs, Newton, NJ, USA). Mice were given 7 days of antibiotic treatment (ampicillin, 100mg/kg twice daily), and given at least 2 days of rest before the initial imaging sessions.
To map optogenetically evoked cortical electrophysiological potentials, we implanted two Thy1::ChR2/H134R-YFP mice with custom microelectrocorticography electrode arrays under a standard (not thinned) cranial window. 21 The microelectrocorticography arrays21, 22 were implanted on top of the dura mater to localize cortical activity across the surface of the brain. We used photolithography to define 16 platinum electrode sites (150 μm diameter) in a 4 × 4 grid (0.5-mm site-to-site spacing). We selected Parylene-C (Specialty Coating Systems, Indianapolis, IN, USA), a transparent polymer, as the electrically insulative substrate, so that photostimuli could be applied to the cortex, through the window and transparent array. The implantation procedure was similar to the thinned-skull cranial window method described above, except a 3-mm diameter craniotomy was performed, the array was placed, and UV (ultraviolet) dental acrylic (Fusio, Pentron, Orange, CA, USA) was used to secure the electrode connector. The window was occluded while hardening the acrylic to prevent activation of ChR2 from the UV light source.
Imaging and Electrophysiology Sedation
Mice were sedated with boluses of ketamine (75 mg/kg subcutaneously) and dexmedetomidine (25 μg/kg subcutaneously) during blood vessel imaging, NADH imaging, and cortical potential mapping sessions. The mice were also administered glycopyrrolate (0.02 mg/kg subcutaneously) to maintain adequate heart rate and decrease respiratory secretions. The head was held still by stabilizing the piece of titanium that was incorporated during implantation with a clamp. Supplemental oxygen (100%) and heat were provided. At the end of the procedure, atipamezole (0.5 mg/kg subcutaneously) was administered to reverse the dexmedetomidine.
Vascular Imaging
Rhodamine B isothiocyanate-dextran (70 kDA, Sigma-Aldrich, St. Louis, MO, USA) was injected into the tail vein to fluorescently label the cerebral vasculature. The dye was dissolved in saline at 6 mg/ml and sterile filtered into aliquots before freezing. For each session, an aliquot was thawed and 0.05 to 0.10 ml was injected into the tail vein under isoflurane before imaging. Epifluorescence images of the cortical surface were collected at seven frames per second through a superfluor x10 air objective (Nikon, Tokyo, Japan) with a numerical aperture of 0.50 and a working distance of 1.2 mm. Mirror #1 (refer to Figure 1) was a dichroic with longpass cutoff at 500 nm. We used a 50% to 50% beamsplitter for mirror #2, because it needed to pass blue photostimulation light, reflect green fluorescence excitation light, and pass red emitted light. Rhodamine B was excited with green light (550/40 nm, 1 mW total power) from a xenon light source (DG-4, Sutter Instruments, Novato, CA, USA) and a red emission filter 590/20 nm was positioned in front of the camera. During each trial, the vessels were imaged for 10 seconds before the photostimulus and 30 seconds after the stimulus. The photostimulus (4.5 mW/mm2, 445 nm) was applied for 1 second and pulsed at 25 Hz (20 ms on, 20 ms off). Trials were repeated every 1 to 2 minutes, and 7 trials were performed for each photostimulus pattern.
NADH Imaging
We imaged fluorescence intensity using standard (single photon) excitation. NADH has an excitation peak near 350 nm and an emission peak near 450 nm. We used extremely low levels of UV light to minimize UV damage to the cortex and to avoid excitation of ChR2; 8 μW/mm2 has been suggested previously as a safe level for prolonged
Cortical Potential Mapping
Signals were recorded from the cortical surface using a 16-channel microelectrocorticography electrode array (see Figure 5). The array was connected to a high-impedance headstage, which was referenced to a coiled wire implanted over the contralateral cortical hemisphere. Evoked signals were produced by photostimulation of a limited region of cortex (Figures 5A and 5B). The signals were recorded at 3 kHz (RZ2, Tucker Davis Technologies, Alachua, FL, USA), band-pass filtered from 1 to 500 Hz and subsequently averaged across all trials for a specific stimulus location. Localization heatmaps (Figures 5C and 5F) were generated by cubic interpolation of the average evoked response on each channel.
Data Analysis
Image data were analyzed with Matlab (MathWorks, Natick, MA, USA) and FIJI.
25
Images were registered to the nearest 0.01 pixels using the two-dimensional discrete Fourier transform correlation method.
26
To determine vessel diameters, measurement locations were specified on each vessel manually and a band was defined along the axis of the vessel over which the data were spatially averaged. The vessel width was measured as the full width at half maximum, and a three-point median filter and 3-Hz low pass filter were applied similar to Drew
Results
Arterial and Venous Dilation Due to Channelrhodopsin-2 Stimulation
Branches of the middle cerebral artery MCA dilated transiently after photostimulation (20 ms pulsewidth at 25 Hz for 1 second, 4.5 mW/mm2, and 445 nm) of the cortex (Figure 2 and Table 2), recovering to prestimulus diameters after several seconds. The hemodynamic response was robust, with significant changes occurring in every individual trial. Although branches of the middle cerebral artery dilated >30% for the large photostimulus, nearby veins showed a much smaller and somewhat delayed response.
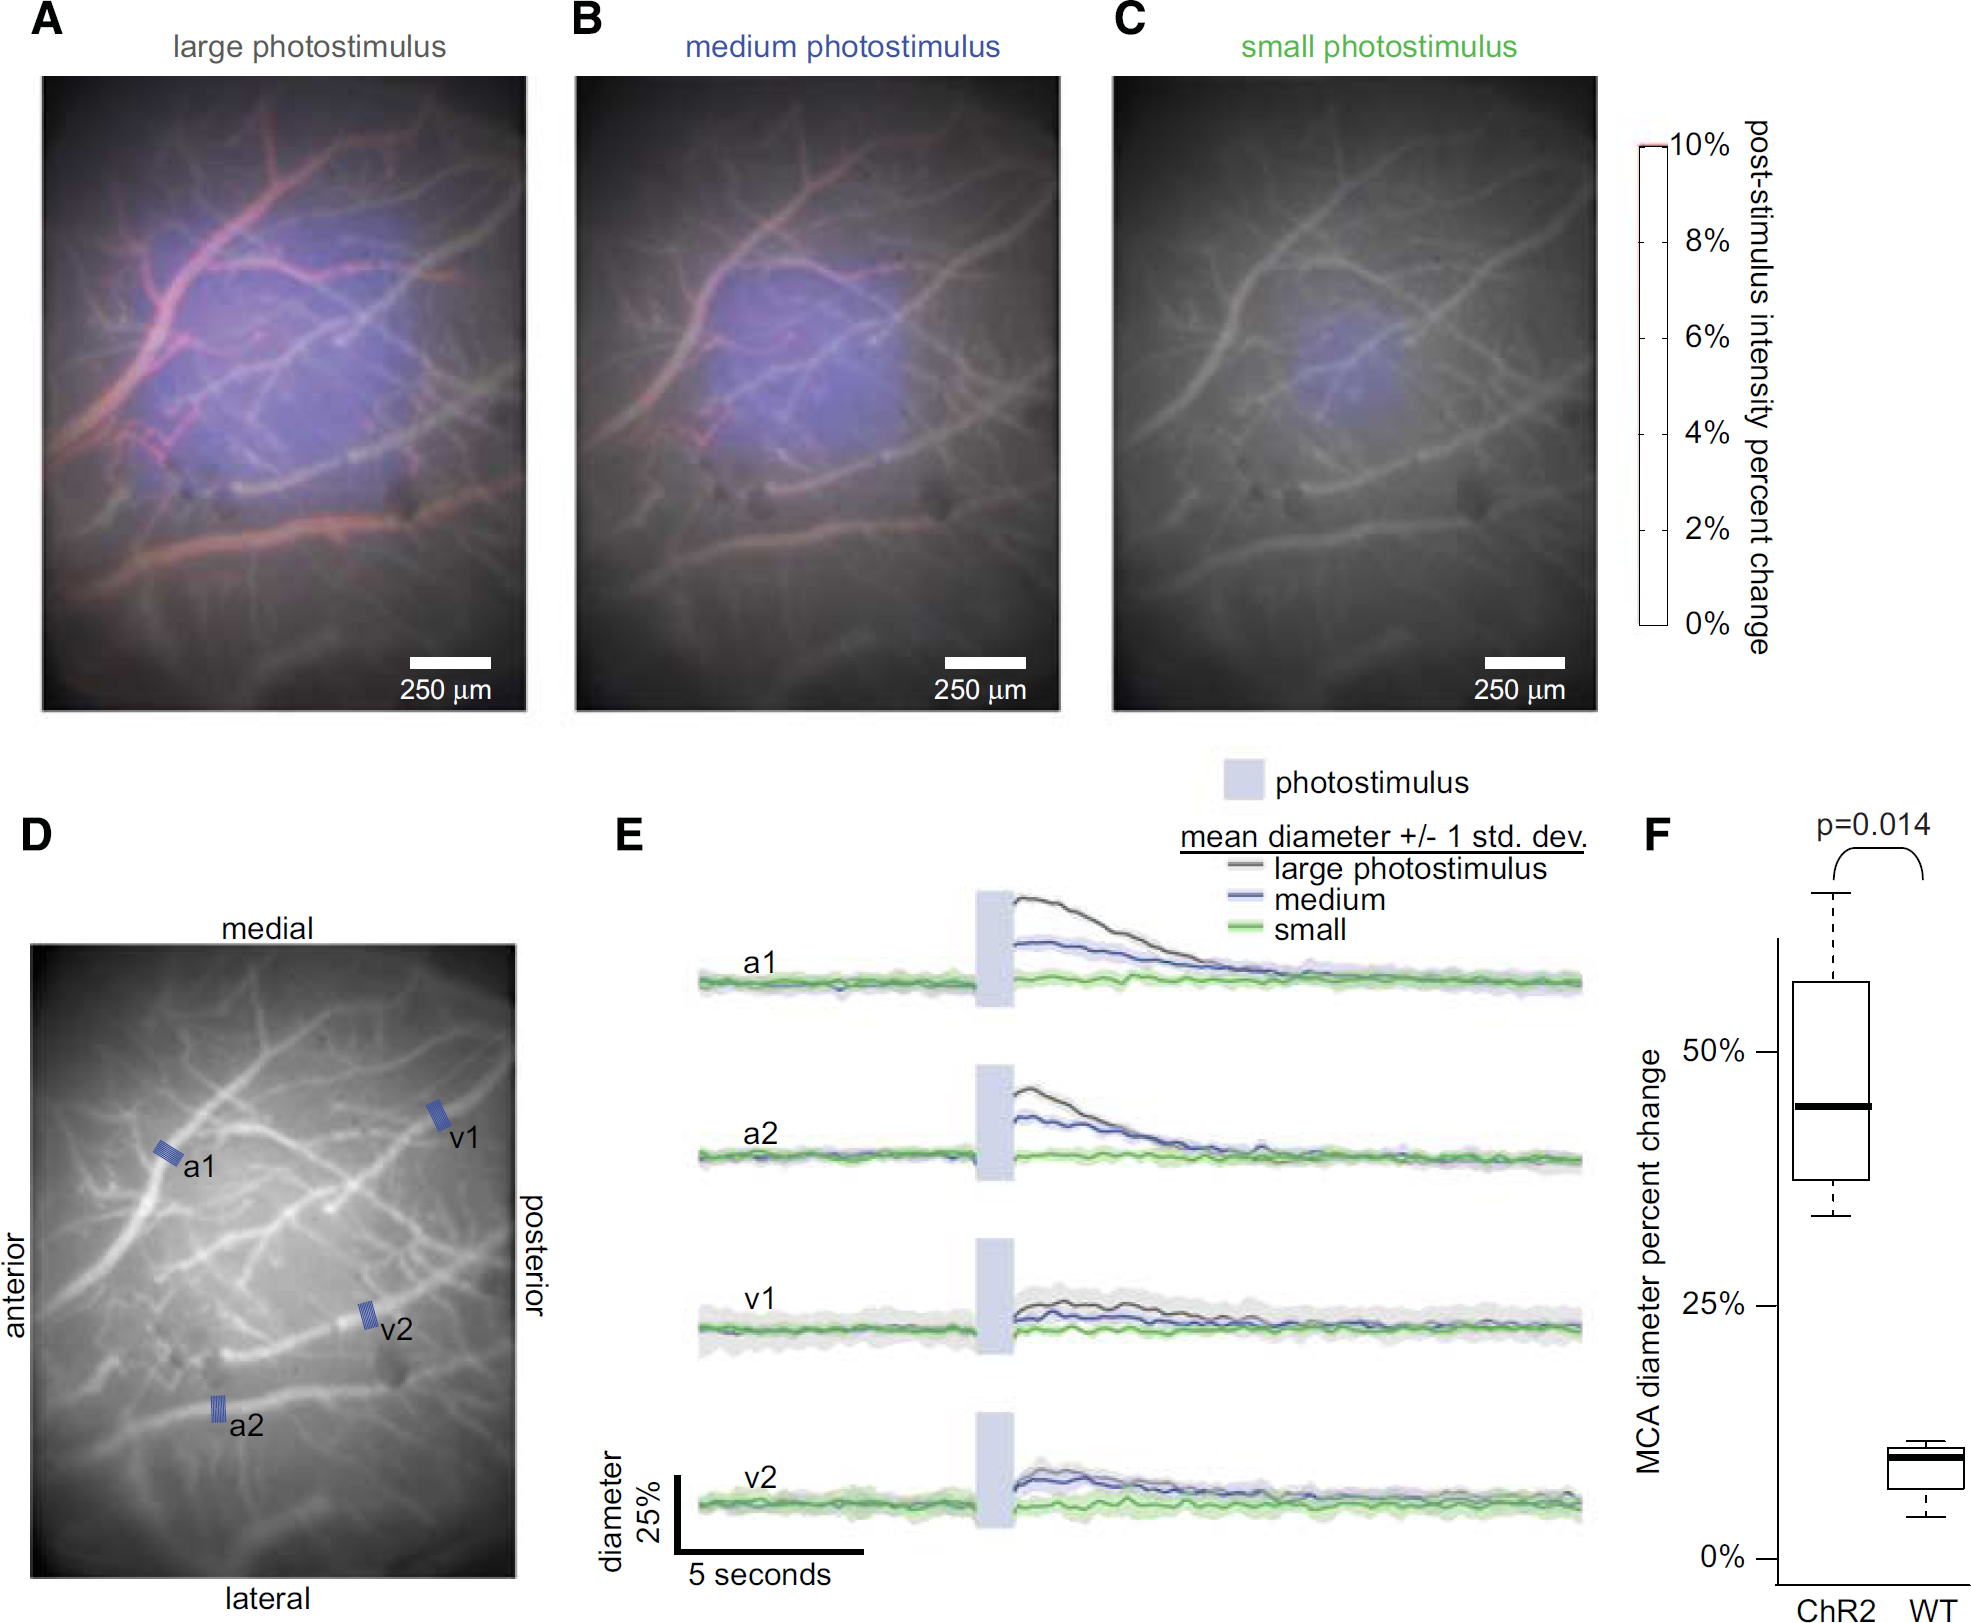
Arterial vasodilation depends on area of optogenetic stimulation. Large (860 × 860 μm), medium (570 × 570 μm), and small (320 × 320 μm) photostimulus squares were applied (
Amplitude and latency (from stimulus onset) of the peak arterial and venous response after photostimulation
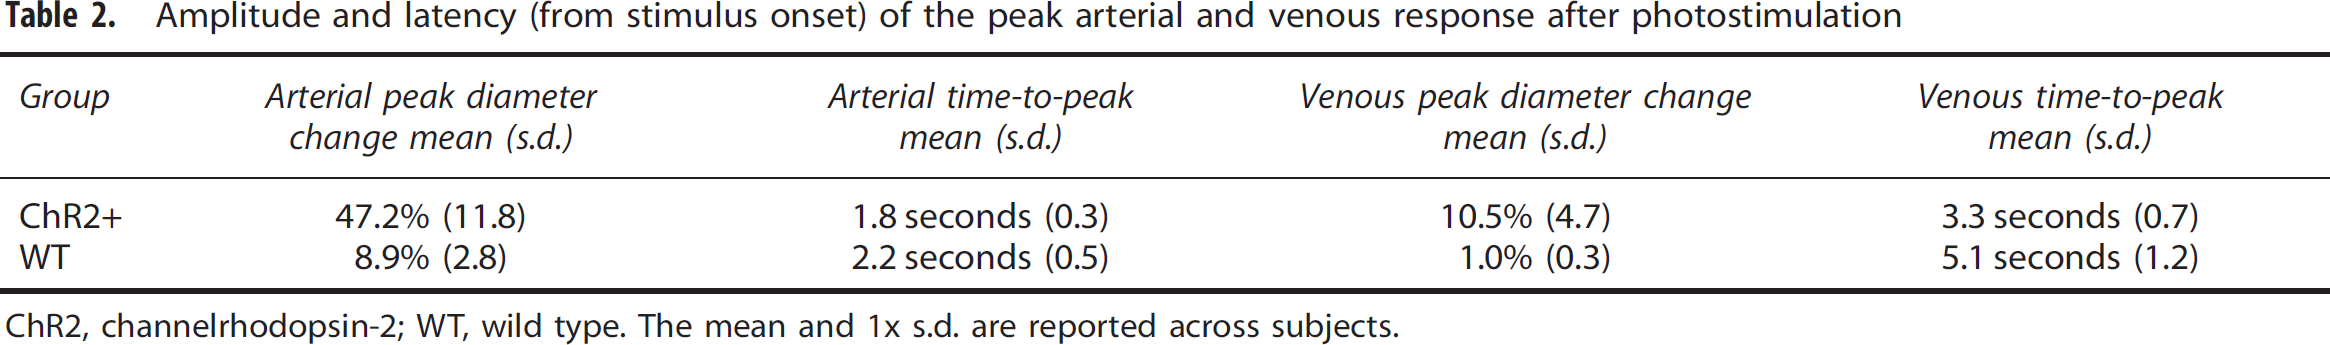
ChR2, channelrhodopsin-2; WT, wild type. The mean and 1x s.d. are reported across subjects.
The magnitude of both the arterial and venous response depended on the cortical area excited by optogenetic stimulation. We used the microprojector to create photostimulus patterns of different geometric areas while holding optical power per area (irradiance) constant. Three different photostimulus sizes were investigated, each consisting of a square that progressively increased in width, from 320 microns (small) to 570 microns (medium) and 860 microns (large). The smallest photostimulus area evoked little to no hemodynamic response, while the larger two photostimulus patterns evoked responses proportionate to the cortical area that was stimulated. Since fMRI artifacts have been reported in WT rodents at high photostimulus levels,14, 15 we replicated our study in both ChR2 expressing (
We further leveraged the microprojector (Figure 1) to investigate whether direct photostimulation of the major cerebral vessels was responsible for the hemodynamic response that was observed. We explored this avenue, because if perivascular nerves express ChR2, then a direct cholinergic mechanism could explain the optogenetic hemodynamic response. We applied a solid photostimulus pattern (Figure 3A) and a pattern with the major cerebral vessels removed (Figure 3B). Monte Carlo simulations suggested that the pattern was preserved in the upper 60 μm of the cortex before scattering took over (Supplementary Figure 2). The resulting hemodynamic response was slightly smaller when the blood vessel avoiding pattern was applied (Figure 3D and Supplementary Table 1), which was expected since slightly less light was applied. If perivascular neurons near these large vessels had been involved, we would have expected a disproportionately reduced hemodynamic response for patterns with vessels omitted. However, we were unable to avoid projecting onto smaller vessels which crisscross the cortex, so the effect of direct photostimulation onto arterioles, capillaries, and venules could not be ruled out. To rule out any electromagnetic interference artifacts or effects because of visual stimulation, a set of control experiments was performed with the DMD turned off, while still activating the laser (Supplementary Figure 3). These experiments (Figure 3 along with Supplementary Figure 3) show that neither direct projection onto the measured vessels nor other potential artifacts (electromagnetic interference and visual stimulation) can account for the observed hemodynamic response. Given that projection onto the vessels has little effect and the significantly larger effect in ChR2 than WT mice, the observed response is most consistent with the explanation that optogenetic drive of pyramidal and postsynaptic cells leads to vasodilation through one or more neurovascular coupling mechanisms.
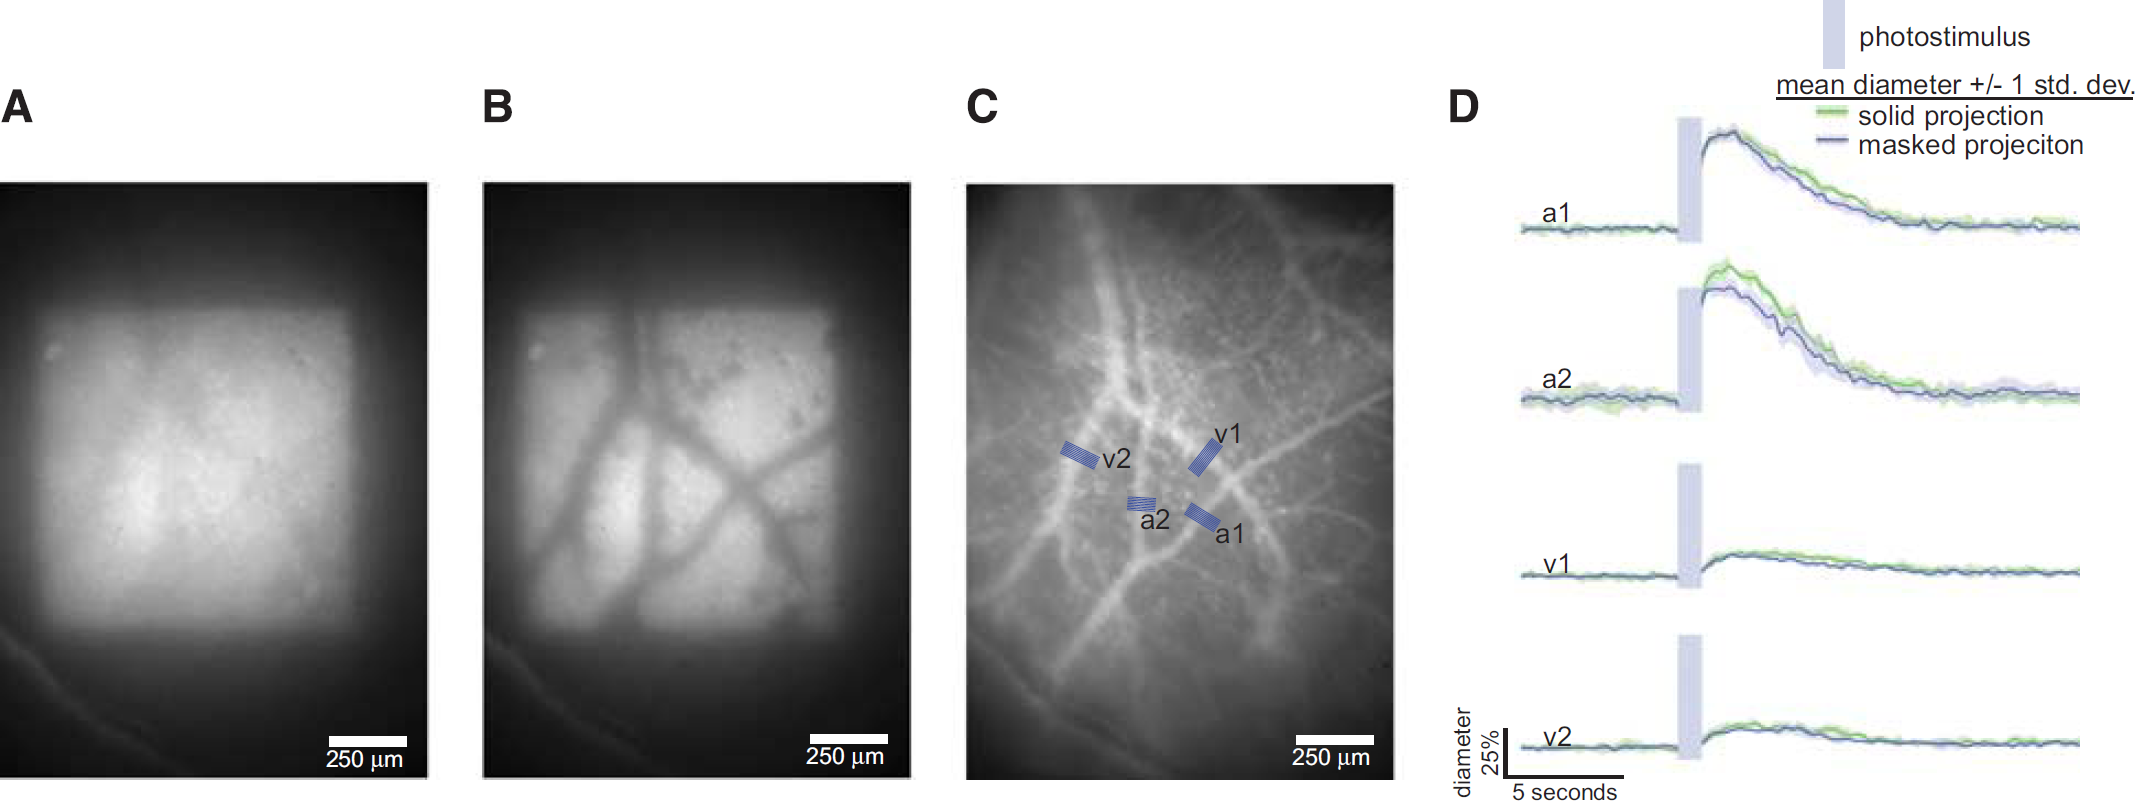
Projection avoiding major blood vessels comparison. We projected either a solid square (
Channelrhodopsin-2 Induces a Rapid Metabolic Transient
We imaged fluorescence intensity using UV excitation and blue emission as a signature of the metabolic and blood volume changes in the cortex after ChR2 photostimulation (5 ms pulsewidth at 66 Hz for 1 second, 445 nm, and 4.5 mW/mm2). When oxidized, NADH, an endogenous fluorescent protein involved in the citric acid cycle, glycolysis, and other key metabolic pathways, becomes NAD+ and loses its fluorescence. Over a nearly similar time period, blood volume changes the absorptive properties of the tissue. The NADH signal decreased by ∼4% after photostimulation and it recovered over several seconds (Figure 4). This effect was not observed in WT mice (Figure 4G and Supplementary Figure 4). As in the vascular experiment, the peak amplitude of the NADH response depended on the area of stimulation.
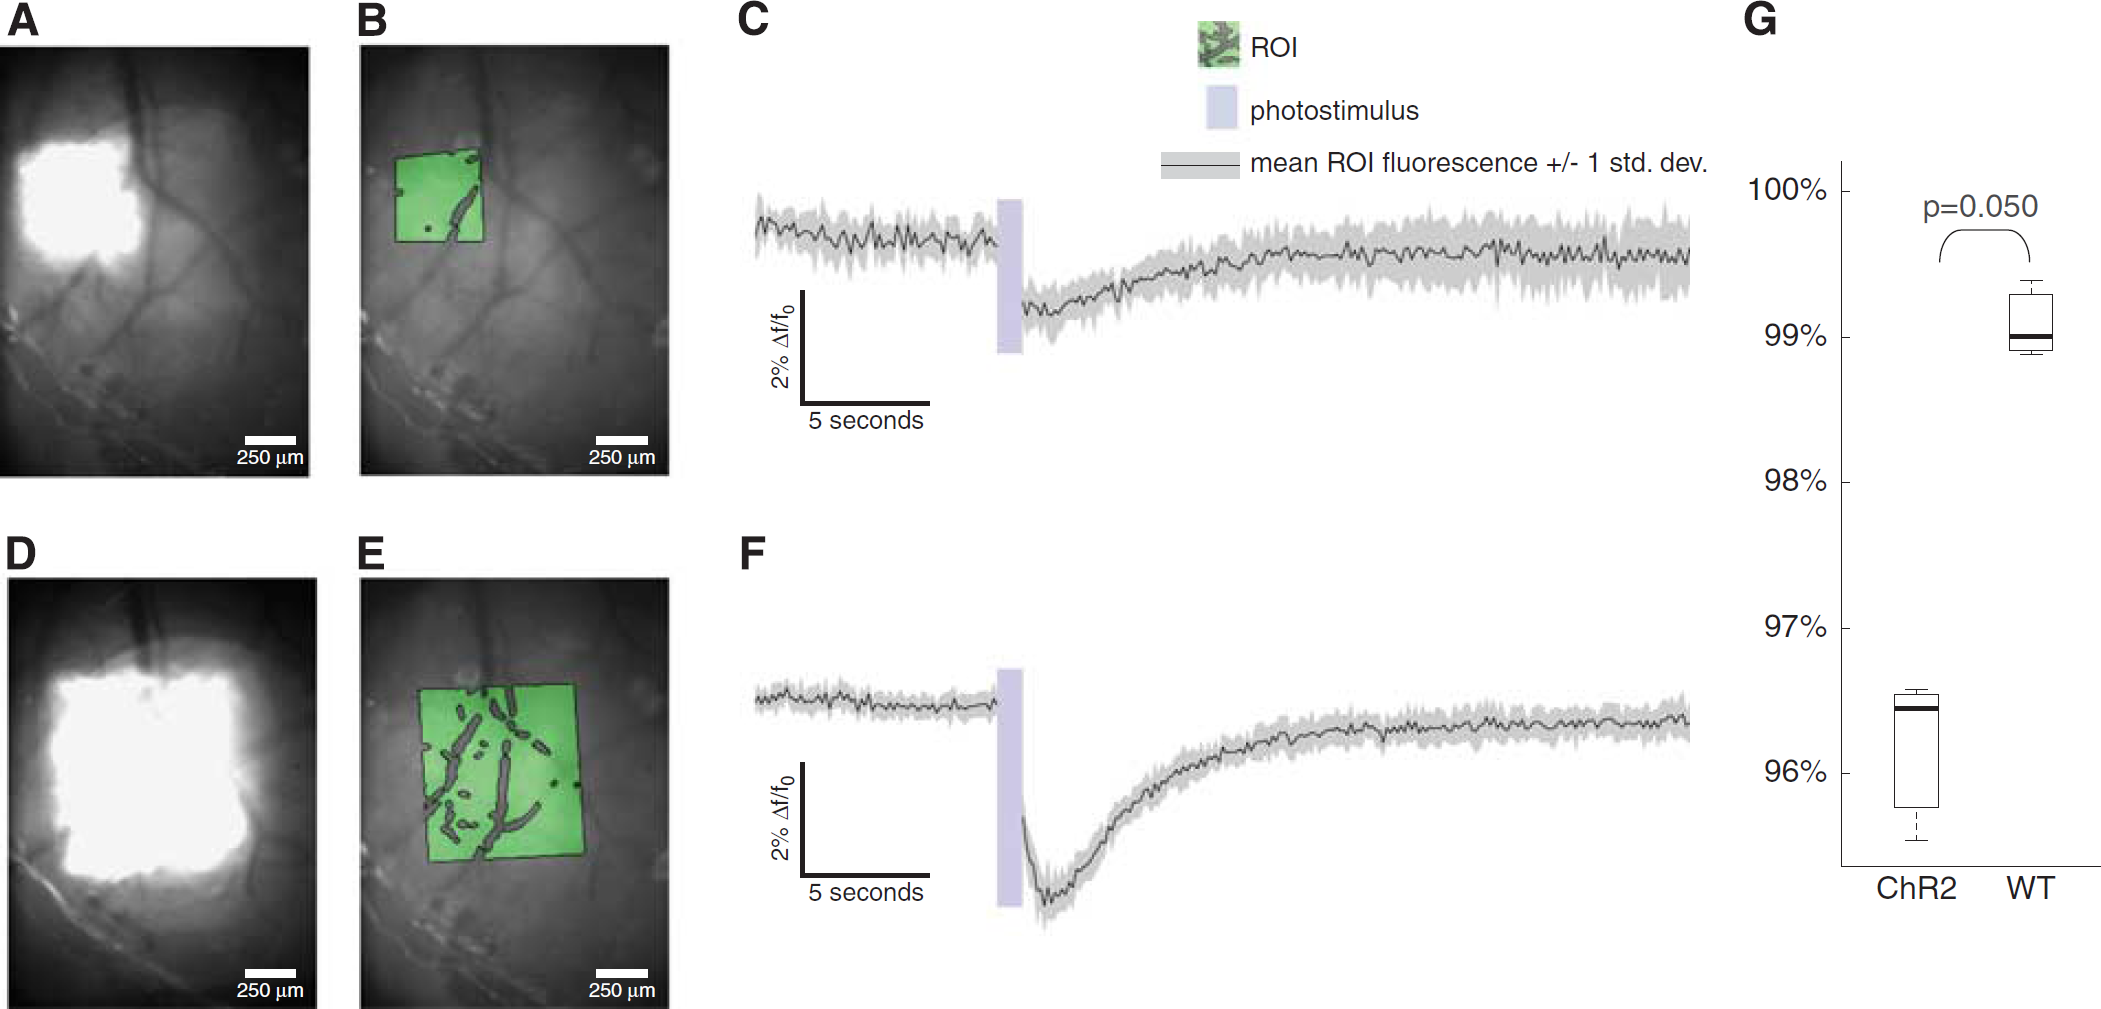
Transient metabolic changes after channelrhodopsin-2 (ChR2) stimulation. Exciting at 365 nm and imaging at 450/100 nm, we recorded this fluorescent signal before and after ChR2 stimulation (5 ms pulsewidth at 66 Hz for 1 second, 445 nm, and 4.5 mW/mm2) of different cortical areas. The large area stimulus (
Colocalization of Photostimulus and Cortical Potentials
Since neurovascular and neurometabolic coupling begin, causally, with neural activity, we mapped cortical potentials evoked by optogenetic stimulation (Figure 5). We fabricated electrode arrays on a transparent insulative polymer so that when implanted on top of the dura mater and under a cranial window, photostimuli could still be patterned onto the cortex. 29 The potentials were of greatest amplitude near the photostimulus location, suggesting that stimulus-correlated activity is predominantly colocalized with the photostimulation location. Stimulating larger cortical volumes (Supplementary Figure 5a) induced larger amplitude potentials spread over a larger cortical area. When we used the microprojector to avoid projecting onto the electrode sites and traces (Supplementary Figure 5b), the recorded potentials were nearly the same (Supplementary Figure 5c), ruling out any significant photoelectric effect. The photoelectric effect for these types of electrodes has been characterized previously. 29
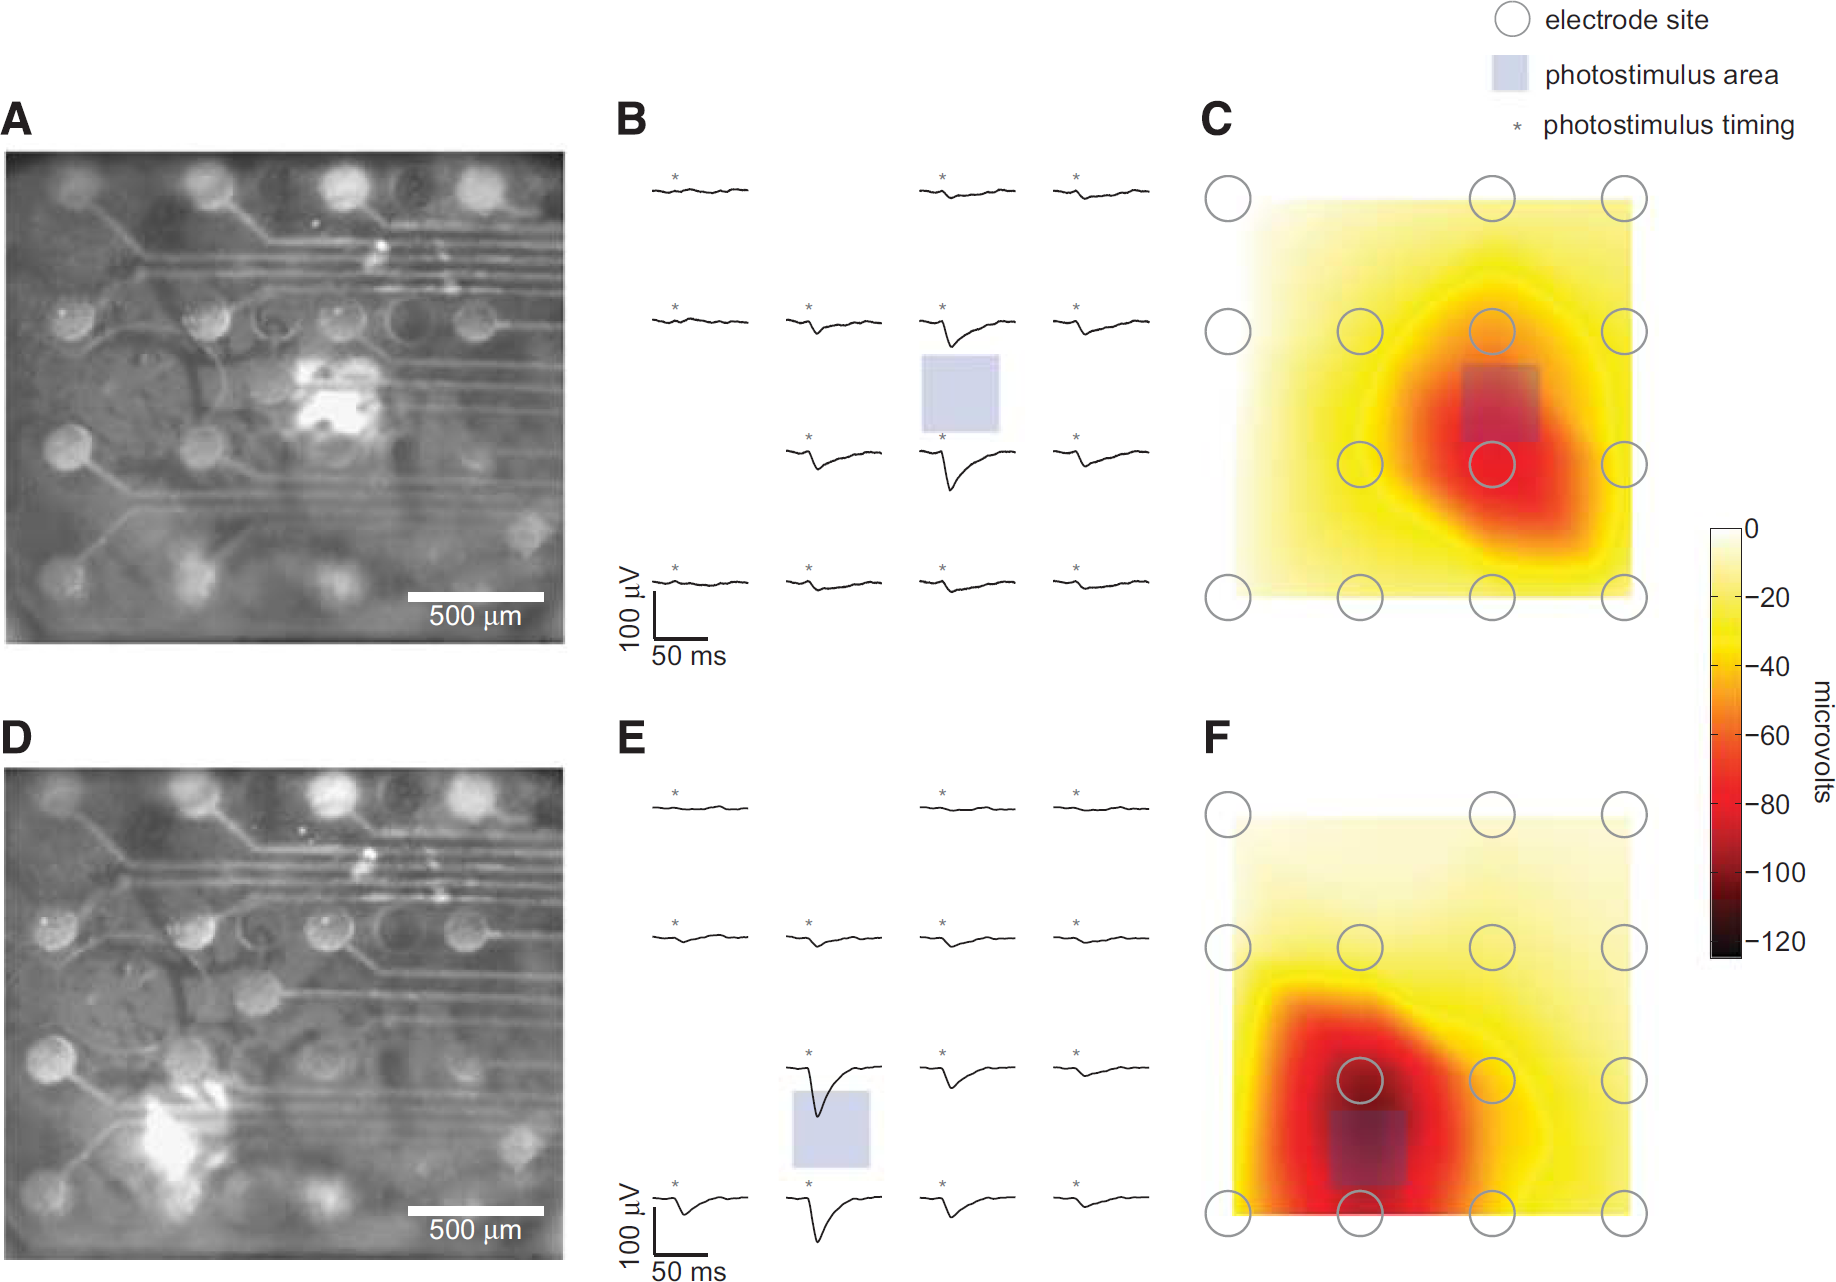
Optogenetically evoked potentials colocalized with the photostimulus location. We implanted microfabricated electrocorticography electrode arrays under a cranial window in Thy1-ChR2/H134R mice (
Discussion
Optogenetic excitation of pyramidal neurons caused arterial dilation and venous distension. The amplitude of venous distension was relatively modest. More prolonged photostimulus pulse train (>10 seconds), like those used in optogenetic fMRI and PET protocols, may have caused a larger and cumulative venous response. Our findings were consistent with previous sensory stimulation investigations, which found that arterial volume changes are larger than venous volume changes for brief stimuli. 27 Further investigation of the dependence of the differential response between arteries and veins on the duration of the photostimulus should be explored to better inform the interpretation of optogenetic fMRI. Interestingly, and perhaps uniquely to this study owing to the use of a microprojector, the amplitude of the arterial and venous response depended on the area of cortex stimulation.
Future studies that further investigate the specific neurovascular coupling mechanisms involved are needed. Astrocyte mediated and nitric oxide—induced vasodilation should still be explored in the context of optogenetics. The expression of ChR2 in perivascular nerves was unknown, so we used the projector to create blood vessel-avoiding photostimulus patterns. We were able to partially rule out direct photostimulation of perivascular nerves near major pial vessels as a cause of disproportionately large hemodynamic responses (Figure 2), but the potential effect of directly photostimulating smaller arteries could not be avoided. The microprojector could be used in future experiments to investigate the spatial relationship between neural activity and blood vessel proximity. Spatial activation studies of neurovascular coupling could also be performed with sensory (e.g., barrel field) stimulation, but optogenetic stimulation enabled defined areas to be easily targeted (Figure 2). Replicating this study with other transgenic lines to investigate other cell types, such as GABAergic interneurons, 20 would be of great interest and would exemplify the cell type-specificity of this method. However, isolating the hemodynamic response of cells that was directly stimulated from postsynaptic cells complicates the problem. 30 This issue could be addressed by studying specific cell types in conjunction with pharmacological synaptic blockers. 9
Optogenetics is a potentially useful method for studying neurovascular coupling, and understanding the metabolic effects of optogenetic stimulation is increasingly important as optogenetics is applied throughout neurophysiology research. Channelrhodopsin-2 stimulation creates large cationic currents, and maintaining ionic gradients is highly energy demanding.
17
The cationic currents induced by ChR2 stimulation caused a rapid change in the NAD+/NADH redox state. Thus it is likely that cellular membrane currents and downstream metabolic processes are temporally tightly coupled. Other metabolically demanding cellular events (e.g., neurotransmitter release) could also be affected indirectly by optogenetically induced metabolic transients. Since ChR2 stimulation led to NADH oxidation, and NAD+/NADH is involved in glycolysis and citric acid cycle, our findings are consistent with the understanding of the PET brain glucose metabolism study.
18
As is necessary for PET, they used lengthy photostimulus patterns (30 seconds on/30 seconds off). We found that only 1 second of stimulation evoked sizable metabolic changes. Effects of similar amplitude have been reported using electrical stimulation in brain slices.31, 32 Optical measures of metabolism have added benefit of high temporal resolution compared with 2-deoxy-2-fluoro-
Photostimulus-related fMRI artifacts have been reported in WT rodents by multiple groups.14, 33 Given this, we conducted our study with both ChR2 expressing and WT mice. Although we did observe small artifacts, the response in ChR2 expressing mice was always significantly larger (Figures 2F and 4G). The observed artifact was probably because of heating
33
and thermosensitive channels (e.g., transient receptor potential channels). Further mechanistic studies of this artifact would be warranted. We kept the photostimulus irradiance level (4.5 mW/mm2) in the neighborhood of the presumed minimum (1 mW/mm2) for exciting ChR2
New technological approaches that integrate optical imaging and optogenetic stimulation could push forward the study of neurovascular coupling. Optical coherence tomography could be used to image vascular diameters and blood flow hundreds of micrometers, or even millimeters, into the cortex as it responds to optogenetic modulation. Two-photon excitation has been successfully applied to optogenetically excite individual neurons, 36 and two-photon imaging has been widely used to study neurovascular coupling, 37 so entirely two-photon—based imaging and optogenetic approaches may be possible with further developments to excite larger populations of neurons.
Optogenetic stimulation of pyramidal neurons causes both hemodynamic and metabolic changes in the cortex. One second of photostimulation was sufficient to produce sizable and rapid effects that could be imaged optically. For these relatively brief stimulus trains, arteries dilated more than veins, and the amplitude of vasodilation corresponded to the area of cortex recruited. Similarly, the amplitude of the NADH response depended on the photostimulus area. Our findings provide direct optical evidence in support of studies using optogenetics with fMRI and PET, and the DMD optical system we developed provides a platform for spatially and temporally precise cell type—specific neurovascular and neurometabolic coupling studies.
Footnotes
References
Supplementary Material
Please find the following supplemental material available below.
For Open Access articles published under a Creative Commons License, all supplemental material carries the same license as the article it is associated with.
For non-Open Access articles published, all supplemental material carries a non-exclusive license, and permission requests for re-use of supplemental material or any part of supplemental material shall be sent directly to the copyright owner as specified in the copyright notice associated with the article.