
Abstract
Resting-state functional connectivity is a growing neuroimaging approach that analyses the spatiotemporal structure of spontaneous brain activity, often using low-frequency (<0.08 Hz) hemodynamics. In addition to these fluctuations, there are two other low-frequency hemodynamic oscillations in a nearby spectral region (0.1–0.4 Hz) that have been reported in the brain: vasomotion and Mayer waves. Despite how close in frequency these phenomena exist, there is little research on how vasomotion and Mayer waves are related to or affect resting-state functional connectivity. In this study, we analyze spontaneous hemodynamic fluctuations over the mouse cortex using optical intrinsic signal imaging. We found spontaneous occurrence of oscillatory hemodynamics ∼0.2 Hz consistent with the properties of Mayer waves reported in the literature. Across a group of mice (n = 19), there was a large variability in the magnitude of Mayer waves. However, regardless of the magnitude of Mayer waves, functional connectivity patterns could be recovered from hemodynamic signals when filtered to the lower frequency band, 0.01–0.08 Hz. Our results demonstrate that both Mayer waves and resting-state functional connectivity patterns can co-exist simultaneously, and that they can be separated by applying bandpass filters.
Keywords
Introduction
Neural activity measured in the resting brain is synchronized and can be analyzed to identify functional brain networks in humans,1,2 monkeys, 3 and rodents.4,5 These resting-state functional connectivity (RSFC) networks are typically calculated by analyzing hemodynamic activity at frequencies less than 0.08 or 0.1 Hz. 6 RSFC has made a significant impact on how functional connections in the brain are interpreted, and its use in functional magnetic resonance imaging (fMRI) is spearheading the effort to map the functional connectome of the human brain. 7 Application of RSFC techniques in mice has also shown great promise in elucidating the functional structure of the mammalian brain, especially in studies that employ powerful genetic manipulations not possible in humans. 8 The general utility of RSFC in mice has been demonstrated by successful differentiation of resting-state brain networks of wild-type mice and mouse models of Alzheimer’s disease and stroke.9,10
However, in addition to RSFC phenomena, there are numerous studies of two other low-frequency hemodynamic oscillations known as vasomotion and Mayer waves that go back several decades.11–13 Although RSFC, vasomotion, and Mayer waves fall within a similar frequency range, the relationship between these phenomena (if any) is rarely addressed and studied, particularly in rodents.14,15 As RSFC analysis becomes an increasingly popular technique in functional neuroimaging studies in mice and humans, it is essential to determine how vasomotion and/or Mayer waves affect the low-frequency hemodynamic fluctuations used in RSFC calculations.
Vasomotion is defined as an oscillation of vascular tone that is independent of heartbeat, respiration, and neuronal activity. It has been described in vitro and throughout the bodies of various species in vivo, including the brains of rats, 16 awake rabbits, 17 cats, 18 and humans. Mayer waves, in contrast, are global oscillations in arterial blood pressure (ABP) that correlate with sympathetic neural activity. 12 While both vasomotion and Mayer waves have been reported at similar frequencies (e.g. 0.1–0.4 Hz), by definition, Mayer waves are synchronous in large parts of the body, whereas vasomotion has been mostly investigated in small networks of vessels and is generally considered to be myogenic in origin.12,13,19 It has also been reported that vasomotion can be affected by anesthesia and hypertension, both of which affect large areas of the body, complicating the differentiation of Mayer waves and vasomotion even further.20,21
Regardless of the differences in the mechanisms of vasomotion and Mayer waves, both produce distinctive approximate sinusoidal hemodynamic oscillations in the frequency range of 0.1 to 0.4 Hz. Consequently, they can be identified by a peak with narrow spectral width in the frequency spectrum of hemodynamic measurements. In comparison, hemodynamic oscillations used in RSFC analysis are broadband and inversely proportional to frequency (i.e. spectrum has a 1/f profile). For the purposes of our report, vasomotion and Mayer waves will be more broadly classified as hemodynamic oscillations with narrow spectral width (HONS).
Herein we examine the interaction between HONS and RSFC in a mouse model. Specifically, we analyzed differential changes of oxy- and deoxy-hemoglobin (ΔHbO2 and ΔHbR) over the majority of the mouse cortex using a custom-built optical intrinsic signal imaging (OISI) system. Conducting the study using OISI in mice enabled us to image hemodynamics at 30 Hz, providing access to higher frequency bands than typically available in fMRI without aliasing heart and breathing signals. Our results reveal that RSFC patterns analyzed below 0.08 Hz are largely independent of the presence or magnitude of HONS at higher frequencies. After filtering, these slow fluctuations produce resting-state brain maps with high correlations in focal brain regions that have similar topography to correlation maps identified in previous resting-state studies in rodents, as well as functional maps generated by sensory-evoked activation.5,8–10 Finally, we demonstrate how RSFC results can be misinterpreted when hemodynamic activity is filtered in a frequency band that include frequencies over which sufficiently high HONS exist.
Materials and methods
Animal preparation
All animal studies were approved by the Washington University School of Medicine Animal Studies Committee (protocol #20130217) under guidelines and regulations consistent with the Guide for the Care and Use of Laboratory Animals, Public Health Service Policy on Humane Care and Use of Laboratory Animals, the Animal Welfare Act and Animal Welfare Regulations, and ARRIVE guidelines (http://www. nc3rs.org/ARRIVE). Briefly, male Swiss Webster mice (n = 20, 6–10 weeks, 22–32 g, Harlan Laboratories, Indianapolis, IN, USA) were anesthetized with a ketamine-xylazine mixture (86.9 mg/kg Ketamine, 13.4 mg/kg xylazine). 9 Mice were then mounted on a stereotactic frame, and their body temperature was maintained at 37℃ via feedback from a rectal probe. Once securely mounted, the majority of the cerebral cortex was exposed by making a midline incision along the top of the head. Twenty minutes of data were analyzed from each mouse.
OISI
The OISI system uses light emitting diodes (LEDs) operating at four wavelengths (478 nm, 588 nm, 610 nm, and 625 nm) mounted on a metal ring. An EMCCD camera (iXon 897, Andor Technologies) was mounted above the ring of LEDs, and anesthetized mice were positioned such that light diffusely reflected from the brain was detected by the camera. The camera acquired 128 × 128 pixel images (4 × 4 binning on camera) at a frame rate of 120 Hz over an a field of view (FOV) of approximately 1 cm × 1 cm. Synchronization of the camera and LEDs was achieved using a data acquisition unit (NI PCI-6733, National Instruments) and custom-written software (MATLAB, Mathworks). After temporally multiplexing the four illumination wavelengths, the system has a full spectral frame rate of 30 Hz.
Image processing and spectral analysis
Diffusely reflected light collected by the camera was converted into ΔHbO2 and ΔHbR using the Modified Beer-Lambert law.22,23 Images (for each contrast) were then smoothed with a 5 × 5 pixel Gaussian filter with standard deviation of 1.2 pixels (the effective dimensions on the mouse cortex correspond to a 390 × 390 µm box and 100 µm standard deviation). Spectral analysis of hemodynamic signals was conducted using the fast-Fourier transform (FFT) algorithm. Hemodynamic traces were filtered over different frequency bands between 0.01 Hz and 5.12 Hz by applying digital high-pass and low-pass fifth-order Butterworth filters.
In order to examine how the frequency content in the spontaneous activity was spatially distributed over the cortex, spectral maps were also created for each mouse. The FFT of each ΔHbO2 trace over the cortex of a mouse was computed, and the magnitude of the spectrum within a chosen bandwidth was integrated and normalized with respect to bandwidth, similar to the amplitude of low-frequency fluctuations (ALFF) algorithm. 24
For data to be used in the analysis, we required the hemodynamic spectrum to be inversely proportional to frequency and/or any peak within the bandwidth in which HONS have been reported (0.1–0.4 Hz) to be distinct (the magnitude at full width half max was less than 80% of the magnitude of the peak). One animal failed to pass these criteria, and was therefore excluded from the analysis.
Seed-based functional connectivity
RSFC analysis was conducted using both ΔHbO2 and ΔHbR data. If not specified otherwise, data were filtered between 0.01 and 0.08 Hz, as described previously.5,9,25 All time traces over the mouse cortex were averaged to create a global signal that was regressed from every pixel. Global signal regression was also performed using the first principal component as a global signal estimator. 26 Sixteen seed locations based on a histological atlas were chosen for functional connectivity analysis: right and left frontal, cingulate, motor, somatosensory, retrosplenial, visual and auditory cortices, as well as the olfactory bulb. Pixel time traces within 0.25 mm of a seed locus (about 30 pixels) were averaged to create a seed time trace. The Pearson r correlation coefficient was calculated between each seed’s time trace and every other pixel in the brain, creating a functional connectivity map for that seed. Contralateral homotopic functional connectivity values were determined by calculating the correlation coefficient between homologous regions. The locality of high correlations in resting-state brain maps was quantified by calculating the percentage of the RSFC maps that had correlation values greater than or equal to 0.8.
Statistical analysis
A total of 76 5-min blocks were analyzed in this study (20 minutes of data for 19 mice). Contralateral homotopic functional connectivity values calculated for the eight homologous regions (frontal, cingulate, motor, somatosensory, retrosplenial, visual, auditory, and olfactory) were plotted against the intensity of HONS. Simple linear regression was then performed on the data, and the coefficient of determination (r2) was calculated to quantify the correlation between the magnitude of HONS and contralateral homotopic functional connectivity values.
The contralateral homotopic functional connectivity values for the 76 5-min blocks were then separated into three groups based on the magnitude of HONS present in the block. Eight ANOVA tests were conducted to determine if there was a statistical difference in the mean contralateral homotopic functional connectivity values across these three groups for the eight different seed regions. Critical values for accepting or rejecting the null hypothesis were corrected for multiple comparisons using Benjamini and Hochberg’s FDR-controlling procedure (α = 0.05).
Results
Identification of HONS with OISI
To investigate the interaction between HONS and RSFC, we began by characterizing HONS and developing a method for quantifying their magnitude. In order to determine if HONS were present in each mouse, we evaluated time courses from regions corresponding to either superficial vasculature or cortex and compared their spectral features (Figure 1A–C). This initial survey revealed that spontaneous activity in some mice exhibited a 1/f profile with no distinct peaks other than breathing and pulse in the frequency spectrum (Mouse 1, Figure 1C1), while other mice exhibited either modest (Mouse 2, Figure 1C2) or strong (Mouse 3, Figure 1C3) HONS between 0.16 and 0.32 Hz.
Measurements of low-frequency hemodynamics in mouse cortex reveal varying degrees of hemodynamic oscillations with narrow spectral width (HONS). (A) White light images of three mouse cortices (mice 1–3) with three points selected on each cortex. (B) ΔHbO2 traces of the three points selected in white light image of three mice shown in A. (C) Frequency spectra of traces shown in B. The frequency axis is on a log scale, but the labels are linear. The dark gray indicates the canonical bandwidth for functional connectivity analysis (0.01–0.08 Hz), and the light gray indicates the bandwidth in which HONS were found in some of the mice (0.08–0.64 Hz). (D) Spectral maps for 0.01 to 0.08 Hz (dark gray region in C). (E) Spectral maps for 0.08 to 0.64 Hz (light gray region in C). (F) Spectral maps for 2.56 to 5.12 Hz.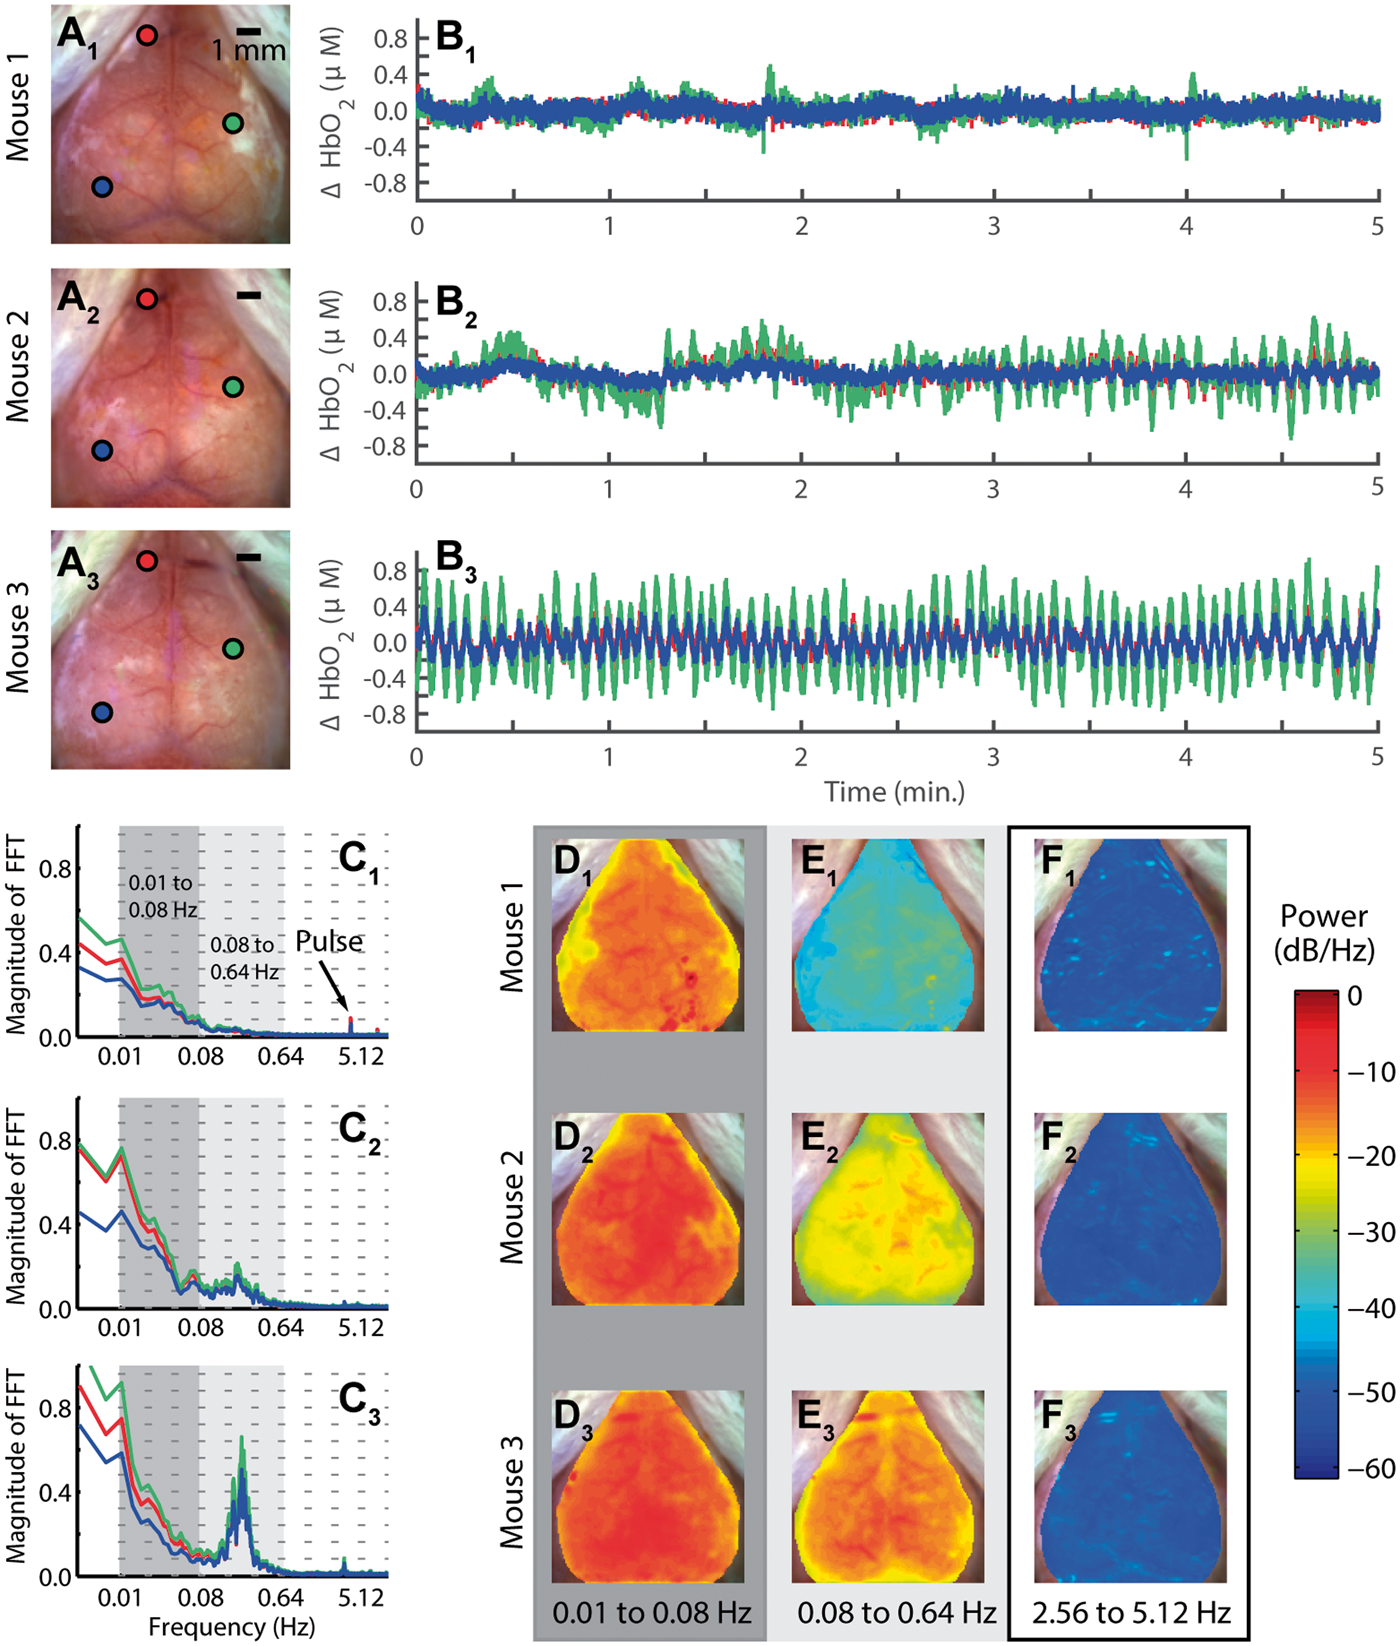
To aid in classifying the type of HONS present, the spatial distribution of power was examined over different frequency bands. Specifically, we examined the canonical band used in RSFC analysis (0.01–0.08 Hz; called the RSFC band hereafter, Figure 1D), the band containing the distinctive peak identified in Mouse 3 (0.08 to 0.64 Hz; called the HONS band hereafter, Figure 1E), and a higher band containing frequencies associated with pulse (2.56 to 5.12 Hz, Figure 1F). The spectral maps generated for the HONS band indicates that the HONS identified in Mice 2 and 3 were present over a large region (∼1 cm2).
Broadband spatiotemporal patterns in a mouse with strong HONS
To further evaluate how the spatiotemporal characteristics of the resting-state signal evolve over time, spontaneous activity in ΔHbO2, ΔHbR, and total hemoglobin (ΔHbT) contrasts were analyzed. For illustration, data (Figure 2) are shown for a mouse exhibiting a strong peak in the HONS band (Mouse 3 from Figure 1). Time courses of ΔHbO2 and ΔHbR averaged over the brain are out-of-phase and exhibit a peak near 0.2 Hz (Figure 2A–C and Supplementary Video 1). Interestingly, ΔHbT in the brain remained relatively constant over the duration of these oscillations (Figure 2B). The image sequence illustrates an oscillation in ΔHbO2 that propagates over the entire cortex (Figure 2D).
The spatiotemporal features of HONS. (A) White light image of Mouse 3 with dashed region indicating which part of image contained a cerebral hemodynamic signal. (B) Average ΔHbO2, ΔHbR, and ΔHbT traces for the entire region marked in A over 40 s. (C) FFT of ΔHbO2 (red) and ΔHbR (blue) traces shown in B. The spectral peak is at ∼0.2 Hz. The frequency axis is on a log scale, but the labels are linear. (D) A representative image sequence corresponding to gray region in B. The HONS propagate across the entire cortex.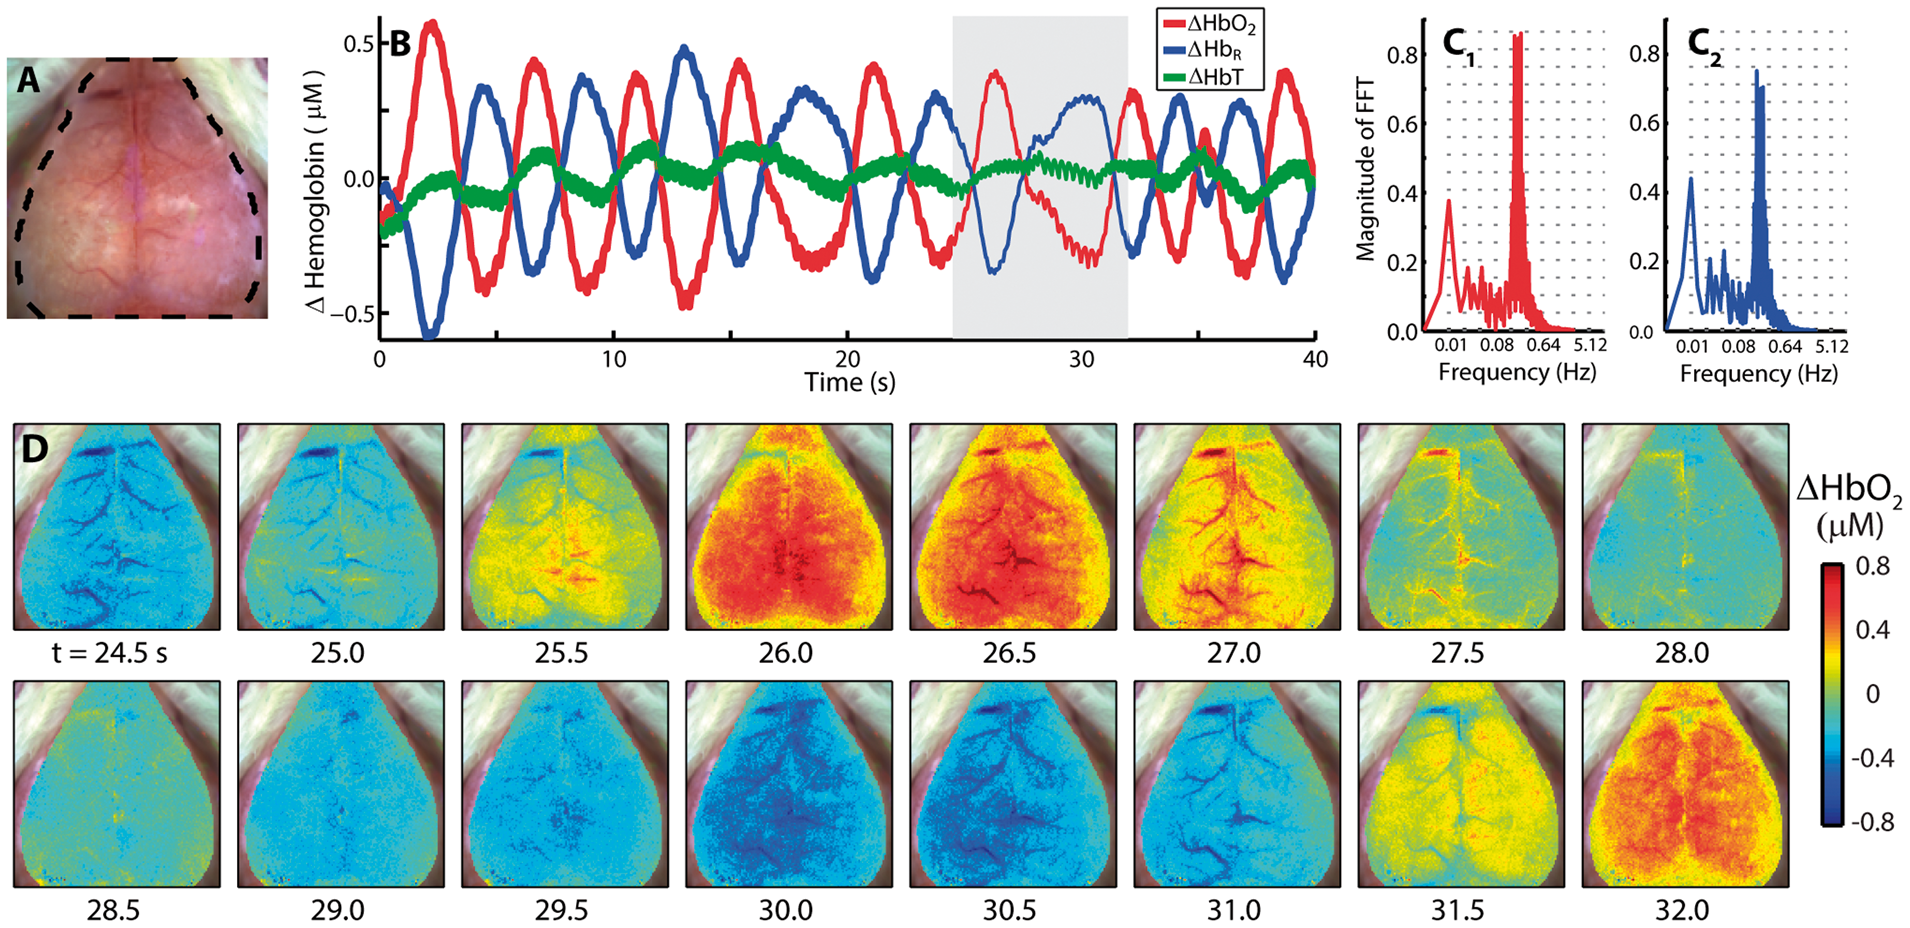
Two critical steps in RSFC analysis are temporal filtering and removal of shared regional variance (e.g. the global signal) by linear regression. Both of these are likely to reduce the influence of HONS signals on RSFC analysis. To illustrate the effect of these preprocessing steps, the full-band spontaneous hemodynamics reported in Figure 2 were separately filtered over either the RSFC or HONS bands for the mouse that had high magnitude HONS (Mouse 3 from Figure 1). After filtering to either band, the global signal was created by averaging all brain pixels within the FOV (shown in Figure 2A), and regressed from every pixel’s time trace. Within the RSFC band (Figure 3A), synchronized spontaneous activity is observed in distinct functional regions (e.g. cingulate cortex from 0 to 4.8 s and visual cortex from 22.5 to 28.1 s). Conversely, during this same epoch, hemodynamic oscillations within the HONS band (Figure 3B) are less spatially specific and resemble wave-like oscillations that can be seen in both cortical tissue and vasculature (see Supplementary Video 2).
Spatiotemporal patterns of ΔHbO2 filtered within different bandwidths with removal of the global signal (Mouse 3 in Figure 1). (A) Filtered between 0.01 and 0.08 Hz and resampled to 1.25 Hz. Spontaneous correlated activity in somatosensory and visual cortices is present during this 28-s epoch. (B) Filtering between 0.08 and 0.64 Hz, a bandwidth containing the distinct peak in the frequency spectrum. The spatiotemporal patterns vary dramatically from those in A.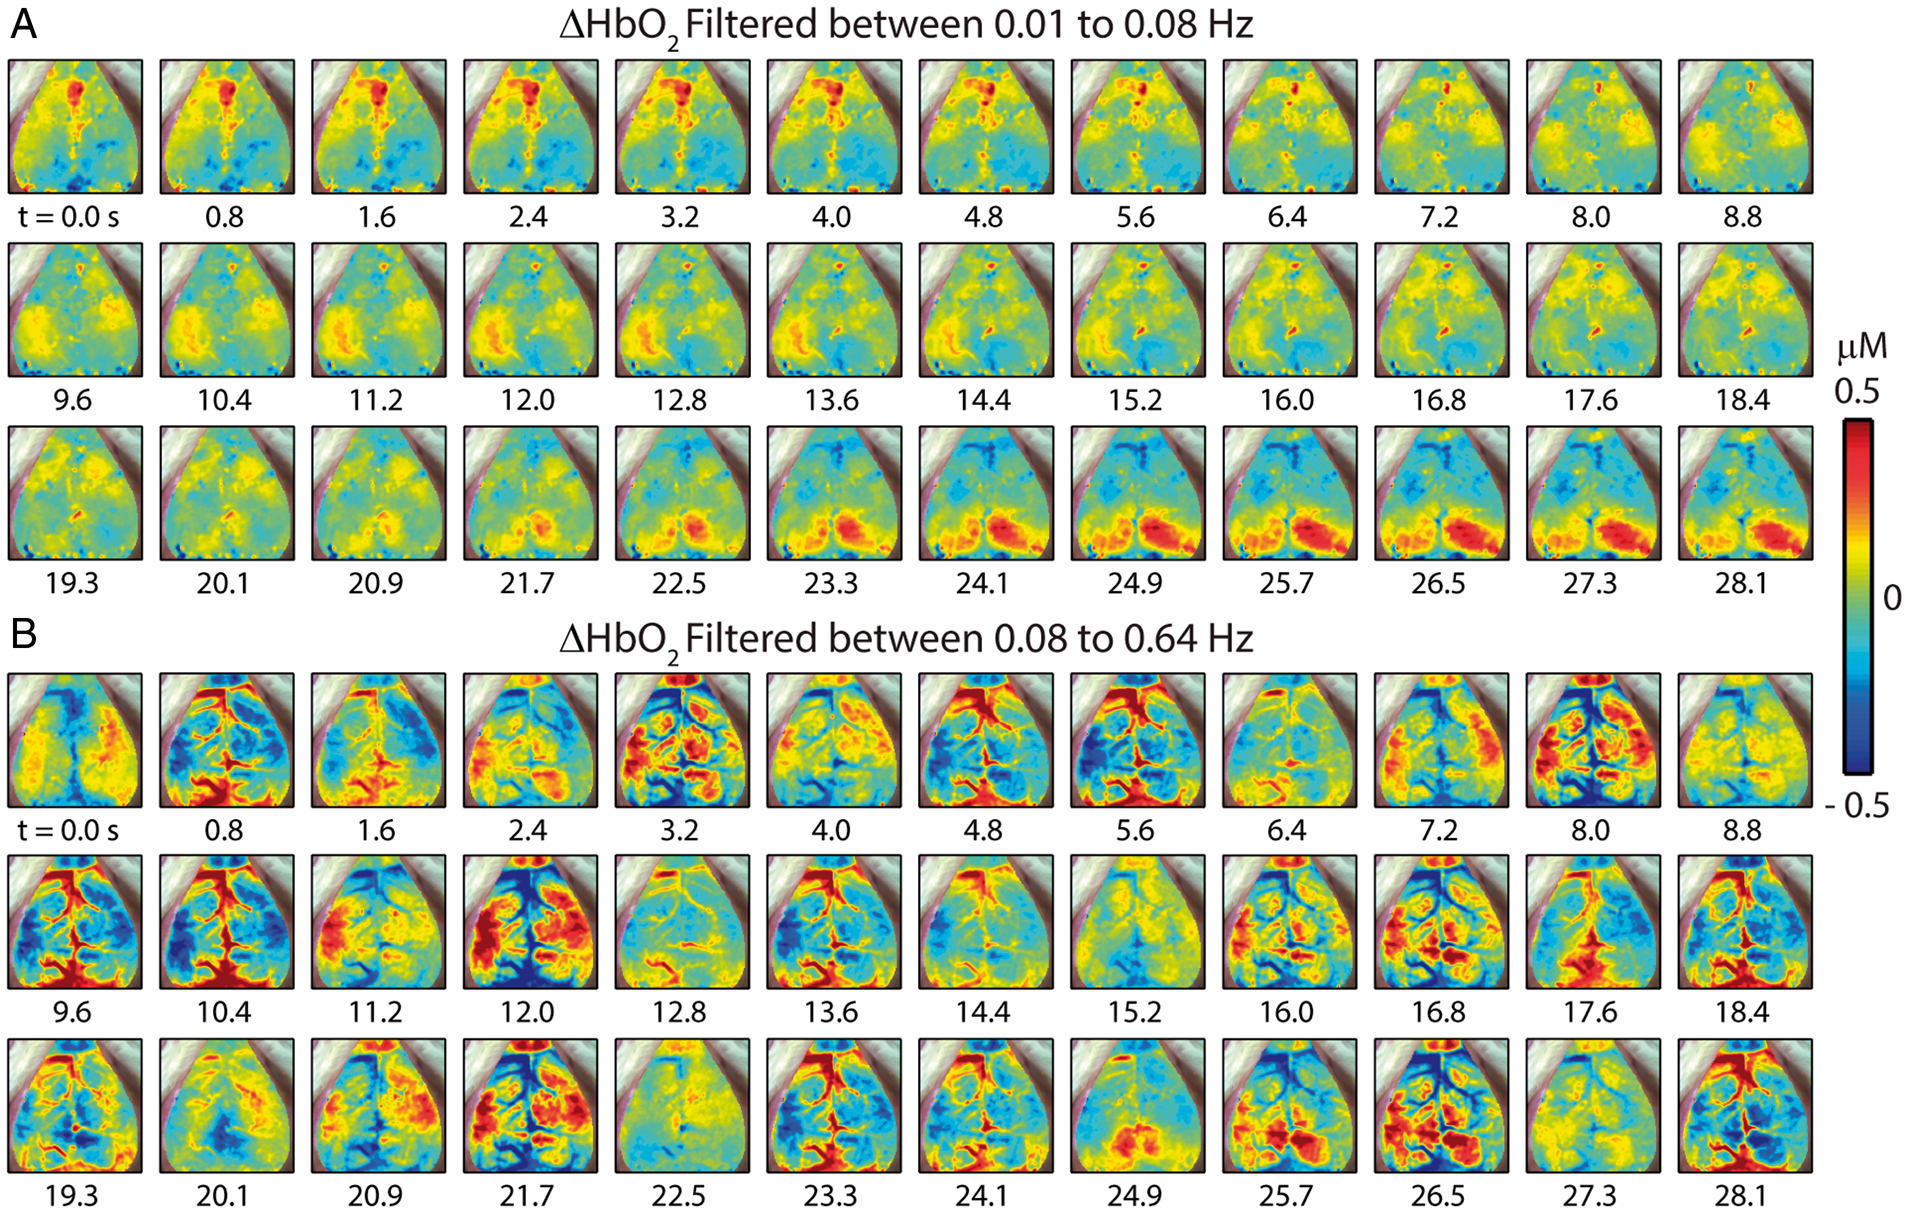
Effects of temporal filtering and global signal regression on correlation maps
We evaluated RSFC within different bandwidths in order to evaluate the effects of HONS and temporal filtering on the topography of functional connectivity patterns. Specifically, ΔHbO2 traces were filtered using nine different bandwidths with equal relative bandwidth ranging from 0.01 to 5.12 Hz (vertical lines in spectra plots of Figure 1C), after which seed-based correlation analysis was used to make RSFC maps (Figure 4).
Robustness of resting-state functional connectivity in the presence of HONS. (A) Correlation maps generated after filtering with nine different bandwidths with equal relative bandwidth ranging from 0.01 to 5.12 Hz for Mouse 1 (no HONS). Scale bar is for the Pearson correlation coefficient. (B) Same as A but for Mouse 2 (moderate HONS). (C) Same as A but for Mouse 3 (strong HONS). For all three mice, high correlations (r ≥ 0.8) were present in spatially confined regions of the cortex when hemodynamic traces were filtered over frequency bands less than the HONS frequency.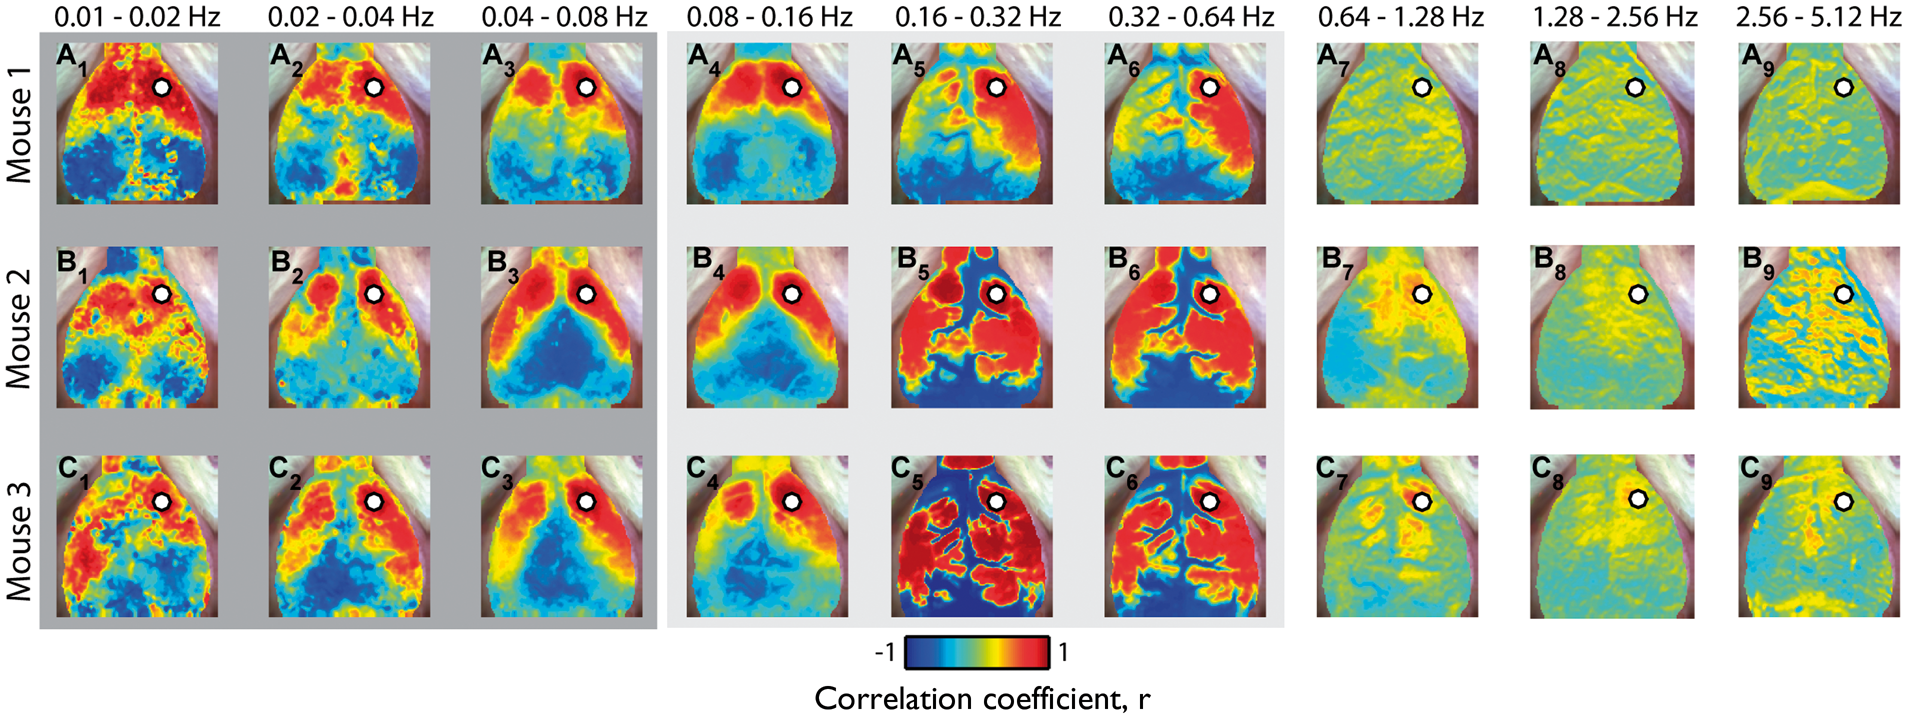
Similar connectivity patterns are observed over frequency bands less than 0.08 Hz, despite the presence of HONS in Mice 2 and 3 (Figure 4, A1–A3, B1–B3, C1–C3). These correlation maps are comparable to those calculated in previous rodent studies, which generally show strong contralateral homotopic connectivity.5,8–10 High correlations (r ≥ 0.8) were present in spatially confined regions of the cortex when hemodynamic traces were filtered between 0.04 and 0.08 Hz. The degree of focal confinement was quantified by calculating the percentage of the cortical FOV) with correlation values above 0.8, where a small value indicates a highly focal pattern (3.7% for Mouse 1, 7.6% for Mouse 2, and 5.0% for Mouse 3).
However, when ΔHbO2 traces were filtered over bands containing HONS, correlation maps differed dramatically across mice. For example, seed-based correlation maps were mostly bimodal between the cerebrum and cerebral vasculature in mice with HONS (correlation maps contain values near +1 or −1, Figure 4, C5–C6). When data were filtered between 0.16 and 0.32 Hz, the correlation values above 0.8 were not focally confined and were present over a large percentage of the cortex in mice with HONS (3.8% for Mouse 1, 19.0% for Mouse 2, and 40.0% for Mouse 3). Correlation maps from higher frequency bands (e.g. >0.64 Hz) did not have well-localized contralateral homotopic regions of high correlation (e.g. Figure 4, A7–A9).
We also investigated the effects of global signal regression on the correlation maps generated for mice with and without HONS using two different global signal estimators: the average global signal and the first principal component (Supplementary Figure 1). Correlation maps were compared across four conditions: (1) no filtering and no regression, (2) filtering in the RSFC bandwidth (0.01–0.08 Hz) and no regression, (3) filtering in the RSFC band followed by global signal regression using the average global signal, and (4) filtering in the RSFC band followed by global signal regression using the first principal component. To visualize the data across the different distributions of correlation coefficients, we displayed the data over two different ranges: (0.7 to 1) and (−1 to 1) (Supplementary Figure 1 and Supplementary Table 1). Both filtering and global signal regression focalized high correlations to specific homotopic regions of the brain.
Quantifying the magnitude of HONS within and across mice
Plotting the height of the peak in the FFT across the four 5-min blocks demonstrates that the presence of HONS varied across mice, as well as within mice (Supplementary Figure 2). To leverage the variability of HONS, all subsequent group analyses were conducted on 5-min blocks.
In order to make comparisons of RSFC in blocks with and without HONS, it was necessary to develop a quantitative metric for the intensity of HONS. There was a total of 76 5-min blocks analyzed (20 min of data for 19 mice). For each 5-min block, the FFT of every ΔHbO2 trace over the mouse cortex was averaged (Figure 5A), representative frequency spectra from Mice 1–3). Two metrics were used for quantifying HONS across all 76 blocks: (1) the ratio of the total power within the HONS band and the total power within the RSFC band and (2) the maximum peak of the averaged spectra within the HONS band. There was a strong correlation (r2 = 0.76, p = 7.40e-25) between the maximum peak in the HONS band and the ratio of the power within the HONS and RSFC bands (Figure 5B). However, the total power in the HONS band was uncorrelated (r2 = 0.05, p = 0.058) with the total power in the RSFC band (Figure 5C). The second metric (maximum peak) was subsequently used to rank the magnitude of HONS in each block in ascending order and produced comparable ranking to the first metric (Figure 5D). The metrics calculated for the three representative mice in Figures 1 to 4 are highlighted for reference. Given the continuous distribution of sorted blocks using peak magnitude, we opted to include three groups of nearly equal sizes (n = 25, n = 25, n = 26) using the maximum peak metric (Figure 5D). The spectral peak location across all blocks with strong HONS (i.e. blocks in group 3) was 0.2 ± 0.01 Hz.
Quantifying and sorting the intensity of HONS in mouse cortex. (A) Averaged FFT for 5-min block of Mouse 1 (A1), Mouse 2 (A2), and Mouse 3 (A3). The peak in the spectrum within the bandwidth 0.08–0.64 Hz is marked. These spectra can be quantified by either measures of the peak magnitude or the ratio of the power in the HONS band (0.08–0.64 Hz) to the canonical RSFC band (0.01–0.08 Hz). The frequency axis is on a log scale, but the labels are linear. (B) Peak in the FFT within the HONS band plotted against the ratio of the power in the HONS band over the power in the RSFC band. The strong correlation indicates that both measures are congruent. (C) The power within the HONS band plotted against the power within the RSFC band. There is weak correlation between the power in these two bands, indicating separation between these two phenomena. (D) Results of sorting the 76 5-min blocks with respect to the peak in the HONS band (also plotted is the power ratio). Values for Mouse 1 are marked in green, Mouse 2 in blue, and Mouse 3 in red. From this sorting, three groups are specified and were used for group analyses.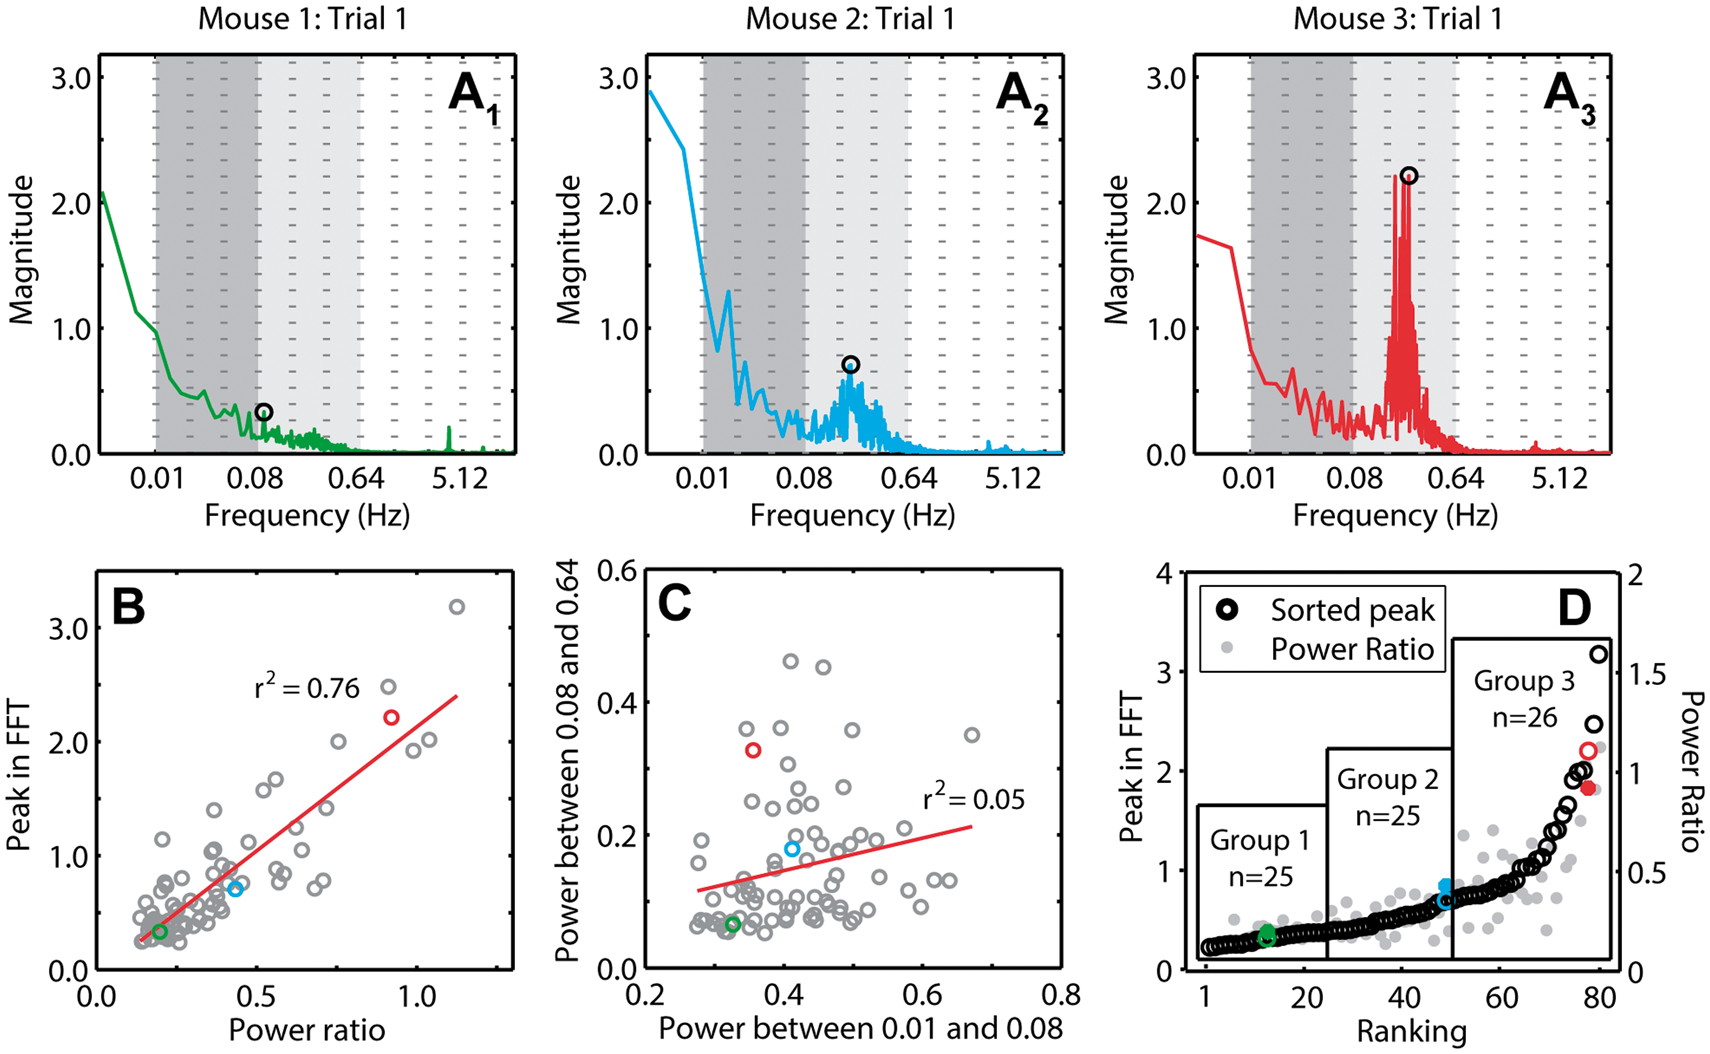
Functional connectivity versus HONS amplitude
To test whether the strength of the HONS signal affected the strength of RSFC, we took advantage of the variability in the magnitude of the HONS signal across the 76 blocks. Hemodynamic signals were filtered in the RSFC band, the average global signal was regressed, and seed-based correlation analysis was conducted. We then plotted contralateral homotopic functional connectivity values against the peak magnitude in the HONS band for all 76 blocks. Functional connectivity patterns for seeds placed in left motor, right retrosplenial, and left visual exhibited variability from one block to another (Figure 6A–C). However, there was no significant correlation between contralateral homotopic functional connectivity and the intensity of HONS for the three seed regions shown (olfactory: r2 = 0.006, somatosensory: r2 = 0.007, retrosplenial: r2 = 0.004, see Figure 6A–C), as well as when averaging across the eight homologous brain regions (r2 = 0.006, Figure 6D). The results for ΔHbR were comparable to ΔHbO2 (Supplementary Figure 3).
Contralateral homotopic connectivity is not strongly correlated with the intensity of HONS. (A) Contralateral homotopic connectivity for olfactory seed measured after filtering ΔHbO2 data within the RSFC band is plotted against the intensity of HONS. Each point corresponds to a single 5-min block. There is weak correlation between the peak in the FFT and contralateral homotopic connectivity. Inset shows white light image with seed region specified. (B) Same as A but for somatosensory cortex. (C) Same as A but for retrosplenial cortex. (D) Average contralateral homotopic connectivity for eight brain regions (frontal, cingulate, motor, somatosensory, retrosplenial, visual, auditory, and olfactory) plotted against the intensity of HONS. R-squared value for linear fit of the data is also displayed. These results show that HONS do not affect the magnitude of correlation values when data are filtered between 0.01 and 0.08 Hz.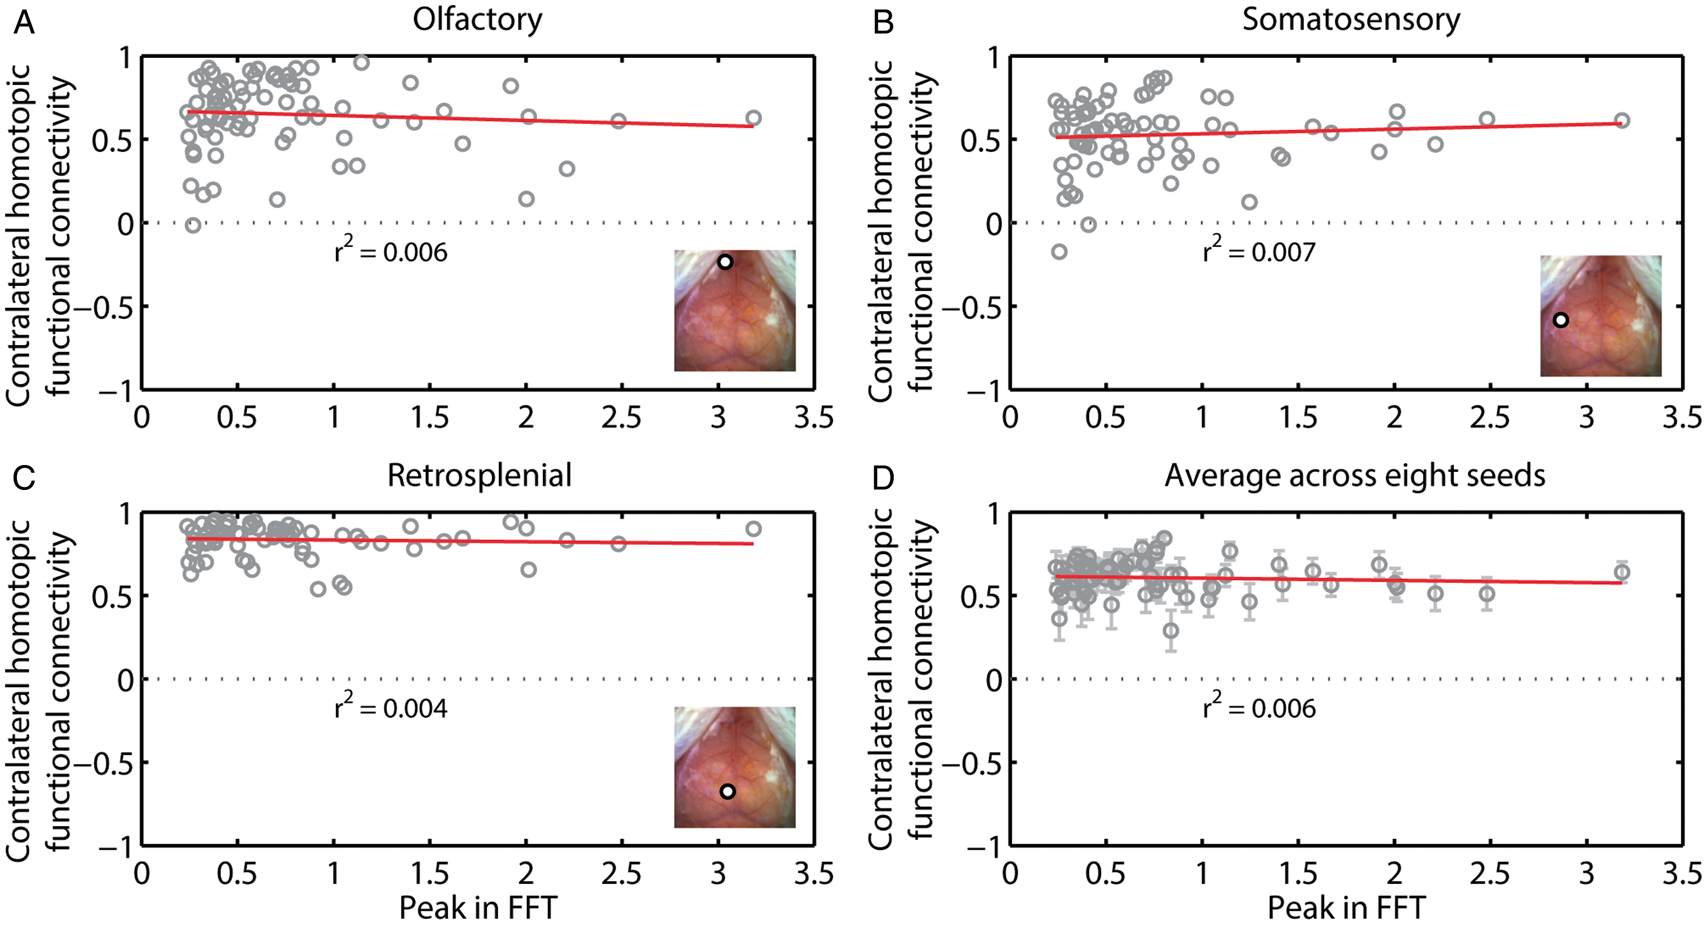
In addition to assessing the dependence of RSFC results on the magnitude of HONS using linear regression, we also conducted group analyses to determine if there was a smaller effect size only detectable after averaging across groups. We used the three groups established after ranking with respect to the peak in the HONS band: little to no detectable HONS (group 1 in Figure 5D), modest HONS (group 2), and strong HONS (group 3). The Pearson correlation coefficient between the 16 seeds was averaged within the three groups and displayed in a correlation matrix (Figure 7A, contralateral homotopic functional connectivity values are indicated with dashed boxes). There was no significant difference in the mean contralateral homotopic functional connectivity values across the three groups (see materials and methods section; Figure 7B and Supplementary Table 2). We then averaged the correlation maps for the eight homologous regions (Figure 7C–E). These maps show that resting-state brain networks identified using seed-based correlation analysis had similar spatial features regardless of the intensity of HONS measured in each group. Results were similar when the analysis was conducted with ΔHbR (Supplementary Figure 4 and Supplementary Table 2).
Functional connectivity brain networks across groups are not affected in mice with HONS. (A) Seed–seed correlation matrices for the three groups indicated in Figure 5. The results were generated after filtering ΔHbO2 data within the RSFC band. Contralateral homotopic functional connectivity values are marked with a white dashed line. (B) Z-scores for contralateral homotopic functional connectivity values for eight seeds for all three groups. There is no statistically significant difference in contralateral homotopic functional connectivity values across the three groups. Multiple comparisons corrected for using Benjamini and Hochberg’s FDR-controlling procedure (α = 0.05). (C) Correlation maps for right olfactory bulb (C1), frontal (C2), cingulate (C3), motor (C4), somatosensory (C5), retrosplenial (C6), visual (C7), and auditory (C8) cortices for blocks in group 1. (D) Same as C but for group 2. (E) Same as C but for group 3.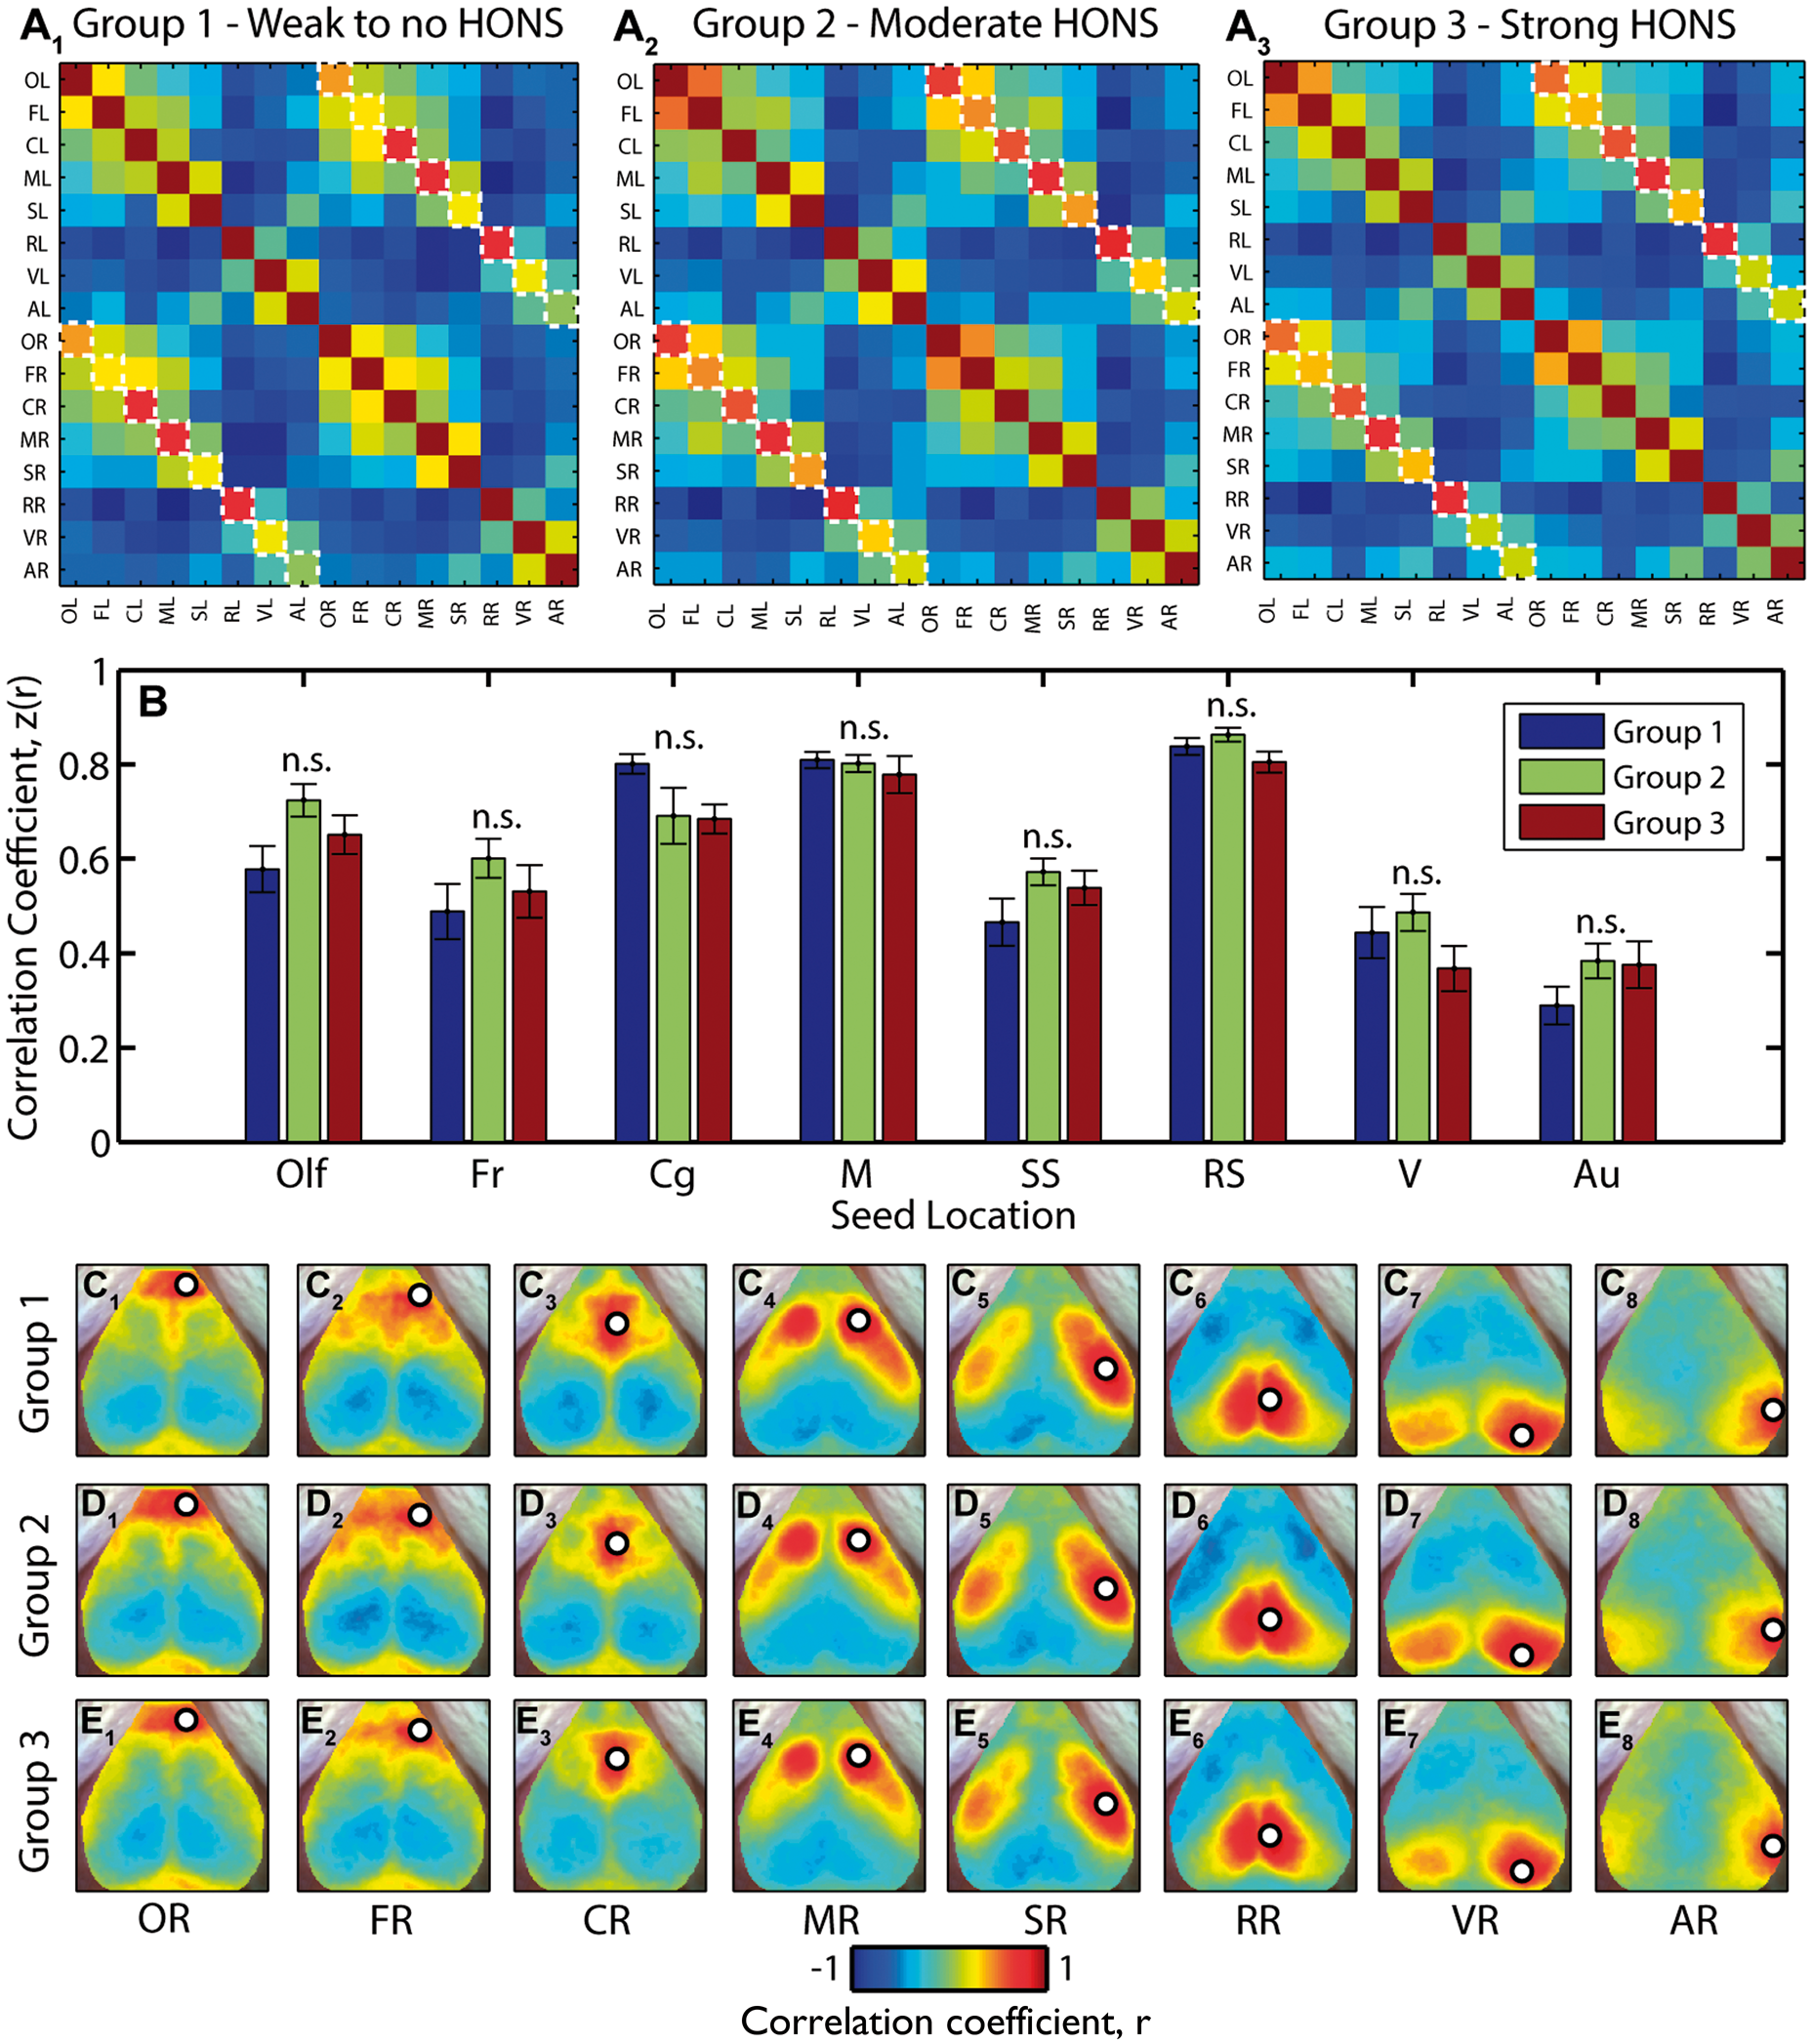
We used our results from the group analysis to better quantify the topography of typical resting-state correlation maps in mice. Seed-based correlation maps averaged from the 25 blocks without HONS were treated as canonical RSFC maps in mice (Figure 7C). The spatial structure of other seed-based correlation maps was then compared to these canonical RSFC maps, and a similarity score was determined by calculating the 2D spatial correlation coefficient between the two images. For example, the canonical motor seed map (Figure 7C4) was compared to the correlation maps produced after filtering ΔHbO2 in nine different bandwidths for the three mice analyzed initially in this report (Figure 4). Correlation maps produced when filtering in frequency bands less than 0.08 Hz had a high spatial similarity to the canonical motor seed map for all three mice (Supplementary Figure 5A–E). When data were filtered in a frequency band containing HONS, the spatial correlation with the canonical motor seed map decreased in the two mice that had HONS. These results are in agreement with the loss of focal correlations measured by calculating the percent of the cortex with high correlation values (Supplementary Figure 5F).
Discussion
While resting-state patterns of functional connectivity have shed light on the functional organization of brain networks in humans, 6 monkeys, 3 and rodents,4,5 the relationship between RSFC and other hemodynamic oscillations like Mayer waves and vasomotion has been rarely discussed in the fMRI literature despite their proximity in frequency. 14 Understanding if patterns of resting-state can be affected by those related to other vascular phenomena will aid in interpreting the etiology of functional connectivity patterns in health and their disruption in disease. In this report, we used OISI to analyze spontaneous hemodynamics in the cerebral cortex of mice and examined the relationship between RSFC and HONS.
RSFC and HONS are different phenomena that can be separated by temporal filtering
The presence of HONS in the cerebral cortex is straightforward to detect in the hemodynamic spectra (Figure 1). Unlike the characteristic 1/f profile exhibited by the spontaneous activity used for RSFC analysis, HONS are reasonably sinusoidal phenomena that consequently have a peak with narrow bandwidth, with the center frequency between 0.1 and 0.4 Hz (Supplementary Figure 6).12,27 Because the magnitude of HONS varied within and across all 19 mice imaged, we were able to evaluate whether the magnitude of the HONS affected the temporal coherence of resting-state brain networks.
In mice with HONS, there still exists a rich, broadband spectrum of synchronous neural activity throughout the brain that can be used to identify functional networks (Figures 4, 6, 7, and Supplementary Figures 3 and 4). These resting-state brain networks were measured by filtering cerebral ΔHbO2 and ΔHbR signals between 0.01 and 0.08 Hz, a bandwidth that excluded potential HONS signals. The topography of these correlation maps is consistent with those measured in other resting-state studies in rodents, regardless of the presence of HONS.5,8–10 Furthermore, the regions of high correlation were well localized, supporting the use of seed-based analysis to map distinctive brain networks when data are filtered in a bandwidth not containing HONS (Supplementary Figure 5). At the level of individual 5-min scans, there was no correlation between the magnitude of HONS and the strength of functional connectivity between homotopic contralateral regions (Figure 6 and Supplementary Figure 3), a canonical metric used in quantifying functional connectivity patterns.2,4,6,28 Finally, no difference in RSFC results between mice with and without HONS were measured after averaging results in larger group sizes (Figure 7 and Supplementary Figure 4).
Therefore, our key finding is experimental confirmation that the HONS we have detected are a different phenomenon than those contributing to RSFC patterns in mice, and that they can be readily characterized and separated by temporal filtering. Though assumed to be true by much of the literature, this provides experimental support that functional connectivity patterns that can recapitulate the functional architecture of the brain have a completely different physiological source than the HONS measured.1,7,29,30
Impact of HONS on RSFC analysis in humans: Avoiding potential confounds
Mayer waves and cerebral vasomotion have been reported in humans, suggesting that HONS may exist in subjects participating in resting-state fMRI studies.19,31 Although Mayer waves are primarily associated with changes in ABP during head tilt, they can still be present when subjects are in the supine position. In one study, approximately 0.1 Hz oscillations were detected in blood pressure measurements in 8 out of 10 healthy human subjects. 32 Cerebral vasomotion was also reported in an awake human subject using both multispectral optical intrinsic signal imaging (MS-OISI) and fMRI. 33 These reports, taken together, highlight the prevalence of HONS in humans.
Our data suggest that HONS (whether defined as Mayer waves or cerebral vasomotion) can be detected and separated from hemodynamic signals used in RSFC analysis. Although vasomotion is typically reported in small vascular networks, it too can be easily filtered out of hemodynamic signals due to its narrow spectral width. Spontaneous fluctuations such as Mayer waves and arterial pulsations have also successfully been eliminated in task-based functional imaging in humans with diffuse optical tomography (DOT) by using other techniques, such as principal component analysis methods and adaptive filtering.34,35 In addition, a near-infrared spectroscopy (NIRS) study demonstrated that a spatially weighted coherence analysis could successfully separate respiration, heart-rate, and arterial pulsation from resting-state data. 15 These studies, as well as our results in mice, provide support that resting-state fluctuations can be separated from HONS in both humans and mice.
RSFC analysis in humans generally assumes that RSFC is characterized by hemodynamics less than 0.08 or 0.1 Hz. 6 Indeed, there exists evidence that this low-pass cut-off frequency is appropriate for measuring RSFC. The correlation coefficient for auditory, visual, and motor seeds in the resting human brain is highest between 0 and 0.1 Hz, and has been reported to decay by more than two-fold for frequencies ranging from 0.1 to 1.1 Hz in resting-state fMRI. 25 Similar results have also been reported in functional connectivity of homologous and frontoposterior seed regions using NIRS. 36 In the absence of HONS, our results also show decreases in regional correlation coefficients as ΔHbO2 was filtered in higher bandwidths (Figure 4A).
However, we also found that in mice with significant HONS, the correlation coefficient calculated for hemodynamics filtered between 0.08 and 0.64 Hz either stayed the same, or increased, and did not reflect the connectivity of resting-brain networks. Instead, high correlation values were calculated for distant brain regions due to the large spatial distribution of the HONS measured (Figure 2 and Supplementary Figure 5). For instance, the correlation coefficient between left and right motor seeds of Mouse 2 was high (r = 0.9) when ΔHbO2 traces were filtered between 0.16 and 0.32 Hz (Figure 4B5). This finding could lead to severe misinterpretation of RSFC results for subjects that have significant HONS if the frequency band used for RSFC analysis overlaps with the HONS frequencies.
Another growing technique in RSFC that could be affected by HONS is coherence mapping. In contrast to time correlation, coherence maps are computed by evaluating how correlated the spectral content of hemodynamic signals are across a particular frequency band. 37 This approach has enabled the identification of brain networks that could not be identified using temporal correlations. 38 However, coherence studies do not often report the presence or absence of HONS in the frequency bands analyzed, and can therefore be confounded when the analysis is extended to higher frequencies ranges in which HONS are potentially present.
Global signal regression
Global signal correction is a common processing step in RSFC analysis and has been shown to remove sources of physiological noise, such as vasomotion and Mayer waves.6,15,34 In this report, we demonstrated that temporal filtering can successfully remove HONS from hemodynamic fluctuations used in RSFC analysis. Because global signal regression with the average global signal is implemented in the majority of RSFC studies, we chose to include it in our processing stream so that (1) we increased the spatial detail and sensitivity of our seed-based correlation maps and (2) our discussion on human fMRI studies were more relatable. For comparison, we also processed the data without global signal regression (Supplementary Figure 1). We demonstrated that the crucial processing step in eliminating HONS from our data was temporal filtering; however, the spatial specificity of the resting-state maps reported here are improved by regressing out the average global signal as expected (Supplementary Figure 1 and Supplementary Table 1).
We found similar results when using the first principal component as a global signal estimator. The correlation maps calculated for Mouse 1 show extended anticorrelations when the average global signal was used for regression in comparison to the first principal component. This is in agreement with the spurious anticorrelations predicted by using the average global signal in global signal regression; however, the differences between these correlation maps did not alter the primary findings of the study (spatial correlation coefficient was 0.991 for Mouse 1 and 0.997 for Mouse 3; see Supplementary Table 1). 26 In general, the spatial correlation between seed-based correlation maps produced with these two different global signal estimators was high (r = 0.95 ± 0.0077; n = 19 mice × 4 blocks × 2 contrasts = 152), and the first principal component and the average global signal were also highly correlated (r = 0.99 ± 0.00018; n = 152). We therefore focused on use of the average global signal for regression in our analysis, which is the most commonly used global signal estimator in fMRI studies.
The classification and variability of HONS
The classification of HONS as vasomotion or Mayer waves in the cortex is difficult, especially without imaging over a large FOV. Many in vivo vasomotion studies have been conducted with point measurements made with optical probes and laser-Doppler flowmetry16,18 or microscopes with small FOV. 17 An advantage of using laser-Doppler flowmetry or optical fibers for investigating HONS is their capability of measuring both superficial cortex and deeper brain structures. However, single measurements and small FOV microscopy make it difficult to determine the spatial distribution of 0.1 Hz oscillations over large regions of the body, which has been suggested to be a primary distinction between vasomotion and Mayer waves. 13 NIRS, MS-OISI, and DOT measure ΔHbO2 and ΔHbR over large FOVs, and therefore are more suitable for making this distinction.32,33,35
Our OISI system also images a relatively large FOV (approximately 1 cm2). We therefore were able to determine that the HONS measured were spatially distributed over a large region of the mouse brain (Figure 1E), a hallmark of Mayer waves according to reviews in physiology. 12 Given this finding, the HONS with center frequency around 0.2 Hz identified in this study are best characterized as Mayer waves. Reports have shown that the center frequency of the Mayer waves oscillation generally increases for smaller species (for awake subjects: 0.1 Hz for humans, 0.3 Hz for rabbits, and 0.4 Hz for rats). However, studies in rabbits have shown slower Mayer waves under anesthesia (0.1–0.15 Hz) than when awake. 12 Thus, the 0.2 Hz center frequencies seen in this study of mice under anesthesia are in general agreement with previous reports.
A more thorough distinction between cerebral vasomotion and Mayer waves in this report is elusive. Our imaging was performed through the skull, precluding direct imaging of small pial vessels. Furthermore, the hemodynamic measurements in regions corresponding with large blood vessels, likely draining veins, were correlated with the HONS measured over the entire cortex (Figure 1, B3, C3, and E3). Classification of HONS and their relation to neural oscillations could be improved by measuring additional physiological parameters such as electrophysiology, ABP, calcium dynamics, and blood flow. 32
Another interesting aspect of our results was the variability in magnitude of the HONS in mice. As we have shown, the presence of HONS in the cortex varied drastically across and within mice (Figure 5 and Supplementary Figure 2). From our data, we found no correlate within the RSFC band of the presence or magnitude of HONS (Figure 5C). This uncertainty about the physiological cause and magnitude of HONS is in accordance with the existing literature on Mayer waves and vasomotion.11,18,33 A plausible explanation for the variance of HONS in this study is the competing effects that ketamine and xylazine have on sympathetic nervous system activity and blood pressure. 10 Although the administration of anesthesia was consistent across mice, the level of sedation during imaging was variable due to the IP delivery mechanism. The magnitude of Mayer waves, which are coupled with sympathetic nervous system activity, could be explained by the variance in the anesthesia. 12
Our ability to measure resting-state brain networks in mice anesthetized with ketamine/xylazine is also consistent with previous studies in mice and rats.5,8,10 The spatial symmetry of resting-state brain networks has been shown to be similar regardless of whether ketamine/xylazine or isoflurane are administered, providing support that intrinsic functional brain structure measured through RSFC analysis exists and is consistent across different anesthesia. 10 However, differences in the topography of resting-state brain networks in awake and anesthetized rodents have not been well studied. The development of in-vivo imaging in awake mice provides a promising technology for studying the dependence of HONS on different anesthetics, as well as the effects of anesthesia on RSFC. 39
Conclusion
Our results show differences in the spatiotemporal and spectral characteristics of HONS and hemodynamics used in RSFC analysis. Despite the proximity in frequency of these phenomena, they can easily be separated by applying appropriate temporal filters. We also demonstrated that the presence of HONS can confound conclusions drawn from RSFC analysis if they are not separated. Fortunately, the HONS frequency band is most often accessible to both fMRI and optical imaging methods. Therefore, a good practice in RSFC analysis is thorough examination of the hemodynamic (measured with OISI) or blood oxygen level-dependent signal (measured with fMRI) frequency spectrum for the possible presence of vasomotion and/or Mayer waves.
Footnotes
Funding
The author(s) disclosed receipt of the following financial support for the research, authorship, and/or publication of this article: This study was supported by the National Institutes of Health (R01NS078223 (JPC), R01NS090874 (JPC), P01NS080675 (JPC), R01NS084028 (JPC), and K25NS083754 (AQB)), the Bill & Melinda Gates Foundation (OPP1033518 (JPC)), and Washington University’s Imaging Science Pathway (JRB and PWW).
Acknowledgements
The authors would like to thank Dr. Ben Palanca, Dr. Abraham Z. Snyder, and Dr. Beau M. Ances for fruitful discussion.
Declaration of conflicting interests
The author(s) declared no potential conflicts of interest with respect to the research, authorship, and/or publication of this article.
Authors’ contributions
JPC designed the research and wrote the manuscript. JRB analyzed the data and wrote the manuscript. AQB collected the data, analyzed the data, and wrote the manuscript. PWW collected the data.
References
Supplementary Material
Please find the following supplemental material available below.
For Open Access articles published under a Creative Commons License, all supplemental material carries the same license as the article it is associated with.
For non-Open Access articles published, all supplemental material carries a non-exclusive license, and permission requests for re-use of supplemental material or any part of supplemental material shall be sent directly to the copyright owner as specified in the copyright notice associated with the article.