
Abstract
In this study, cerebral blood flow, oxygenation, metabolic, and electrical functional responses to forepaw stimulation were monitored in rats at different levels of global cerebral ischemia from mild to severe. Laser speckle contrast imaging and optical imaging of intrinsic signals were used to measure changes in blood flow and oxygenation, respectively, along with a compartmental model to calculate changes in oxygen metabolism from these measured changes. To characterize the electrical response to functional stimulation, we measured somatosensory evoked potentials (SEPs). Global graded ischemia was induced through unilateral carotid artery occlusion, bilateral carotid artery occlusion, bilateral carotid and right subclavian artery (SCA) occlusion, or carotid and SCA occlusion with negative lower body pressure. We found that the amplitude of the functional metabolic response remained tightly coupled to the amplitude of the SEP at all levels of ischemia observed. However, as the level of ischemia became more severe, the flow response was more strongly attenuated than the electrical response, suggesting that global ischemia was associated with an uncoupling between the functional flow and electrical responses.
Keywords
INTRODUCTION
In healthy brains, localized increases in neuronal activity are strongly correlated, both spatially and temporally, with localized increases in cerebral blood flow (CBF) and cerebral metabolic consumption of oxygen (CMRO2). 1 Thus, quantification of hemodynamics because of increased neuronal activity, i.e., neurovascular coupling, has long been a topic of intense interest. In addition to being critical for the interpretation of techniques such as functional magnetic resonance imaging that use hemodynamic responses to map brain function, neurovascular coupling also has a role in several diseases, including Alzheimer's disease 2 and cerebral ischemia. 3 In this study, the effects of global cerebral ischemia on neurovascular coupling in a rat animal model are investigated.
Specifically, functional CBF, CMRO2, oxy-hemoglobin concentration (HbO), deoxy-hemoglobin concentration (HbR), and total hemoglobin concentration (HbT) responses to forepaw stimulation on rats were measured at several levels of global ischemia from very mild (CBF ~90% of normal supply) to more severe (CBF ~40% of normal supply). The combined optical techniques of laser speckle contrast imaging4,5 and optical imaging of intrinsic signals6,7 were used to make these measurements. To characterize neuronal activity, the electrical somatosensory evoked potentials (SEP) were also collected simultaneously with the optical hemodynamic measurements. To our knowledge, this is the first study that examines functional activation during graded ischemia.
This study is also motivated by the notion that functional stimulation can be used as a treatment for stroke.8,9 Fox and Raichle 10 first reported that localized CBF increases caused by functional stimulation vastly exceed the localized CMRO2 increases in healthy humans. This observation suggests that the oxygen delivery increase to the tissue from functional stimulation exceeds the oxygen consumption increase. 11 If the mismatch between the CBF response (surrogate for oxygen delivery) and CMRO2 response persists during ischemia, then repeated application of functional stimulation during ischemia could increase the base level of oxygen in the brain.
For more significant ischemia (e.g., CBF supply below 40% of normal levels), no hemodynamic response to functional stimulation was observed. For less severe ischemic tissue, however, both hemodynamic and electrical responses to stimulation were present. In this paper, we will show that at these ischemic levels, CMRO2 and SEP functional responses remained tightly coupled. Importantly, we discovered that as the animals became ischemic, the CBF response was more strongly attenuated than the CMRO2 response. This observation suggests that, at least in
MATERIALS AND METHODS
Surgical Preparation
All procedures were in accordance with guidelines established by the National Institutes of Health and approved by the Institutional Animal Care and Use Committee of the University of Pennsylvania (approval #801100). Adult male Sprague-Dawley rats (
(
To induce global ischemia, animals were held in a supine position while a midline neck incision was made. Both common carotid arteries (CCA) were isolated from the surrounding connective tissue, and loose snares made from a polyethylene catheter (PE-10, Clay Adams, Parsippany, NJ, USA) were carefully placed around them for later remote occlusion. To achieve more severe ischemia, a partial sternotomy was also performed in the last 39 animals in the study. After separating sterno-hyoid muscle, the bifurcation of the right CCA and the right subclavian artery (SCA) from the aorta was carefully dissected and exposed. A snare was then placed around the right SCA between the first and second bifurcation of the right SCA. Finally, to even further increase the degree of ischemia, the lower bodies of the last 17 animals in the study were placed inside a custom-made pressure chamber after the snares were in position. The pressure chamber applied negative pressure to the rats, causing blood to pool in the lower part of the body. 13 The snares were tightened and negative pressure was applied sequentially to create different levels of cerebral ischemia from mild to severe.
For functional stimulation, two needle electrodes were inserted subdermally in the left forepaw of each rat, contra-lateral to the translucent imaging window. After the surgical preparation, α-chloralose (60 mg/kg) was administered intravenously and the isoflurane was discontinued. Nitrous oxide was also discontinued and replaced with nitrogen gas. Anesthesia was maintained with an intravenous infusion of α-chloralose (30 mg/kg per hour). On completion of the study, animals were euthanized with an overdose of barbiturate.
A control group (
Experiment Protocol
Figure 2 is a timeline of the study. As described above, the aim of the experiment was to create different levels of global ischemia and to measure the hemodynamic and electrical responses to forepaw stimulation. We generated different levels of ischemia by right common carotid artery occlusion (RCCAO), bilateral common carotid artery occlusion (RCCAO + LCCAO), bilateral common carotid artery occlusion with right SCA occlusion (RCCAO + LCCAO + RSCAO), and three vessel occlusion with lower body negative pressure applied in a pressure chamber. After inducing each condition of ischemia, we waited 5 minutes to allow flow to stabilize before starting functional stimulation. The control group of animals shared the same timeline except that we did not occlude any arteries or apply lower body negative pressure. After euthanizing the animals, laser speckle images were collected for 5 minutes to obtain a biological zero correction to the CBF measurements. 14
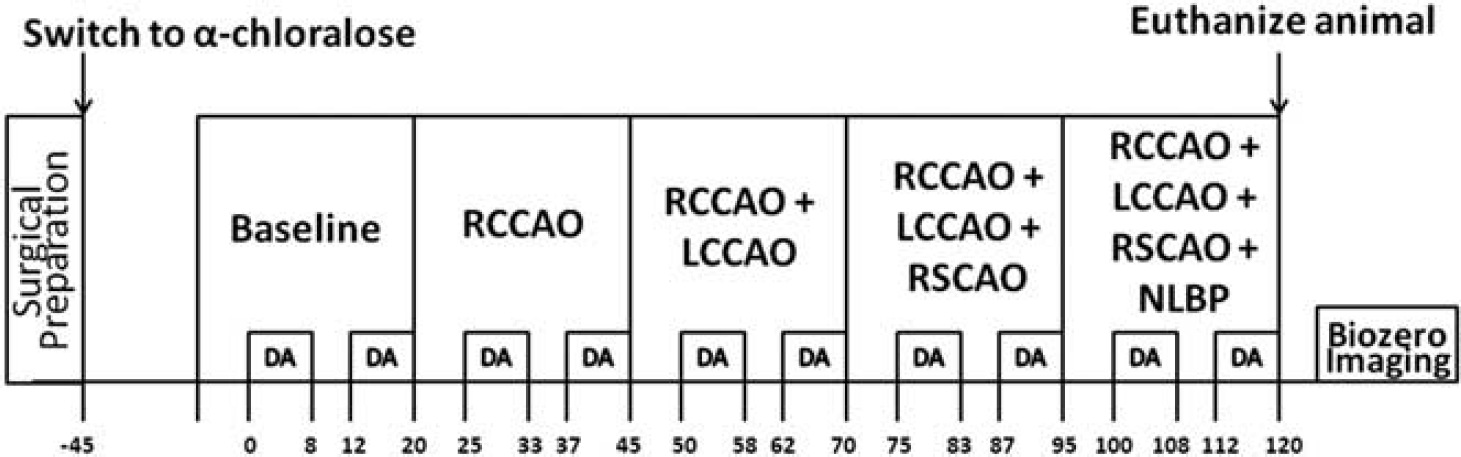
Schematic showing the timeline of the study in minutes (time axis not to scale). DA stands for data acquisition, where we collected laser speckle and spectral images and applied forepaw stimulation trains (1.5 mA, 0.3 ms rectangular pulses delivered at 3 Hz for 4 seconds) every 30 seconds as described in the text. The top row of boxes indicates the cerebral blood flow (CBF) conditions, which are baseline (i.e., preischemic), right common carotid artery occlusion (RCCAO), right and left common carotid artery occlusion (RCCAO + LCCAO), right and left common carotid artery occlusion with right subclavian artery occlusion (RCCAO + LCCAO + RSCAO), and the occlusion of the previous three arteries with the application of negative lower body pressure (NLBP).
The forepaw stimulation paradigm, which was executed during the time windows marked DA (i.e., data acquisition) in Figure 2, consisted of a train of constant current rectangular pulses (amplitude 1.5 mA, duration 300 μs) delivered to the forepaw at 3 Hz for 4 seconds by a commercial high voltage stimulus isolator (A360; World Precision Instruments). The stimulation train was repeated every 30 seconds for a total time period of 8 minutes. After letting the animal rest for 4 minutes with no stimulation, the stimulation trains were resumed every 30 seconds for another 8 minutes. During these 8 minute periods, laser speckle and spectral images were collected sequentially for hemodynamic imaging, and electrical SEPs were recorded. This stimulation paradigm was repeated for every level of ischemia, as indicated in Figure 2. Five minutes before the first data acquisition, blood was withdrawn from the femoral artery for blood gas analysis.
Optical Instrument
To obtain images of changes in blood flow and oxygenation, the techniques of laser speckle contrast imaging and optical imaging of intrinsic signals were combined.
6
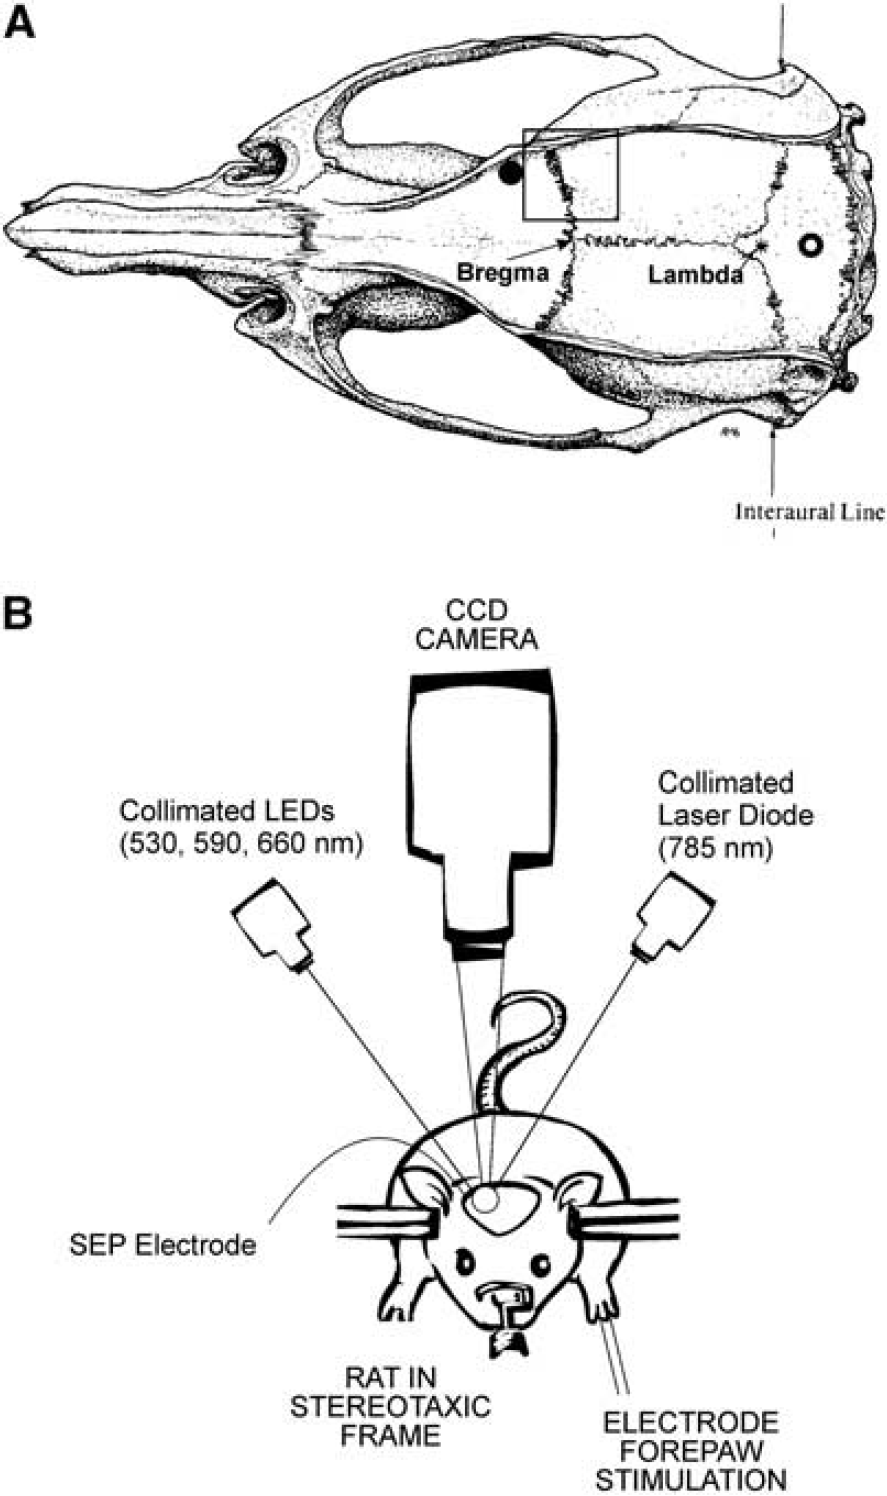
As depicted in Figure 1B, a 60-mm lens (Apo-Componon 2.8/40; Schneider-Kreuznach, Bad Kreuznach, Germany) was used to form an image of the 5-by-5 mm forepaw region of the cerebral cortex on a 12-bit TEC cooled CCD camera (UP-680CL-12B, Uniq Vision Inc., Santa Clara, CA, USA) with unity magnification. Interleaved images (exposure time
The illumination source used for laser speckle contrast imaging of CBF was a collimated 785 nm laser diode (Sanyo, DL7140-201S, 785 nm, 70 mW; Thorlabs, Newton, NJ, USA) mounted on a temperature-controlled heat sink (LDM21 Laser Diode Temperature Controlled Mount; Thorlabs) and driven by a commercial driver (LDC 500 Laser Diode Controller; Thorlabs). The illumination sources used for optical imaging of intrinsic signals to measure changes in HbO and HbR were three collimated light emitting diodes (LEDs) mounted on heat sinks with central wavelengths of 530, 590, and 660 nm (M530L2-C1, M590L2-C1, M660L2-C1; Thorlabs) driven by commercial drivers (LEDD1B T-Cube LED Driver; Thorlabs).
Commercial software (SciWorks; DataWave Technologies, Boulder, CO, USA) was used to program pulse sequences of digital outputs from an A/D board (DataWave Technologies) to control the timing for the interleaved imaging. With this instrument, we acquired three spectral images and four speckle images per second.
Somatosensory Evoked Potential Recordings
To measure the SEP response to stimulation, a 1-mm diameter silver/sliver chloride ball electrode and a reference silver screw electrode were placed on the dura in the burr holes indicated by the filled and open black circles in Figure 1A, respectively. The recording electrodes were connected to a low-impedance HS4 headstage (World Precision Instruments), which amplified and digitized the voltage difference between the two electrodes before sending the signal to a Digital BioAmp (DB4; World Precision Instruments), where the signal was further amplified and filtered between 5 and 500 Hz.
Optical Image Analysis
Laser speckle contrast imaging of CBF has been discussed extensively in previous publications,
4
and the specific analysis used in this study to calculate CBF from speckle contrast images is described by Zhou
Optical imaging of intrinsic signals (or spectral imaging) to determine HbO and HbR is also a well-established technique.17,18 As with CBF, the intensity images of each LED were averaged across stimulation trials at each level of ischemia. The averaged spectral intensity images of the three LEDs were converted to images of HbO and HbR via a modified Beer–Lambert law (see Appendix).
We used a compartmental model to calculate CMRO2 images from our measurements of CBF, HbO, and HbR:
19
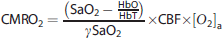
Equation 1 is a steady-state model for CMRO2. To estimate the errors in this model when applying it to the dynamic situation of functional stimulation, we followed Vazquez's
Under the assumptions that SaO2, [
Quantifying Hemodynamic and Somatosensory Evoked Potential Responses to Stimulation
Figures 3A and 3B contain montages of fractional CBF and CMRO2 responses to stimulation for an exemplar animal averaged across all trials during the CBF baseline period of Figure 2. To quantify the hemodynamic responses of CBF and CMRO2, as well as the hemoglobin concentrations HbO, HbR, and HbT (image montages not shown), we followed the same approach as Durduran
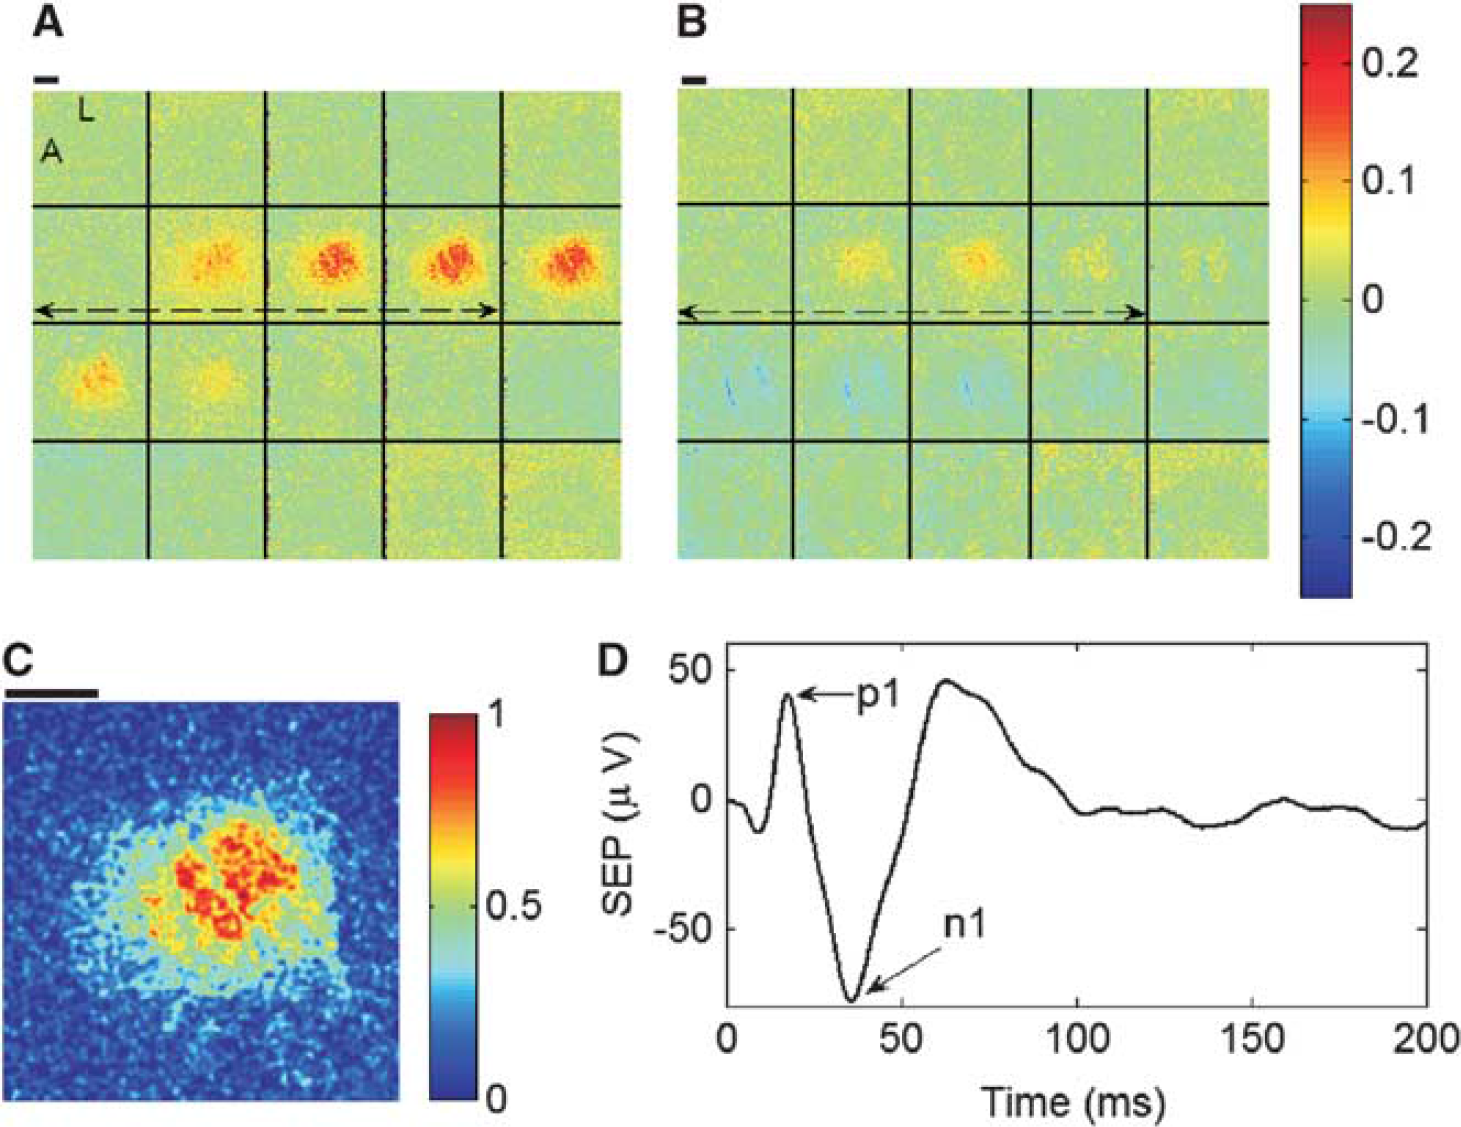
Image montages of fractional changes in cerebral blood flow (CBF) (
At ischemic condition 

Statistical Analysis
Across animals, the degree of ischemia attained after each of the manipulations was quite heterogeneous. Thus, although blood flow was decreased only through three artery occlusions and negative lower body pressure, many different CBF levels ranging from very mild ischemia (i.e., 0.94) to severe ischemia (i.e., 0.36) were achieved in the animals. A major goal of this study was to determine whether there were differences in the mean CBF, CMRO2, and SEP normalized functional responses (Equations 2a and 2b) as a function of CBF level (Equation 3). To address this, a mixed effects model was used. 23 This procedure is conceptually similar to repeated measures ANOVA but allows the CBF level to be treated as a continuous variable. Initial graphical procedures suggested that in many cases the association between CBF level and the normalized functional responses was nonlinear. Thus, a natural cubic spline was used to model the mean CBF, CMRO2, and SEP normalized functional responses separately at each CBF level.
We additionally fit two natural cubic spline models to these three types of normalized responses (i.e., CBF, CMRO2, and SEP) simultaneously to determine the statistical significance of the differences in patterns over CBF level that we observed between these different types of responses. In one model, these differences were allowed to follow a parallel, albeit nonlinear pattern over CBF level. In the second model, the response types were allowed to change differently over CBF level. We applied a likelihood ratio test to these two models to test the null hypothesis that the three functional response types are all affected the same by CBF level. We also determined the significance of the differences between the SEP response and the other two response types by considering the Wald statistics for each of the terms in the spline of the second model. We then repeated this analysis to compare SEP responses with the HbO, HbR, and HbT responses as a function of CBF level.
The analysis described above addresses the global question of whether there were differences in the mean CBF, CMRO2, HbO, HbR, HbT, and SEP responses as a function of CBF level. Another important question is if there are differences, then what are the ranges of CBF levels where these responses are different. To address this, we used individual mixed effects models with a natural cubic spline to model the mean logarithms of the ratios of SEP response with the hemodynamic responses (i.e., log(SEP/CBF), log(SEP/HbO), and log(SEP/HbR)) as a function of CBF level. The hemodynamic responses were significantly different from SEP at CBF levels where the 95% CIs from these models did not overlap zero.
Finally, we used a mixed effects model to test the hypothesis that SEP latency increased with CBF level. As with the normalized responses, a natural cubic spline was used to model the mean SEP latency as a function of CBF level, and the overall significance was assessed using a likelihood ratio test.
These mixed effects models were implemented with library (nlme) and library (splines) in R 2.13. 24 A Type I error rate of 0.05 and 95% confidence intervals on the population mean (95% CI) were used.
RESULTS
Before ischemia, the population means and standard deviations of pH, PaO2, and Pa
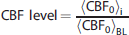
Figure 4 shows average fractional hemodynamic temporal response curves across animals at each binned CBF level of ischemia. Before ischemia (CBF Level 1 panel in Figure 4), CBF has the largest response of the hemodynamic parameters, with an average peak increase of 21%, while CMRO2 peaked at 12%. HbO and HbR peaked at 8% and −8%, respectively, while a small 2% peak increase in HbT was observed. All the hemodynamic functional responses were attenuated as the animals became more ischemic, and once the CBF level reached 0.4, the responses essentially disappeared. Also, notice in Figure 4 that the peaks of the CBF and CMRO2 responses approach each other as the level of ischemia increases, indicating that global ischemia more strongly attenuates the CBF response.
The average fractional responses of cerebral blood flow (CBF), cerebral metabolic consumption of oxygen (CMRO2), cerebral oxy-hemoglobin (HbO), cerebral deoxy-hemoglobin (HbR), and cerebral total hemoglobin (HbT) measured at various CBF levels (see Equation 3) within the specified bins. The CBF bins are labeled by their central numbers (e.g., CBF Level 0.8 spans the range of CBF levels from 0.75 to 0.85), and the CBF Level 1 indicates the preischemic responses. Here, the CBF bin 0.9 is omitted since the temporal plots look very similar to the preischemic responses. The error bars indicate the standard errors of these averages, and the 4-second forepaw stimulus is indicated in the panels by a thick black line (omitted from CBF Level 1 panel for readability).
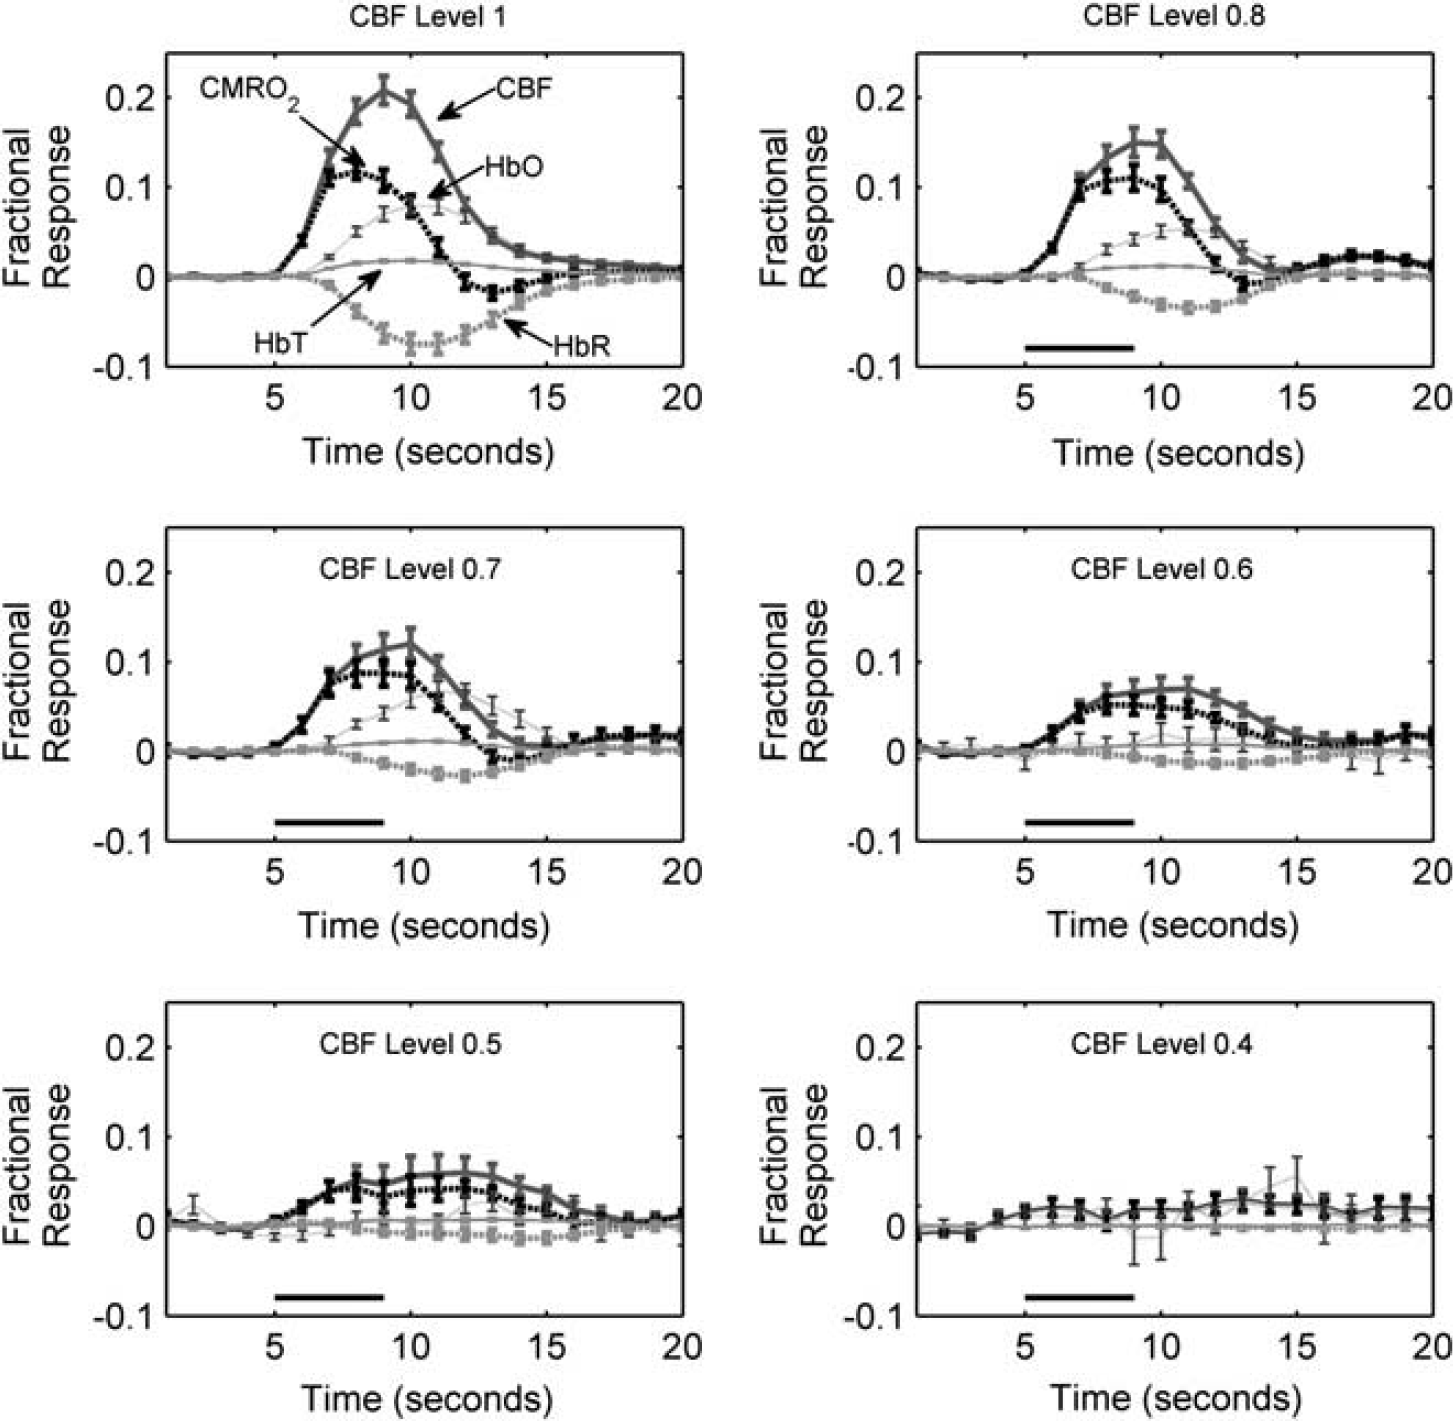
Corresponding to the average hemodynamic responses in Figure 4 are the average electrical SEP responses shown in Figure 5. As with the hemodynamic responses, the SEP response is attenuated as the level of ischemia increases. However, the SEP response has not vanished at the CBF level of 0.4, whereas the blood flow response is very much attenuated. Additionally, Figure 5 contains the mean SEP latency at each binned CBF level. The observed increase in SEP latency with ischemia relative to the preischemic latency is highly significant (
The average somatosensory evoked potential (SEP) across animals at each cerebral blood flow (CBF) level bin. As in Figure 4, the CBF level bins are specified by their central numbers. The error bars indicate the standard errors of these averages, and the time zero here corresponds to the arrival of a stimulation pulse. The boxes in each panel contain the SEP latencies (mean ± standard error) in milliseconds at each CBF level. The latency is the time from stimulus to the p1 peak. SEP latencies are significantly associated with CBF level (
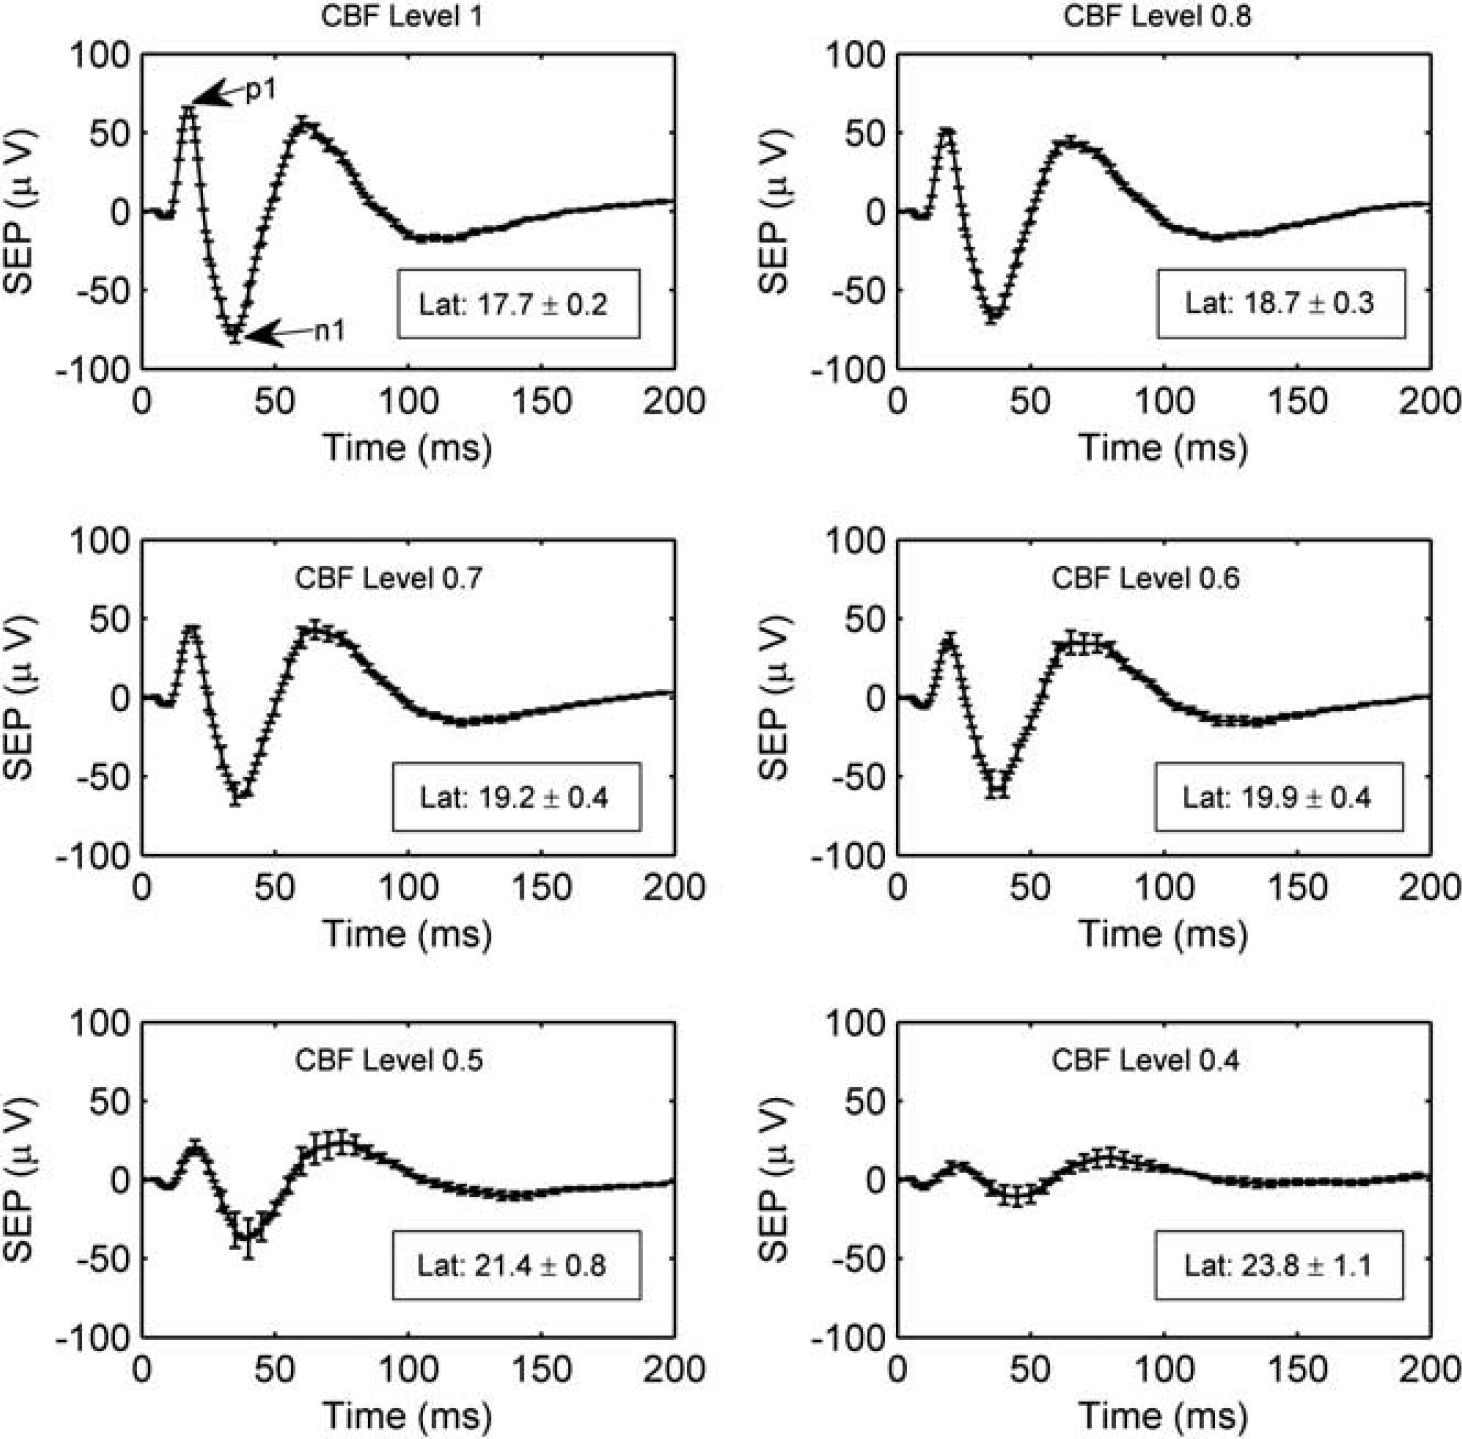
Interestingly, the CBF response is attenuated more strongly at milder levels of global ischemia than the CMRO2 and SEP responses (Figures 6 and 7). Figure 6 is a bar plot showing the mean normalized hemodynamic and SEP responses, as defined by Equations 2a and 2b, at each CBF level bin. Figure 6A suggests that the CMRO2 response is tightly coupled to SEP as the animals become more ischemic, whereas the CBF response exhibits a greater attenuation than does SEP. This behavior is confirmed in Figure 7, where instead of discretizing the data into bins, a mixed effects model was used to model averages of CBF, CMRO2, and SEP responses at each CBF level. This analysis shows strong evidence of differences among these three response types over the CBF level (
Average normalized peak hemodynamic and somatosensory evoked potential (SEP) responses (Equations 2a and 2b) across animals at the binned cerebral blood flow (CBF) levels of ischemia (Equation 3) specified on the horizontal axis. As in Figures 4 and 5, the levels of ischemia are discretized into bins with widths of 10 percentage points, such that a CBF level of 0.9 corresponds to the range of CBF levels between 0.85 and 0.95, a CBF level of 0.8 corresponds to the range of CBF levels between 0.75 and 0.85, etc. (
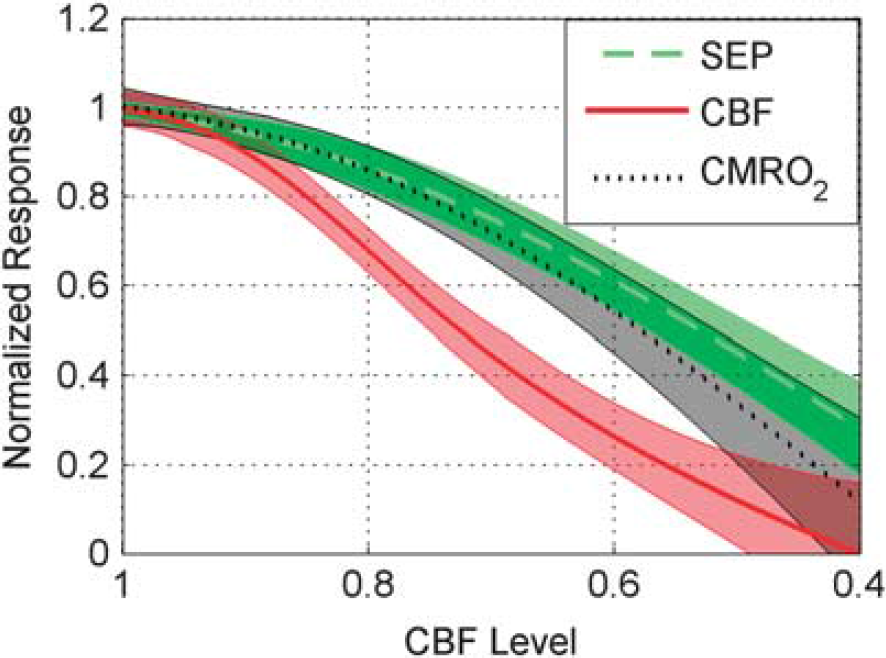
Mean normalized response (Equations 2a and 2b) across animals (thick lines) of somatosensory evoked potential (SEP), cerebral blood flow (CBF), and cerebral metabolic consumption of oxygen (CMRO2) as a function of CBF level (Equation 3). Mean values shown are based on individual mixed effects models (see Statistical analysis) along with their 95% confidence intervals (shaded regions). CBF differed from SEP (
We took the logarithms of the ratios of the SEP response with the three hemodynamic responses (CBF, HbO, and HbR) that differed from SEP over CBF level, and applied individual mixed effects models to them to determine the range of CBF levels where their means are different from zero (
We also note here that in the control group of animals, where no occlusions were made or negative pressure applied, the average normalized hemodynamic and SEP responses across animals did not significantly change (i.e., fluctuations <5%) over the 2-hour time course of data collection (data not shown).
DISCUSSION
Fox and Raichle
10
first reported that for healthy humans, the localized CBF increases caused by functional stimulation vastly exceed the localized CMRO2 increases, although they were comparable to the increases in localized cerebral glucose metabolism.
25
Buxton and Frank
26
explained this observation by developing a compartment model of hemodynamic changes predicting that disproportionately large CBF increases are needed to support small CMRO2 increases. A key assumption of their model is that all of the oxygen leaving the vasculature is metabolized, and one consequence of their model is that changes in CBF and CMRO2 are not independent. However, the direct measurements of tissue oxygen pressure and CBF in rats during functional stimulation, by Ances
Our results show an uncoupling between CBF and CMRO2 during functional stimulation at different levels of ischemia that supports the notion of the safety factor described by Leithner
As with CBF, HbO and HbR are also more severely attenuated with moderate ischemia than the electrical SEP response. However, ischemia does not affect the total hemoglobin response significantly differently from the SEP response (Figure 6B). The uncoupling between blood flow and total hemoglobin responses with ischemia shows that with functional activation, using total hemoglobin as a surrogate for blood flow via Grubb's relation 28 could lead to inaccurate results for blood flow.
Though we are not aware of previously published data on functional hemodynamic responses to an identical stimulation protocol, the preischemic responses we measure are reasonable. For 4 Hz, 4-second, 1.6 mA forepaw stimulation in healthy rats, Royl
In regard to SEPs, experimental work involving a focal ischemia model in baboons showed a sharp CBF threshold for electrical activity in the brain, with complete electrical failure when CBF is ~35% of control. 31 A similar CBF threshold was observed for auditory evoked potentials in a global ischemia model in cats. 32 In our study, we did observe severe attenuation in SEPs at a CBF level around 40% (Figures 5–7), although we did not observe the same sharp CBF threshold for electrical activity seen in these nonrodent ischemia models (Figure 7). There is a scarcity of data examining SEPs at milder levels of ischemia. One paper examining SEPs in a hemorrhage ischemia rat model observed SEP amplitudes between 50% and 60% of control when CBF was decreased to ~65% of control, 33 which is reasonably close to the results in Figure 7. In another paper examining the effects of bilateral common carotid artery occlusion on SEPs in rats, a steady-state decrease in the SEP p1 amplitude to 90% of control is observed, although this decrease was not statistically significant. 34 In the present study, bilateral common carotid artery occlusion decreased CBF to 70 ± 15% (mean ± SD) of control. Since in the control group, the SEP amplitude remains stable, it is likely that the observed decreases in SEP amplitude during mild ischemia are in fact because of the reduced blood flow levels in the brain. The effect of an increased SEP latency with ischemia (Figure 5) has been observed in rodent models of ischemia by others as well.35,36
The mechanisms that couple changes in neuronal activity to changes in CBF have been under investigation for several decades and involve not only the neurons but also the vascular cells and astrocytes encompassing the ‘so-called’ neurovascular unit.
37
The main mediators for the hemodynamic response to neuronal activation include nitric oxide, adenosine, glutamate, arachidonic acid metabolites, and epoxyeicosatrienoic acids.
2
During and after cerebral ischemia, the elements that comprise the neurovascular unit may be altered and vascular reactivity depressed,
38
with the degree of depression dependent on the degree of ischemia.
39
However, data are lacking on changes to these mediators during graded ischemia. Although a specific mechanism accounting for the decrease in blood flow response as baseline blood flow decreased cannot be identified, reduction of CBF resulting from upstream vascular clamping or hypotension causes the local vasculature to dilate with potential negative implications for further dilation in response to neuronal activation. It is also important to note that
To summarize, we have collected a large data set of hemodynamic and electrical functional responses in rats at many different levels of global cerebral ischemia. All of the electrical and hemodynamic responses are attenuated as the global ischemia becomes more severe, but the blood flow, oxy-hemoglobin, and deoxy-hemoglobin responses are more strongly attenuated at milder levels of global ischemia than the electrical or metabolic responses. The observed uncoupling between flow and metabolism at ischemic levels is evidence supporting the notion that during healthy conditions, functional stimulation increases oxygen delivery to brain tissue more than oxygen consumption. During functional stimulation in global ischemia, though, a higher fraction of the oxygen delivered from the vasculature will be consumed.
DISCLOSURE/CONFLICT OF INTEREST
The authors declare no conflict of interest.
Footnotes
ACKNOWLEDGEMENTS
The content is solely the responsibility of the authors and does not necessarily represent the official views of the Eunice Kennedy Shriver National Institute of Child Health and Human Development or the National Institutes of Health. The authors are also grateful to Chao Zhou and Eric Pinter for their assistance with building the optical imaging instrument.
APPENDIX
A modified Beer–Lambert law was used to compute oxy-hemoglobin concentration (HbO) and deoxy-hemoglobin concentration (HbR) changes from intensity measurements under light emitting diode (LED) illumination:
The weight
In addition to using Equations A1 to calculate changes in HbO and HbR because of stimulation at a given ischemic condition, Equations A1 was also used to calculate changes in HbO and HbR between adjacent steps of graded ischemia. For example, to measure the changes in HbO and HbR because of right carotid artery occlusion,
It was assumed during the preischemic baseline period for every animal that the cortical tissue under the imaging window is spatially homogeneous with HbO0 = 60 μmol/L, HbR0 = 40 μmol/L, and a reduced scattering coefficient of 10 per cm for all wavelengths emitted by the LEDs. From this starting point, images of HbO and HbR were then calculated for all subsequent conditions of ischemia. These measurements of hemoglobin concentration ([μmol/volume tissue]) are averaged over a well-mixed sample of arterioles, capillaries, and venules.