
Abstract
The differentiation of the vegetative or unresponsive wakefulness syndrome (VS/UWS) from the minimally conscious state (MCS) is an important clinical issue. The cerebral metabolic rate of glucose (CMRglc) declines when consciousness is lost, and may reveal the residual cognitive function of these patients. However, no quantitative comparisons of cerebral glucose metabolism in VS/UWS and MCS have yet been reported. We calculated the regional and whole-brain CMRglc of 41 patients in the states of VS/UWS (
Introduction
Disorder of consciousness (DOC) is a frequent complication of severe brain injury. The diagnosis covers several pathologic states, characterized by diminished responsiveness at the bedside. Among the patients with DOC, those in the vegetative state (VS) or, as recently proposed, in the unresponsive wakefulness syndrome (UWS), retain arousal (i.e., eye opening), but exhibit no behavior indicative of awareness. 1 In the minimally conscious state (MCS), patients display different but reproducible signs of awareness, but are unable to communicate functionally. 2 By convention, emergence from the MCS (EMCS) occurs when patients regain a capacity for functional communication or object use. 2 The differentiation among the states of VS/UWS, MCS, and EMCS is a serious challenge to society and to the clinic. In these conditions, quantitative molecular neuroimaging is a promising complement to bedside assessment, 3 because DOC is associated with widespread reductions of cerebral energy metabolism. 4 The energy metabolism of the brain relies on uninterrupted glucose consumption, which is measured with positron emission tomography (PET) with [18F]fluorodeoxyglucose (FDG). We have previously shown that analysis of regional metabolic patterns on global mean-normalized FDG-PET scans provide a strong differential diagnostic tool in DOC. 5 This method, however, only takes relative regional differences of brain metabolism into account, with no assessment of absolute metabolic differences among the conditions. Important information, such as global cerebral metabolism, is lost in the normalization process, which in some cases leads to false diagnosis. It is necessary to quantitatively determine metabolism to improve the reliability of the FDG-PET diagnostic approach to DOC. As patients in VS/UWS, MCS, and EMCS occupy a zone of transition between the states of full consciousness and unconsciousness, they also afford a unique, if unfortunate, opportunity to investigate the neurobiology of conscious awareness.
During loss of consciousness, cerebral metabolic rates of glucose (CMRglc) fall to 50% of normal or less. 4 In previous studies, reported decreases of CMRglc to 40% to 50% of normal in patients in the acute phase of VS/UWS declined further to 30% to 40% in transition to subacute and chronic stages.6, 7, 8 However, it remains unclear whether the metabolic changes correlate directly with the level of consciousness, or whether they rather reflect the extent of neuronal damage at the onset of the condition. Gjedde 9 argued that incrementally increasing levels of consciousness appear to be associated with a stepwise doubling of rates of energy metabolism. He proposed that the transition among conscious states is linked to metabolic phase transitions.9,10 Thus, uniformly high baseline energy metabolic rates appear to be necessary to support full consciousness, as argued by Shulman. 10 By inference, MCS would be associated with higher CMRglc than VS/UWS. A certain proportion of the brain's energy budget is reserved for cellular homeostatic processes at an isoelectric baseline of electroencephalographic activity. 11 Here, we argue that the transition from VS/UWS to MCS must occur with increments of whole-brain energy metabolism relative to this isoelectric baseline. A test of this hypothesis has not yet been reported, as no group study directly assessed the quantitative differences of CMRglc among patients in VS/UWS and MCS. Neither did previous studies of CMRglc with PET of FDG in VS/UWS address the question of the extent to which the metabolic requirements of consciousness are global, or whether regional increases confined to specific brain regions are sufficient to restore consciousness. Previous studies indicated that areas associated with conscious activity include arousal centers in the brainstem, and a set of cortical regions including the frontoparietal network and precuneus 12 that belong to a global workspace of consciousness. 13 The authors argued that these regions depend on an ascending arousal system that interacts with ‘default mode’ and executive control networks, which respectively are held to subserve internal or introspective, 14 and external or extrospective,15,16 awareness. Other studies alternatively suggest that central thalamic nuclei serve to connect the ascending arousal system to the entire cortex supporting awareness, and to drive the cortical activity necessary for consciousness.10,17
In the present study, we test the hypothesis of a threshold at 50% of normal whole-brain or cortical CMRglc values for the transitions of patients among the VS/UWS, MCS, and EMCS states, in relation to healthy controls. We expect patients in the conditions of MCS and EMCS to have significantly higher cortical, thalamic, and brainstem metabolic rates, than patients in the condition of VS/UWS. In line with previous studies,4,18 we expect these differences to be most pronounced in the frontoparietal associative cortices and the precuneus, but to remain small compared with the average whole-brain differences. We further hypothesize that patients in MCS and EMCS do not differ with respect to CMRglc, as both groups have undergone transition to minimal awareness, although with differences of cognitive capacity. 19
Materials and methods
Patients
Our study population was a convenience sample of patients diagnosed with the Coma Recovery Scale-Revised (CRS-R) as being in VS/UWS, MCS, or EMCS. All patients were admitted to the Liège University Hospital in the period 2010 to 2012. The population comprised 41 patients (mean age: 41±18 years; 26 males), 14 in VS/UWS, 21 in MCS, and 6 in EMCS. Of these, 15 patients had traumatic and 26 patients had nontraumatic etiologies (i.e., cardiac arrest, stroke, hemorrhage, infection, and metabolic disorders). Average duration since insult was 27 months (range: 24 days to 9 years). We also included 29 healthy controls with no history of neurologic disorders (mean age: 44±16 years; 19 males). Table 1 summarizes the patient data. The study was conducted in accordance with the Helsinki Protocol, and approved by the Ethics Committee of the University Hospital of Liège. All healthy participants, and legal representative of all patients gave written informed consent.
Patient demographics
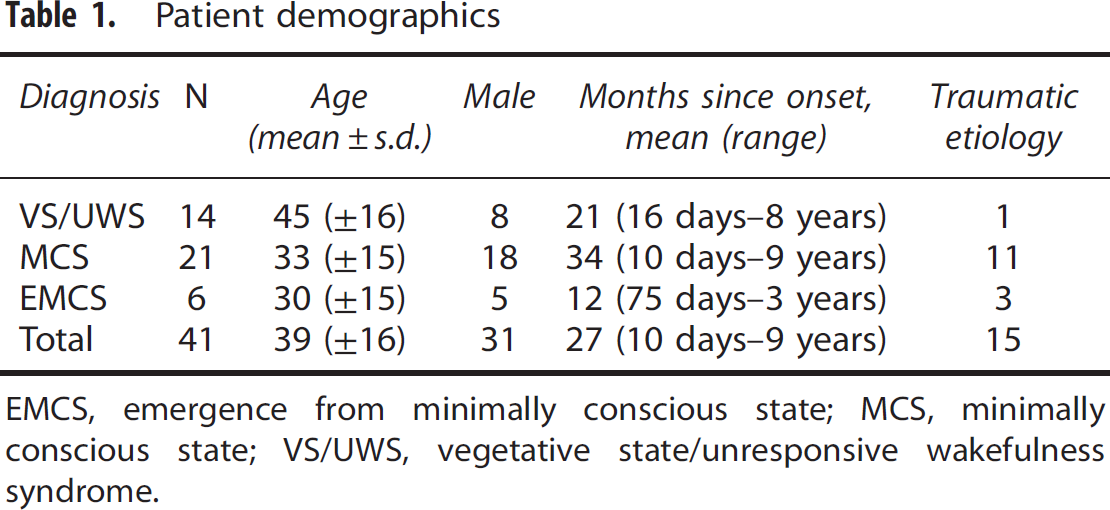
EMCS, emergence from minimally conscious state; MCS, minimally conscious state; VS/UWS, vegetative state/unresponsive wakefulness syndrome.
Behavioral Diagnosis
The CRS-R was used to define the clinical diagnosis, as the most sensitive tool for discriminating low awareness levels.20,21 The CRS-R has six subscales, including auditory, visual, motor and oromotor/verbal functions, communication, and level of arousal (Supplementary Table 1). Trained neuropsychologists conducted the CRS-R assessment at least once a day over 5 days, and the best result obtained was used to determine the diagnosis.
PET Data Acquisition
We acquired all PET data with Gemini PET-computed tomography (Philips Medical Systems) at the University Hospital of Liège. Following intravenous injection of 185 to 370 MBq FDG, we recorded a single PET frame for 12 minutes, after circulation of the tracer for at least 30 minutes. We maintained the patients awake during the uptake period. The images were corrected for attenuation using X-ray computed tomography, as well as for random scatter and physical decay.
Calculation of Glucose Metabolism
Quantitative determination of CMRglc in patients with DOC is an important methodological challenge. PET imaging of FDG with arterial blood sampling is ethically tenuous, as the patients cannot give consent to the prolonged invasive procedure.
3
We therefore quantified CMRglc with Sokoloff's autoradiographic method,
22
using a standard arterial input function obtained from 10 healthy volunteers.23,24 Plasma glucose levels were obtained from a single cutaneous blood sample immediately before image acquisition. For the calculation, we used the glucose transfer coefficients and lumped constant of 0.61 reported by Kuwabara and Gjedde.
25
The use of standardized arterial input curves assumes corresponding lumped constants and input function shapes for healthy subjects and patients with brain injury. It further assumes similar plasma glucose levels in all subjects during image acquisition, a condition that was met (Supplementary Table 2). Sokoloff's autoradiographic method makes primary use of the recorded radioactivity, to which the transfer constants
PET Image Processing
We coregistered the images in MNI-space, using the Orderless Mutual Information framework. 27 This registration method is developed for large spatial deformations, and is more robust to brain atrophy and focal lesions than standard coregistration methods.
We generated average group images of the VS/UWS, MCS, and healthy controls. We identified absolute group differences by pairwise subtraction of average metabolic maps. We performed whole-brain voxel-wise comparison of subjects in MCS and VS/UWS with statistical parametric mapping (SPM 8, implemented in MATLAB), after smoothing with a 14 mm FWHM kernel. To avoid focal lesions affecting the comparison, voxels with intensity <0.5 of image maximum were masked out. We contrasted the diagnostic groups in a pairwise manner to identify sites with significant differences among the conditions.
We used the Harvard-Oxford atlas to parcellate the brains into discrete regions.
28
All cortical regions were merged to create a whole-brain cortical mask. To assess activity in the areas of greatest difference between subjects in MCS and VS/UWS, we constructed a regional mask corresponding to the SPM difference map of the contrast MCS>VS/UWS, at
Statistical Analysis
We determined group differences of rCMRglc using the general linear model, with etiology and time since onset as covariates. We used the Wilcoxon rank-sum tests to assess the significance of pairwise regional differences among VS/UWS, MCS, and healthy controls. We also determined differences in regional metabolic rates between MCS and EMCS.
For each region, we further assessed correlations with the CRS-R score and the arousal subscore, both the overall average and the score on the day of PET scan, using the general linear model. To test whether CMRglc values reflect the patient status at the specific time of scanning, we further correlated the rCMRglc values of patients in MCS and EMCS with their CRS-R diagnosis (EMCS, MCS, or VS/UWS) on the day of image acquisition.
To identify the cortical metabolic threshold over which patients are more likely to be in MCS than in VS/UWS, we performed an ordinal logistic regression by patient group (MCS, VS/UWS, or control), on the overall cortical metabolic rates and the metabolic rates within the maximum difference mask.
We assessed the variability of cortical metabolism within subjects, by calculating standard deviation of voxel-wise uptake values within the cortical mask. We calculated the energy turnover supporting synaptic transmission by subtracting the metabolic background associated with cellular homeostatic processes (0.0375 μmol/g per minute 29 ). This value corresponds to the average cortical glucose metabolism associated with isoelectric electroencephalographic activity level. We subtracted this constant metabolic background from the value determined in each voxel of each image.
To examine the possibility of differentiating patients in VS/UWS and MCS on the basid of their values of CMRglc, we plotted receiver-operating characteristics (ROC) curves for rCMRglc, as well as for the cortical voxel-wise variability. We thus used the CRS-R as diagnostic reference, and plotted the ratio of correctly classified patients at increasing metabolic cutoff points of discrimination between the conditions. As we tested for the presence of minimal consciousness, we assigned a correct classification of MCS as a true positive. Posing no clinical diagnostic problems, patients in EMCS and controls were not included in this test. We used the area under the ROC curve as a measure of diagnostic accuracy. We further plotted the likelihood ratio of being MCS versus VS/UWS, for increasing thresholds of rCMRglc.
Results
Global Glucose Metabolism
All patients had globally reduced cerebral metabolic rates of glucose, relative to healthy controls, but the MCS patients had higher rates of metabolism than patients in VS/UWS in all cortical areas (Figure 1). In the voxel-wise comparison, the regions with the most significant differences belonged to the primary and associative sensory (visual, auditory, and somatosensory) and motor areas bilaterally (
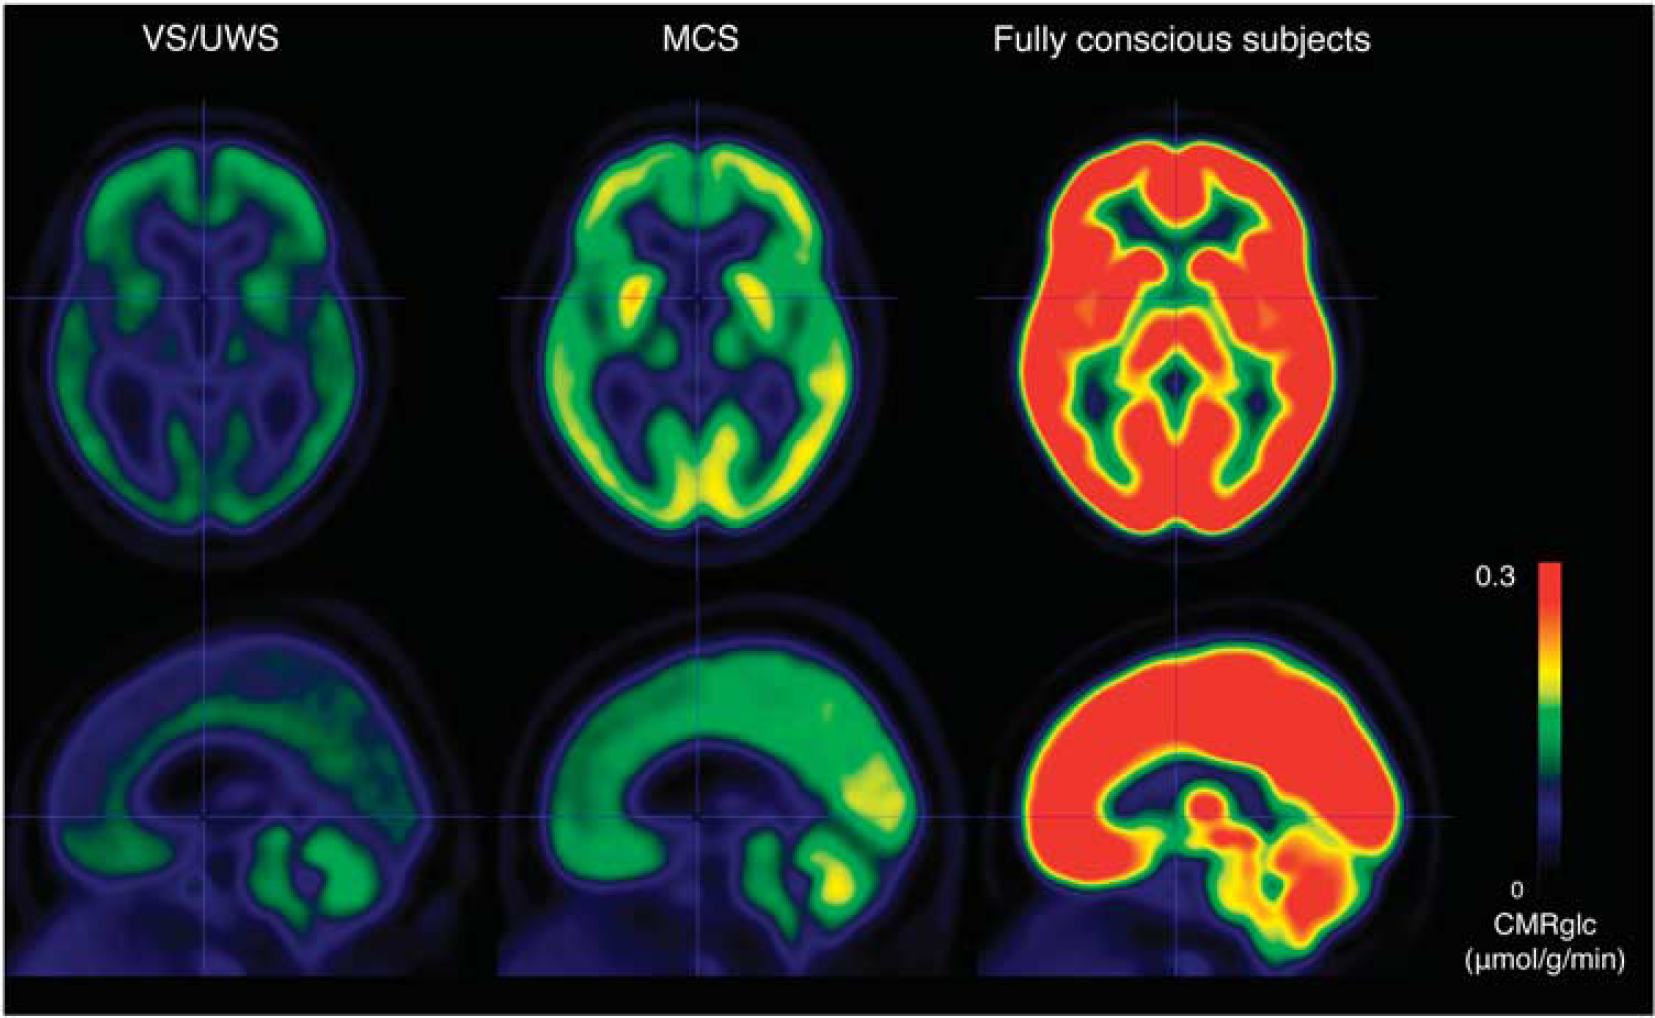
Average CMRglc (μmoL/g per minute) by condition (14 patients in VS/UWS, 21 patients in MCS, and 29 fully conscious controls). CMRglc, cerebral metabolic rate of glucose; MCS, minimally conscious state; VS/UWS, vegetative state/unresponsive wakefulness syndrome.
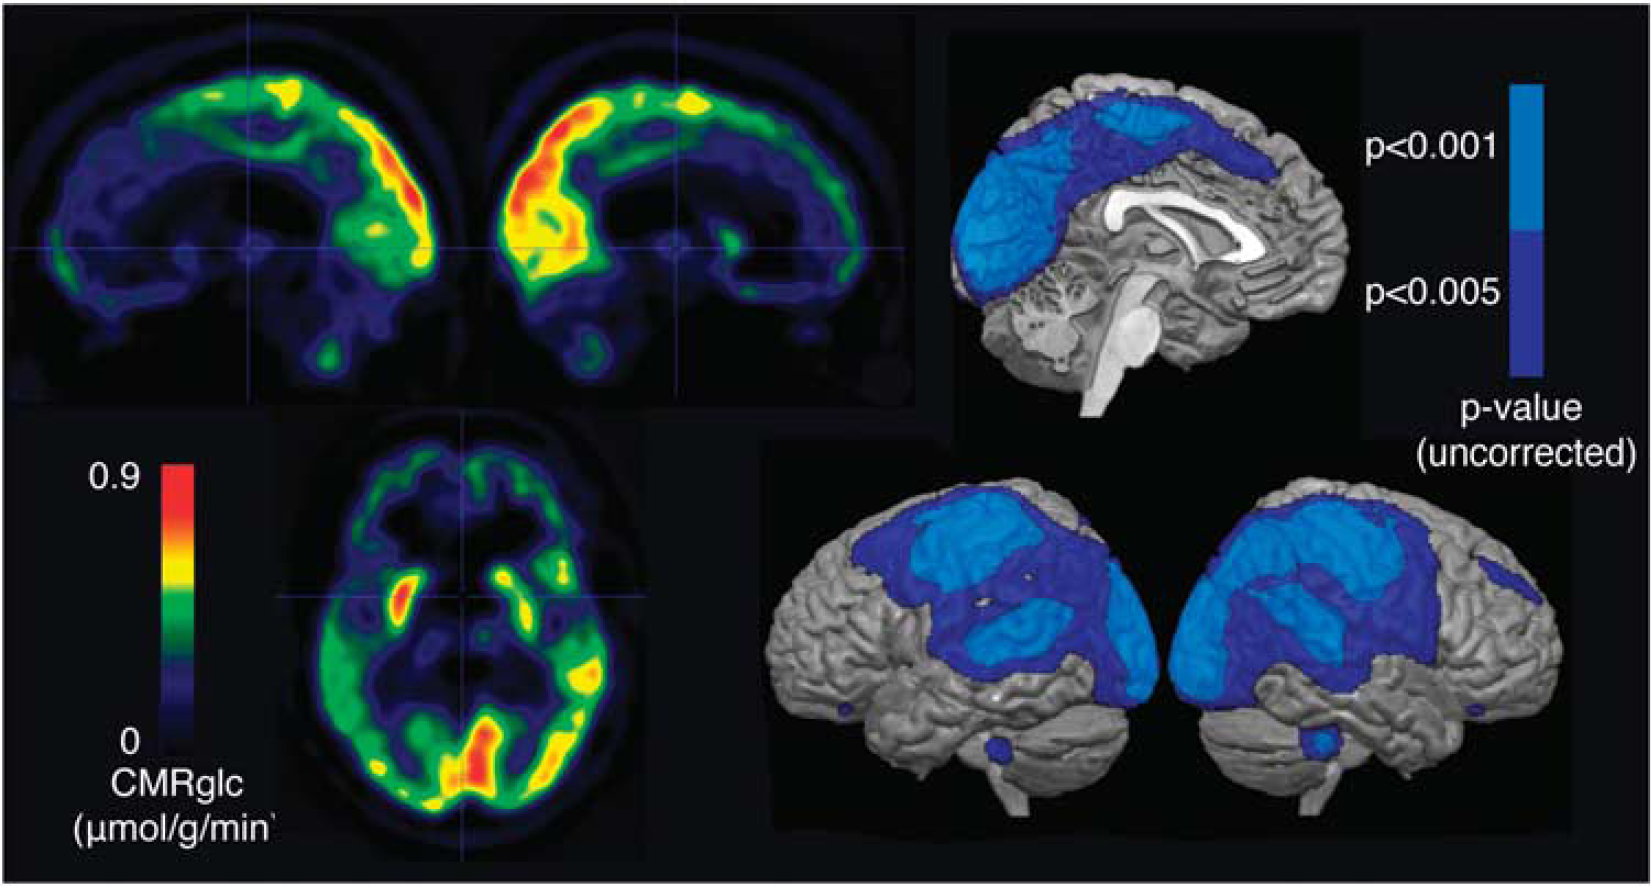
Metabolic differences between 14 patients in VS/UWS and 21 patients in MCS. Left: subtraction of average VS/UWS image from average MCS image. Right: areas where activity in MCS is significantly higher than in VS/UWS, at
Median cortical glucose metabolic rates averaged 42% of normal in VS/UWS patients, 55% of normal in MCS patients, and 53% of normal in EMCS patients (Table 2, Figure 3). The group differences were significant, at
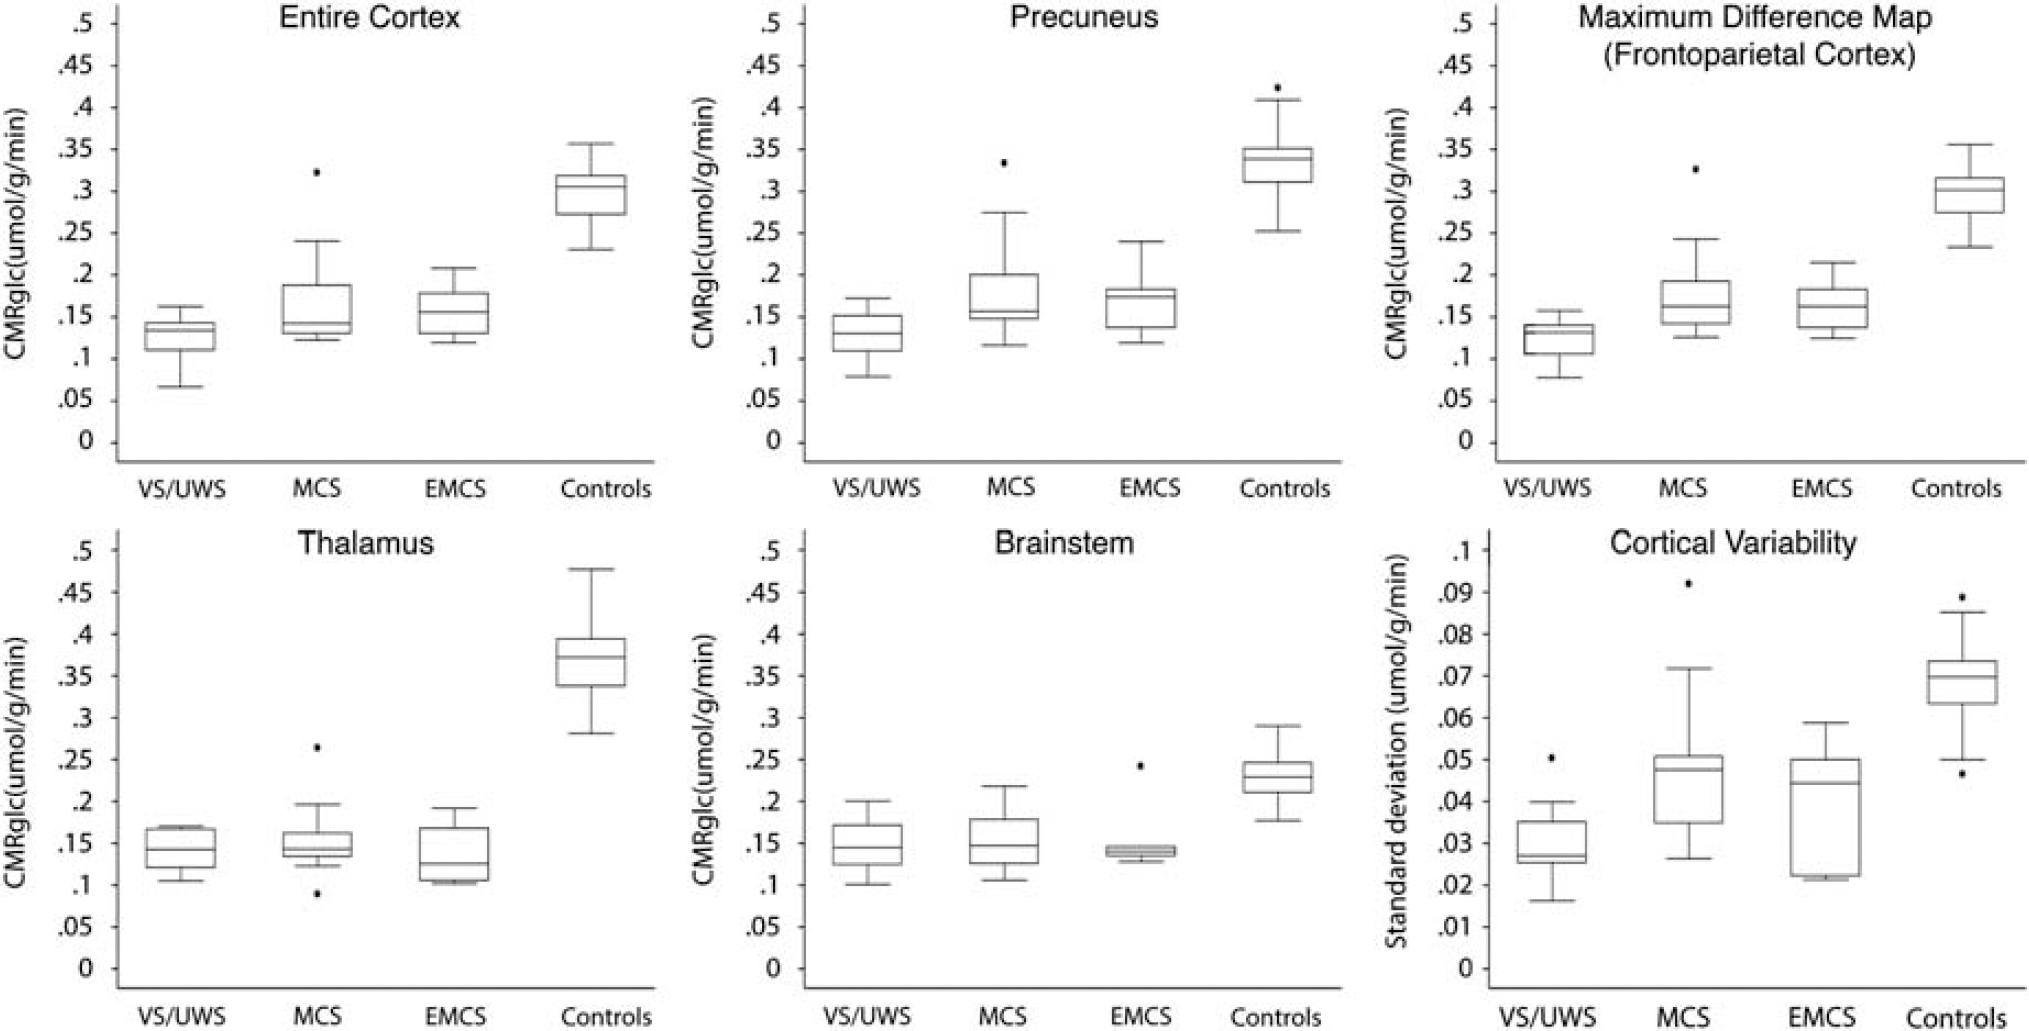
Regional cerebral metabolic rates of glucose (μmol/g per minute). Top left: median cortical CMRglc. Top middle: median precuneal CMRglc. Top right: median CMRglc within mask of areas with significant differences between MCS and VS/UWS at
Average regional metabolic rates of glucose
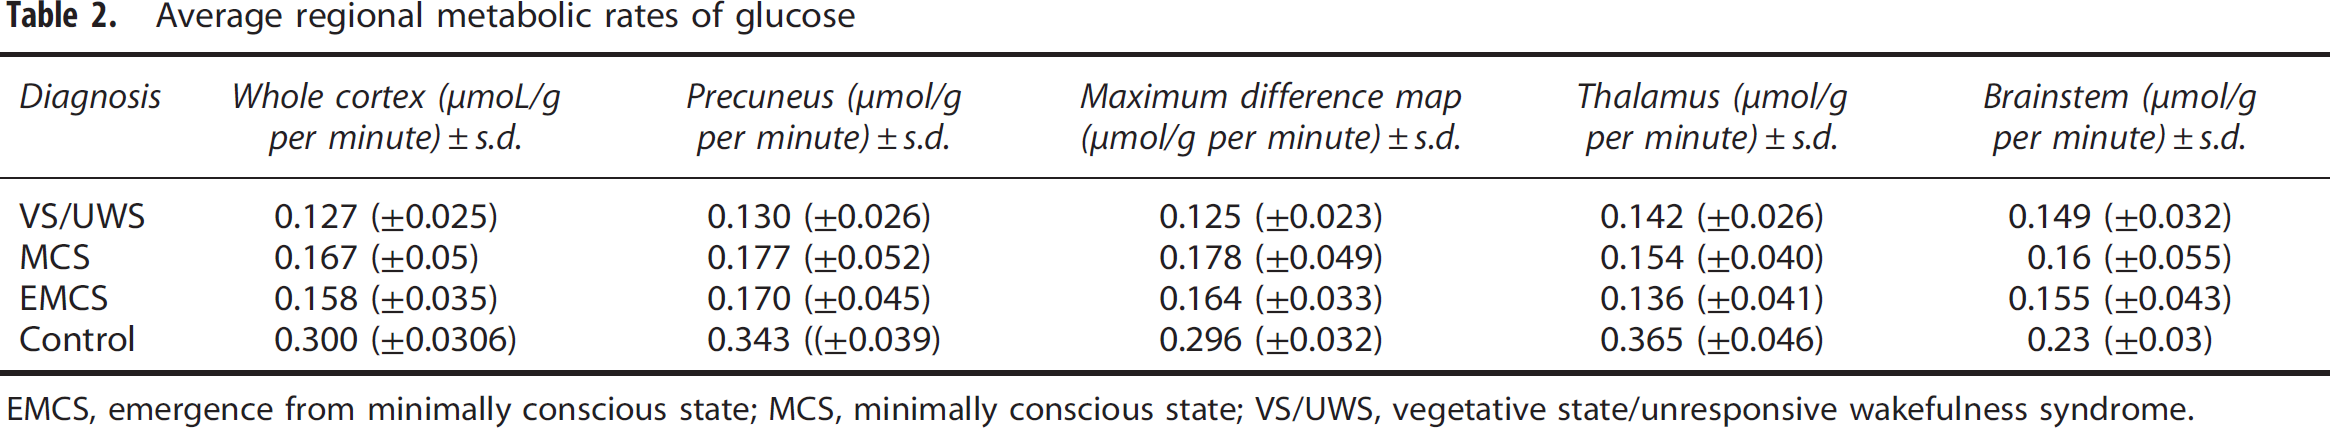
EMCS, emergence from minimally conscious state; MCS, minimally conscious state; VS/UWS, vegetative state/unresponsive wakefulness syndrome.
Regional Glucose Metabolism
Median glucose metabolic rates within the maximum difference map (
Precuneal glucose metabolic rates averaged 38% of normal in VS/UWS, 51% of normal in MCS, and 50% of normal in EMCS (Table 2, Figure 3). Group differences were significant at
Thalamic glucose metabolic rates averaged 39% of normal in VS/UWS, 42% of normal in MCS and 37% of normal in EMCS (Table 2, Figure 3). No significant differences existed between thalamic metabolic rates of MCS and VS/UWS subjects (
Brainstem glucose metabolic rates were 65% of normal in VS/UWS, 70% of normal in MCS, and 67% of normal in EMCS (Table 2, Figure 3). No significant differences appeared between brainstem metabolic rates of MCS and VS/UWS patients (
We found no significant correlations between rCMRglc reductions and time since onset, etiology, or age for any group in any of the selected regions. Measures of rCMRglc did not correlate with CRS-R or arousal subscores, as measured before or on the day of PET (see Supplementary Table 3 for individual scores).
Average within-subject voxel-wise variances of cortical metabolism were 0.029 s.d. in VS/UWS, 0.047 s.d. in MCS, 0.040 s.d. in EMCS, and 0.068 s.d. in healthy controls (Table 3, Figure 3). The difference in cortical CMRglc variance between VS/UWS and MCS was significant at
Synaptic contribution and variance of cortical metabolism
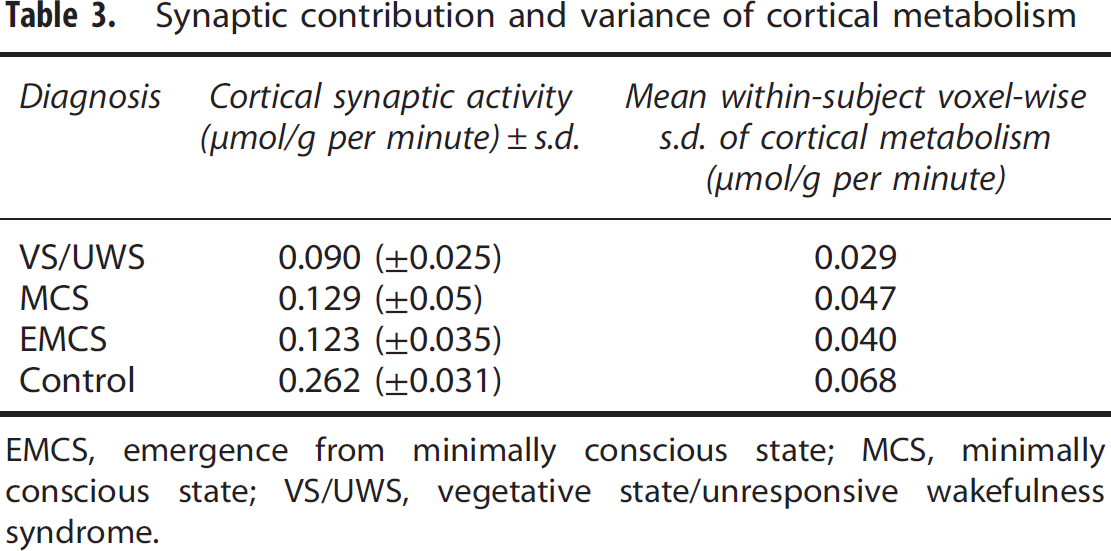
EMCS, emergence from minimally conscious state; MCS, minimally conscious state; VS/UWS, vegetative state/unresponsive wakefulness syndrome.
Ordinal logistic regression showed that the likelihood of diagnosis shifted from VS/UWS to MCS at a threshold of metabolic rate of 44% of normal (0.132 μmol/g per minute) in the entire cortex, and above 46% of normal (0.138 μmol/g per minute) within the maximum difference map. Eight MCS patients had CRS-R scores corresponding to a status of VS/UWS on the day of the PET. Average cortical CMRglc values of these patients (0.175 μmol/g per minute) matched that of the 13 patients clinically in MCS at image acquisition (0.162 μmol/g per minute; see Supplementary Table 3 for individual patient data).
The glucose consumption required for tissue homeostasis, without cellular communication, is ∼12.5% of normal cortical metabolism. 29 To assess the energy turnover associated with synaptic firing in each group, we therefore subtracted the value of this threshold of 0.0375 μmol/g per minute for each patient. The results are consistent with maintained activity above isoelectricity at average levels of 34% of normal in VS/UWS, 49% of normal in MCS, and 47% in EMCS (Table 3).
The ROC analysis provided an area under the ROC curve of 0.73 for the entire cortex, 0.74 for the precuneus, 0.87 for the maximum difference map (i.e., frontoparietal cortex), and 0.86 for the cortical variability of metabolism (Figure 4, Table 4). The highest classification rate achieved was 83% (using the cortical variability of metabolism; Table 4). The likelihood of being in MCS rather than VS/UWS increased with increasing CMRglc (Figure 4). We plotted no ROC curves or likelihood ratios of consciousness for thalamus and brainstem, as we found no significant metabolic differences between VS/UWS and MCS in these regions.
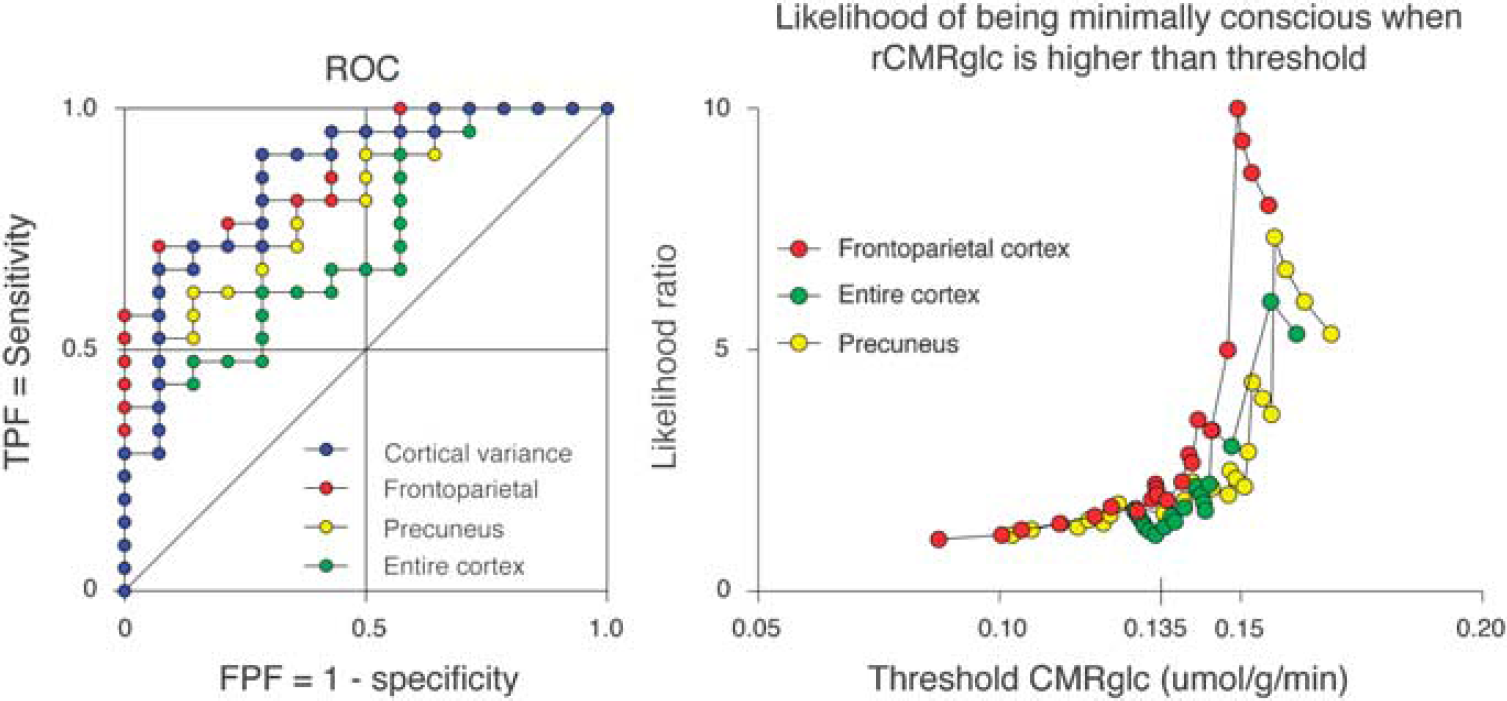
Ability to differentiate VS/UWS from MCS, based on rCMRglc and cortical variance. Left: receiver-operating characteristic (ROC) plots of metabolism within the entire cortex, precuneus, frontoparietal cortex (areas with significant differences between MCS and VS/UWS at
Diagnostic precision of regional metabolic measures
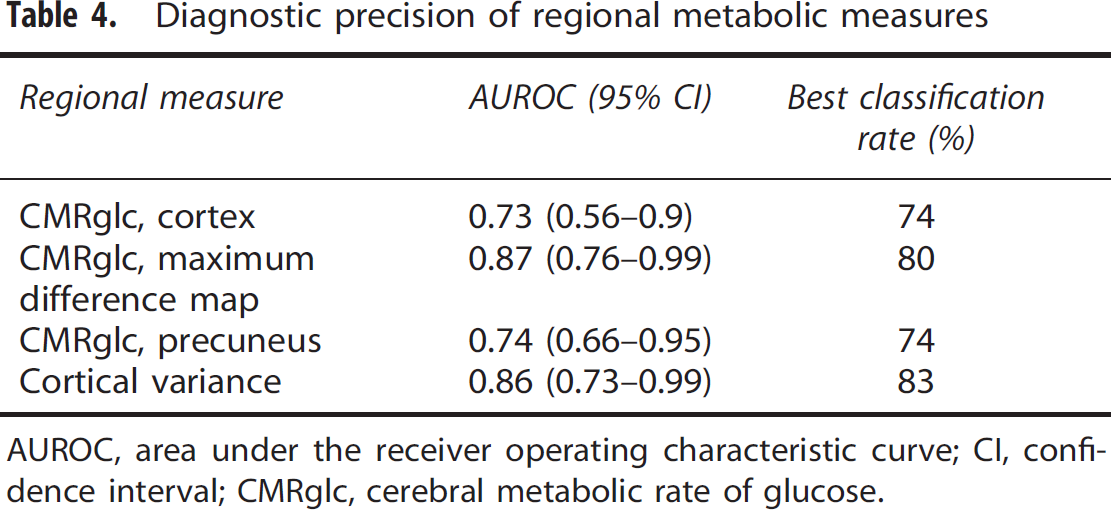
AUROC, area under the receiver operating characteristic curve; CI, confidence interval; CMRglc, cerebral metabolic rate of glucose.
Discussion
We determined regional and whole-brain values of CMRglc of 41 patients in VS/UWS, MCS, or EMCS, with PET of the glucose metabolism tracer FDG. We found a significant global decline in cerebral metabolism in severely brain-injured patients compared with healthy controls. The patients in MCS had significantly higher metabolic rates (55% of normal) than the VS/UWS patients (42% of normal) in all cortical regions. The differences of regional CMRglc between MCS and VS/UWS were most pronounced in the sensory, frontoparietal, and motor cortices, whereas no subcortical structures were differentially affected. As expected, we found no significant metabolic differences between the MCS and EMCS patients.
The findings show that states of unconsciousness after severe brain injury are associated with a global decrease of CMRglc within the range of 40% to 50% of normal resting activity in fully conscious individuals. Similar decreases of CMRglc occur in anesthesia induced by any of a wide range of pharmacological agents,30, 31, 32 as well as in deep sleep, 33 and coma. The results are consistent with the hypothesis that a brain energy turnover rate above a certain threshold is necessary for support of consciousness.9,10 Results of previous studies have implicated impairments of the frontoparietal and precuneal cortex, thalamus, and brainstem in states of unconsciousness. The present results indicate that cerebral metabolic differences among the patient groups are global, but most pronounced in the frontoparietal and precuneal cortices, and with no specific involvement of the thalamus and brainstem.
Global Decline of Metabolism
The overall cortical CMRglc was lower in patients than in healthy control subjects, but significantly higher in MCS than in VS/UWS patients. Metabolism did not differ significantly between the patient groups of MCS and EMCS. The results imply that the cortical rate of metabolism is an important determinant of whether a patient is unconscious or retains some degree of awareness. Etiology, time since insult, and CRS-R scores, and arousal subscores did not correlate with the global metabolism, indicating that the metabolic differences were probably associated with level of consciousness rather than with possible confounding factors. It is thus reasonable for us to conclude that a tight correlation exists between level of conscious awareness and energy turnover in the brain. However, we observed a significant overlap of individual cortical metabolism values between the MCS and VS/UWS patients. Although few MCS patients had cortical metabolic rates below the VS/UWS average, and no VS/ UWS patients had metabolic rates above the MCS average, a majority of the patients had metabolic rates between the two limits. Thus this finding is consistent with a gradual transition between the states. The ordinal logistic regression indicated a threshold of cortical CMRglc near 45% of the normal average, below which no patient is likely to undergo transition into MCS. The overlap also implies that elevated cortical metabolism may be a necessary but not sufficient condition for emergence of consciousness. 10 Interestingly, the seven MCS patients who were clinically unresponsive on the day of the PET had CMRglc values that matched those of the responsive patients in MCS at image acquisition. The match further suggests that energy turnover enables awareness, but does not determine the specific level of consciousness expressed at the time of tomography. This hypothesis requires testing in a larger patient sample, however.
Metabolism in Support of Synaptic Transmission
Considering the presumed fundamental difference between the states (MCS and VS/UWS), the overall difference of CMRglc was surprisingly small. The modest difference may in part reflect the action of cellular homeostatic processes, which account for a relatively large portion of the overall energy budget when neurotransmission is inactive or inefficient. As the basic homeostatic requirements are held to be similar in MCS and VS/UWS, cognitive functional differences between MCS and VS/UWS may take up a relatively small part of the overall metabolism. In fully conscious subjects, close to 90% of the overall energy turnover of the brain in terms of oxidative glucose metabolism is dedicated to synaptic activity.
11
Close readings of studies that replicate the findings of Sibson
Cerebral Energetics and Cortical Connectivity
Loss of consciousness is associated with widespread loss of cortical connectivity. Particularly, studies of DOC, sleep, and anesthesia reveal decreased global connectivity, 34 and decreased default mode network connectivity, 14 decreased thalamocortical connectivity,35,36 and decreased feedback connectivity, between frontal and temporal lobes. 37 Although disruption of connectivity appears to be a key feature of DOC, the underlying pathologic mechanisms are not clear. 3 The concurrent observations of metabolic decrease and disrupted connectivity in all states of diminished consciousness suggest a common physiologic ground.
Animal studies show that high neuronal cerebral metabolic rates of oxygen (CMRO2≈80% to 90% of normal) are consistent with high frequency neuronal firing and widespread cortical integration of stimuli. At decreased baseline energetics (CMRO2 below 50% of normal), neuronal firing rates shift toward low frequencies, and long-range cortical connectivity declines.11,38 The findings support the purported link between neuronal energetics and cerebral connectivity.
With average cortical CMRglc values of ∼40% and ‘synaptic’ energetics at 34% of normal, VS/UWS patients may be in a state of low baseline energy turnover in cortex. On the basis of Maandag
Regional Metabolic Contributions to Level of Consciousness
Loss of consciousness is evidently associated with a large global decline of metabolism. However, we also observed regional variations relative to the global effect, which allowed inferences about the specific pathologic anatomy of DOC.
It is commonly held that DOC patients are ‘awake but unaware’ with preserved arousal systems, but impaired awareness.3,42 Although several studies confirm relatively preserved brainstem metabolism in VS/UWS patients,3,4,42 the present findings reveal brainstem metabolic declines to 60% to 70% of normal in all patient groups. Although brainstem metabolism is less affected than cortical metabolism, the findings clearly indicate impaired ascending arousal that may explain the fluctuations of wakefulness observed in DOC.1,2
The voxel-wise comparisons revealed that metabolic rates in the primary sensorimotor areas, adjacent frontoparietal regions, and precuneus, distinguish MCS from VS/UWS. However, the high interindividual metabolic variability prohibited robust inferences about voxel-wise regional differences. Nonetheless, average activity within the frontoparietal regions (the maximum difference map MCS>VS/UWS) was markedly higher in MCS (60% of normal) than in VS/UWS (42% of normal), in support of a critical role of the associative frontoparietal cortices in DOC.18,43 The precuneus and adjacent posterior cingulate cortex are believed to integrate input from these frontoparietal awareness networks. 44 Thus, the precuneal activity appeared to closely match the general frontoparietal CRMglc rates. It has been proposed that preserved metabolic rates in the precuneus differentiate MCS from VS/UWS, 4 and axonal regrowth in the precuneus has been seen as the driving mechanism of recovery from MCS. 45 However, as several of the MCS patients had precuneal rCMRglc values in the same range as the VS/UWS population, preserved precuneal activity does not appear to be pathognomonic for individual MCS patients.
There is evidence both
Clinical Implications
The results show that measures of CMRglc may differentiate patients in MCS from patients in VS/UWS. The ‘optimal’ metabolic cutoff to differentiate the conditions depends on the relative importance assigned to false diagnoses of VS/UWS and MCS, respectively. We therefore could not determine unequivocal measures of sensitivity and specificity. The individual cutoff points of the ROC curves show that correct classification rates of up to 83% can be achieved on the basis of cortical metabolism alone. As predicted from the ordinal logistic regression, the probability of being conscious increases dramatically at metabolic rates >45% of normal cortical levels for all cortical regions. We previously showed that pattern analysis of normalized regional metabolism has strong diagnostic utility. 5 As the absolute metabolic values provide important additional information, clinical diagnostic methods should be developed that take both absolute measures of metabolism and interregional relations into account. The CMRglc measures do not provide information of the specific cognitive capacity of the patients, and should thus be used chiefly as a means to discriminate conscious from unconscious patients. The method has the advantage of being independent of language and motor skills, and it can supplement bedside assessments, particularly in cases where aphasia, cognitive deficits or paralysis challenges communication-dependent diagnostic methods. It also presents a reliable alternative to activation-based neuroimaging paradigms, such as mental imagery during functional MRI, which also depends on relatively preserved cognition and language comprehension. A particular application could be identification of patients suffering from locked-in-syndrome, characterized by low brainstem metabolism, but relatively preserved cortical metabolism. 6 FDG-PET measures cellular activity, and only indirectly reveals the extent of neuronal damage. Future studies with tracers of neuronal integrity, such as 11C-flumazenil, could provide a more direct measure of preserved neuronal tissue, to support clinical prognosis.
Conclusion
The present findings reveal a strong correlation between overall cortical energy turnover and level of consciousness. A high baseline energy turnover may be a necessary, if not sufficient, condition for the rise of conscious awareness, by enabling long-distance connectivity across the cortex. VS/UWS patients retained a surprisingly high level of metabolism, in the range known to be associated with spontaneous synaptic activity, implying that consciousness correlates nonlinearly with neuronal work. The findings suggest that a physiologic phase shift occurs at an energy turnover just below 50% of normal, where it enables the rise of conscious awareness. Conscious individuals had significantly higher variability of cortical metabolism than unconscious patients. Thus islands of preserved activity across the cortex may be pathognomonic for the MCS. We further show that absolute cortical metabolic activity may be utilized as a clinical tool to help disentangle patients in MCS and VS/UWS.
Footnotes
The authors declare no conflict of interest.
References
Supplementary Material
Please find the following supplemental material available below.
For Open Access articles published under a Creative Commons License, all supplemental material carries the same license as the article it is associated with.
For non-Open Access articles published, all supplemental material carries a non-exclusive license, and permission requests for re-use of supplemental material or any part of supplemental material shall be sent directly to the copyright owner as specified in the copyright notice associated with the article.