
Abstract
Preclinical and postmortem studies have suggested that regional synaptic density and glucose consumption (CMRGlc) are strongly related. However, the relation between synaptic density and cerebral glucose metabolism in the human brain has not directly been assessed in vivo. Using [11C]UCB-J binding to synaptic vesicle glycoprotein 2 A (SV2A) as indicator for synaptic density and [18F]FDG for measuring cerebral glucose consumption, we studied twenty healthy female subjects (age 29.6 ± 9.9 yrs) who underwent a single-day dual-tracer protocol (GE Signa PET-MR). Global measures of absolute and relative CMRGlc and specific binding of [11C]UCB-J were indeed highly significantly correlated (r > 0.47, p < 0.001). However, regional differences in relative [18F]FDG and [11C]UCB-J uptake were observed, with up to 19% higher [11C]UCB-J uptake in the medial temporal lobe (MTL) and up to 17% higher glucose metabolism in frontal and motor-related areas and thalamus. This pattern has a considerable overlap with the brain regions showing different levels of aerobic glycolysis. Regionally varying energy demands of inhibitory and excitatory synapses at rest may also contribute to this difference. Being unaffected by astroglial and/or microglial energy demands, changes in synaptic density in the MTL may therefore be more sensitive to early detection of pathological conditions compared to changes in glucose metabolism.
Introduction
Resting-state [18F]fluorodeoxyglucose ([18F]FDG) PET has been used in both research and clinical setting as a proxy for resting-state functional brain activity for over four decades. 1 , 2 Glucose constitutes the major source of energy in the brain with about 20-30% of glucose metabolism to ensure basal cellular functioning (resting potential and housekeeping activity), representing non-signalling activity and thus independent of synaptic activity. On the other hand, about 70-80% of [18F]FDG uptake is driven by the signalling processes of basal neuronal-glial activity which activates aerobic glycolysis, in turn affected by mainly astroglial glutamate transport.3–7 Synaptic transmission is thought to be proportional to the firing rate (electrical activity) and neurotransmitter recycling (chemical activity). 8 As a large proportion of glucose consumption is thus related to synaptic signalling, [18F]FDG can be thought of as a marker for synaptic activity.
Recently, imaging of synaptic density has become possible with a number of radioligands that bind to the synaptic vesicle glycoprotein 2 subtype A (SV2A), an integral membrane protein that is ubiquitously expressed in presynaptic terminals across the brain.9–11 Previous studies have shown that SV2A binding correlates well with standard markers of presynaptic terminals such as the vesicular protein synaptophysin. 11 The most widely studied PET ligand to date, [11C]UCB-J has high affinity for SV2A (7 nM), and 10- to 100-fold selectivity over the less abundantly expressed subtypes SV2B and SV2C. 10 There are therefore grounds for considering [11C]UCB-J specific binding to be a valid proxy for synaptic density.
As for the relation between synaptic density and activity, a question is whether synapses expressing SV2A carry an equal weight in the brain energy budget, as inhibitor synapses could mediate reductions in energy consumption. However, Yu et al. found that synaptic transmission processes cost almost half of metabolism for both glutamatergic (∼53%) and GABAergic (∼47%) neurons, indicating that the energy budget for glutamatergic and GABAergic neurons is almost equal. 5
In many brain disorders, microglial activity in neuroinflammation contributes to the [18F]FDG signal and may therefore mask underlying deficits in synaptic activity in the brain. 6 , 12 , 13 It has already been shown that [11C]UCB-J binding is altered in several disorders, including temporal lobe epilepsy, 14 amnestic mild cognitive impairment (aMCI), 15 Alzheimer’s disease (AD), 16 but also in schizophrenia, 17 major depressive disorder and post-traumatic stress disorder, 18 with changes related to clinical symptomatology. Of note, in patients with early or advanced Alzheimer’s disease, a strong reduction in medial temporal lobe (MTL) SV2A binding of 30% to 40% has been observed, 15 , 16 whereas more limited alterations in glucose metabolism are observed in the MTL. 19 In contrast, about 5-10% decreased [11C]UCB-J binding was found in neocortical areas, posterior cingulate and precuneus 20 , which is less pronounced compared to reductions in glucose metabolism in these regions (20-40%) for AD patients on [18F]FDG PET. 19 , 21
Thus, a spatially variant decoupling of synaptic density and metabolic activity may be present in both healthy and disease states. 6 , 12 , 13 To better understand such differences, a direct in vivo comparative study of regional cerebral glucose metabolism and synaptic density is warranted. Previous in vivo studies in baboons have shown that resting-state brain glucose metabolism as measured by [18F]FDG PET is directly related to regional synaptophysin levels in selected cortical areas, noted post-mortem. 22 To further elucidate this, we studied glucose metabolism using [18F]FDG PET and synaptic density using [11C]UCB-J PET at rest in the same 20 healthy subjects. We hypothesized that regions with higher relative [11C]UCB-J uptake and thus higher SV2A density would also show elevated relative [18F]FDG uptake representing higher glucose metabolism, but that modulation towards areas with different energetics would be present.
Materials and methods
Subjects
In total, 20 female right-handed healthy volunteers (mean age 29.6 ± 9.9 yrs) participated in this study. This study was part of an ongoing effort to study brain effects of yoga and physical activity by means of multiparametric PET-MR. All subjects were in good health based on their medical history, laboratory screening (mean glycaemia: 86 ± 5 mg/dl) and basic neuropsychological tests (SCL-90 Symptom Checklist, 23 MMSE (Mini-Mental State Examination; median MMSE score: 30 (range: 28-30) and BDI (Beck’s Depression Inventory; 24 median BDI score: 2 (range: 0-8)). The main exclusion criteria were: history of major internal disease, previous severe head trauma, severe mental disorder and use of centrally acting drugs. The study was approved by the local University Ethics Research Committee (Ethics Committee Research UZ/KU Leuven) and was conducted in accordance with the latest version of the Declaration of Helsinki. All participants provided written informed consent before the start of the study.
Image acquisition
Subjects underwent a dual-tracer single-day PET-MR protocol, in which [11C]UCB-J and [18F]FDG PET data were acquired sequentially. All subjects were asked to fast for at least three hours before imaging started. The [11C]UCB-J precursor was obtained from UCB and labelled on site under GMP standards with a radiochemical purity >95% as described previously. 25 [18F]FDG (Glucogast™, UZ Leuven, Belgium) was produced in-house according to an approved manufacturing authorisation, with >95% radiochemical purity.
All scans were acquired with an integrated 3 Tesla, time-of-flight (TOF) GE Signa PET-MR scanner (GE Healthcare, Chicago, IL, USA). First, subjects received an intravenous bolus injection of [11C]UCB-J (injected activity: 270 ± 60 MBq, mean specific [11C]UCB-J activity: 242 ± 130 GBq/µmol) and the acquisition was started one hour post-injection. Simultaneously with the 30 min [11C]UCB-J PET, zero-echo-time (ZTE) MR (3 D radial acquisition; Flip Angle: 0.8°; Bandwidth: 62.5 kHz) images were acquired for attenuation correction, 26 followed by a 3 D volumetric T1-weighted BRAVO sequence (plane: sagittal; TE: 3.2 ms; TR: 8.5 ms; TI: 450 ms; Flip Angle: 12°; Receiver Bandwidth: 31.25 kHz, Voxel Size: 1 × 1 × 1 mm3), using an 8-channel high-resolution head array coil (GE Healthcare, Milwaukee, USA).
At least 100 min post [11C]UCB-J injection, subjects were injected with [18F]FDG (118 ± 13 MBq) under low ambient noise and light circumstances, with eyes closed while remaining awake. A static 30 min [18F]FDG PET scan was started 27.6 ± 1.9 min post-injection. Simultaneously with this scan, a ZTE sequence, 3 D pulsed enhanced long labelling continuous ASL (eASL) with three delays (TR: 5917 ms; TE: 12.4 ms; bandwidth: 62.5 kHz; Flip Angle: 111°; Voxel Size: 1.72 × 1.72 × 5.50 mm3) and fluid-attenuated inversion recovery (FLAIR) 3 D CUBE (TR: 8500 ms; TE: 130 ms; Voxel Size: 1 × 1 × 1.4 mm3) sequence were acquired.
After the PET-MR scan, a timed venous blood sample was collected at 74 ± 6 min post injection of [18F]FDG to measure blood glucose concentration and the remaining [18F]FDG activity, to estimate parametric maps of the cerebral metabolic rate of glucose (rCMRGlc) using the Hunter method. 27
Both [11C]UCB-J and [18F]FDG PET data were rebinned in 6 frames of 5 min and corrected for deadtime, randoms, scatter and detector time-offsets 28 while a validated ZTE-based attenuation map was applied for attenuation. 26 PET images were reconstructed using OSEM (ordered subset expectation maximization; 28 subsets, 4 iterations), including time-of-flight (TOF) information, resolution modelling and isotropic Gaussian post smoothing with a FWHM (full width at half maximum) of 4.5 mm.
Image processing
[11C]UCB-J and [18F]FDG PET frames were realigned and corrected for motion by a rigid co-registration to the first 5 min frame and all motion-corrected PET frames were summed (PMOD v4.0; PMOD Technologies Inc., Zurich, Switzerland). Next, realigned PET images were coregistered to the individual volumetric T1-weighted MR images using SPM12 (Statistical Parametric Mapping, Wellcome Department of Imaging Neuroscience, London, UK). Realigned PET and T1 MR images were then warped to Montreal Neurological Institute (MNI) standard space in SPM12 using an [18F]FDG PET template (voxel size: 2 × 2 × 2 mm3). To reduce noise at voxel level, to account for gyral variations and to apply the general linear model, PET images were smoothed using a 3 D isotropic Gaussian kernel with FWHM of 8 mm.
Parametric [11C]UCB-J standardized uptake value ratio (SUVR) images were generated using the centrum semiovale (CS) as validated reference region. The CS was delineated by applying a 0.99 threshold to the appropriate slices on isotropic (7 mm FWHM) Gaussian smoothed individual white matter probability maps, resulting in only those voxels with a high CS probability. 25 , 29 Parametric binding potential [11C]UCB-J (BPnd) maps were directly generated from the SUVR parametric images (BPnd = SUVR – 1). 29
To estimate parametric maps of regional cerebral metabolic rate of glucose (rCMRGlc) (mmol/l/min) the blood glucose concentration was measured and venous blood samples were centrifuged for 5 min (4000 rpm, 4 °C) to determine the remaining tracer concentration in plasma with an automatic gamma counter (Perkin Elmer, 1480 WIZARD, 3 inches crystal). Consequently, a lumped constant of 0.65 was applied for all regions, generating rCMRGlc values. 27 , 30
A grey matter mask was generated by averaging the individual grey matter probability maps obtained after dual-channel segmentation approach using both the T1-weighted and FLAIR MR images in SPM12, followed by binarizing the average grey matter probability image. Additionally, relative [18F]FDG and [11C]UCB-J intensity maps were created by scaling each image to the average grey matter rCMRGlc for [18F]FDG and to the average grey matter BPnd for [11C]UCB-J, respectively.
Because cerebral blood flow (CBF) is coupled to glucose metabolism in rest conditions for healthy subjects, 31 , 32 we used an enhanced triple plane tagging arterial spin labelling (eASL) sequence to validate the rCMRGlc approximation obtained by means of a simplified Hunter approach using a single venous sample as described above. 32 , 33 eASL images were corrected for arterial transit time (ATT), resulting in transit corrected flow (TCF) images, using vendor-specific software (GE Healthcare, Milwaukee, USA). All CBF eASL images were rigidly aligned with individual [18F]FDG images to account for within-scan movement, spatially normalized to MNI space using an [18F]FDG template and smoothed by applying a 3 D isotropic Gaussian kernel with a FWHM of 12 mm.
Volumes of interest (VOI) were automatically delineated in PMOD (PMOD v4.0; PMOD Technologies Inc., Zurich, Switzerland) using the PNEURO tool and the N30R83 Hammers probabilistic atlas. To reduce dimensionality and avoid type II errors, the standard 83 bilateral VOIs were merged into eleven larger composite regions comprising both hemispheres: frontal cortex, parietal cortex, occipital cortex, medial temporal cortex, lateral temporal cortex, insular cortex, anterior and posterior cingulate cortex, thalamus, striatum and cerebellum.
Statistics
Statistical analyses were conducted in Prism (v5, GraphPad, San Diego, USA). P-values were considered significant when a two-tailed α threshold of 0.05 was met. Bonferroni correction was used for multiple comparisons. Prior to any statistical analysis, normality of the data was assessed using Shapiro-Wilk tests, in order to apply the appropriate parametric or non-parametric statistical tests. At the voxel-level, paired t-tests were performed in SPM12 in a group comparison design between relative [18F]FDG and [11C]UCB-J parametric maps, standardly explored at voxel-level pheight < 0.001, cluster-level pFWE < 0.05 and cluster extent threshold (kext) > 200 voxels (or 1.6 cm3). In this relative group comparison, no global normalisation was performed.
Results
rCMRGlc versus SV2A binding
The rCMRGlc approximation obtained by means of a simplified single venous sample normalisation, was validated by eASL and a significant correlation between rCMRGlc and eASL CBF values was found across all VOIs as shown in Supplementary Figure 1 (r = 0.65 and p < 0.001). A highly significant correlation was found between global cerebral absolute CMRGlc and [11C]UCB-J BPND (all grey matter VOIs grouped together; r = 0.47, p < 0.001) (Figure 1(a)). No significant correlations were found for individual VOIs.
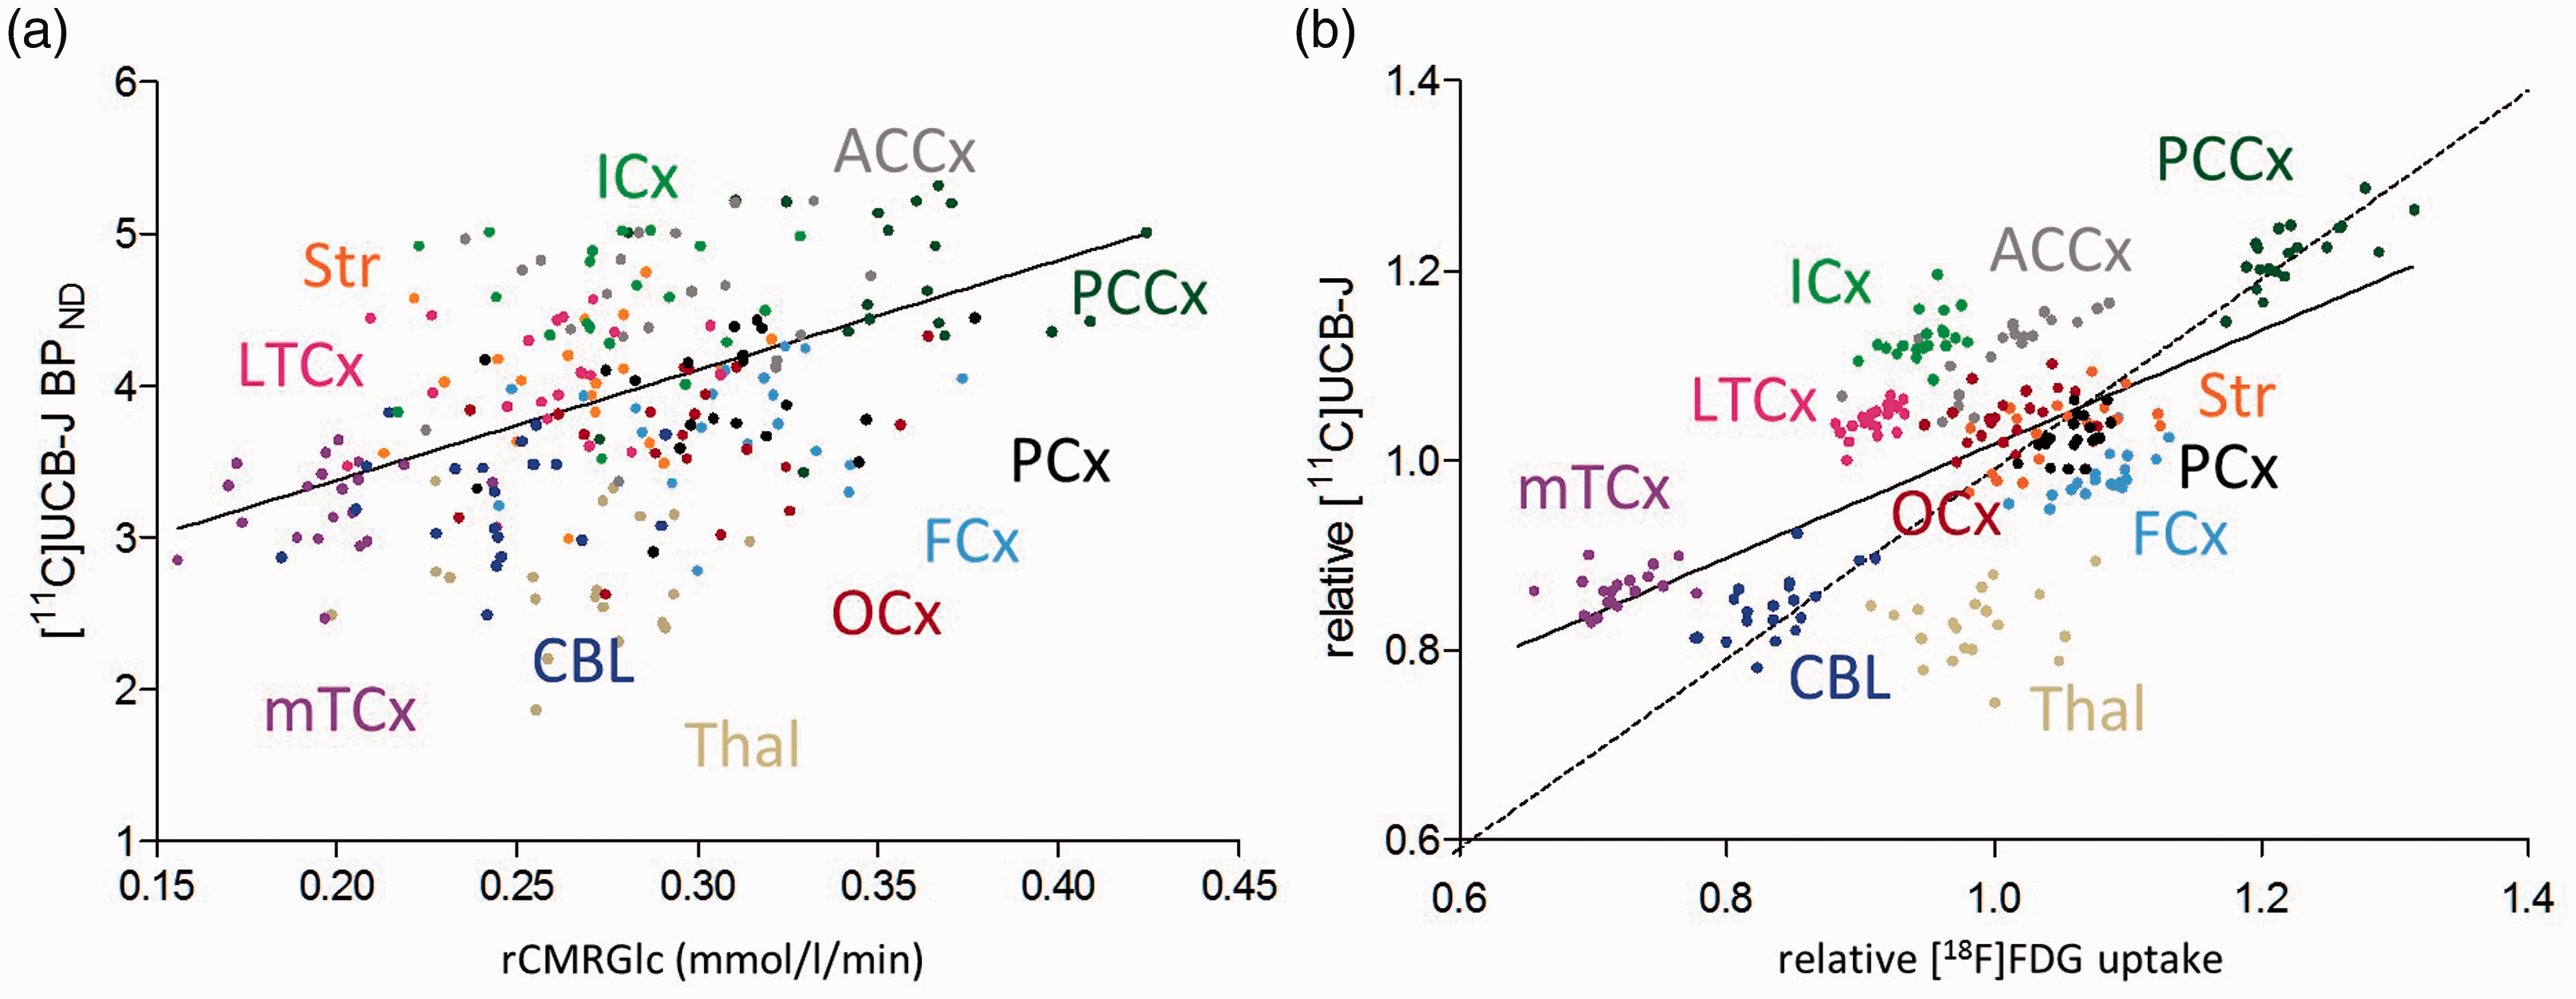
Regional association of absolute (a) and relative (b) [18F]FDG and [11C]UCB-J data across all individual VOIs (correlation significance: (a) Spearman r = 0.47 and P < 0.0001 and (b) Spearman r = 0.52 and P < 0.0001). ACCx: anterior cingulate cortex; BPND: binding potential (non-displaceable); CBL: cerebellum; FCx: frontal cortex; ICx: insular cortex; LTCx: lateral temporal cortex; mTCx: medial temporal cortex; OCx: occipital cortex; PCCx: posterior cingulate cortex; PCx: parietal cortex; rCMRGlc: regional cerebral metabolic rate of glucose; Str: striatum; Thal: thalamus.
After scaling the parametric images to the global mean value of grey matter, the correlation across all VOIs remained significant (r = 0.52, p < 0.001) (Figure 1(b)), with a reduced inter subject variability within each VOI. On a VOI-level, significant correlations between relative [18F]FDG and [11C]UCB-J uptake were found for the posterior cingulate cortex (r = 0.67, pcor = 0.013), anterior cingulate cortex (r = 0.86, pcor = 0.001), frontal cortex (r = 0.68, pcor = 0.010) and lateral temporal lobe (r = 0.61, pcor = 0.042) (all p-values were corrected for the number of VOIs using the Bonferroni procedure).
Regional ratio of glucose metabolism and synaptic density
Figure 2 shows the relative distribution of [18F]FDG and [11C]UCB-J, normalized for the average whole-brain grey matter uptake for each tracer. This can be quantitatively visualized by voxel-based parametric difference maps as shown in Figure 3(a) (paired t-test map between relative [18F]FDG versus [11C]UCB-J maps shown as surface projection). As can be observed from Figure 2 and Figure 3(a), these t-maps show that, compared to relative [18F]FDG uptake, higher relative [11C]UCB-J binding was found symmetrically, mainly in the medial temporal lobe, anterior cingulate cortex and orbitofrontal cortex, brain stem and inferior and middle temporal neocortex extending to the secondary temporooccipital cortex. The highest difference was situated in the amygdala. Inversely, higher relative [18F]FDG uptake was observed also symmetrically in the posterior cingulate cortex, precuneus, lateral parietal cortex, motor, premotor and dorsolateral frontal cortex, as well as in the thalamus and upper cerebellar cortex, with the highest difference in the left inferior frontal gyrus (Figure 3(a)).
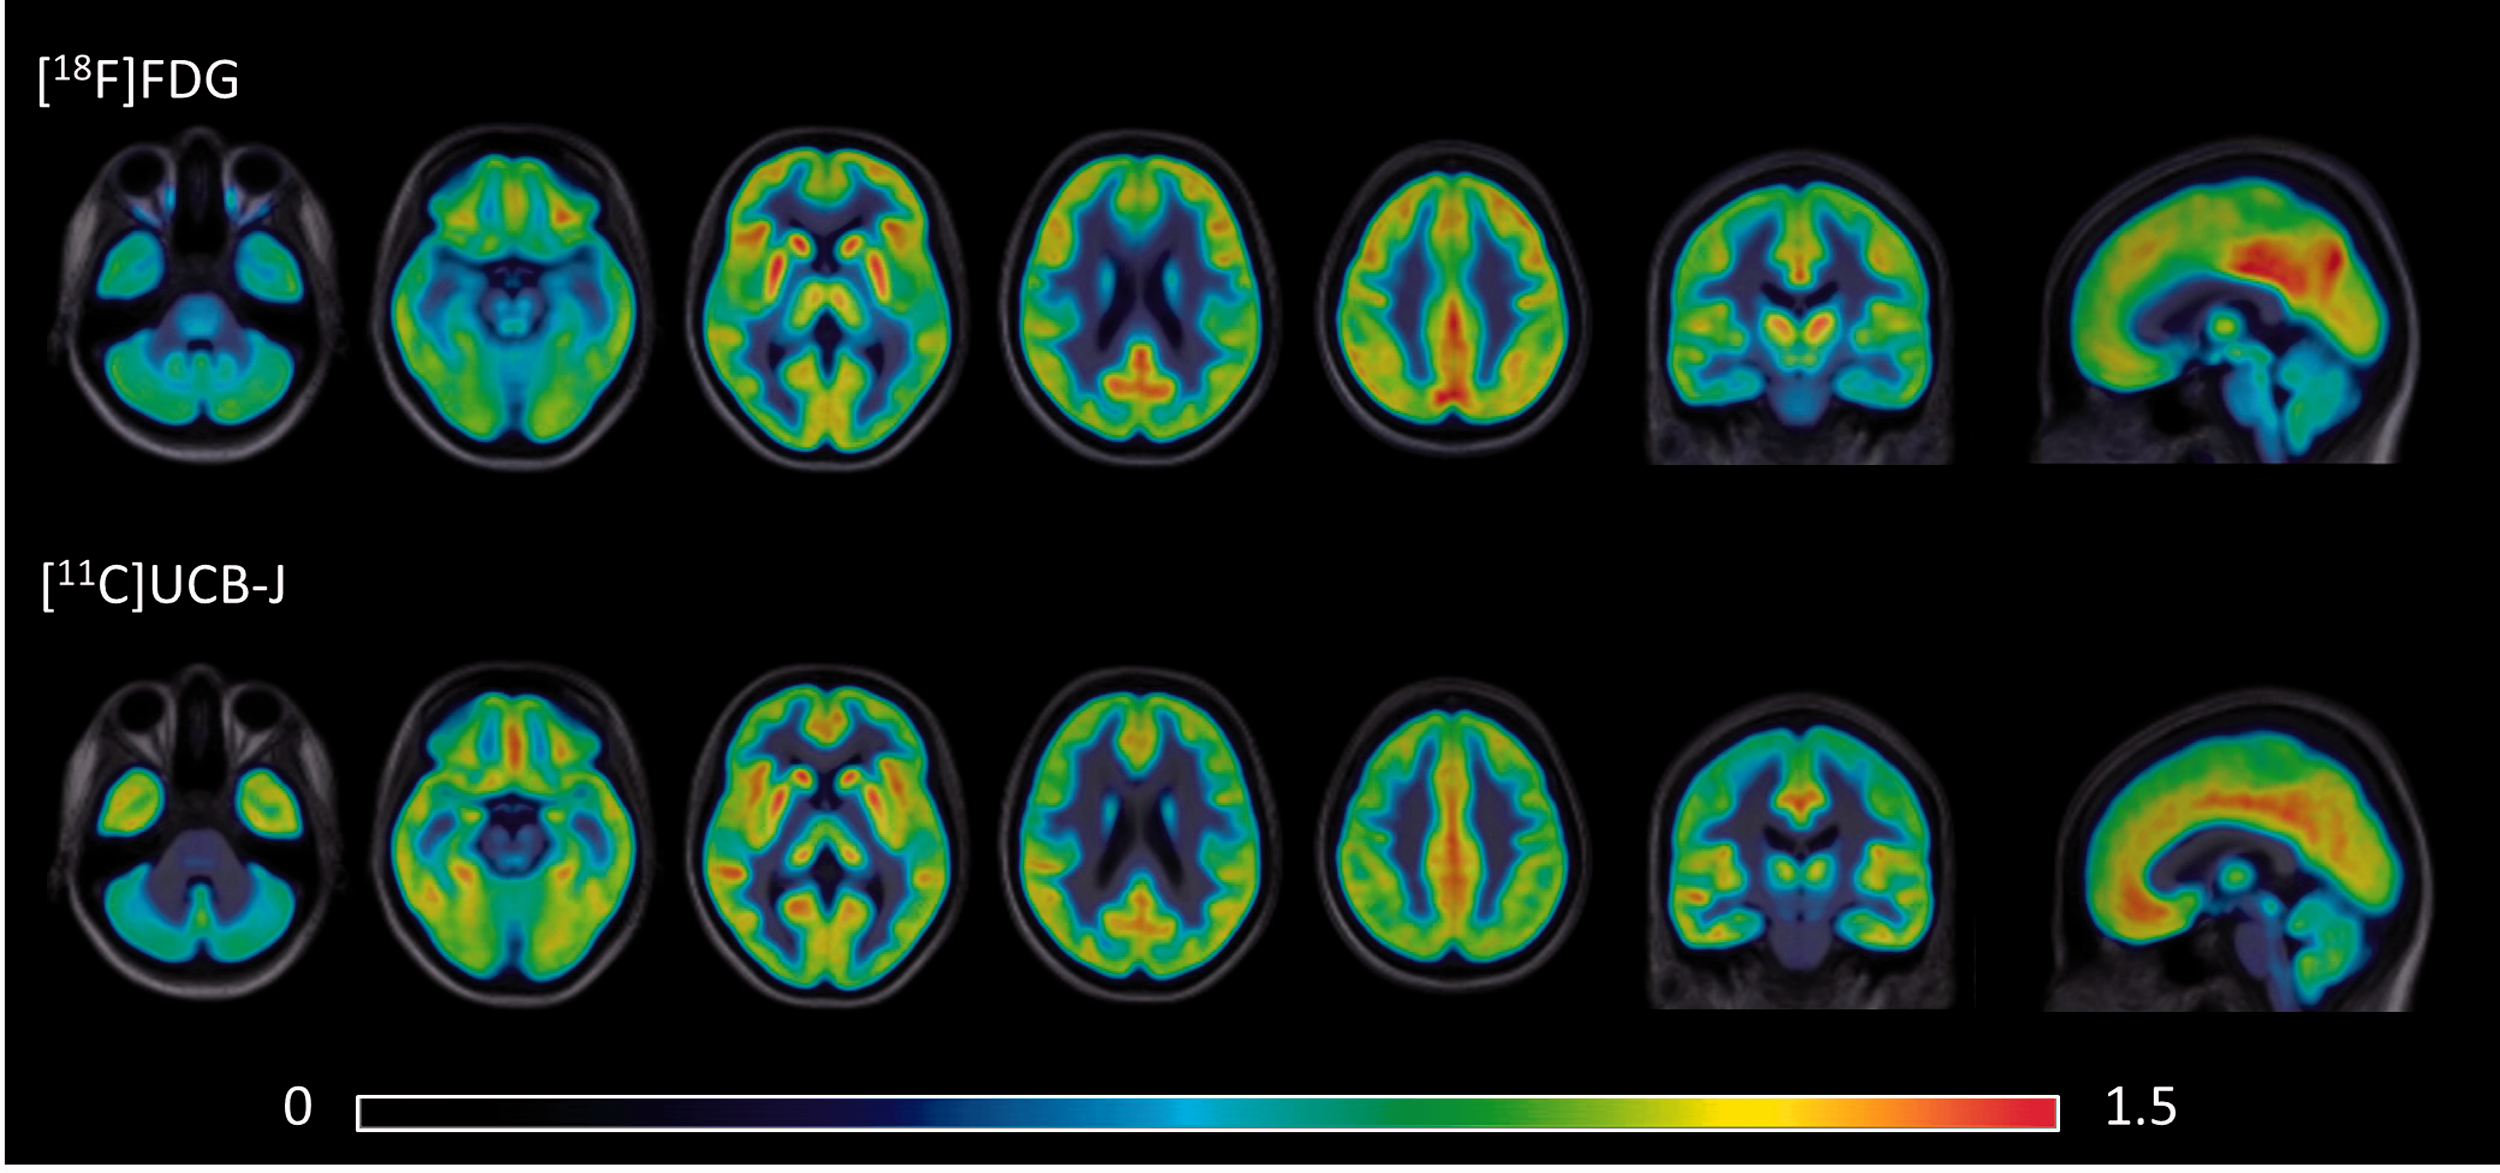
Relative [18F]FDG uptake (upper row) and relative [11C]UCB-J binding (lower row) for 20 healthy young subjects, projected on the group’s average 3 D T1 MR.
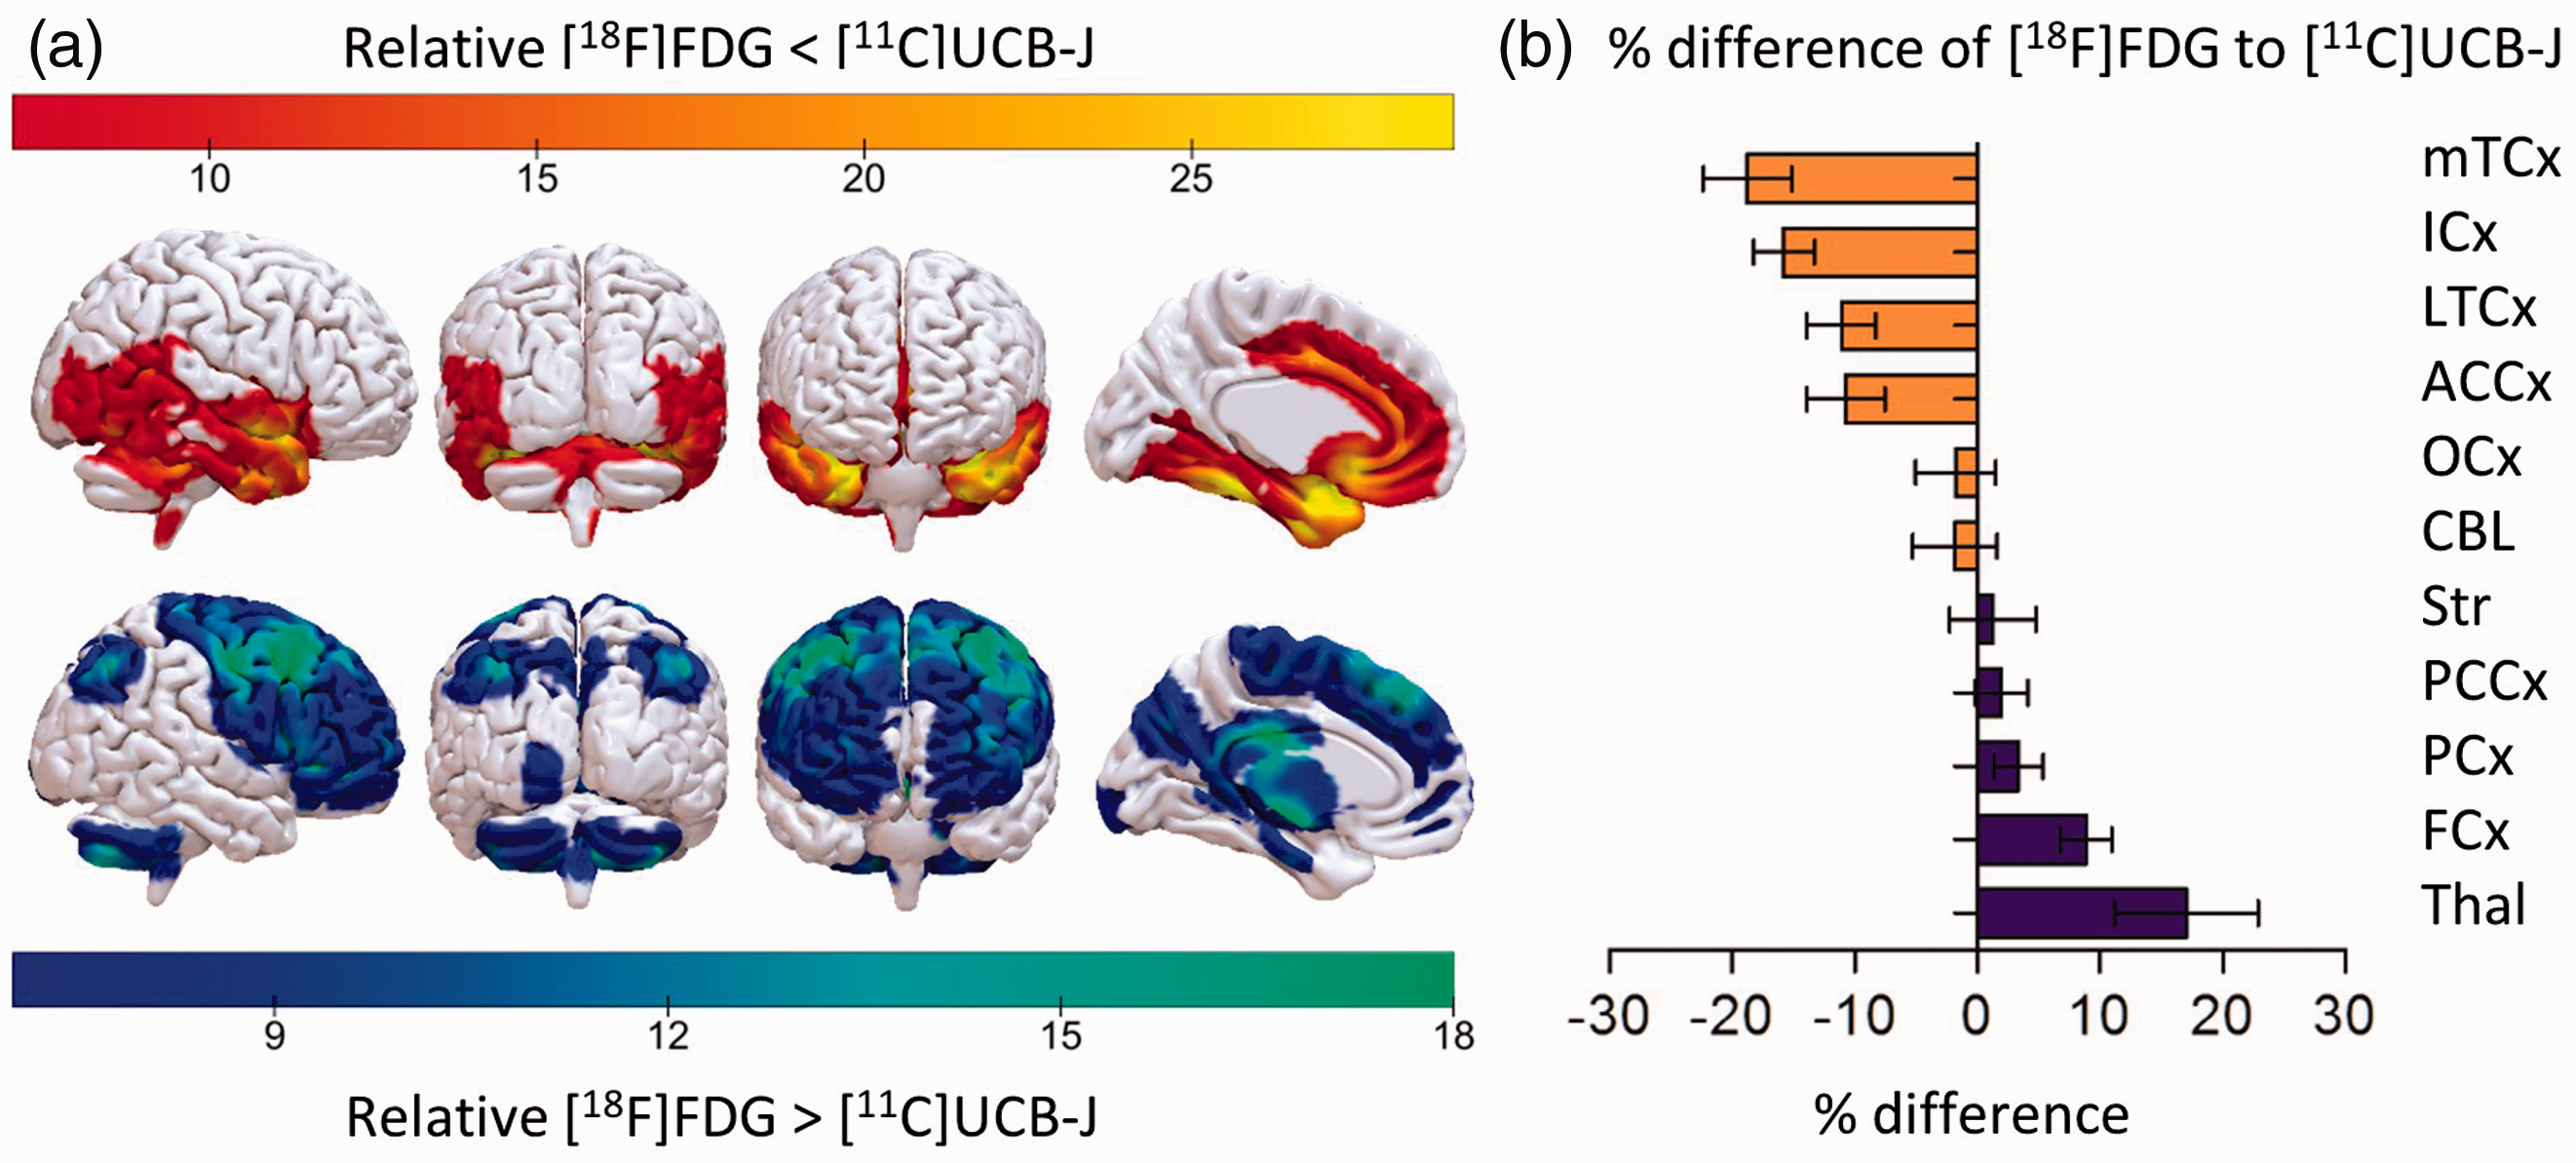
(a) SPM paired t-statistic parametric maps of relative [18F]FDG uptake < [11C]UCB-J uptake (upper row) and [18F]FDG > [11C]UCB-J (bottom row). Only significant clusters with pFWE < 0.05 are shown. Data are overlaid on a brain template in Surf Ice (https://www.nitrc.org/projects/surfice/). Colour bars above and below the figure represent the t-value. (b) Percentage difference of [18F]FDG over [11C]UCB-J for the main VOIs. Note that for the occipital and cerebellar VOI, different ratios are found in subregions, cancelling out the overall effect. Error bars represent the standard deviation between subjects. ACCx: anterior cingulate cortex; CBL: cerebellum; FCx: frontal cortex; ICx: insular cortex; LTCx: lateral temporal cortex; mTCx: medial temporal cortex; OCx: occipital cortex; PCCx: posterior cingulate cortex; PCx: parietal cortex; Str: striatum; Thal: thalamus.
These findings were confirmed in a VOI-based group comparison, which resulted in significantly higher relative [11C]UCB-J binding compared to [18F]FDG in the medial and lateral temporal cortex, anterior cingulate cortex, and insular cortex, with a maximal difference in the medial temporal cortex (19%). In contrast, significantly higher relative [18F]FDG compared to [11C]UCB-J was found in the frontal cortex, parietal cortex, posterior cingulate cortex and thalamus, with a maximal difference in the thalamus (17%) (Figure 3(b), Table 1).
Regional relative [18F]FDG versus [11C]UCB-J uptake.
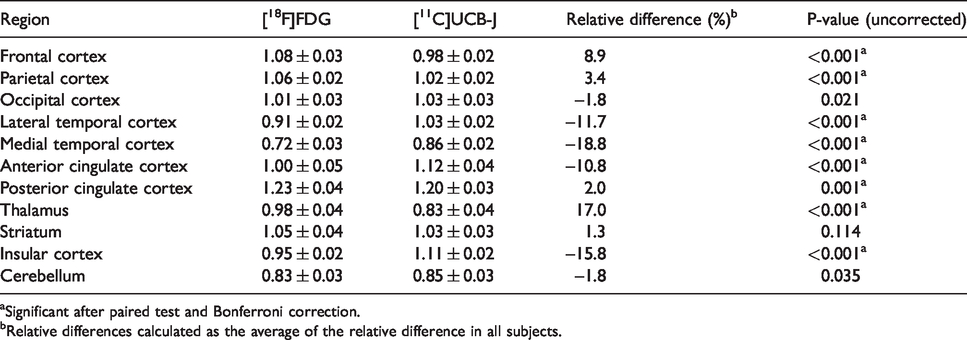
aSignificant after paired test and Bonferroni correction.
bRelative differences calculated as the average of the relative difference in all subjects.
Discussion
In healthy adults, both absolute and relative rCMRGlc and synaptic density are thus overall significantly correlated in the human brain in vivo. This is in agreement with our primary hypothesis that neurotransmission energetics are the major determinant of glucose metabolism and therefore regions with elevated SV2A binding show higher glucose metabolism in absolute terms. This study adds to previous findings in baboons, 22 showing a significant correlation of the same magnitude (r = 0.61) between glucose metabolism and the synaptic vesicle protein synaptophysin. 22 The latter is highly correlated with SV2A in terms of cellular and brain distribution. 11 These findings also show that resting-state glucose consumption can be considered as coupled to excitatory (glutamatergic) and inhibitory (GABA-ergic) synaptic activity as this can be considered the main determinant of brain energy demand. 5 , 34
However, a substantial regional variation between rCMRGlc and synaptic density was observed, with up to 19% differences in relative measures. The pattern of higher relative [18F]FDG uptake in the dorsolateral frontal, prefrontal, high parietal and precuneus areas is strikingly similar to the regional cerebral distribution of areas characterized by a higher amount of aerobic glycolysis at rest observed by Vaishnavi et al. 35 Moreover, the regional cerebral distribution in these areas visually largely overlaps with the default mode brain network and the frontoparietal networks. Under normal oxygen tension, neurons use glucose for oxidative phosphorylation and efficient production of ATP through the Krebs cycle. Aerobic glycolysis with the production of lactate (Warburg effect) is an alternative way of glucose use in addition to glucose use for oxidative phosphorylation. 35 This accounts for 10–12% of the glucose consumption in the adult human brain 36 but it is not strictly related to regional energy metabolism. 35 In line with these findings, studies on cerebral energy demand have shown that frontoparietal regions exhibit the highest relative cost. The relative cost is a measure of regional glucose metabolic rate versus fMRI blood oxygen level dependent signal (BOLD) as a measure for neural activity, both acquired at rest. Higher relative costs can be attributed to aerobic glycolysis and/or greater engagement or density of neuroglial cells. 35 , 37 As our findings show more extensive differences, including motor and premotor areas, cerebellar cortex and the thalamus, this may be indicative that these motor and relay grey matter also involve higher energetic costs, undetected in previous studies.
Similarly, the lower aerobic glycolysis observed in the MTL, anterior cingulate cortex and insular cortex, 35 is in line with our findings of lower glucose metabolism relative to the synaptic density in the medial temporal cortex with hippocampus and amygdala. Our findings also show lower ratio’s extending to the lateral temporal cortex, a region known for lower relative energy expenditure. 8
Other factors may also contribute to the observed regional differences. For example, the higher glucose metabolism over synaptic density ratio in the cerebellum may be due to the relative distribution of neurons versus non neuronal cells. Whereas the cerebrum contains about 20% of the brain’s neurons and nearly 72% of its non-neuronal cells, this is reversed in the cerebellum to 80% and 19%, respectively. 38
The dependence on glutamate (and the more limited impact on energy-requiring ion gradients at inhibitory synapses) may also explain why regional glucose metabolism is mainly driven by the activity of excitatory synapses. 39 It can be assumed that [11C]UCB-J binding potential is related to the number of vesicles independent of which neurotransmitter they contain. This is because SV2A is expressed ubiquitously in all presynaptic terminals, in particular in both glutamatergic and GABAergic neurons which represent the largest fractions of neurons. 9 Therefore, the regional varying ratio of excitatory versus inhibitory synapses might induce the differences in regional uptake between both tracers. In the MTL, anterior cingulate cortex and insular cortex, neuroreceptor maps based on autoradiography results show particularly increased density of the GABAB receptor. Of note, GABAB receptors in general reach higher densities (up to twice) than GABAA receptors. 40 , 41 Activation of presynaptic GABAB receptors also induces an inhibitory response through hyperpolarization, suppresses vesicular release and thus decreases synaptic glutamate concentration, which can negatively impact glucose metabolism at resting state. 42
A future challenge will be to better understand why levels of synaptic density and glucose metabolism can vary so much between brain systems. It is still unclear how the present findings translate to neuronal development (where the contribution of aerobic glycolysis gradually decreases to the 10–12% in the adult brain), to a range of behavioural states such as sleep, awake, under anaesthesia or to disease states. For example, in neurodegeneration, loss of neurons and synaptic activity is expected to result in reduced energy demands, but astroglial and microglial proliferation contributions may counteract this effect on metabolic deficits. 39 , 43 Studying various disorders may therefore enhance our understanding on glucose metabolism versus synaptic density changes. In particular, the higher relative synaptic density versus relative glucose metabolism ratio in the MTL is of special interest in several neurodegenerative disorders such as Alzheimer’s disease. In Alzheimer’s disease, large changes in MTL synaptic density have been observed, 44 , 45 despite the limited presence of consistent glucose hypometabolism. 46 This therefore also suggests that [11C]UCB-J might be more sensitive as biomarker within the MTL especially in early disease stages, in particular as the SV2A target is not influenced by other accompanying energy consuming processes such as neuroinflammation. 47 , 48 Moreover, alterations in the balance between excitatory and inhibitory synapses may underly changes in regional glucose metabolism in brain disorders. In a kainic-acid induced temporal lobe epilepsy rat model, Jupp et al. 49 found a strong relationship between decreased hippocampal glucose metabolism and elevated expression of synaptophysin, five weeks after status epilepticus. This could be explained by a decrease in postsynaptic inhibition and altered levels of excitability due to novel synaptogenesis. The dynamics between synaptic density and glucose metabolism in acute and subacute disorders such as epilepsy and stroke may therefore provide novel opportunities to further understand this balance, ideally when synaptic density imaging can be combined with GABA-ergic or glutamatergic markers. 50 , 51
A number of limitations need to be addressed. First, the study used a simplified model to quantify [11C]UCB-J binding. For [11C]UCB-J, the centrum semiovale (CS) has been validated as a suitable reference region in healthy conditions and Alzheimer’s disease by several groups and SUVR60-90min − 1 can therefore be seen a valid proxy for [11C]UCB-J BPND. 25 , 29 , 52 Second, a simplified kinetic model was also used to calculate rCMRGlc in our population with reference to a single individual venous sample. Using simultaneous eASL measurements with the used PET-MR system, we have shown that the absolute ASL perfusion maps indirectly support the validity of the Hunter method which uses a single venous sample to scale the [18F]FDG PET signal to approximate the net influx rate constant and rCMRGlc on a group level. 27 , 53 This has also been shown in patient groups. 54 In the ASL-glucose metabolism correlation analysis, we excluded subcortical (striatal and thalamic) regions, as it is known that for the acquired triple-plane tagging sequence, perfusion through the smaller lenticulostriate and thalamic deep branches is underestimated, due to faster mean transit time and partial volume effects with thick transverse slabs. 55 , 56 Several studies have shown good agreement between quantitative [15O] H2O PET as gold standard and ASL MR, indicating validity of these measures especially in cortical regions and in resting conditions, where good to excellent correlations have been described. 57 , 58
In this study, only young female healthy subjects were included. As for the effect of ageing, many studies have shown decline of cortical glucose metabolism with healthy ageing, in particular in frontal and parietal brain regions, even after partial volume correction.59–62 On the other hand, it is unclear whether synaptic density decreases with age. Most post-mortem studies on synaptic density markers found no decrease with healthy ageing, with the exception of one report suggesting a decrease of synaptophysin in the frontal cortex in elderly subjects.63–66 An ongoing study at our center in 78 adult healthy volunteers did not show alterations with age between 19-78 years after partial volume correction, except in the caudate (data available on request, currently unpublished). Second, sex-specific effects on glucose metabolism and brain atrophy resulted in mixed findings with some studies suggesting increased vulnerability of ageing in men, but overall this has at most a second-order modulatory effect on healthy ageing. 59 ,67–70 So far, no sex-related differences have been reported for SV2A PET, in keeping with our own [11C]UCB-J database where no significant gender effect or modulation with ageing was observed (data available on request, currently unpublished). To address potential age and gender effects, further studies with [11C]UCB-J and [18F]FDG should be performed, especially in elderly subjects, to confirm the findings of the current study.
In conclusion, we found an overall positive correlation between [11C]UCB-J SV2A binding as marker for synaptic density and glucose metabolism in the human brain at rest. Nevertheless, on a regional basis, brain areas with predominant aerobic glycolysis in resting state as well as motor-related areas show a significantly higher degree of glucose metabolism relative to regional synaptic density, while the MTL and the lateral temporal cortex have an up to 19% higher synapse density per unit of glucose metabolism. Further studies are needed to elucidate the impact of this discrepancy in various behavioural states and in neurological and psychiatric disorders.
Supplemental Material
sj-pdf-1-jcb-10.1177_0271678X20981502 - Supplemental material for In vivo synaptic density relates to glucose metabolism at rest in healthy subjects, but is strongly modulated by regional differences
Supplemental material, sj-pdf-1-jcb-10.1177_0271678X20981502 for In vivo synaptic density relates to glucose metabolism at rest in healthy subjects, but is strongly modulated by regional differences by June van Aalst Jenny Ceccarini, Stefan Sunaert, Patrick Dupont, Michel Koole and Koen Van Laere in Journal of Cerebral Blood Flow & Metabolism
Footnotes
Acknowledgements
We thank all the participants for their willingness to participate in the study. The authors are also grateful to Kwinten Porters and Jef Van Loock for their contribution to the scanning and data handling and the PET radiopharmacy team, the MR radiology team and medical physics team of UZ Leuven for their skilled contributions.
Author’s contributions
JvA, KVL designed the study. JvA, KVL, MK performed research. JvA, KVL, JC, MK, PD, SS analysed data. JvA, KVL wrote the paper. All authors critically revised the intellectual content of the manuscript.
Funding
The author(s) disclosed receipt of the following financial support for the research, authorship, and/or publication of this article: JC is a postdoctoral fellow of FWO (Research Foundation Flanders).
Declaration of conflicting interests
JvA, PD, JC, and SS declare no conflicting interests. MK has performed contract research through KU Leuven for UCB and Merck. KVL has performed contract research through KU Leuven for Merck, Janssen Pharmaceuticals, Abide, UCB, Cerveau, Syndesi, Eikonizo, Novartis, GE Healthcare and Curasen: he has received speaker fees from GE Healthcare.
Supplementary material
Supplemental material for this article is available online.
References
Supplementary Material
Please find the following supplemental material available below.
For Open Access articles published under a Creative Commons License, all supplemental material carries the same license as the article it is associated with.
For non-Open Access articles published, all supplemental material carries a non-exclusive license, and permission requests for re-use of supplemental material or any part of supplemental material shall be sent directly to the copyright owner as specified in the copyright notice associated with the article.