
Abstract
Normal aging is associated with the degeneration of specific neural systems. We used [18F]fluorode-oxyglucose (FDG)/positron emission tomography (PET) and a statistical model of regional covariation to explore the metabolic topography of this process. We calculated global and regional metabolic rates for glucose (GMR and rCMRglc) in two groups of normal subjects studied independently on different tomographs: Group 1—130 normal subjects (62 men and 68 women; range 21–90 years); Group 2—20 normal subjects (10 men and 10 women; range 24–78 years). In each of the two groups, the Scaled Subprofile Model (SSM) was applied to rCMRglc data to identify specific age-related profiles. The validity of these profiles as aging markers was assessed by correlating the associated subject scores with chronological age in both normal populations. SSM analysis disclosed two significant topographic profiles associated with aging. The first topographic profile, extracted in an analysis of group 1 normals, was characterized by relative frontal hypometabolism associated with covariate metabolic increases in the parietooccipital association areas, basal ganglia, mid-brain, and cerebellum. Subject scores for this profile correlated significantly with age in both normal groups (R2 = 0.48 and 0.33, p < 0.0001 for groups 1 and 2, respectively). Because of clinical similarities between normal motoric aging and parkinsonism, we explored the possibility of shared elements in the metabolic topography of both processes. We performed a combined group SSM analysis of the 20 group 2 normals and 22 age-matched Parkinson's disease patients, and identified another aging-related topographic profile. This profile was characterized by relative basal ganglia hypermetabolism associated with covariate decreases in frontal premotor cortex. Subject scores for this profile also correlated significantly with age in both normal groups (group 1: R2 = 0.30, p < 0.00001; group 2: R2 = 0.59, p < 0.01). Healthy aging is associated with reproducible topographic covariation profiles associated with specific neural systems. FDG/PET may provide a useful metabolic marker of the normal agingprocess.
The normal aging process is characterized by differential neuronal loss localized to specific brain regions such as the substantia nigra and the hippo-campal cortex (e.g., Kemper, 1984; Creasey and Rapoport, 1985). Indeed, the motoric and cognitive changes occurring with senescence are thought to reflect underlying age-related degeneration, associated with selected neuronal systems (e.g., McGeer et al., 1977; Bartus et al., 1982; Calne and Peppard, 1987). In spite of this expected anatomical specificity, most positron emission tomographic (PET) studies of brain metabolism have recorded only small declines in overall metabolism with increasing age (Kuhl et al., 1984; Yoshii et al., 1988; Grady et al., 1990; Marchal et al., 1992; Eidelberg et al., 1994). Declines in regional metabolic rates with aging have been found to be similar for all cortical regions (Marchal et al., 1992), or perhaps more pronounced in the frontal cortex (Kuhl et al., 1984; deLeon et al., 1987; Leenders et al., 1990). Only a few prior investigations have specifically explored the relationship between changes in regional interactions and the normal aging process (Horwitz et al., 1986, 1987). Moreover, it is currently unknown to what degree decrements observed with normal aging are attributable to region-specific network effects compared with nonspecific declines affecting all brain areas equally.
In previous studies we have demonstrated the utility of principal components analyses, specifically the Scaled Subprofile Model (SSM; Moeller et al., 1987; Moeller and Strother, 1991; Alexander and Moeller, 1994), in identifying topographic co-variance profiles relating to a variety of neurological and psychiatric conditions (e.g., Eidelberg et al., 1990, 1994; Sackeim et al., 1990, 1993). By separating region-specific from region-independent metabolic contributions to overall brain metabolism, SSM may be an appropriate analytical tool to assess the individual roles of topographic and global effects in normal aging.
In this study we used SSM with quantitative [18F]fluorodeoxyglucose (FDG) and PET to identify global and region-specific effects associated with normal aging. We found that the normal aging process is associated with reproducible topographic profiles whose individual expression is highly correlated with subject age. Moreover, the relationship of brain metabolism to age in normal subjects is due predominantly to these topographic effects.
MATERIALS AND METHODS
Subjects
Group 1:130 normal volunteer subjects [62 men and 68 women, mean age 50.8 ± 17.5 standard deviation (SD), range 21–90 years] were studied with FDG and PET at the National Institute on Aging as part of the Laboratory of Neurosciences Longitudinal Study on Dementia and Healthy Aging. This group included 58 subjects (27 men and 31 women) <50 years and 72 subjects (35 men and 37 women) ≥50 years of age. To assess within subject reproducibility, 22 of these volunteers (10 men and 12 women; mean age 59.4 ± 18.1 years) were subsequently restudied (mean scanning interval 2.4 ± 1.0 years) with FDG/PET. This subset of group 1 subjects was designated group 1a. Recruitment procedures and exclusion criteria for these normal subjects have been described elsewhere (Kumar et al., 1991). PET studies were performed with the Scanditronix PC 1024-7B (Uppsala, Sweden). The performance characteristics of this instrument have been described elsewhere (Daube-Witherspoon et al., 1987). This four-ring BGO (bismuth germanate) brain-dedicated tomograph was used to acquire two sets of interleaving scans of seven slices each parallel to the orbitomeatal (OM) line. PET slice separation was ∼7.5 mm with reconstructed transaxial resolution of 6 mm (full width at half maximum, FWHM). Axial resolution was ∼11 and 8 mm, respectively, for straight and cross slices at the center of the field of view. Subjects were positioned in the tomograph with a thermoplastic headrest with their eyes patched and ears occluded. Global and regional metabolic rates for glucose (GMR and rCMRglc) were calculated for 36 cortical gray matter regions of interest (ROIs) in each cerebral hemisphere, one brainstem ROI, and one ROI in each of the two cerebellar hemispheres, as described previously (Grady 1991; Kumar et al., 1991).
Group 2: 20 normal volunteer subjects [10 men and 10 women; mean age ± SD, 47.0 ± 17.1 years, (range 24–77 years)] were studied with FDG and PET at North Shore University Hospital/Cornell University Medical College. This normal group was comprised of 12 subjects (6 men and 6 women) <50 years and 8 subjects (4 men and 4 women) ≥50 years of age. Recruitment procedures and exclusion criteria for these subjects have been described previously (Eidelberg et al., 1994).
PET studies were performed using the Superpett 3000 tomograph (Scanditronix; Essex, MA, U.S.A.). The performance characteristics of this instrument have been described elsewhere (Robeson et al., 1993). This four-ring BaF2 time-of-flight, whole-body tomograph acquires 14 PET slices with Z axis translation. Slice separation was ∼7.5 mm with reconstructed transaxial resolution of 8 mm (FWHM). Axial resolution was ∼8.5 and 6.0 mm, respectively, for straight and cross slices at the center of the field of view. Subjects were positioned in the scanner in a custom-molded headrest with three-dimensional laser alignment with reference to the OM line. All studies were performed with the subject's eyes open in a dimly lit room and minimal auditory stimulation. We calculated GMR and rCMRglc for 13 cortical gray matter ROIs in each cerebral hemisphere, and for 2 cerebellar and 1 brainstem ROI as described previously (Eidelberg et al., 1994).
Because of the difference in spatial resolution in the two tomographs, we elected to combine the smaller ROIs comprising the group 1 datasets into a set of volumetrically larger ROIs corresponding to those acquired in the group 2 PET studies. Because both scanners acquired the same number of PET slices of approximately equal thickness parallel to the OM line, corresponding ROIs could be identified at fixed heights above this line (Grady, 1991). By averaging metabolic values for each ROI across contiguous PET slices, it was possible to condense the group 1 rCMRglc dataset of 75 ROIs into a smaller dataset comprising 29 ROIs in approximately the same positions relative to the OM line as those acquired with the lower-resolution instrument.
Statistical analyses and procedures
Glucose metabolism. In each normal population, aging effects were assessed by comparing GMR and rCMRglc values for young (age <50) and older (age ≥50) subjects using paired Student's t tests. Additionally, in each normal population, the correlation of GMR, rCMRglc, and rCMRglc/GMR values with subject age was assessed by calculating Pearson product-moment correlation coefficients. Because of the large number of correlations examined between regional values and age, the p values obtained for these correlations were adjusted for multiple observations using the Bonferroni correction. The criteria for significance for all the regional analyses was set at p = 0.001.
Additionally, we performed multiple regression analysis of all 29 rCMRglc/GMR measures to predict subject age in group 1 normals (n = 130). We reported R2 values for this analysis with p values corrected for 27 degrees of freedom (df). The resulting multivariate function was subsequently used to predict age in the other subject cohorts, i.e., the function identified in group 1 analysis was applied to predict age in the group la repeat studies and in group 2.
SSM. To determine whether specific patterns of regional metabolic covariation correlated with normal aging, rCMRglc datasets were analyzed using the SSM. This statistical model proposes that, for each subject, each rCMRglc value is composed of two basic elements: (a) a diffuse or regional-independent scaling factor (Global Scaling Factor or GSF) that modulates or scales all regional values for a given individual. The GSF is similar to GMR, but the contributions of the topographic profiles are removed in the calculation of GSF; and (b) independent (unrotated) sets of topographic profiles corresponding to different patterns of covariance among brain regions. The contribution of a particular brain region to a topographic profile, i.e., its relative importance in the covariance relationships within the profile, is quantified by its regional weight on the corresponding topographic profile. Therefore, the topographic profile is a vector of regional values representing the covariance relationships among the brain regions. Because different individuals express these topographic profiles to greater or lesser degrees, SSM computes a subject score (Subject Scaling Factor or SSF) to quantify individual differences in manifesting each topographic profile. In SSM, all parameters are derived by applying the model to the data from the total sample, blind to group membership and subject demographic factors such as age and gender. The mathematical properties of the SSM, its statistical assumptions, and computational procedures have been described in detail elsewhere (Moeller et al., 1987; Moeller and Strother, 1991; Alexander and Moeller, 1994).
In this study we employed two statistical strategies using SSM to identify and validate potential age-related topographic covariance profiles:
Analysis A: SSM analysis of a single sample of normal subjects. We sought to explore whether an age-related topographic profile could be extracted from an SSM analysis of a sample of normal subjects of varying age. Because of the larger number of group 1 subjects, we chose this normal data set for the single-group SSM analysis. The combined rCMRglc data of the group 1 subjects were analyzed using SSM. We performed regression analysis on the Subject Scaling Factors (SSFs) for the independent topographic profiles extracted from the whole-group SSM analysis to determine the linear combination that could best predict chronological age in this normal population. We defined a subject score for this derived aging profile as: SSFA = ΣaiSSFiA, where Σai2 = 1. [Superscripts denote the SSM analysis performed, i.e., (A) analysis of a single group of normal subjects; (B) analysis of a combined group of normals and Parkinson's disease (PD) patients (see later herein). Subscripts refer to the principal components i = 1. …j, where.j is the minimal number of principal components needed to account for at least 50% of the subject × region variance. a1…aj represent the weighting coefficients for each SSFiA used in the linear regression analysis to predict age.] Region weights for topographic profile A, the age-related topographic profile with subject scores SSFA, were calculated by using the regression coefficients a1-aj to create a linear combination of the region weights of the respective topographic covariance profiles. SSFA values were z-transformed and offset to a mean of 0 for the entire group 1 normal control population. The polarity of topographic profile A was oriented so that SSFA values correlated positively with subject age. Because SSFA values for group 1 were derived by multiple linear regression of SSFiA values (n = j), correlations with subject age in this group are given as percent variance accounted for (R2 values) with p values corrected for the number of degrees of freedom (df = j − 2).
To examine whether topographic profile A is a reliable metabolic marker of age, we calculated SSFA values for each of the 22 group la repeat scans and for the 20 group 2 normal studies. The computational procedure for calculating the SSF for a known topographic profile from individual subject rCMRglc data is provided elsewhere (Eidelberg et al., 1995). We computed the correlation between SSFA values obtained in the first and second scans for group 1a subjects as a measure of intrasubject reproducibility. In both group 1a repeat studies and group 2 normals, individually calculated SSFA values were then correlated with age using Pearson product moment correlation coefficients with the corresponding p values. To facilitate comparison of aging correlations with SSFA in all groups of normals, group 1a and 2 age correlations are also presented as percent age variance accounted for, i.e., R2 values.
Analysis B: SSM analysis of a combined sample of age-matched normals and patients with PD. We have previously reported the results of an SSM analysis of rCMRglc data from a combined group of 22 PD patients and 20 age-matched normal volunteers (Eidelberg et al., 1994). Because of physiological and neurochemical similarities between motoric aging and PD (e.g., Mortimer and Webster, 1982; Wolters and Calne, 1989), we considered the possibility that the PD subgroup may be regarded as “motorically hyperaged.” Adding these patients to a cohort of normals might increase the variance associated with age in the combined group, thus allowing for the identification of aging-related topographic profiles with considerably fewer normal subjects. Moreover, this strategy may allow for the specification of covariance patterns associated with selective aspects of normal aging, such as motoric slowing. In an exploratory analysis, we examined this possibility by performing regression analysis on the subject scores (SSFs) for the independent topographic profiles extracted from the combined group analysis to determine the linear combination that could best predict chronological age in the normal subgroup. We performed regression analysis to determine the linear combination of SSF values that were best predictive of normal subject age. This was accomplished by restricting the regression analysis to the 20 group 2 normals within the larger combined group (n = 42). SSFB, the subject score for this linear combination, was defined as σbiSSFiB where σbi2 = 1. (b1…bk are the respective regression coefficients for each of the SSFiB values used to predict age, where k is the minimal number of principal components needed to account for at least 50% of the subject × region variance.) These coefficients in turn were used to determine topographic profile B, the age-related topographic profile with subject scores SSFB, by linear combination of the region weights of the respective topographic profiles. As already mentioned, SSFB values were z transformed and offset to a mean value of 0 for the group 2 normals. Topographic profile B was oriented so that SSFB correlated positively with age. Aging correlations with SSFB are presented as percent age variance accounted for (see previously herein) with p values corrected for the multiple SSF i B covariates (df = k − 2).
We calculated SSFB values on an individual basis for each of the normal subjects comprising group 1 (n = 130) as well as for each of the group 1a repeat studies (n = 22). To assess reproducibility within subjects, we computed the correlation between SSFB values obtained in the first and second scans for group 1a subjects. In both group 1 normals and in group 1a repeat studies, calculated SSFB values were then correlated with subject age by computing Pearson product moment correlation coefficients with corresponding p values. As already mentioned, SSFB correlations with age were presented as percentage of aging variance accounted for (R2 values).
Topographic profile A and topographic profile B region weights were compared by calculating Pearson product-moment correlation coefficients (cf. Eidelberg et al., 1994). In each of groups 1 and 2, SSFA and SSFB subject scores were also compared by correlation analysis. Additionally, in each of these groups, SSFA and SSFB were compared for young (<50 years) and older (≥50 years) subgroups using paired Student's t-tests. All statistical analyses were carried out using SAS (SAS Institute, Cary, NC, U.S.A.).
RESULTS
Glucose metabolism
Mean GMR and rCMRglc values for young (<50 years) and older patients (≥50 years) for each of the normal populations are given in Tables 1 and 2. In both groups, GMR was reduced in the older subjects (p < 0.05). No significant differences in rCMRglc values for subcortical structures were evident in either normal population. In group 1, significant age-related declines in cortical rCMRglc were evident in the medial frontal and frontal opercular areas (p < 0.001). In group 2, no significant age-related cortical declines were evident. In both normal populations, GMR correlated significantly with age (p < 0.05) with a decline of ∼12.5% between ages 20 and 80 years. In group 1, significant negative age correlations were evident in the medial and lateral frontal areas, in the inferior parietal cortex, and in the left lateral temporal and paracentral areas (p < 0.001 for all rCMRglc correlations). In group 2, significant negative correlations between age and rCMRglc were evident only in the paracentral regions (p < 0.001).
Regional and global metabolic rates for glucose (mg/min/100 g) in group 1 (n = 130)

p values <0.001 appear in bold (see text). GMR, global metabolic rate for glucose.
Regional and global metabolic rates for glucose (mg/min/100 g) in group 2 (n = 20)
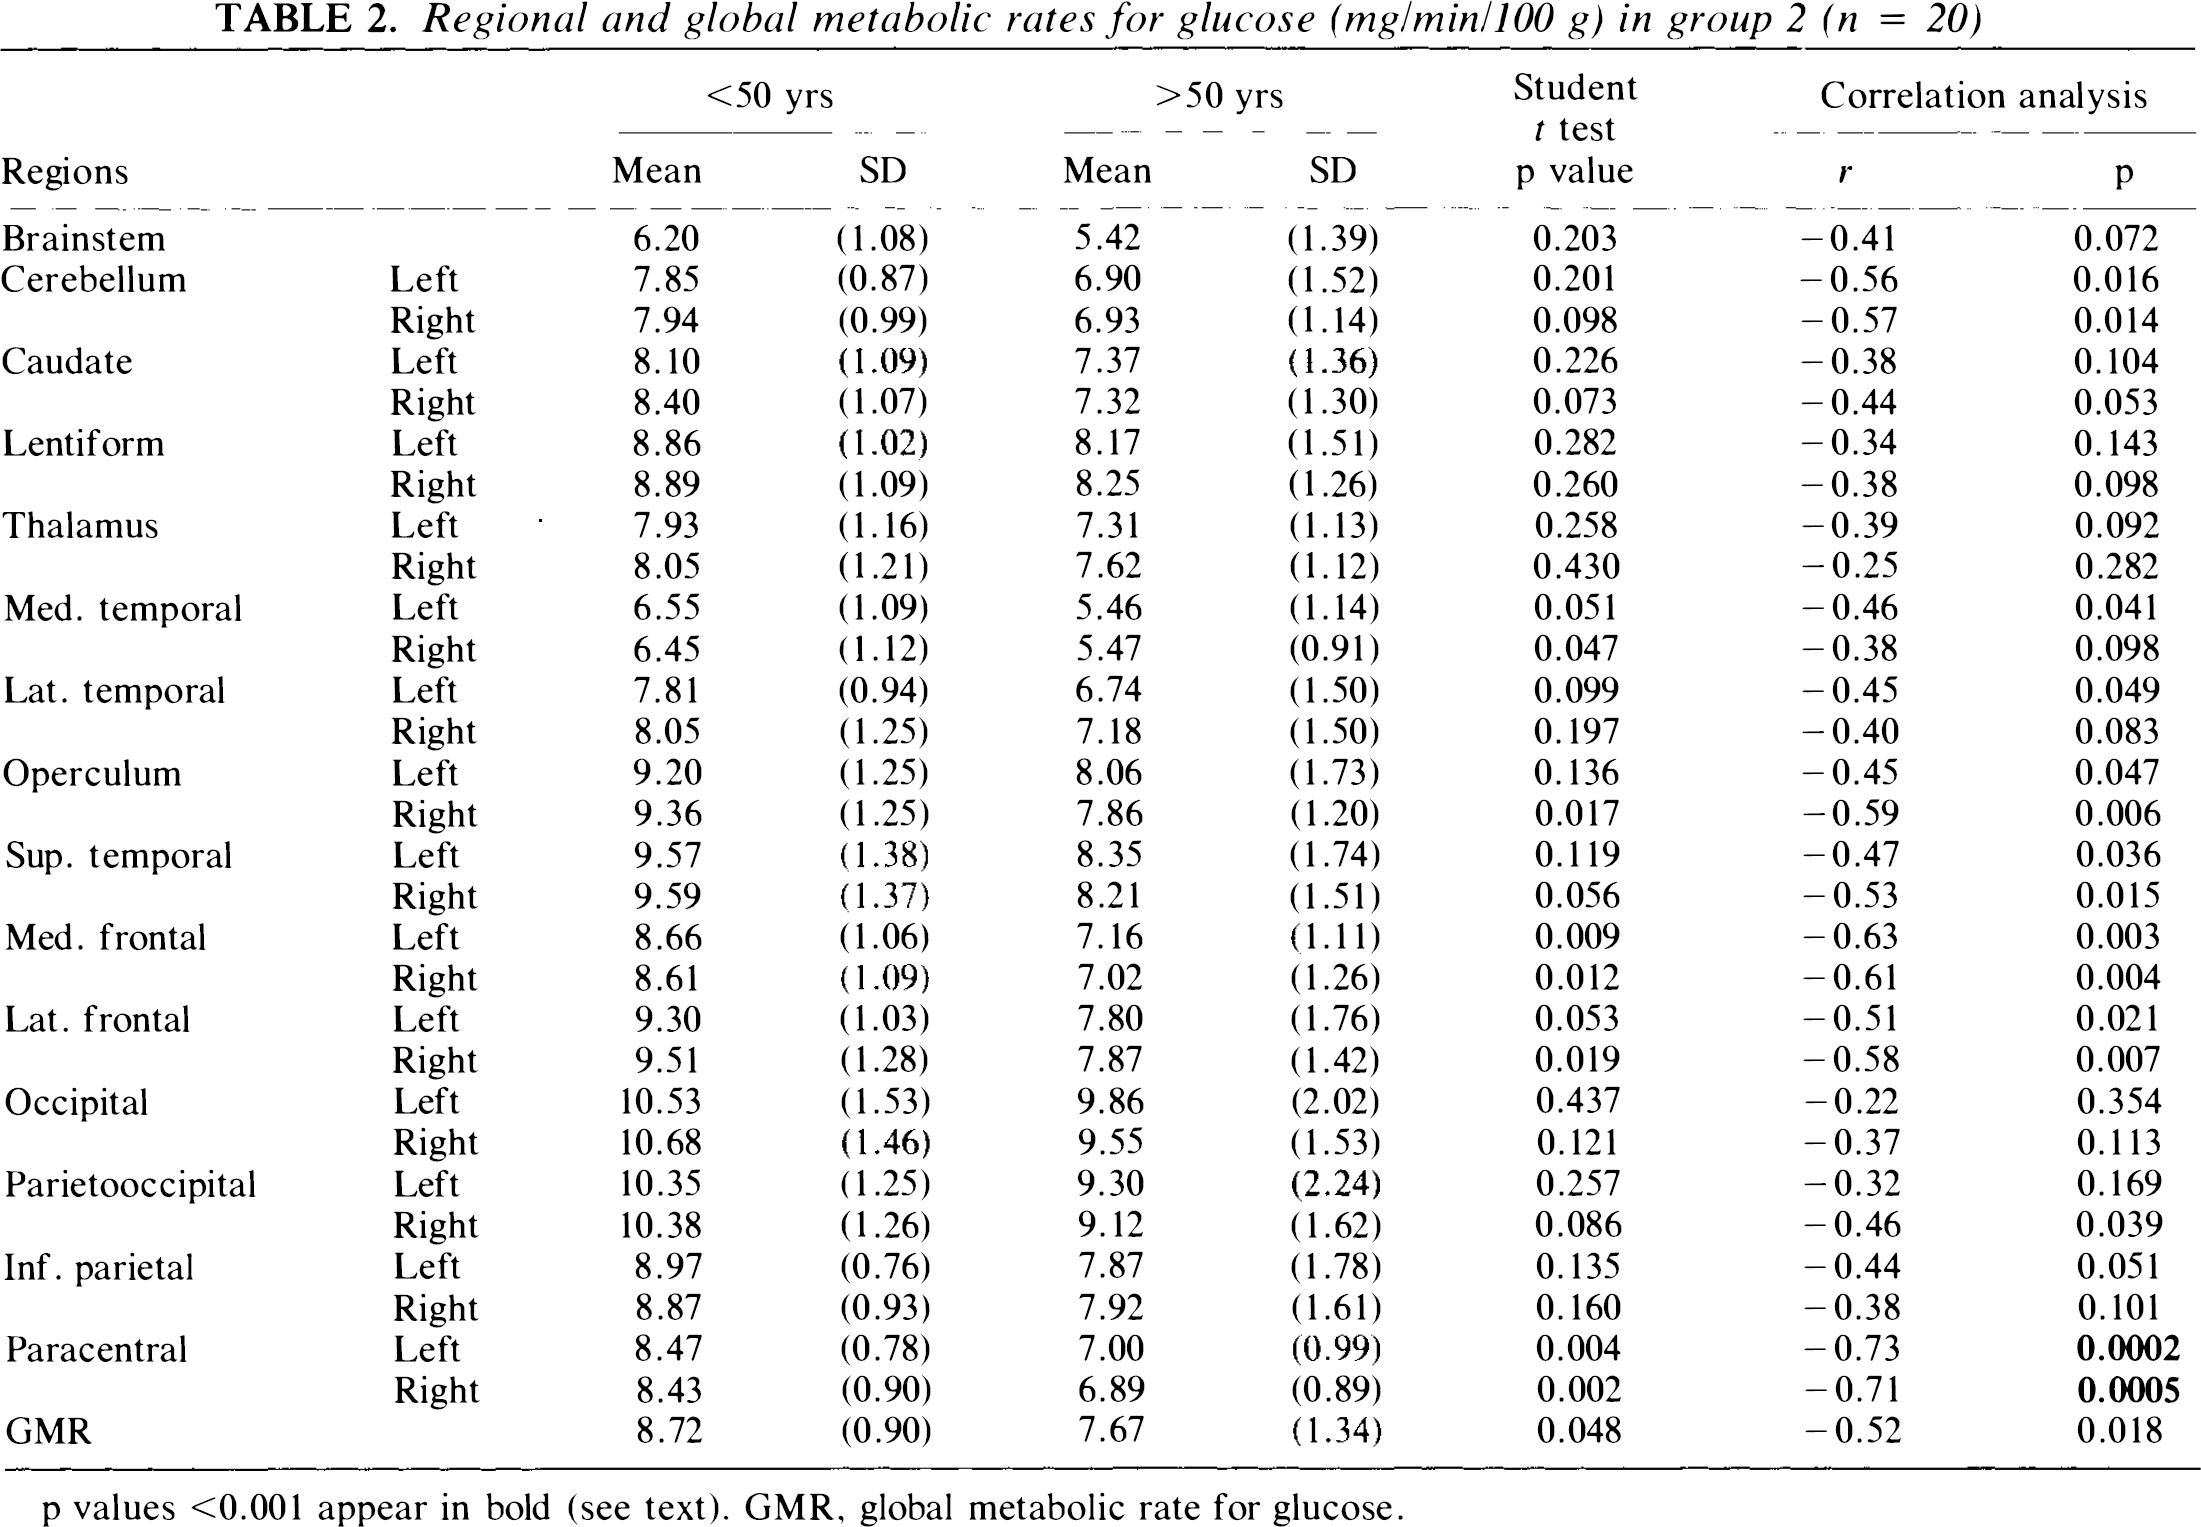
p values <0.001 appear in bold (see text). GMR, global metabolic rate for glucose.
A linear multivariate analysis of rCMRglc/GMR values in group 1 yielded a linear function accounting for 63.1% of aging variance (p < 0.001). Subject scores for this function were highly correlated in group 1a study pairs (r = 0.77, p < 0.0001). These subject scores predicted age in group 1a repeat studies (R2 = 0.57, p < 0.00001), but not in group 2 subjects (R2 = 0.16, p = 0.08).
SSM
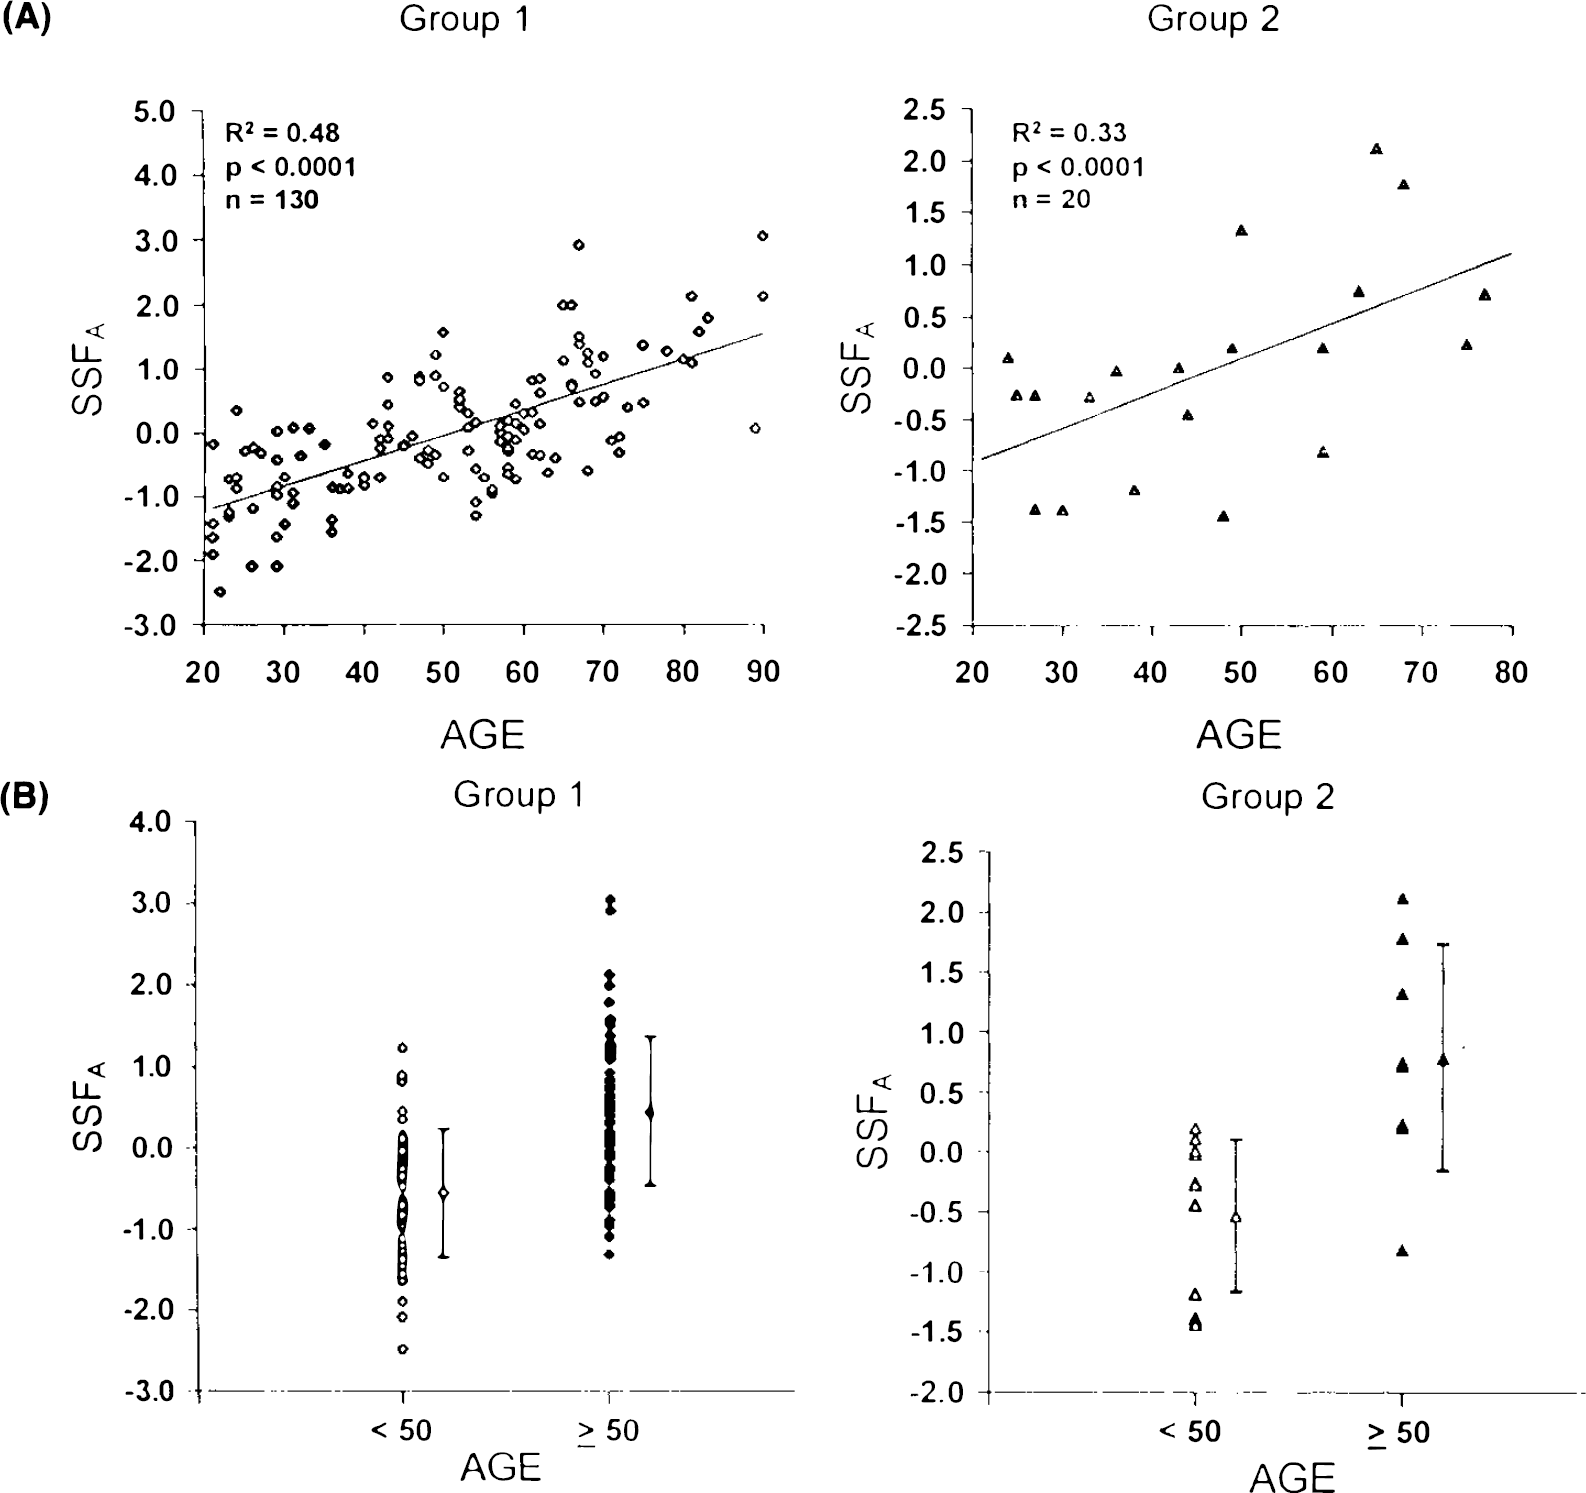
Analysis A: Single group analysis of normal subjects. An SSM analysis of the 130 group 1 normal subjects disclosed five significant topographic profiles accounting for 60.6% of the subject × region variance. Individual differences in manifesting these topographic profiles (SSF1A − SSF5A) accounted for 8.1% of the GMR variance in this normal population. Regression analysis revealed that SSFA, a linear combination of SSF1A − SSF5A, predicted 48% of the aging variance in the group 1 normals (p < 0.0001, multiple linear regression, Fig. 1A). By contrast, GSF effects made no significant contribution to aging variance (R2 = 0.001). Thus, in spite of the small contribution of topographic effects to GMR variance in this population, the significant correlation between GMR and aging appears to be due to topographic rather than global effects.
The regression coefficients a1 − a5 were applied to the respective topographic profile region weights to calculate region weights for the corresponding age-related topographic profile, designated topographic profile A. Region weights for this topographic profile are given in Table 3. Topographic profile A is characterized by relatively decreased activity of the medial frontal and paracentral and opercular regions associated with covariate relative increases in the parietooccipital association areas, basal ganglia, brainstem, and cerebellum. The superior temporal cortex had region weights closest to 0, defining a reference point with which to compare the activity of the other regions (Eidelberg et al., 1994). An isometric display of this pattern (Spetsieris et al., 1993) is presented in Fig. 2. In group 1, SSFA values were also found to be significantly elevated in the older group (p < 0.00001; Fig. 1B).
Region weights for the two topographic profiles for aging
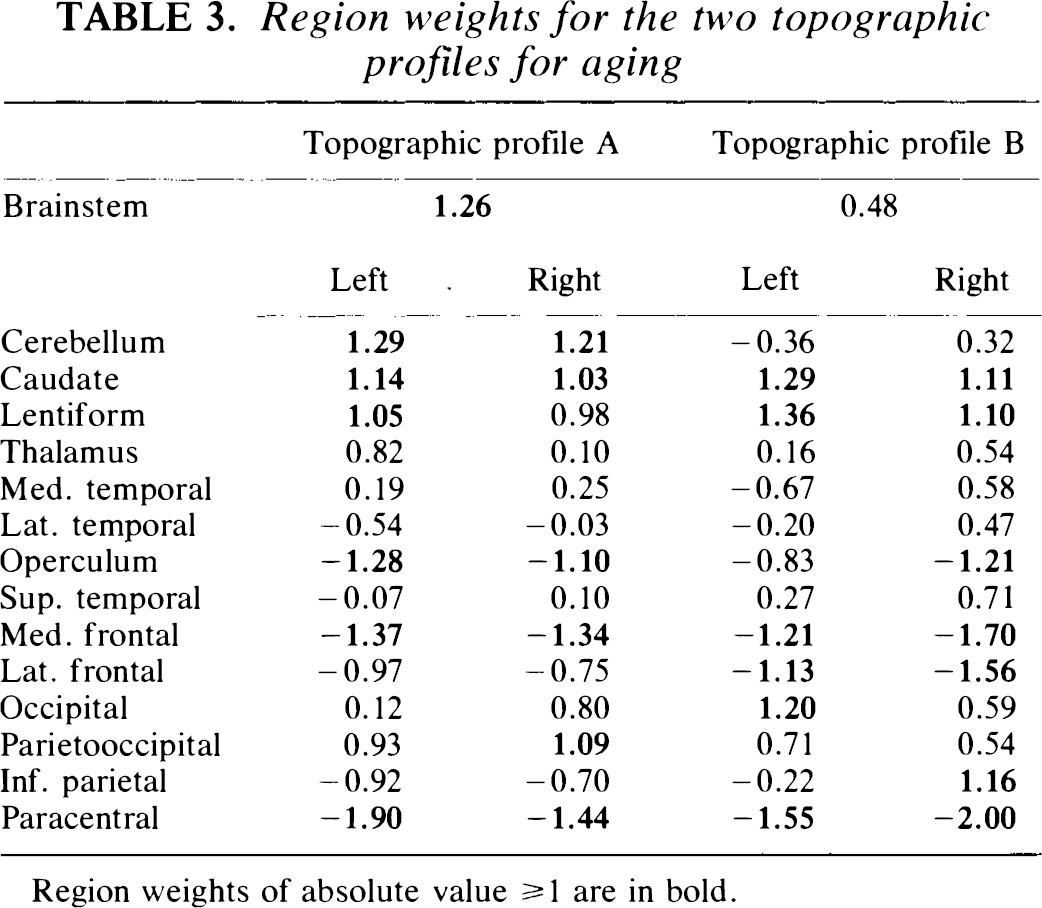
Region weights of absolute value ≥ 1 are in bold.
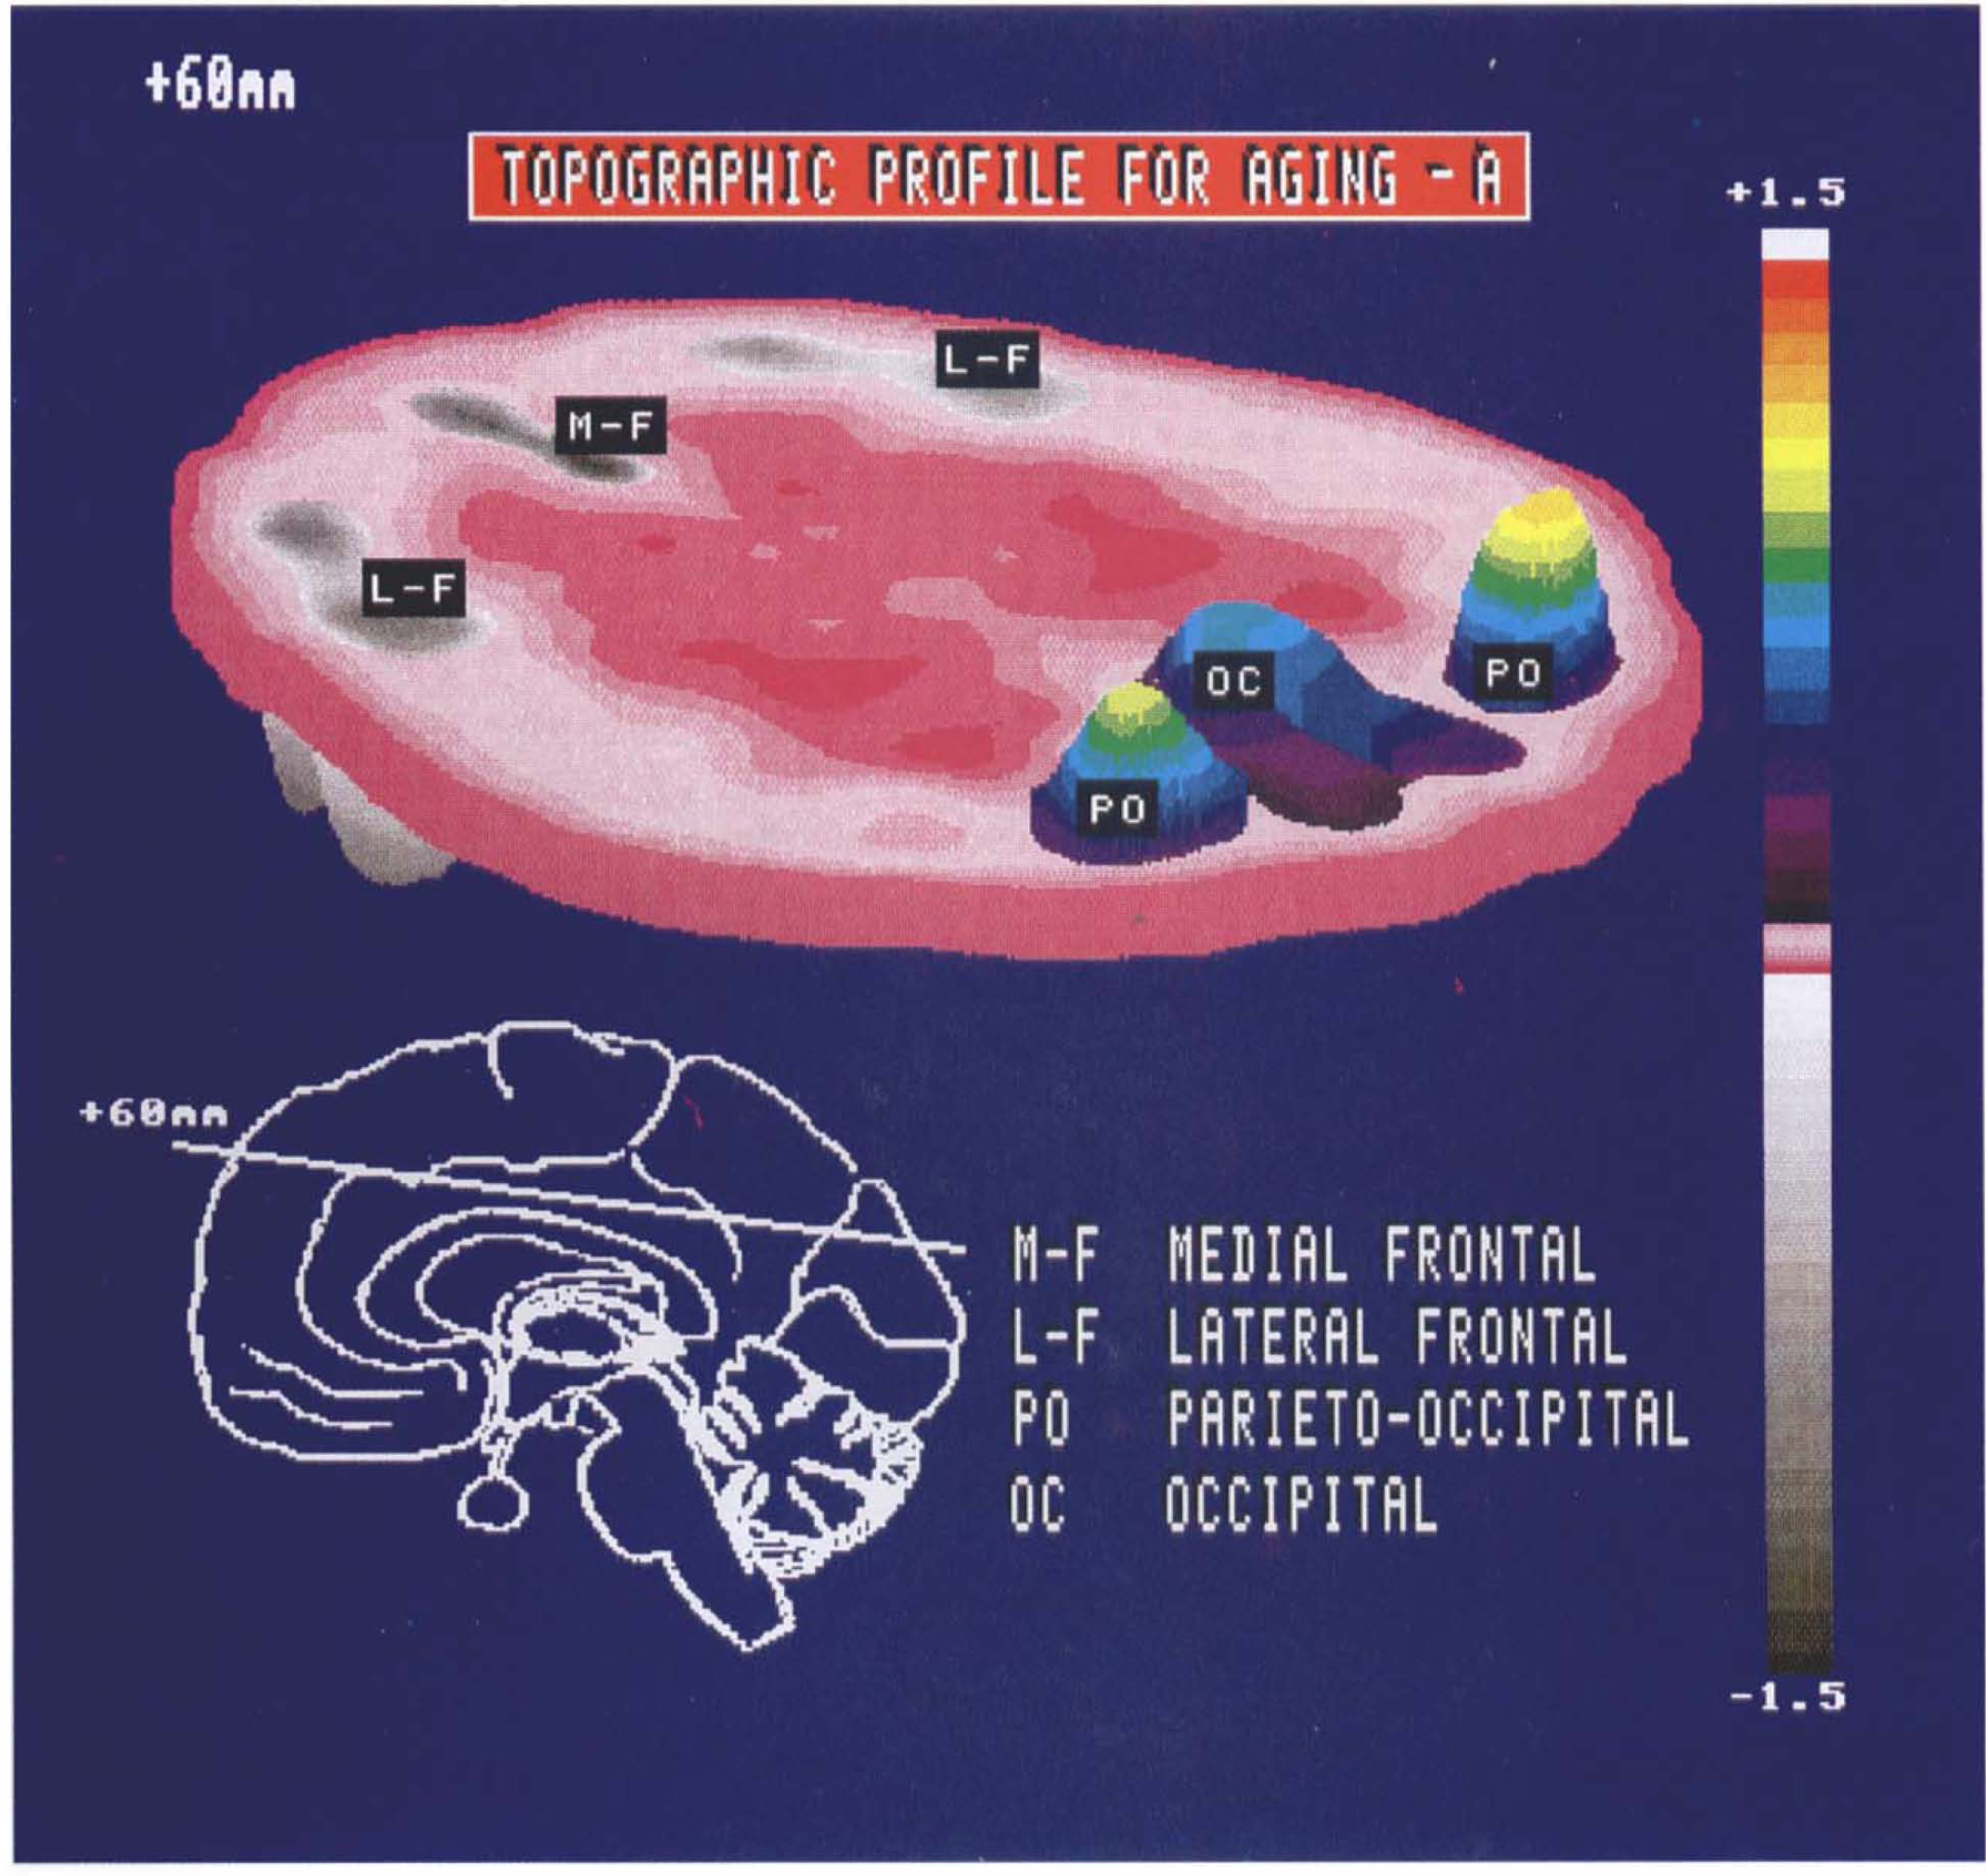
Isometric display of the region weights for topographic profile A on a representative transverse brain slice acquired 60 mm above the orbitomeatal line. The insert (lower left) depicts the midline of this transverse slice on a standardized parasagittal two-dimensional display. An anteroposterior gradient is evident with relative metabolic decreases in frontal cortex (gray scale) covarying with metabolic increases in occipital and parietooccipital association cortices (color scale).
To validate topographic profile A as a metabolic age marker, we applied its region weights to group 1a repeat (n = 22) and to group 2 (n = 20) normative rCMRglc data, and calculated SSFA values for each member of those groups of normals. We found that SSFA values were highly correlated within group 1a scan pairs (r = 0.81, p < 0.00001). We also found that SSFA correlated significantly with age in the group 1a repeat studies (R2 = 0.62, p < 0.00001). These measures were also predictive of age in group 2 normals (R2 = 0.33, p < 0.0001; Fig. 1A) and was significantly elevated in the older subjects (p < 0.005; Fig. 1B).
Analysis B: Combined group analysis of PD patients and normal subjects. An SSM analysis of a combined group of 22 PD patients and 20 normal subjects disclosed five significant profiles that accounted for 63.3% of the subject × region variance.
In the normal subgroup (group 2, n = 20), we found that individual differences in manifesting these five topographic profiles (SSF1B − SSF5B) accounted for 26.9% of the variance in GMR. This indicated that GMR variability in the normal subgroup is due to a combination of global and topographic effects. Regression analysis revealed that a linear combination of SSF1B − SSF5B designated SSFB predicted 59% of the aging variance in group 2 normals (p < 0.01, multiple linear regression; Fig. 3A). By contrast, global effects (GSF) accounted for only 14% of the age variance in this group of normals, suggesting a preponderance of topographic effects in the correlation between GMR and age.

The regression coefficients b1 − b5 were applied to the region weights of the five constituent profiles to obtain region weights for the corresponding age-related pattern, designated topographic profile B (Table 3). Topographic profile B is characterized by relatively increased activity of the caudate and lentiform nuclei associated with covariate decreased activity in frontal and paracentral regions. An isometric display of this pattern is presented in Fig. 4. In addition to correlating closely with subject age, mean SSFB values were significantly elevated in the older subgroup of the group 2 normals (p < 0.00001; Fig. 3B). This suggests that relative increases in subcortical activity associated with decreases in frontal cortical activity occur in the course of normal aging.
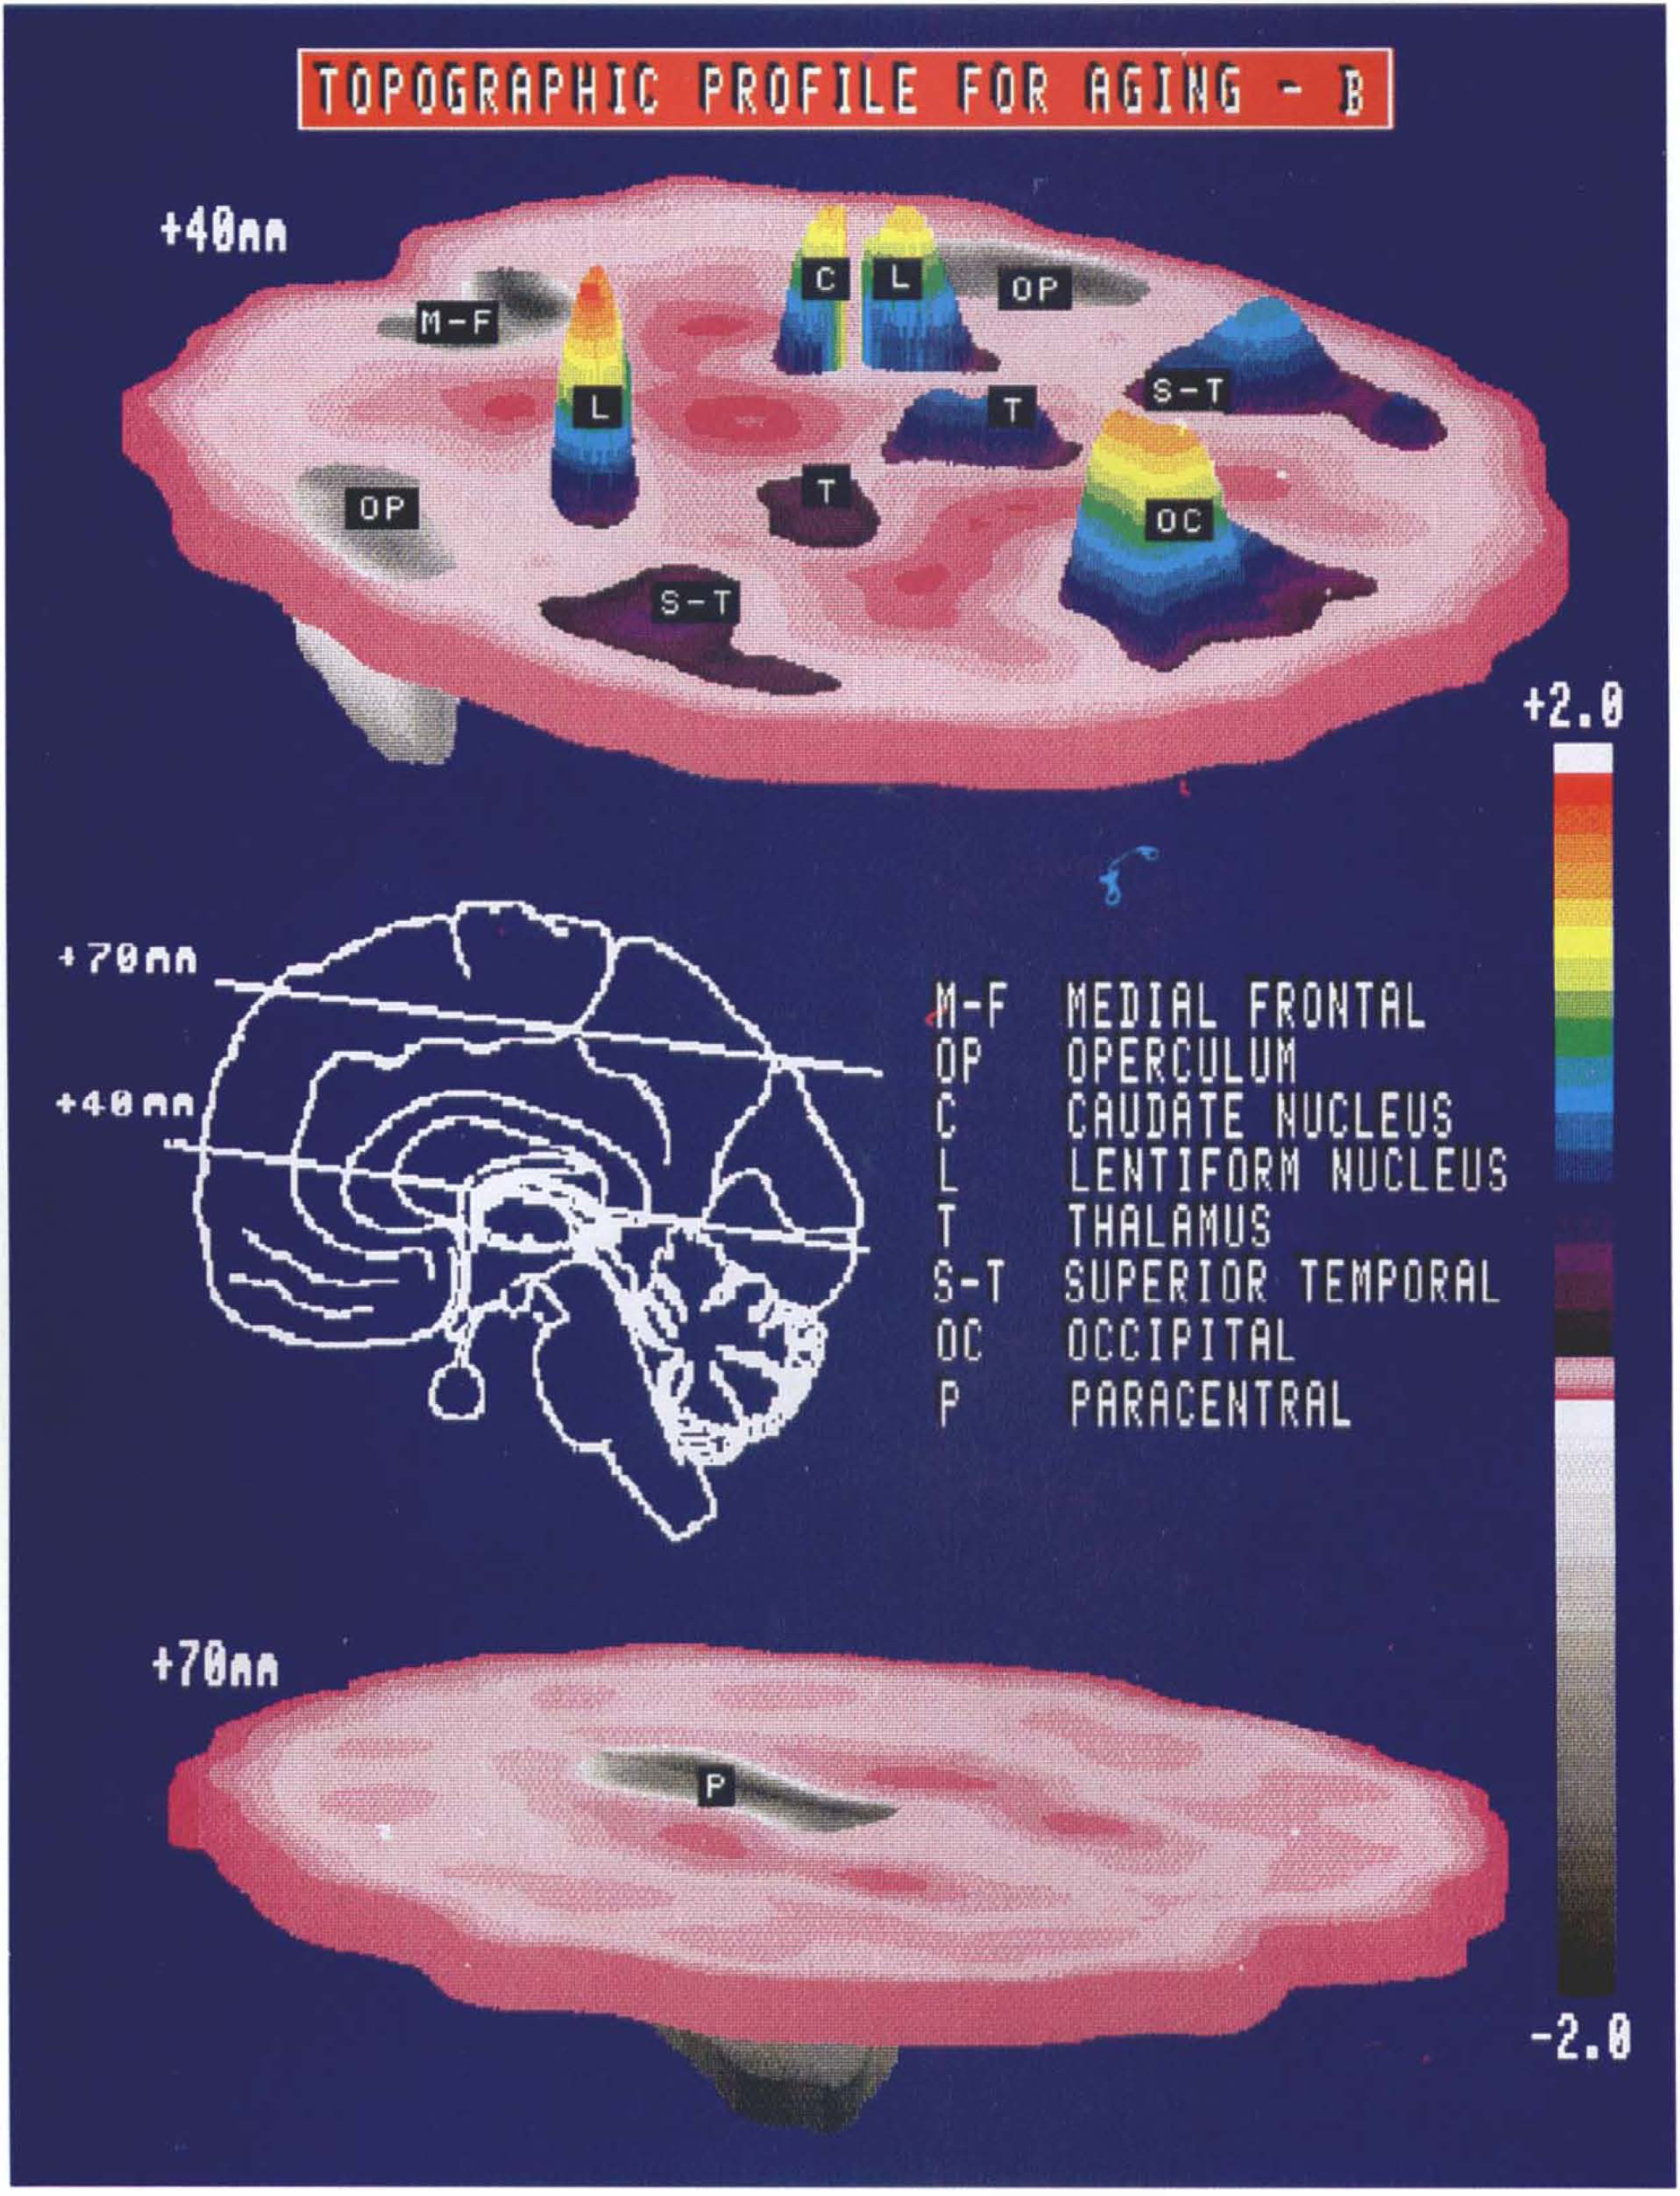
Isometric display of the region weights for topographic profile B on representative transverse brain slices acquired ∼40 and 70 mm above the orbitomeatal line. The insert (middle) indicates the position of the midlines of these transverse slices on a standardized parasagittal two-dimensional display. Relative hypermetabolism (color scale) of the lentiform nuclei and occipital cortex (top) is evident in association with covariate hypometabolism (gray scale) of paracentral cortex (bottom).
To demonstrate that topographic profile B is also a reliable metabolic marker of age, we calculated SSFB values for each of individual subjects in group 1 (n = 130) and in the group 1a repeat studies (n = 22). We found that SSFB values were highly reproducible within group 1a scan pairs (r = 0.62, p < 0.005). SSFB correlated significantly with age in group 1: (R2 = 0.30, p < 0.00001; Fig. 3A) and in group 1a repeat studies (R2 = 0.55, p < 0.0001). In addition, mean SSFB values were significantly increased in the older normals relative to their younger counterparts (group 1: p < 0.0001; Fig. 3B; group 1a repeat studies: p < 0.001). These findings suggest that SSFB is also a valid metabolic marker of normal aging.
Region weights for topographic profile A were significantly correlated with those for topographic profile B (r = 0.67, p < 0.0001; Fig. 5). Additionally, we found that individual SSFA and SSFB values were highly correlated within each of the two normal study populations (group 1: r = 0.81; group 2: r = 0.74, p < 0.005 for both correlations; Fig. 6).
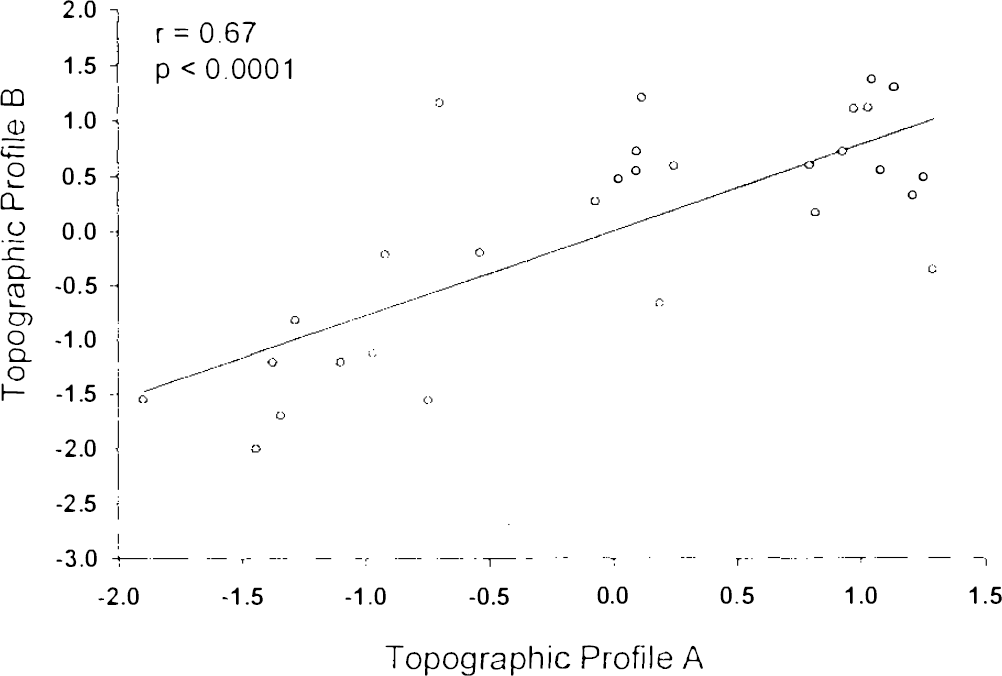
Correlation analysis of region weights for topographic profiles A and B. A significant correlation was found between these variables.
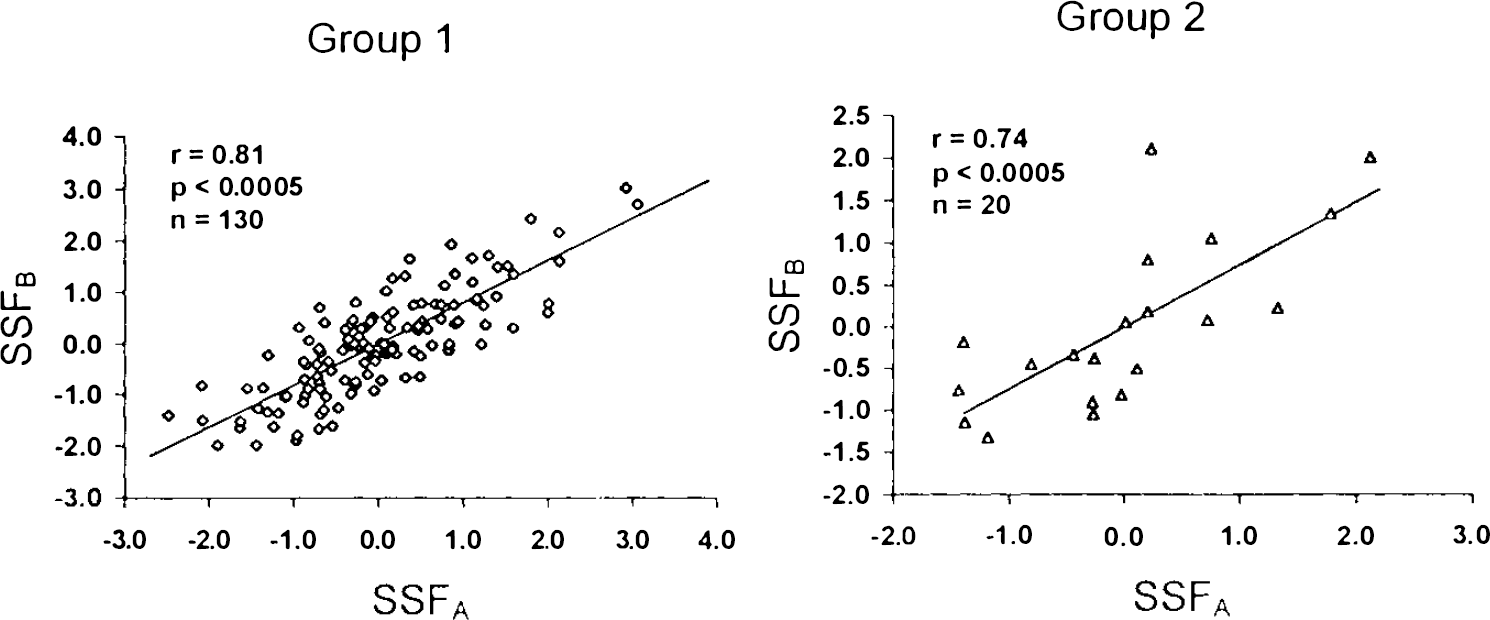
Correlation analysis of subject scores for topographic profiles A and B in the group 1 (left) and group 2 (right) normal samples. Significant correlations between SSFA and SSFB values were evident in both normal groups.
DISCUSSION
Glucose metabolism in normal aging
In previous investigations, SSM analyses of FDG/PET data have described specific patterns of regional metabolic covariation associated with neurodegenerative disease (e.g., Eidelberg et al., 1990, 1994, 1995). In this report we extended this technique to the detection of covariation patterns associated with normal healthy aging. Both topographic profiles described here (topographic profiles A and B) correlated significantly with chronological age in independent samples of normal subjects studied under different scanning conditions with tomographs of different resolution and sensitivity. Moreover, by differentiating the region-specific from the region-independent elements comprising overall glucose use, SSM analysis disclosed that the significant correlations between GMR and subject age in both samples were related primarily to topographic rather than to global effects.
A significant correlation between overall glucose use and age was not identified in most earlier PET studies (Duara et al., 1983; deLeon et al., 1984, 1987), even with atrophy correction (Schlageter et al., 1987; Yoshii et al., 1988). Nonetheless, such a relationship was described originally by Kuhl et al. (1984), and subsequently, on a higher-resolution tomograph by Grady et al. (1990). Similar age-related declines in cerebral perfusion and oxygen use have been recently confirmed (Leenders et al., 1990; Martin et al., 1991) with and without implementation of a global correction for cortical atrophy (Marchal et al., 1992).
Our findings of a correlation between glucose metabolism and subject age are consistent with our prior studies. In our analysis of the group 1 data, the previously reported significant correlation between age and GMR (Grady et al., 1990) was upheld. Inclusion of 70 additional normal subjects resulted in a correlation of similar magnitude between these variables (r = −0.29 and −0.23 for the two samples) with an approximate 12% decline over ages 20–80. The analysis of the smaller group 2 sample revealed a similar relationship between subject age and GMR. In spite of the reproducibility of the correlation between age and overall glucose metabolism in our data, these aging effects are relatively small, accounting for 5.6 and 26% of GMR variance in the group 1 and 2 data, respectively. Indeed, it is unlikely that a 12% decline in GMR between ages 20 and 80 can fully account for the decrements in motor and cognitive performance seen over this time span (e.g., Mortimer and Webster, 1982; Hochanadel and Kaplan, 1984; Grady et al., 1990).
Age-related topographic profiles
In the present study we used SSM to explore whether specific patterns of regional metabolic covariation might be associated with the normal aging process. We employed two analytical strategies to detect such patterns. In the first SSM analysis, we used rCMRglc data from the 130 group 1 normals. We identified a topographic profile for which subject scores were significantly correlated with age in these subjects. These subject scores (SSFA) were also found to be highly reproducible and predictive of age in the subset of 22 subjects (group 1a) who were subsequently restudied on the same tomograph. Importantly, we found that computed SSFA values were also predictive of age in the 20 other group 2 normals scanned separately on a different tomograph. We found that SSM compares favorably with traditional multivariate analysis. In group 1, traditional regression techniques produced aging correlations that were comparable to SSM. However, while reproducible in repeated studies, subject scores for the multivariate function were not predictive of age in the group 2 normals. This underscores the comparative instability of traditional multivariate approaches in situations in which the regional covariance structure may not be identical in independent study samples (cf. Flury, 1988).
Topographic profile A was characterized by an anterior-posterior cortical metabolic gradient of increasing relative hypofrontality with progressive age. This finding is consistent with the negative anterior-posterior correlations constituting the “superior system” described by Metter et al. (1984; cf. Matsuda et al., 1984). Our results indicate that this system is not only present in healthy subjects, but that its quantitative expression increases with age. The neurobehavioral correlates of this system are unknown but have been ascribed to integrated visual function and/or attentional mechanisms (e.g., Mesulam, 1981; Metter et al., 1984; Posner and Petersen, 1990). The aging-related shift of regional metabolism posteriorly may reflect alterations in the relationship of frontal-occipital integration with increasing age, as manifested by senescent changes in visual processing and eye movement control (e.g., McFarland et al., 1958; Corso, 1975). It is, however, of interest that the anteroposterior gradient was present and significantly correlated with age in both visually deprived (group 1) and stimulated (group 2) normatives. This indicates that topographic profile A is not strictly an artifact of visual stimulation and may have complex behavioral concomitants in the awake state regardless of sensory environment.
Additionally, we note that the heteromodal association cortices of the inferior parietal lobule (Mesulam 1981; Eidelberg and Galaburda, 1984) also contribute to this covariance pattern, albeit to a lesser degree than the frontal and parietooccipital areas. In this vein, topographic profile A may be construed as a fragment of a more extensive distributed network of attentional processing extending from frontal cortex through anterior cingulate, pulvinar, parietal, and occipital regions (Posner and Petersen, 1990). Conceivably, normal aging affects specific regional aspects of this system, accounting for the behavioral selectivity of only certain components of attention in senescence (e.g., Creasey and Rapoport, 1985). The other aspects not directly affected by age may be elicited only by modulation of this system by diseases that specifically impair attentional processing (e.g., Alzheimer's disease), or more directly, with cognitive stimulation studies.
Apart from the anterior-posterior cortical gradient, topographic profile A is also associated with covariate increases in brainstem, cerebellar, and basal ganglia metabolism. This suggests that normal aging may also be associated with a second gradient involving subcortical-cortical relationships. The relative increase in brainstem function with aging may indicate a shift toward reticular pathways occurring concomitantly with senescent declines in the integrity of limbic-neocortical attentional systems.
The functional role of the basal ganglia in the normal aging process is not well understood. The presence of covariate increases in striatal metabolism in topographic profile A raises the issue of the relationship of these functional changes to the attrition of the nigrostriatal dopamine system that occurs in senescence (McGeer et al., 1977; Wolters and Calne, 1989; Martin et al., 1989). In our prior studies of PD, we identified a disease-related topographic profile characterized by relative basal ganglia hypermetabolism associated with lateral pre-motor and supplementary motor (SMA) regional hypometabolism (topographic profile 1; Eidelberg et al., 1990, 1994, 1995). Subject scores for this profile were abnormally elevated in PD patients and correlated significantly with quantitative rigidity and bradykinesia measures, and with striatal uptake of [18F]fluorodopa. We interpreted the basal ganglia hypermetabolism of PD to be a direct consequence of the pathological nigrostriatal dopaminergic dysfunction characterizing this disease (Eidelberg et al., 1990, 1994). Moreover, lentiform hypermetabolism is a consistent finding in 2-DG autoradiographic studies of experimental parkinsonism in primates (e.g., Crossman et al., 1985; Palombo et al., 1990). We have also identified relative metabolic declines in the paracentral region (corresponding to SMA; Eidelberg et al., 1994) in the topographic profiles associated with both PD and normal aging. Indeed, reduced SMA activity, occurring indirectly through nigrostriatal dopamine loss and concomitant reductions in ventral thalamic output, has been proposed as the substrate for the motor slowing of parkinsonism, and possibly also normal senescence (Eidelberg et al., 1994). Nonetheless, the precise behavioral and neurochemical correlates of the sub-cortical-cortical gradient are unknown. Extensive studies will be needed to elucidate the relationship of both the anterior-posterior and the subcortical-cortical gradients to senescent changes in normal cognitive processing and motor function.
Topographic profile A is not the only regional metabolic covariance pattern associated with normal aging. In a second exploratory SSM analysis (analysis B) we combined normal subjects with PD patients. Because of well-established clinical, neurophysiological, and neurochemical similarities between normal motoric aging and PD (e.g., Evarts et al., 1981; Mortimer and Webster, 1982; Teravainen and Calne, 1983; Wolters and Calne, 1989), we hypothesized that some of the age-related networks identified in normals may also be present in parkinsonism. Indeed, to the extent that aspects of normal motoric aging may be exaggerated in PD (Wolters and Calne, 1989), these patients might be considered in some respects to be “hyperaged” with respect to motor function. In the exploratory analysis (analysis B), we considered the possibility that aging variance across a combined sample of normals and patients may be larger than for a comparably sized normal sample. More importantly, this approach would potentially allow for the identification of patterns associated with specific aspects of the aging process in common with the disease group.
In spite of the small number of group 2 normals employed in the extraction of topographic profile B, this pattern proved to be an accurate marker of chronological age in the larger group 1 cohort, and was highly reproducible within subjects. Thus, although large numbers of normal subjects can be employed in the identification of age-related covariance patterns, aging profiles can also be extracted with fewer normals if a disease group is added in a combined SSM analysis. Although identified by different analytical strategies with entirely different subject cohorts studied on different tomographs, topographic profiles A and B were highly correlated, as were their corresponding subject scores measured in several independent samples. Nonetheless, the topographies of the two aging profiles differed in several ways. The anterior-posterior gradient, the salient feature of topographic profile A, is less pronounced in topographic profile B. By contrast, the subcortical-cortical gradient is more developed in the latter profile. Specifically, topographic profile B is characterized by proportionately greater contributions of the basal ganglia and the lateral frontal cortex (corresponding to areas 4 and 6; Eidelberg et al., 1994) to the overall covariance pattern.
We interpret topographic profile B, with its greater representation of motor system components, as a specialized fragment of the more generalized topographic profile A. Indeed, combined group strategies such as analysis B may have utility in extracting specific functional elements of the aging process. As noted before, we have discerned qualitatively similar regional covariance relationships in Parkinson's disease (topographic profile 1), which we have related to independent measures of dopaminergic dysfunction (Eidelberg et al., 1990, 1994, 1995). This raises the possibility that topographic profiles 1 and B may both be indirect metabolic indicators of nigrostriatal dopaminergic activity: the former in parkinsonism and the latter in normal aging. We note, however, that region weights for topographic profile 1 accounted for only 22% of the variance of those for topographic profile B, indicating that, in spite of coarse similarities, the metabolic topographies of aging and parkinsonism are by no means identical. Indeed, histopathological studies have discerned important differences in the patterns of nigral cell loss in these two circumstances (McGeer et al., 1989; Fearnley and Lees, 1991). Our findings support the notion that the clinical, metabolic, and histopathologic changes of PD cannot be simply ascribed to an exaggeration of the normal aging process (Wolters and Calne, 1989). The precise role of normal aging in determining the onset and severity of parkinsonian symptoms and signs remains the subject of continuing debate (e.g., Scherman et al., 1989; Agid et al., 1989; Fearnley and Lees, 1991).
In SSM analysis, the functional meaning of individual weights in a covariance pattern can be understood within the context of the entire corresponding metabolic topography. Both aging-related topographic profiles contain regions of positive weighting such as the caudate and lentiform nuclei and the parietooccipital cortex. In the case of aging, subject scores for both patterns increase with advancing age. Because of the comparatively small signal of these aging profiles (accounting for <30% and 10% GMR variance for group 1 and group 2 data, respectively), their increased expression in aged subjects is not necessarily associated with absolute elevations in metabolic rate. In this vein, we interpret this finding as consistent with pattern-specific relative hypermetabolism for positively weighted regions, signifying preservation of regional brain metabolism in the setting of metabolic decreases in negative covarying brain regions. This is demonstrated by the small, insignificant age-related rates of decline in the basal ganglia and parietooccipital regions occurring concurrently with significant declines in frontal metabolism that are approximately twofold greater in magnitude.
The presence of covariate decreases in function (negative region weights) in both aging profiles raises the possibility of atrophy as a confounding factor. SSM analysis partitions GMR variance into global and regional effects represented respectively by GSF and the topographic profiles. We expect that global atrophy artifacts, i.e., those equally involving all regional measurements, should be represented primarily in GSF. We found that GSF accounted for <1% in group 1 and for 14% of aging variance in group 2. These findings are compatible with the difference in tomographic resolution in the two studies, and the likelihood of greater partial volume effects in the group 2 data. Indeed, the magnitude of this GSF effect is comparable to independent determinations of the contribution of global atrophy effects to GMR variability (Schlageter et al., 1987; Yoshii et al., 1988) in cameras of low spatial resolution. Analogously, the absence of a GSF contribution to age variability in the group 1 data may be attributed to improved compensation for partial volume effects in a tomograph of superior spatial resolution (Grady, 1991).
Focal cortical atrophy poses a more complicated problem. It is known that age-related gyral atrophy is often selective, primarily affecting the frontal and parietal parasagittal cortices (Tomlinson et al., 1968), and also the temporal poles (Kemper, 1984). In the absence of a magnetic resonance (MR) imaging based regional correction (e.g., Videen et al., 1988), it is conceivable that the cortical reductions noted in the SSM may be in part artifactual. Several points argue against this possibility: (a) Atrophy effects are expected to lower regional metabolic values. Nonetheless, we find that in both topographic profiles A and B, covariate metabolic increases (positive region weights) are also evident, even in regions that may demonstrate age-related atrophy such as the caudate and lentiform nuclei (Murphy et al., 1992). (b) Analogous covariate reductions in frontal and parietal activity have been described by us in topographic profile 1, identified in our studies of PD patients (Eidelberg et al., 1994, 1995). Nonetheless, we found no evidence of corresponding gyral atrophy on MR imaging in these PD subjects. Moreover, subject scores for this profile correlated with independent disease severity measures such as quantitative motor ratings and striatal [18F]-fluorodopa uptake (Eidelberg et al., 1990). (c) The presence of prominent reductions in covariate paracentral activity in both topographic aging profiles is suggestive of a functional reduction in SMA activity with age. Neurophysiological studies have revealed a reduction in the amplitude of the Bereitschaftspotential (readiness potential) with age (Barrett et al., 1985; Simpson and Khuraibet, 1987). This surface negative electroencephalographic potential, evident before self-paced movements, originates from SMA (Kornhuber and Deecke, 1978). Its reduction in normal aging suggests that the paracentral metabolic reductions noted in topographic profiles A and B may have a physiological concomitant and are not simply a consequence of tissue loss. Nonetheless, the contribution of focal atrophy to metabolic profile topography cannot be excluded without employing precise three-dimensional MR imaging/PET coregistration techniques.
In conclusion, our findings indicate that normal aging is associated with specific patterns of regional metabolism. Moreover, the topographies of these patterns are compatible with well-established models of functional and anatomical connectivity. Although the two aging-related topographic profiles reported here are highly reproducible and highly predictive of chronological age, their ultimate clinical utility as metabolic aging markers rests in their capacity to predict functional aspects of aging. Indeed, it is currently unknown whether the variability in profile subject scores in subjects of a given age is due to individual differences in behavior, or to extrinsic factors such as measurement noise or secular effects. For instance, SSFB values may correlate more accurately with a physiological measure such as reaction time (Welford, 1977) than with actual subject age. Extensive psychophysical-PET correlative studies will be needed to demonstrate the utility of these topographic profiles as performance markers rather than simply as measures of chronological age. Such studies may also clarify the relationship between these topographic profiles and the specific regional brain networks involved in the aging process.
Footnotes
Acknowledgment:
This work was supported by grants from the Parkinson Disease Foundation and the Dystonia Medical Research Foundation. David Eidelberg is a faculty fellow of the Parkinson Disease Foundation and the United Parkinson Foundation. Tatsuya Ishikawa is a Veola T. Kerr fellow of the Parkinson Disease Foundation. We thank Dr. Abdel Belakhlef, Dr. William Robeson, and Mr. Claude Margouleff for technical assistance, Dr. Robert Dahl and Mr. Ralph Matacchieri for cyclotron support, Dr. Thomas Chaly for radioisotope preparation, and Ms. Debra Segal for manuscript preparation. We acknowledge the valuable role of Dr. Mark Schapiro in supervising the collection of the group 1 data.