
Abstract
Changes in collateral blood flow, which sustains brain viability distal to arterial occlusion, may impact infarct evolution but have not previously been demonstrated in humans. We correlated leptomeningeal collateral flow, assessed using novel perfusion magnetic resonance imaging (MRI) processing at baseline and 3 to 5 days, with simultaneous assessment of perfusion parameters. Perfusion raw data were averaged across three consecutive slices to increase leptomeningeal collateral vessel continuity after subtraction of baseline signal analogous to digital subtraction angiography. Changes in collateral quality, Tmax hypoperfusion severity, and infarct growth were assessed between baseline and days 3 to 5 perfusion-diffusion MRI. Acute MRI was analysed for 88 patients imaged 3 to 6 hours after ischemic stroke onset. Better collateral flow at baseline was associated with larger perfusion-diffusion mismatch (Spearman's Rho 0.51,
INTRODUCTION
In ischemic stroke, survival of penumbral tissue distal to an arterial occlusion depends on collateral circulation via the Circle of Willis and leptomeningeal anastomoses. 1 Without reperfusion, the infarct core expands into the hypoperfused tissue of the penumbra, and it has been proposed that the rate of this expansion is proportional to the susceptibility of the underlying tissue to ischemia, the severity of the hypoperfusion, and time elapsed after stroke onset. 2 However, it is evident in clinical practice that infarct growth does not always progress to the full extent of the involved vascular territory, even in the absence of reperfusion. 3 This variability in outcome may well relate to the persistence or failure of collateral vessels over time.
Collateral blood flow may be assessed with catheter-based digital subtraction angiography (DSA).4,5 Computed tomography angiography may also be used but only provides a snapshot in time during the passage of the contrast bolus so that the extent of collateral supply visualized is dependent on the timing of the acquisition.6–8 Magnetic resonance perfusion imaging captures the entire transit of the contrast bolus and therefore preserves time resolution, and the 3D acquisition allows greater parenchymal detail than DSA. The standard processing of perfusion imaging generates parametric maps such as time to peak and cerebral blood volume. In the context of major vessel occlusion, increased time to peak relative to the normal hemisphere reflects the delay in arrival of flow via collateral vessels. Diffusion restriction or reduced cerebral blood volume generally indicate regions where collateral flow is insufficient to sustain tissue viability.
We processed raw MR perfusion data from the EPITHET study 9 in a novel manner to simulate the appearance of DSA. This allowed the quality of collateral circulation to be graded and provided the advantage of repeated assessment at baseline and 3 to 5 days after stroke onset. We hypothesized that dynamic shifts in the severity of hypoperfusion over time would correlate with deterioration in the quality of collateral circulation and that this would be associated with infarct growth.
MATERIALS AND METHODS
EPITHET was a prospective, double-blind, multicenter trial with acute ischemic stroke patients randomized to intravenous tissue plasminogen activator or placebo 3 to 6 hours after symptom onset. Methodological details have been published. 9 Briefly, a baseline noncontrast computed tomography scan was used to exclude patients with acute hemorrhage and major early ischemic change > 1/3 middle cerebral artery territory. Patients had acute MRI at 1.5T with diffusion, perfusion, T2-weighted sequences, and MR angiography. Clinical assessment with the National Institutes of Health Stroke Scale was performed before treatment with tissue plasminogen activator or placebo. The perfusion sequences were obtained using gradient echo imaging after administration of intravenous gadolinium (0.2 mmol/kg, injected at 5 μL/second) with a repetition time of 1.5 to 3 seconds for a total acquisition of 70 to 90 seconds with 10 to 24 slices of thickness 5 to 7 mm. These assessments were repeated between days 3 to 5 (subacute) and day 90 (follow-up). Randomization to tissue plasminogen activator or placebo was carried out without knowledge of the MRI results. Imaging studies were analyzed centrally, before unmasking, to determine the presence of perfusion-diffusion mismatch. The study was approved by the Melbourne Health Human Research Ethics Committee governed by the National Health and Medical Research Council of Australia National Statement on Ethical Conduct in Human Research. Written informed consent was obtained from all participants.
Dynamic Angiographic Representation of Perfusion Imaging Data
The baseline prebolus image was subtracted from each frame of the raw perfusion data as in DSA. The standard logarithmic transformation employed to generate concentration data for perfusion processing was omitted to accentuate the artery–parenchymal enhancement gradient. Data were averaged across three consecutive slices to increase leptomeningeal collateral vessel continuity (z-axis resolution 15 to 21 mm, Figure 1). Axial reconstruction was chosen to utilize the maximum (in-plane) resolution available.
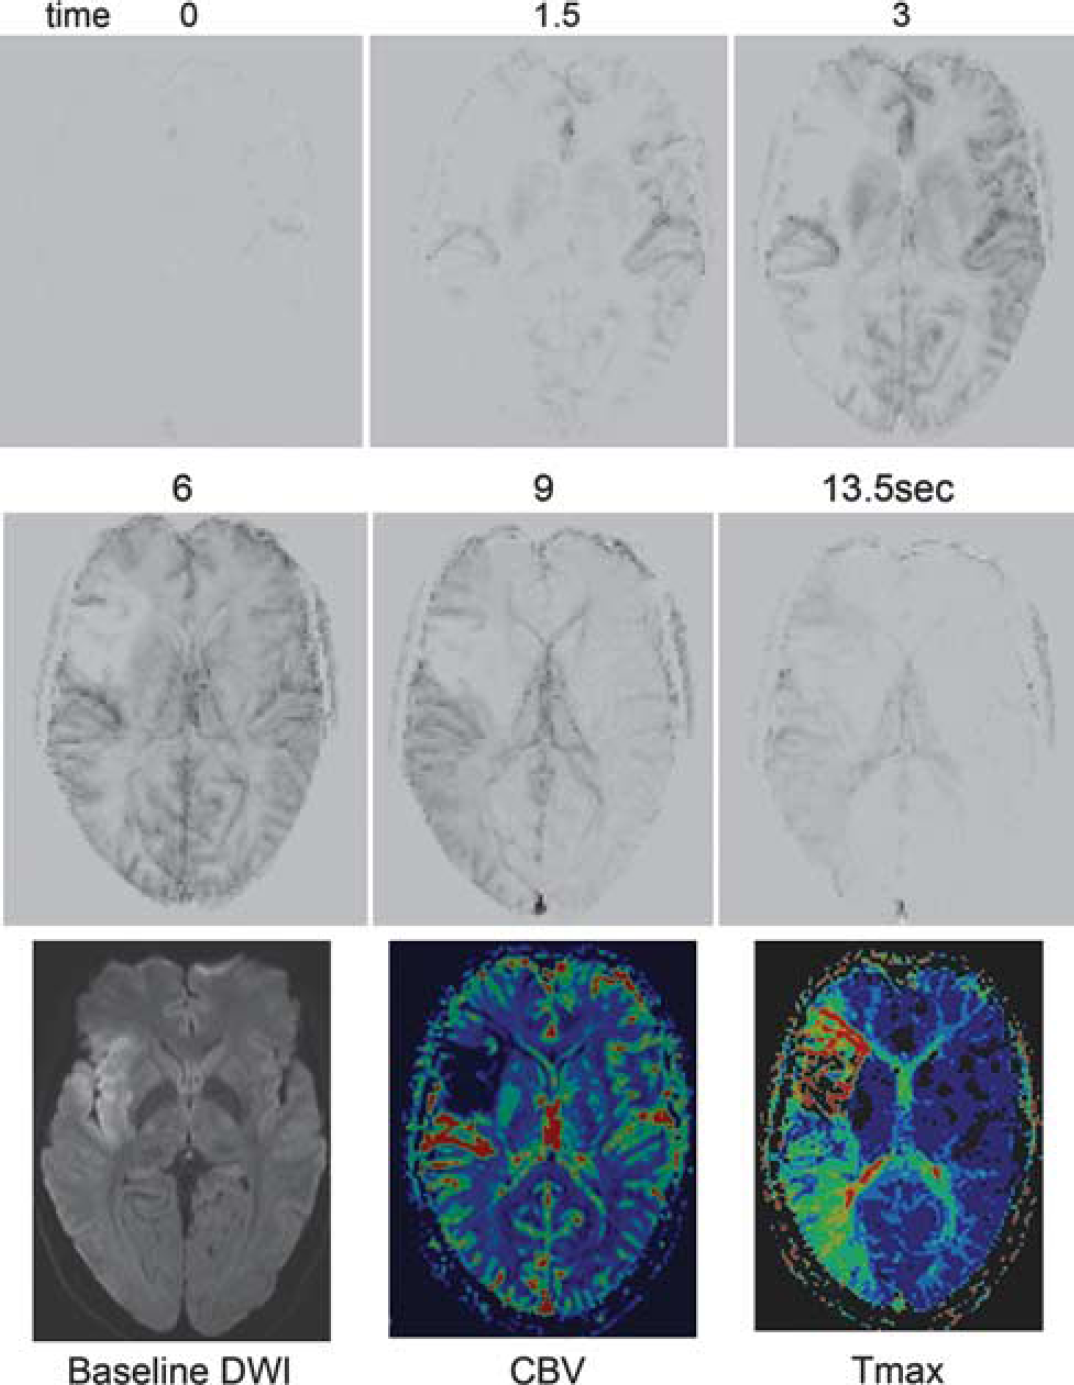
The relationship between collateral vessel grading using digitally-subtracted perfusion magnetic resonance imaging and standard diffusion-perfusion mismatch. An example of a patient with right middle cerebral artery occlusion and delayed leptomeningeal collateralization of the right middle cerebral artery territory corresponding to the region of prolonged Tmax (images acquired every 1.5 seconds, selected frames shown). Note the rapid arrival of some collaterals via the anterior cerebral artery and posterior cerebral artery during the arterial phase but absence of contrast penetration to the insular and opercular region (modified ASITN/SIR grade 2) corresponding to the area of diffusion weighted imaging (DWI) abnormality and reduced cerebral blood volume (CBV).
The quality of the collateral circulation was assessed on these dynamic 4D angiograms using a modification of the American Society of Interventional and Therapeutic Neuroradiology/Society of Interventional Radiology (ASITN/SIR) Collateral Flow Grading System. 5 This scale assigns patients to grade 0 (no collateral vessels visible), 1 (slow collateral blood flow to the periphery of the ischemic site with persistence of some of the defect), 2 (rapid collateral blood flow to the periphery of ischemic site with persistence of some of the defect), 3 (collateral flow with slow but complete angiographic blood flow of the ischemic bed by the late venous phase), and 4 (complete and rapid collateral blood flow to the vascular bed in the entire ischemic territory by retrograde perfusion). In the original scale designed for DSA, delay of < 2 seconds was defined as ‘rapid collateral flow’ as this corresponded to the arterial phase of the DSA. With perfusion MR, the contrast bolus is more dispersed (over 5 to10 seconds) and therefore for this study, ‘rapid’ collateral flow was defined as flow appearing within the arterial phase of the perfusion study (see online Supplementary Figure). The ASITN/SIR system applies equally to proximal and distal occlusions. Images were independently reviewed by a stroke neurologist (BC) and a neuroradiologist (BT), who then reached consensus on collateral vessel grade. Care was taken to determine that the direction of flow was consistent with retrograde filling via collaterals and not delayed anterograde flow through a stenosis. Raters were masked to all other imaging and clinical data.
Perfusion Processing
The raw perfusion data were also processed in the conventional manner to generate maps of time to peak (time to peak concentration) and cerebral blood volume (area under time–concentration curve) as well as Tmax (time to peak of the deconvolved tissue residue function using standard singular value decomposition deconvolution). An arterial input function was chosen from the contralateral middle cerebral artery using a user-supervised arterial input function detection algorithm. 10 The Tmax >2 seconds region of interest was thresholded and manually reviewed by a single operator (BC) to remove artefacts. Tmax > 2 seconds was the perfusion threshold originally used in EPITHET and essentially defines the visually evident region of delayed flow. In the context of vessel occlusion, this reflects territory supplied by collateral flow. The median Tmax value within this region of interest and the volume with Tmax > 8 seconds as a proportion of the Tmax > 2seconds lesion volume (the ‘hypoperfusion intensity ratio’ 11 ) were chosen as measures of perfusion severity. However, subsequent research has demonstrated that much of the Tmax2–6 seconds region is ‘benign oligemia’—unlikely to infarct even in the absence of reperfusion.12–14 Hence Tmax > 6 seconds is now the preferred perfusion threshold, and we therefore also examined the mean Tmax within the Tmax > 6 seconds region and a modified ratio of Tmax > 14 seconds to Tmax > 6 seconds to provide a similar index to the original ‘hypoperfusion intensity ratio’.
Infarct Growth Assessment
Absolute and relative infarct growth was calculated between baseline and day 3 to 5 scans. Two raters, masked to other imaging sequences, independently reviewed diffusion imaging at baseline and subacute timepoints, to identify patients with ‘major infarct growth’. This was defined as visually evident recruitment of additional anatomic territory into the infarcted brain region between acute and subacute MRI scans, as distinct from patients with volumetric growth predominantly due to oedema.
Reperfusion was defined as > 50% reduction in Tmax > 6 seconds perfusion lesion volume from acute to subacute scans. This definition was chosen rather than the > 90% Tmax ≥ 2 seconds threshold used in the original EPITHET study, as the aim was to identify patients with minimal reperfusion in whom to examine infarct growth. The continuous variable of reperfusion percentage was calculated as (acute-subacute)/acute Tmax > 6 seconds volume and used in regression analyses.
Statistical analysis was performed using Stata v12 (Statacorp, College Station, TX, USA). Changes in collateral grade between baseline and subacute scans were analysed as an ordinal 5-point scale. Interrater agreement was estimated using both intraclass correlation co-efficient and weighted kappa with weights of 1 for identical rating, 0.75 for 1-grade discrepancy, 0.5 for 2-grade discrepancy, 0.25 for 3-grade discrepancy, and 0 for 4-grade discrepancy. Median regression was used (as linear least-square regression assumptions were not satisfied owing to heteroscedasticity) to analyze the relationship of mismatch and collateral grade with infarct growth using reperfusion% as a covariate. To allow more formal comparison of model performance, ordinal logistic regression was performed using absolute and relative growth quartiles as the outcome variable. Bayesian information criterion (BIC)
15
was used as a scalar measure to compare the overall goodness of fit for regression models incorporating reperfusion with either mismatch parameters, collateral grade, or the combination. Differences in BIC of + 2 to 6 are regarded as ‘positive’, 6 to 10 ‘strong’ and greater than + 10 ‘very strong’.
15
The ‘best’ mismatch model included either mismatch% or mismatch volume based on
RESULTS
Eighty-eight of 101 patients enrolled in EPITHET had baseline diffusion and perfusion imaging; after exclusion of seven patients with no perfusion lesion at baseline, three with poor contrast bolus, two with severe motion artefact, and one who withdrew consent. Clinical characteristics are listed in Table 1. Seventy-four of 88 patients also had subacute imaging and could therefore be assessed for reperfusion and infarct growth; after exclusion of twelve patients with no subacute imaging data, one with severe motion artefact, and one with contrast bolus failure.
Clinical characteristics of patients
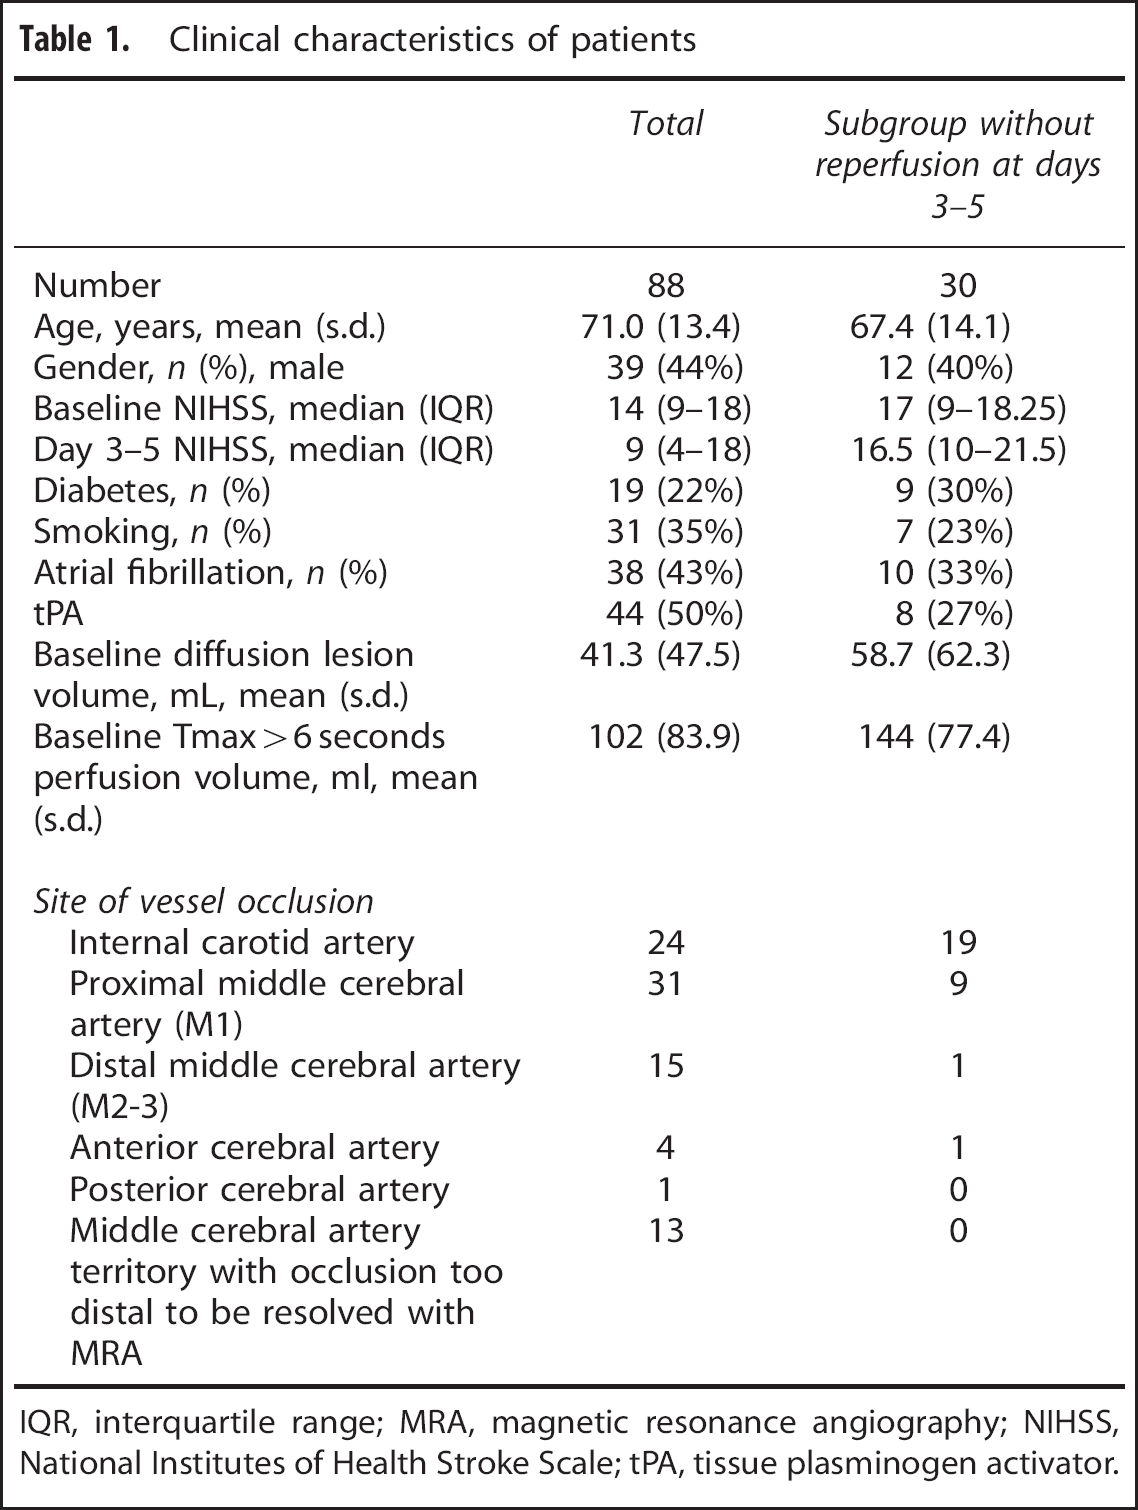
IQR, interquartile range; MRA, magnetic resonance angiography; NIHSS, National Institutes of Health Stroke Scale; tPA, tissue plasminogen activator.
Collateral Grading Using Perfusion Imaging
The agreement between raters was always within 1 grade level (intraclass correlation co-efficient 0.85 (95% CI 0.80 to 0.91, weighted kappa 0.71). Better collateral grade was more strongly correlated with mismatch% (Rho 0.51,
Higher collateral grade at baseline was associated with increased relative growth (with or without adjustment for reperfusion%, Table 2). Poorer collateral grade was associated with increased absolute infarct growth but this effect was nullified by the addition of baseline diffusion lesion volume to the model. This result may relate to edema developing in large baseline infarcts that resulted from poor collateral flow. Similarly larger mismatch at baseline was associated with increased potential for infarct growth in the absence of reperfusion.
Median regression for infarct growth between baseline and days 3-5 of imaging
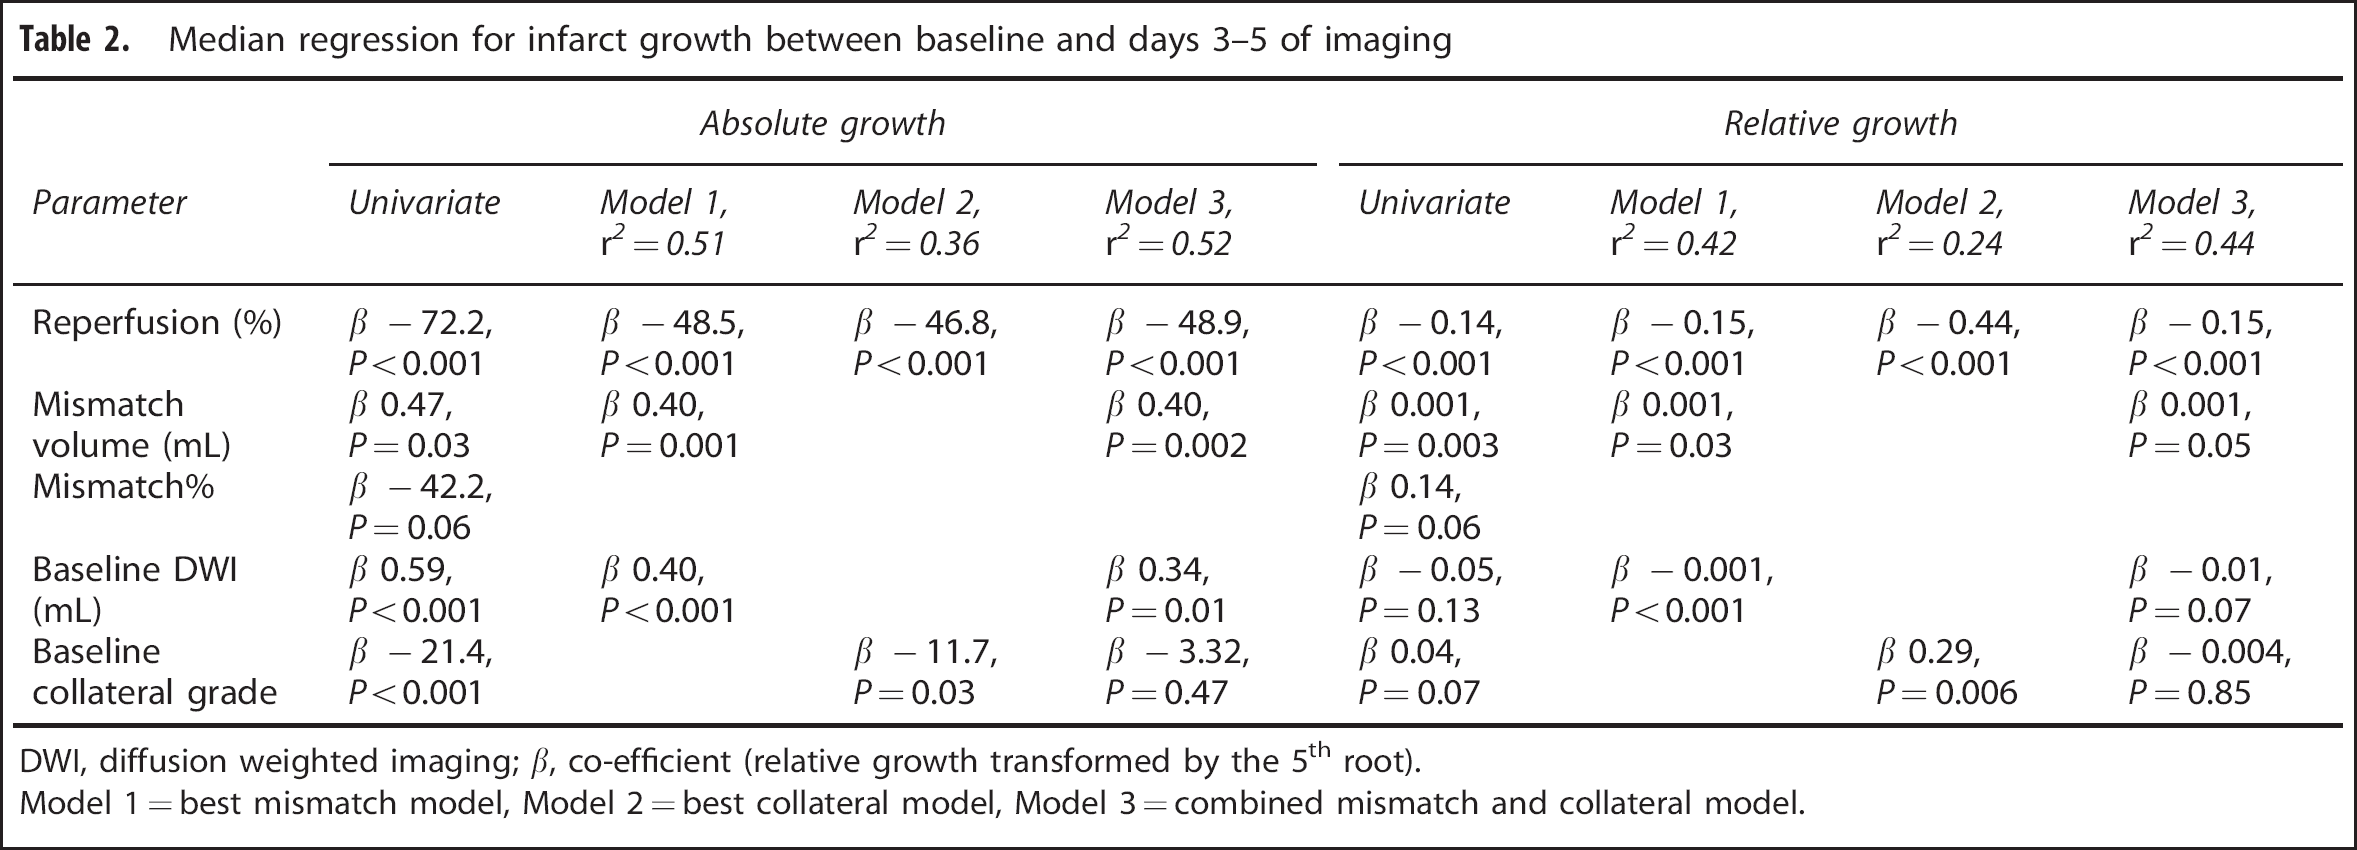
DWI, diffusion weighted imaging; b, co-efficient (relative growth transformed by the 5th root).
Model 1 = best mismatch model, Model 2 = best collateral model, Model 3 = combined mismatch and collateral model.
The model containing mismatch volume and baseline diffusion lesion volume with reperfusion% appeared to have better fit (higher pseudo-
Changes in Collateral Perfusion Over Time
There were 30 of 74 (41%) patients without reperfusion at day 3 to 5 (none of whom recanalized). In these patients, deterioration in collateral grade was strongly related to increased absolute (
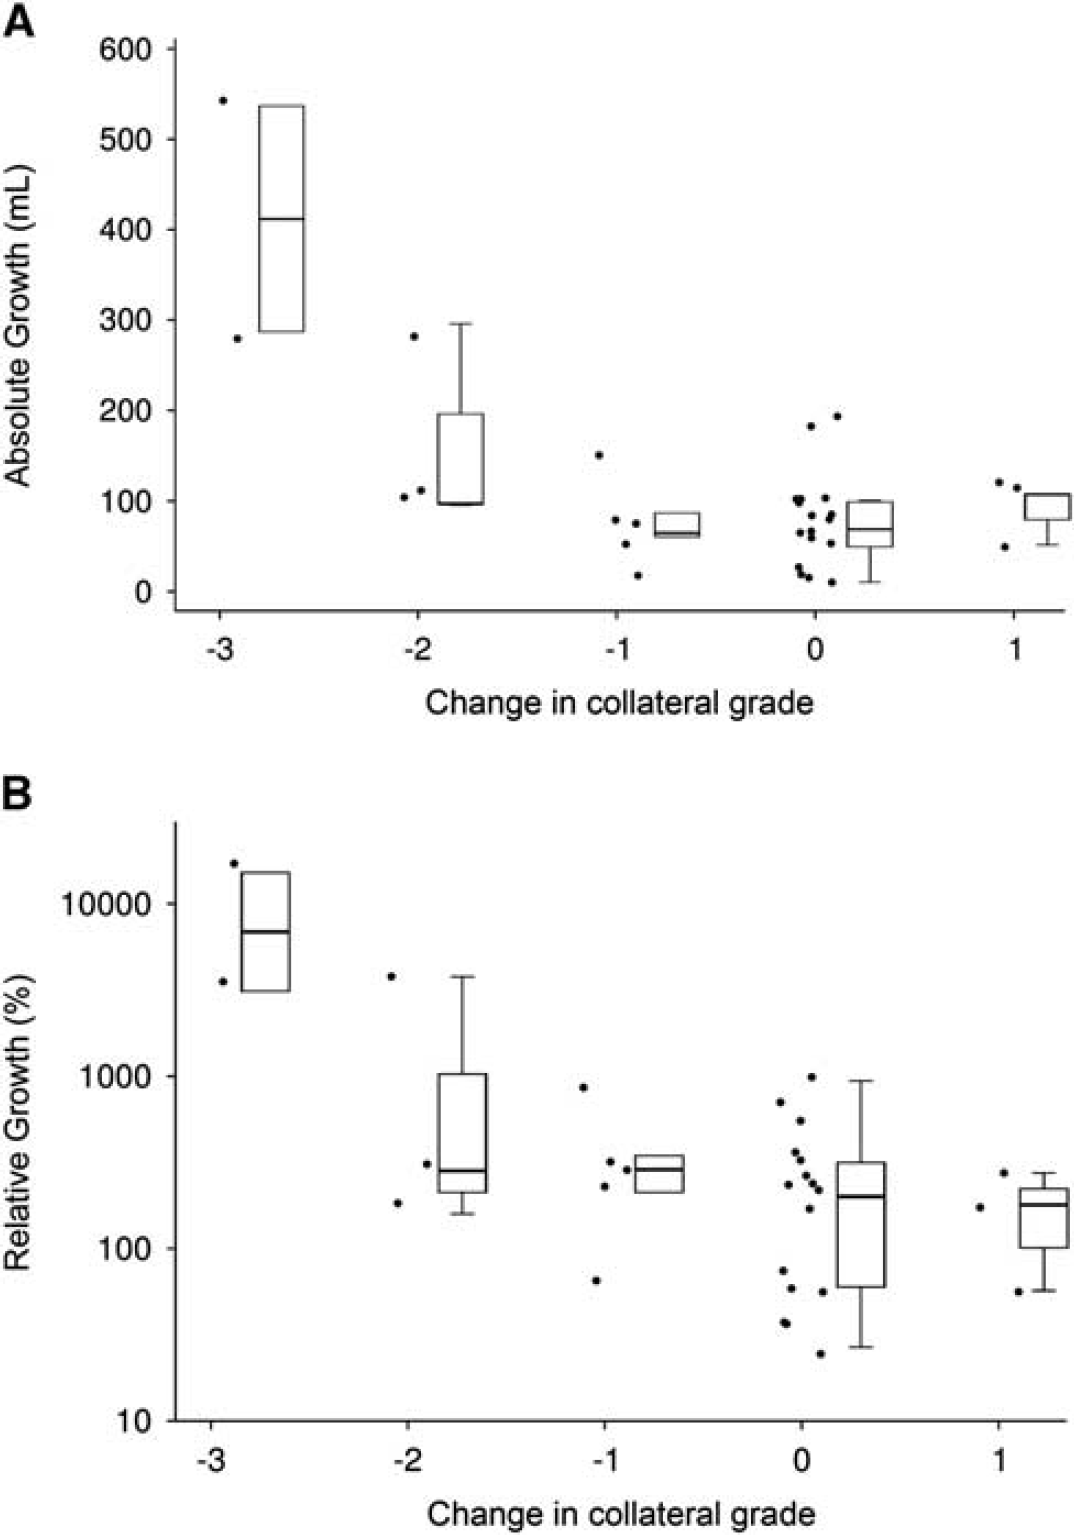
Absolute and relative growth stratified by change in collateral grade. Deterioration in collateral grade between baseline and days 3 to 5 was associated with increased (
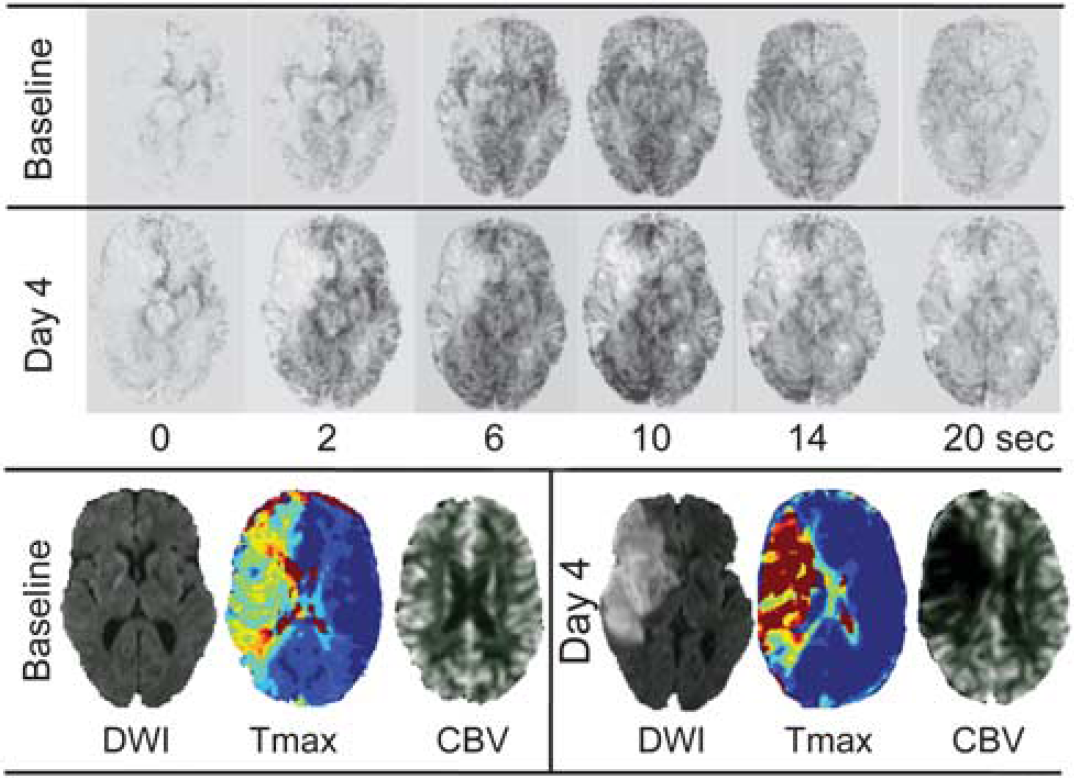
Example of a patient with collateral failure. At baseline, the distal right internal carotid artery is occluded but the digitally-subtracted perfusion magnetic resonance imaging data demonstrates excellent collateral flow via the circle of Willis (anterior communicating artery, images acquired every 2 seconds, selected frames shown). This corresponds to a large mismatch between the diffusion lesion and Tmax lesion volume with relatively mild Tmax severity and preserved cerebral blood volume (CBV). However, by day 4, there is no longer significant flow within these collateral vessels, accompanied by major infarct growth, increase in Tmax delay severity and reduction in cerebral blood volume.
In the above results, some infarct ‘growth’ was due to oedema rather than true infarct expansion. We deliberately sought to distinguish these two pathophysiologically distinct phenomena. Patients with true major growth (as opposed to oedema) had a deterioration in collateral grade (median 1 grade versus no change in those without growth,
DISCUSSION
This study has demonstrated that the quality of collateral blood flow and the degree of perfusion-diffusion mismatch are strongly related and both are associated with infarct growth. Furthermore, this novel methodology allowed repeated assessment of the quality of collateral flow and was able to demonstrate previously unreported changes between acute to days 3 to 5 scans that suggest that collateral failure is associated with infarct growth.
Both the quality of collateral flow and mismatch status at baseline have been shown to be associated with infarct growth and interact with reperfusion.7,9,16,17 Our data suggest that good collaterals and a large mismatch at baseline create potential for major infarct growth in the absence of reperfusion. While an association of good collaterals with an unfavourable infarct growth risk may superficially seem counterintuitive, these results are entirely consistent with our hypothesis that dynamic changes in collateral flow are associated with infarct growth. Good collaterals at baseline allow the survival of ischemic penumbra (also seen as a large mismatch) whereas poor collaterals at baseline are associated with infarcts that have already grown into most of the affected territory such that their potential for further growth is limited. If initially good collaterals fail over time, then there is a large area at risk for infarct growth. In this series, there was a high risk of major growth (∼ 70%) in patients with baseline mismatch who failed to reperfuse. This is not at odds with the strong association of good collaterals with improved outcomes7,18–20 so long as reperfusion is reasonably common in the population of interest.
Examination of collaterals using perfusion MRI data highlight the fundamental link between the presence and quality of collateral flow and the existence of a mismatch between the territory of the occluded artery represented by the perfusion lesion and the irreversibly damaged brain represented by the diffusion lesion. This seems rather obvious but has been considered controversial. 1 For this study, we used a modified ASITN/SIR grading system. 5 The identification of areas without contrast penetration essentially equates to a visual estimate of what would be seen on perfusion maps as severely reduced cerebral blood volume (which in turn is highly correlated with the diffusion lesion used in mismatch determinations). This is combined with visual assessment of the delay to collateral filling, which would be seen on perfusion maps as delayed time to peak or Tmax. Given this intimate relationship between collateral grading and mismatch assessment and the greater temporal and spatial quantitation afforded by mismatch, it is perhaps not surprising that statistical regression modeling suggested that perfusion-diffusion mismatch is more strongly associated with tissue outcome and that collateral flow grading did not add further complementary information. Visual collateral assessment however remains clinically useful owing to simplicity and is more robust in patients with motion that degrades perfusion maps. Review of the raw data also rapidly reveals technical problems with the quantity or timing of the contrast bolus, which helps gauge the reliability of derived perfusion maps.
The existence of fluctuations in collateral flow over time highlights the difficulties in accurately predicting infarct growth based on the severity of the baseline perfusion lesion. Attempts in previous studies to identify single Tmax thresholds to predict infarction in the absence of reperfusion12–14 have assumed a steady state. The proposed Tmax > 6 seconds threshold for perfusion lesion at risk simply represents an average and, in the individual patient, the proportion of the perfusion lesion that progresses to infarction may vary considerably. This may relate to unforeseen changes in collateral blood flow. A more probabilistic approach has demonstrated increasing infarction risk with increasing degrees of Tmax delay. 3 This appears to improve prediction of final infarct volume, although it cannot easily be applied to a spatial prediction. We hypothesize that increasing Tmax delay indicates tissue further down the collateral flow pathway with greater vulnerability to any reduction in collateral flow as a result.
A limitation of this analysis is that the observed association between infarct growth and perfusion shifts does not prove causality and it is possible that infarct growth could itself lead to a change in collateral circulation. Increasing oedema could raise intracranial pressure and thus resistance to collateral flow as well as the potential for direct compression of anterior cerebral artery, posterior cerebral artery, and leptomeningeal collaterals themselves due to developing mass effect. The direction of causality is difficult to prove, although there are clearly cases of large infarcts that have reperfused and have normal Tmax. Increased delay is therefore not a requisite feature of oedematous subacute infarction. However, collateral perfusion may be at lower pressure than orthograde flow and therefore more susceptible to compression. Further studies at multiple timepoints would be required to clarify this. The observation of normal flow in some large infarcts also makes the alternative explanation of reduced flow secondary to reduced metabolic demand unlikely. The demonstrated fluctuation in collateral flow over time emphasizes the advantage of simultaneous, rather than sequential, analysis of collaterals and mismatch provided by this method. However, direct validation of perfusion MR collateral grading against catheter angiogram-derived scoring would nonetheless be ideal.
This study emphasizes the importance of collateral flow as a critical factor in determining infarct evolution. The ability to repeatedly assess collateral flow provided by this perfusion imaging-based approach may allow insights into the currently poorly understood determinants of collateral flow. Given the unpredictable nature of collateral persistence and the ongoing risk of major infarct growth in the absence of reperfusion, these data add to the rationale for investigating reperfusion therapies in selected patients, even beyond traditional time windows.
DISCLOSURE/CONFLICT OF INTEREST
The authors declare no conflict of interest.
Footnotes
References
Supplementary Material
Please find the following supplemental material available below.
For Open Access articles published under a Creative Commons License, all supplemental material carries the same license as the article it is associated with.
For non-Open Access articles published, all supplemental material carries a non-exclusive license, and permission requests for re-use of supplemental material or any part of supplemental material shall be sent directly to the copyright owner as specified in the copyright notice associated with the article.