
Abstract
Two variants of a widely used two-compartment model were prepared for fitting the time course of [1,6-13C2]glucose metabolism in rat brain. Features common to most models were included, but in one model the enrichment of the substrates entering the glia and neuronal citric acid cycles was allowed to differ. Furthermore, the models included the capacity to analyze multiplets arising from 13C spin-spin coupling, known to improve parameter estimates in heart. Data analyzed were from a literature report providing time courses of [1,6-13C2]glucose metabolism. Four analyses were used, two comparing the effect of different pyruvate enrichment in glia and neurons, and two for determining the effect of multiplets present in the data. When fit independently, the enrichment in glial pyruvate was less than in neurons. In the absence of multiplets, fit quality and parameter values were typical of those in the literature, whereas the multiplet curves were not modeled well. This prompted the use of robust statistical analysis (the Kolmogorov-Smirnov test of goodness of fit) to determine whether individual curves were modeled appropriately. At least 50% of the curves in each experiment were considered poorly fit. It was concluded that the model does not include all metabolic features required to analyze the data.
INTRODUCTION
The study of metabolism is of great importance in the understanding of health and disease, and the measurement of flux through different pathways can reveal much regarding the control of the system and impact of disease. Whenever possible, noninvasive approaches are best to avoid artifacts, and one powerful approach for the study of brain metabolism has been the combination of 13C-enriched substrates and
Two-compartment models of brain metabolism have been under study since at least 1997,
1
and recently three compartments have been considered.
2
These have been used to model the passage of labeled carbon from 13C-enriched glucose and other substrates for the purpose of obtaining flux rates, but so far they have not taken advantage of the multiplets that arise as a consequence of 13C-13C coupling between adjacent carbon atoms. Multiplets have been observed in 13C NMR spectra of brain since at least 1989,
3
but for the most part have received little attention in dynamic metabolic modeling studies. Recently, it became possible to measure the time course of individual multiplets in the brain
Although it has been known for some time that the brain can use a variety of different substrates, 7 most studies have focused on the use of a single substrate, 13C-enriched glucose. Furthermore, the majority of models make the assumption that pyruvate generated within glia and neurons during 13C infusion have the same enrichment, and 13C multiplet analysis provides a means of testing its validity. Therefore, the model presented in this study allows for different enrichments in glia and neuronal compartments, because it is likely that the ability of 13C-13C multiplets to determine substrate enrichment will make a contribution to resolving this important issue.
A variety of assumptions have been used in rat studies, for example: making
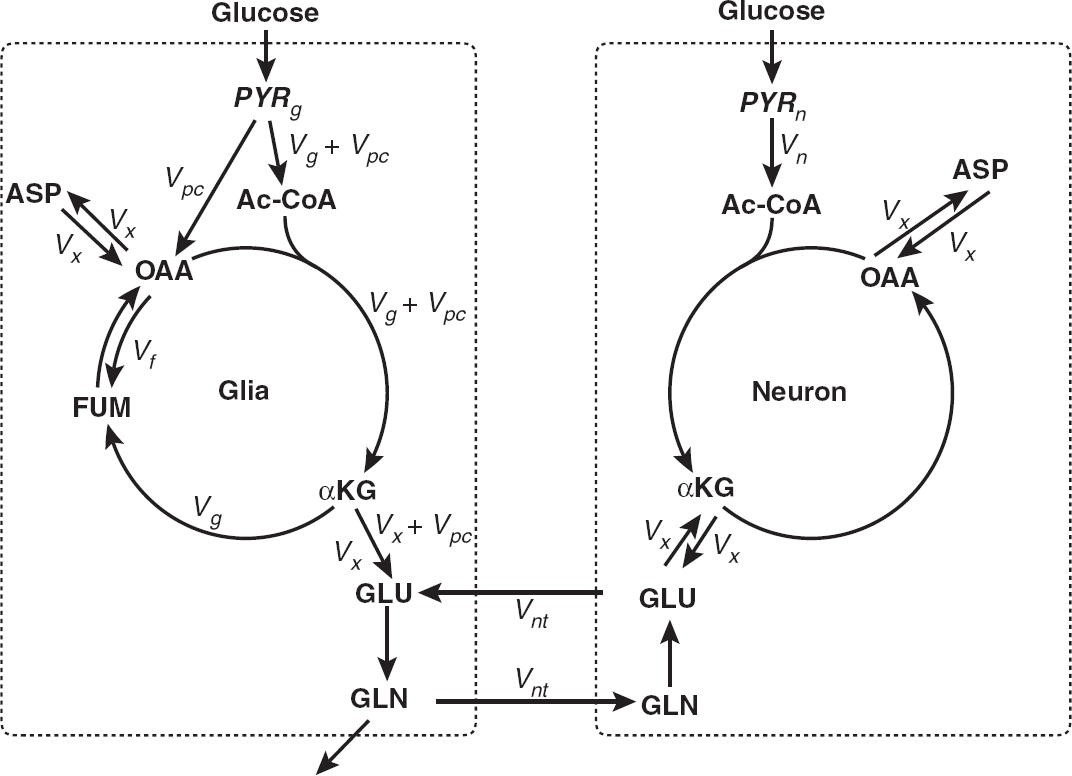
Schematic diagram of the proposed model. The two compartments represent neuronal and glial metabolism of pyruvate precursors. The major metabolic pathways in both brain cells are displayed: from glucogenic precursors (mostly blood-borne glucose) to pyruvate through glycolysis, the anaplerotic pathway via pyruvate carboxylase in the glial compartment, neuronal, and glial tricarboxylic acid cycle (TCA) cycle, the glutamate-glutamine cycle, and glutamate-α-ketoglutarate and oxaloacetate-aspartate exchange. Variables estimated from the nuclear magnetic resonance (NMR) data using the model include: α-KG, α-ketoglutarate; ASP, aspartate; FUM, fumarate; GLN, glutamine; GLU, glutamate; OAA, oxaloacetate;
The time courses of 13C multiplets used in this study were presented in a report on the metabolism of [1,6-13C2]glucose in the rat brain. 4 The measurements from glutamine and glutamate were analyzed. A two-compartment model incorporating features of glia and neuron metabolism common to many existing studies was prepared, but along with including the possibility for different pyruvate enrichment in cells, all fluxes were allowed to be independently determined by the model. Furthermore, the model was written to accommodate the analysis of multiplet data. Four types of analyses were performed that were combinations of the type of data used (whether carbon enrichments only or glutamate C4 multiplets were included) and pyruvate enrichment (whether identical or different in glia and neurons).
The results obtained for the rat using the single-pyruvate enrichment model applied to data consisting of carbon enrichments only (typical of most studies) were similar to previous literature reports. However, there were some indications suggesting that the experimental data were not as faithfully represented by the model-generated curves as one might hope. Furthermore, it was discovered that the multiplets of glutamate C4 obviously did not fit very well, irrespective of whether single- or double-pyruvate enrichment model was used. This led to the use of Kolmogorov–Smirnov test of goodness of fit, which indicated that 50% or more of the model-generated curves were not associated with randomly distributed data points. Therefore, it was concluded that not all aspects of metabolism required to fit such data are included in the model. In hindsight, it is possible to identify this problem in the literature, including the earliest of reports.
MATERIALS AND METHODS
Animal experiments were performed in accordance with the guide for the care and use of laboratory animals and were approved by the institutional animal care and use committee (IACUC) of the University of Minnesota.
13C Infusions
The data analyzed in this report are the time courses of
13C
carbon enrichment and multiplet values obtained in an earlier study,
4
which described in greater detail the procedures mentioned in this and the next two sections. In brief, adult male Sprague-Dawley rats (
Nuclear Magnetic Resonance Spectroscopy
Nuclear Magnetic Resonance Spectra Analysis
The analysis leading to the time course of change in glutamate and glutamine with time was obtained using the program LCModel. 4 Signals were converted to fractional enrichments using high-resolution 13C NMR spectra of tissue extracts obtained via freeze-clamping at the end of the experiment.
Metabolic Modeling
The NMR data were analyzed by a metabolic model built using the package FACSIMILE 4.0 for solving differential equations (MCPA Software, Faringdon, Oxfordshire, UK). Metabolic rates were estimated from five individual NMR data sets by fitting the change with time of 13C fractional enrichment of carbons C2, C3, and C4 of glutamate and glutamine. These fits were repeated after substituting the glutamate C4 enrichment curve by the C4 singlet resonance, 4S, and the doublet resulting from the coupling between carbons C3 and C4 (GLU4D34). The method used was based on that previously used in the heart,
6
which has been verified by comparing results with independent O2 consumption measurements. The model was made suitable for the analysis of brain metabolism by adding a second compartment and the reactions necessary to account for glia-astrocyte interactions. Figure 1 illustrates the metabolic pathways considered, which include the two compartments (glia and neurons) previously described by others (see the report by Chapa
As shown in Figure 1, this model does not restrict the potential for 13C-enriched glucose to enter only one of the glial or neuronal compartments, but independently estimates the enrichment of substrate in both. There is uncertainty concerning the route of carbon entry into the system, the extent to which pyruvate formed in neurons arises from astrocytic lactate transferred between cells, and the rate of exchange of these metabolites with the extracellular milieu.
15
Therefore, instead of specifically defining the mechanism involved, two independent parameters were estimated from the data, representing pyruvate 13C enrichment and denoted as
The remaining parameters used in the model were flux rate constants (Figure 1). As in previous models, pyruvate carboxylation (
To take advantage of the coupling between adjacent carbons containing 13C, the formation of individual isotopomers of each intermediate shown in Figure 1 were obtained. The model consists of 162 ordinary differential equations (provided as Supplementary Material) that describe the formation of each isotopomer resulting from the metabolism of [1,6-13C2]glucose. Because the data to be fitted consisted of the C4 multiplets of glutamate and enrichments of carbons 2 to 4 of glutamate and glutamine, these values were calculated from the individual isotopomers. Pyruvate enrichment and pathway flux estimates were then obtained by fitting the acquired data curves. All steps were performed using the program FACSIMILE.
Obtaining Pyruvate Enrichment and Pathway Fluxes
The five experimental data sets were analyzed by the model using four variations. Two versions of the model were used, one in which the pyruvate enrichment was made equal in both glia and neurons, whereas the other allowed for different enrichments in the two compartments. Two sets of the data were also used, one (‘carbon-content only’) consisting of carbon content values for the carbons of glutamate (GLU2, GLU3, GLU4) and glutamine (GLN2, GLN3, GLN4). The other data set (‘carbon plus GLU4 multiplet contents’) consisted of substituting values for GLU4 by their corresponding multiplets, GLU4S (consisting of all isotopomers without 13C in carbons 4 and 5) and GLU4D34 (the group of all isotopomers containing 13C at both carbons 3 and 4).
Both data variants from each experiment were analyzed using the single-pyruvate enrichment model to determine whether multiplets provided any improvement to the analysis. Similarly, the dual-pyruvate enrichment model was used to analyze data containing GLU4 multiplets to determine the effect of the extra pyruvate enrichment term on the quality of the fits. All flux measurements are expressed in units μmol/min/g wet weight.
Statistical Analysis
To examine individual curves for evidence of the nonrandom distribution of residuals, a two-sample Kolmogorov–Smirnov Test of Goodness of Fit (K–S) was performed to evaluate the fit of the model to time course data as described in Massey.
18
Briefly, the null hypothesis was tested to evaluate whether the fitted data and raw data were from the same distribution at the α = 0.01 significance level by evaluating the absolute maximum distance
Flux rates and pyruvate fractional enrichment are reported as mean ± s.d.
RESULTS
In Vivo Nuclear Magnetic Resonance
Spectra were obtained with favorable signal to noise that allowed for the observation of multiplets (see Figures 1a and 2 in the previous report).
4
The resonances attributed to glutamate and glutamine C2, C3, and C4, aspartate C2 and C3, and smaller resonances from GABA,
Time Course of 13C Uptake into Glutamate and Glutamine
Figure 2 shows the fit to a data set consisting of carbon fractional enrichment data, obtained using the kinetic model represented in Figure 1. The smooth curves are a result of fitting data to the model in which the pyruvate enrichment in neurons and glia have the same value, as most commonly used in the literature at present. The model-generated curves may all appear reasonable at first look, but on closer examination it is apparent that there are discrepancies between data and model for several of the curves. For example, most of the points for carbon 4 of glutamine fall below that generated by the model during the first part of the infusion. In fact, the K–S test identified those from glutamine C4, along with glutamate carbons C3 and C4, as having data points that are not randomly distributed about their model-generated curves.
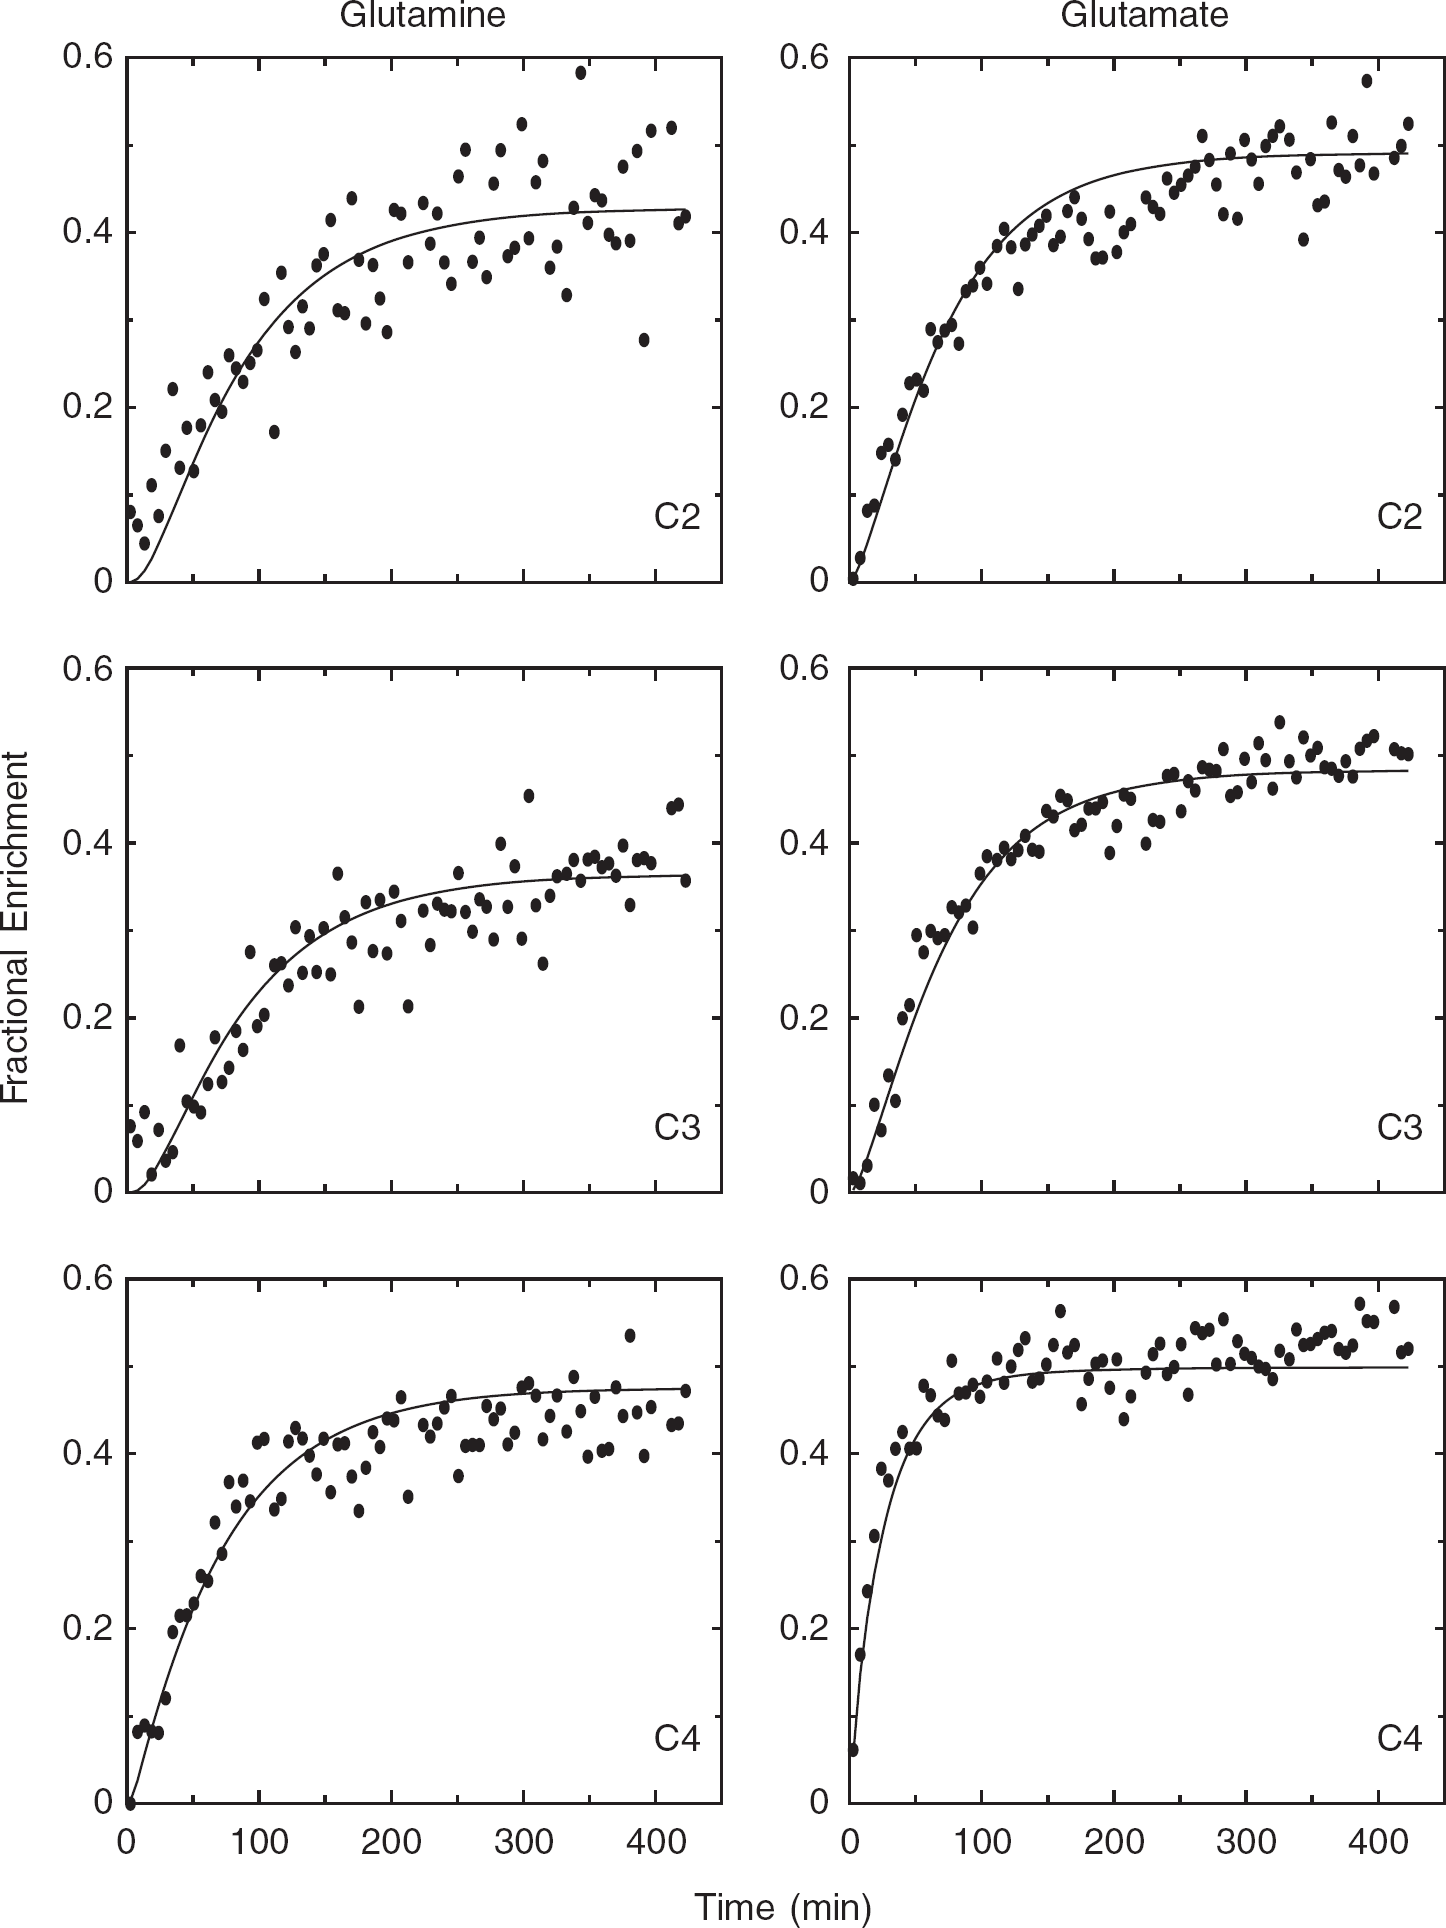
To determine whether there was any improvement resulting from the addition of multiplets, the data were altered by replacing the glutamate C4 enrichment values from the same experiment by the corresponding multiplets GLU4S and GLU4D34 (shown in Figure 2). The resulting seven curves were then fit using the same single-pyruvate enrichment model. It was clear that the data points were also not randomly distributed around the model-generated multiplet curves. The fit to the remaining (carbon-content) curves shown in Figure 2 were altered slightly as a consequence of including the multiplets, and are not shown.
In general, the analysis of carbon-content data led to model-generated curves that tended to fit glutamine data most poorly. The model appears to dictate that 13C should initially enter glutamine carbons more slowly with respect to the measured data than occurred with glutamate. The sigmoid shape generated by the model for GLN2 undercut the initial part of the data curve in all experiments; the same tendency also occurred with GLN3 curves. This was evident irrespective of the model used (whether one- or two-pyruvate enrichment parameters) or the data analyzed (whether GLU4 multiplet measurements were substituted or not). In most experiments, the glutamine GLN4 model-generated curves had a faster rise in the approach and remained above measured values once steady state was reached.
Regarding the corresponding appearance of fitted curves for glutamate, C2 and C3 appeared to more reasonably fit to the data, except that the curves generated for C3 tended to follow the lower edge of data points and the C2 (with stronger tendency) appeared to follow upper values. Conversely, glutamate C4 content curves had a strong tendency to undercut the measured C4 values throughout the time course, which was most apparent at steady state.
On swapping the GLU4 content curve with the multiplets GLU4S and GLU4D34 and fitting both the single- and dual-pyruvate enrichment models, discrepancies between the model and data were also observed. The GLU4S-generated model curves undercut the measured data throughout the time course, and although the GLU4D34 followed the data more closely, there was a tendency to trace the upper edge of the data points initially and then undercut at the end of the time course.
Kolmogorov–Smirnov Test of Goodness of Fit
Had the model performed its role adequately, then it would be expected that the data points for individual curves would be randomly distributed in the model-generated line. The K–S test was used to determine whether this was the case. After fitting each experiment by the single-pyruvate enrichment model to data without C4 multiplets, 3 to 4 (out of a total of 6) curves were determined to have a nonrandom distribution. When modeled using two-pyruvate enrichment parameters, 3 to 5 curves were discovered to be nonrandom. On analyzing data including multiplets, the number of curves increased still further: 4 to 6 (single-pyruvate enrichment model) and 5 to 6 (dual-pyruvate enrichment model) out of 7 curves were associated with nonrandomly distributed data.
Determining whether there was a pattern to these findings, it was found that glutamate and glutamine C4 data points were not randomly distributed in their fitted curves in every case, irrespective of whether carbon or multiplet contents were analyzed. Of the model-generated curves for C2 and C3 from both intermediates, GLN2 curves were identified more frequently as unrepresentative than GLN3, and GLU3 more so than GLU2.
These findings are in contrast to a perfused rat heart study. 6 When the K–S test was applied to the data collected for that report, only one of several multiplet curves (the GLU2Q) from one of the experiments was identified by K–S analysis as not randomly distributed (data not shown). The latter occurred in glucose + [3-13C]pyruvate-perfused hearts that generated noisy spectra that made measurements from the C2 region of glutamate spectra difficult.
Examining the Overall Standard Deviation
The overall s.d. of fit is also a measure of how well data are being fit; the smaller the value the more likely that the fit was successful. When this value was used to rank the performance of the four different analyses
Parameter Estimates
The means and s.d.'s obtained by applying all four types of analyses to the five data sets are provided in Table 1. When the single-pyruvate enrichment model was used, the substitution of multiplets for GLU4 had little effect on enrichment parameter values or s.d.'s, whereas the dual-pyruvate enrichment model in the presence of multiplets estimated the enrichment in glia at 40% and in neurons at 58% with 10% or less error. In the absence of multiplets the corresponding values were 12% and 72%, respectively, both associated with higher s.d.'s.
Model parameter enrichment fractions and pathway fluxes (μmol/wet/min)
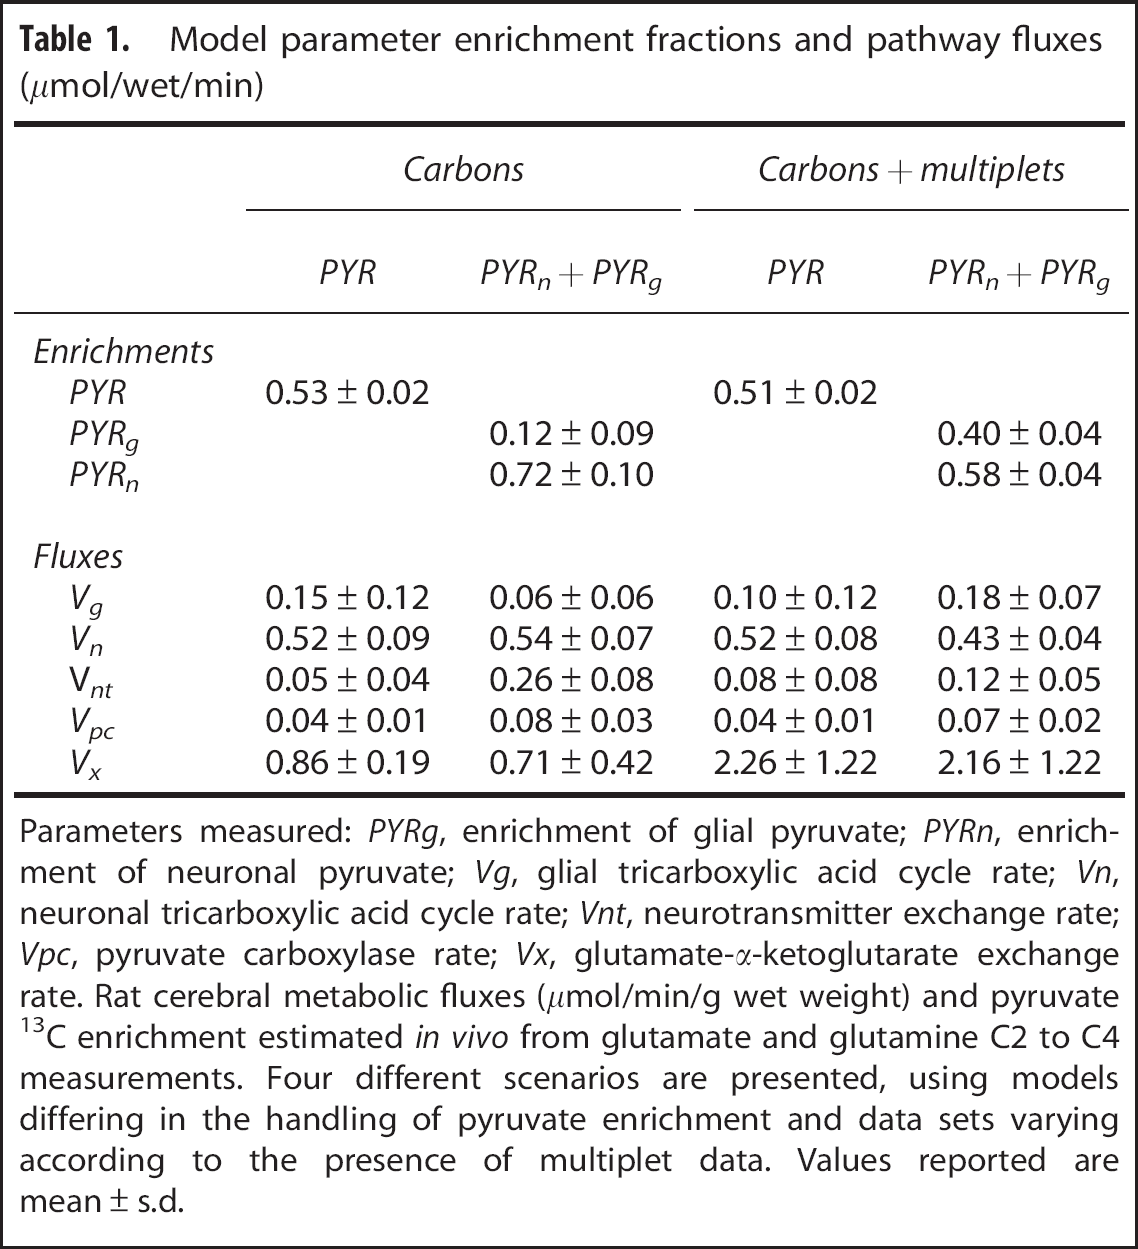
Parameters measured:
Regarding flux parameters and their sensitivity to the data used, values were approximately the same and s.d.'s showed little change in the single-pyruvate enrichment model irrespective of whether multiplets were included in the analysis, except for
As reported above, the dual-pyruvate enrichment model when applied to carbon content-only data generates different values for pyruvate enrichment, but the value associated with the neuronal compartment is unlikely to be physiologic given its similarity to the enrichment of blood glucose. Parameters
DISCUSSION
We believe that the model presented in this report is the first to attempt measurement of metabolic fluxes in the brain by using the additional information provided by 13C multiplets, which also provide the potential for separate estimation of pyruvate enrichment in glia and neurons. The latter will aid in the understanding of the extent to which different substrates support the carbon requirements of the two compartments.
The model was evaluated by analyzing serial 13C NMR spectra collected from the brain of rats. Unlike other models in the literature, this model has been verified by testing against oxygen consumption measurements obtained in a simpler preparation, the heart. Although there are signs that the addition of multiplets to the input data may assist in the evaluation of fluxes and substrate enrichment, the individual multiplet curves generated by the model did not fit the data as well as their carbon-content counterpart. This led to a more critical examination of the carbon-content curves, only to discover that there are subtle signs of model error that have been present since the earliest studies. Presumably, this is a result of additional features of metabolism that are not being taken into account, for which the impact on current parameter sets is difficult to assess.
Despite this difficulty, there are indications that the added ability to analyze multiplet data will indeed improve parameter estimates once a more detailed model of brain metabolism is available. These measurements will likely provide the ability to determine the separate enrichment of substrates entering the two compartments (represented by pyruvate in this study). This approach can also be extended to directly determine the use of more than one substrate, each provided with a distinct labeling pattern.5,14
Effect of Additions to the Model
The importance of allowing substrate enrichments to vary in the two compartments has been recognized at least since the time of Garfinkel, 20 who represented this feature by allowing acetyl-CoA to have different enrichment in the large and small compartments. Most current models use pyruvate to represent the enrichment supplied by external substrates, but depict that enrichment is identical for both glial and neuronal pyruvate as a result of exchange between both compartments.12,17 Nevertheless, there are exceptions to this. In at least one publication in the rat, glial acetyl-CoA and pyruvate are depicted as undergoing exchange with unlabeled material. 21 Other studies using mixtures of different substrates, labeled in a manner to distinguish between their metabolism in glial and neurons, have been conducted in both intact rats14,22 and brain slices.23,24
In the estimation of pyruvate enrichment using the single-pyruvate enrichment model, the mean and s.d.'s reported in Table 1 showed little difference on including multiplets. In this scenario, with only one enrichment term to estimate, any potential for greater sensitivity to enrichment values provided by GLU4 multiplets did not materialize. However, s.d.'s were much improved when multiplets were present and the double-pyruvate enrichment model was used (in the absence of multiplets s.d.'s were more than twice as large). With both data sets the difference in enrichment between glia and neuron compartments agreed with previous reports (higher enrichment in neurons than glia). However, the high value associated with neurons obtained by analysis of the carbon-content only data set is probably nonphysiologic. Because this parameter by convention actually represents acetyl-CoA enrichment from both glycolytic and fatty acid sources, it is unlikely that the value is close to the enrichment of glucose in the blood. The presence of the glutamate C4 multiplets and the enrichment information they encode appear necessary to have reasonable estimates of the enrichment of the two pyruvate terms.
The significantly higher neuronal than glial pyruvate enrichment suggests that other substrates are consumed by glia. Thus, unenriched substrates entering at pyruvate would dilute that derived from [1,6-13C2]glucose (67% blood enrichment in this experiment). Alternatively, the lower enrichment of glial pyruvate compared with neuronal pyruvate could be explained by dilution through exchange with unlabeled lactate. Because of their proximity to blood vessels, astrocytes would show higher lactate dilution than neurons. Regardless of the cause of the dilution, according to the findings of this study (Table 1, column five), the enrichment of substrates entering glia was 40% less than plasma glucose. The substrate being oxidized by neurons was also affected, but to a lesser extent (approximately 13%). Because glial pyruvate is lower than in neurons, the astrocyte-neuron lactate shuttle hypothesis 25 may not be applicable to this situation.
Examining all flux parameters except for exchange parameter
The reason for the greater parameter value and error term associated with exchange parameter
Comparison with Flux Measurements in the Literature
In general, comparing parameter values between studies reported in the literature is difficult because of the variety of conditions used. Restricting the available studies to those of the rat brain under the same anesthesia as in this study currently results in six publications.1,9,21,26-28 Of the four analyses performed for this work, all but one of these studies used the single-pyruvate enrichment model for analysis of carbon-content only data. The exception to this 21 analyzed carbon-content data using a model of dual-pyruvate enrichment similar to that used here.
The mean flux values (mmol/min/g wet weight) determined during this study (Table 1) were largely within range of the values collated from the above literature (
Monte Carlo is a very useful predictive tool, but it does rely on the underlying model being correct for the system under investigation, which is not the case for this application. In the list of s.d. ranges given above, several of the minima are much smaller than the upper range. These small values are all from the same report, which used Monte Carlo analysis to determine parameter errors, rather than performing statistical analysis of multiple experiments. 21 They are probably artifactual as a consequence.
Kolmogorov–Smirnov Test of Goodness of Fit
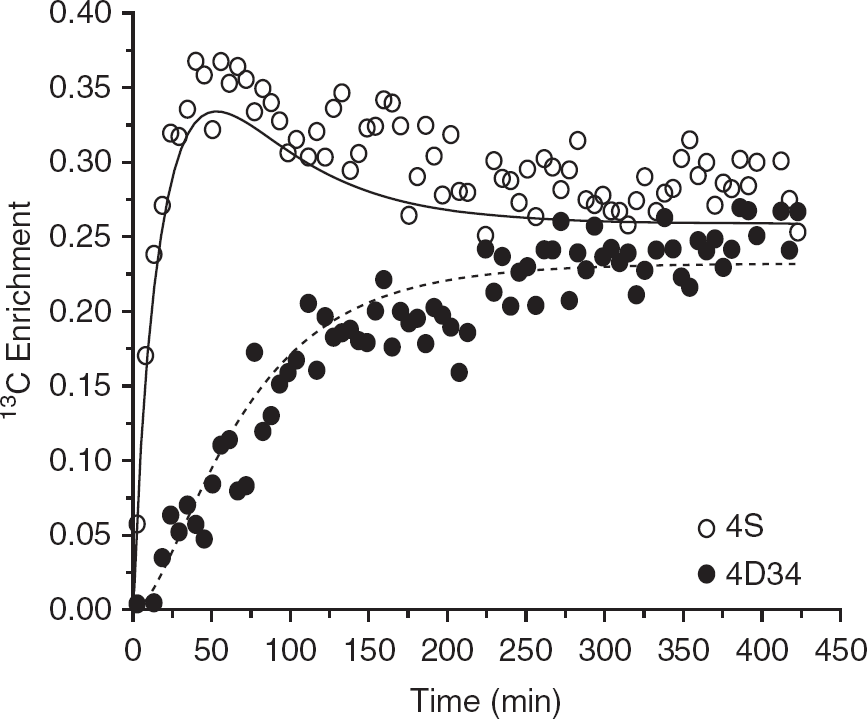
Although the discrepancies between data and model-generated curves shown in Figure 2 are perhaps subtle to the human eye, it is clear in Figure 3 that the multiplets of glutamate C4 are not adequately fit by this model. The K–S test confirmed that the data points are not randomly distributed around both model-generated curves.
The data being shown in Figures 2 and 3 include that from the experiment that gave rise to the best overall result, based on having the lowest overall s.d. of the five data sets. This was true of the single-pyruvate enrichment model, whether the data consisted only of carbon fractional enrichments or after substituting the glutamate C4 carbon enrichment curve with its corresponding multiplets. In fact, the data from this experiment had the better fit of all the experiments irrespective of the model used (one-or dual-pyruvate enrichment terms) or the type of data (whether glutamate C4 multiplets were provided or not). Hence, despite having the best possible fit of all the experimental data sets, the model did not perform as expected, based on the K–S test of goodness of fit standard.
Prior Evidence of this Problem
In hindsight, having observed the discrepancy between data and model-fitted curves, it is apparent that this problem has been present in the literature all along. For example, in an early single-compartment model of the rat brain (Figure 2), 1 data points are not randomly distributed, though close to the model-generated lines. Instead ‘runs’ of data points are apparent (several consecutive points remaining above or below the fitted line, then crossing over). Similar examples in rats using a dual-compartment model can be seen in the figures of other studies such as Figure 4, 9 Figure 4, 11 Figures 6a and 6b, 12 Figure 5, 28 and Figure 4. 13
There are also indications that similar issues may exist in studies of the human brain. For example, in a study that used [1-13C]glucose, the time course from an individual subject (Figure 3) 29 shows the results of modeling curves from [4-13C]glutamate and [4-13C]glutamine. Both curves exhibit what is likely a nonrandom distribution of points in the model-drawn curves.
Identifying the possible source of this discrepancy is a major challenge given the complexity of the model and the underlying metabolism of the tissue. Several changes were made to the model to determine whether improvements could be obtained. Pathways involving the metabolism of GABA as depicted by Patel
It is possible that this phenomenon may be substrate specific, for the time course of glutamate C4 and C3 was similar to reports above during the infusion of [1-13C]glucose (see Figure 2A in Boumezbeur
The deviations found in this study and the literature show a need for stringent statistical tests of a model's fit to the data, to evaluate its effectiveness and the biologic parameters estimated from it. The Kolmogorov-Smirnov goodness of fit test has been available since the 1950s and has been widely used in other scientific fields. Examples include heart beat dynamics, 32 predicting prognoses from gene microarray data in cancer, 33 and extracting information from neural spike models. 34 It has not, however, been applied by the brain metabolism modeling community where it is particularly well suited. It is the preferred method for evaluating goodness of fit in small samples and can be used on both continuous and discrete sets of data. 35
Summary
When fitting carbon-content data to a kinetic model of brain metabolism, there were signs that the curves generated by the model were not a complete representation of the data. Initially, this was simply attributed to random noise, but the replacement of glutamate C4 content with multiplets GLU4S and GLU4D34 made clear that the model is likely incomplete. It was then realized that the deviations of the data points frequently formed ‘runs’ above and below the model-fitted lines, and the K-S test confirmed that these deviations were statistically significant. Therefore, although the current model contains the standard features of brain metabolism usually used, the model does not contain all the features of metabolism needed for analyzing these data.
Despite such difficulties, it is likely that the addition of two separate pyruvate pools has improved the performance of the model for the analysis of data that include multiplets. This feature should prove valuable for determining the contribution that different substrates make to glia and neuronal metabolism, especially through the use of judiciously labeled substrates.
Although most studies assume similar rates of glucose oxidation in neurons and glia, the findings of this report suggest a difference, because the level of enrichment in glia and neurons was 40% and 58%, respectively, and the rate of citric acid cycle turnover was greater in neurons than glia. Although the model currently allows the use of [1,6-13C2]glucose only as enriched substrate, it can be extended to simultaneously analyze mixtures of substrates with appropriately different labeling patterns. This will help determine the extent to which different substrates are used in different compartments of the brain.
It is apparent that models of brain metabolism require further development to analyze data sets of this nature. It is also apparent that procedures such as the K-S test are very important for evaluating models, and probably should become a generally used tool in the study of metabolism.
DISCLOSURE/CONFLICT OF INTEREST
The authors declare no conflict of interest.
Footnotes
References
Supplementary Material
Please find the following supplemental material available below.
For Open Access articles published under a Creative Commons License, all supplemental material carries the same license as the article it is associated with.
For non-Open Access articles published, all supplemental material carries a non-exclusive license, and permission requests for re-use of supplemental material or any part of supplemental material shall be sent directly to the copyright owner as specified in the copyright notice associated with the article.