
Abstract
Globoid cell leukodystrophy (GLD) or Krabbe disease is a lysosomal storage disorder caused by genetic defects in the expression and activity of galactosylceramidase, a key enzyme in the catabolism of myelin-enriched sphingolipids. While there are several histologic, biochemical, and functional studies on GLD, correlations between morphologic and biochemical alterations in central nervous system (CNS) tissues during disease progression are lacking. Here, we combined immunohistochemistry and metabolic analysis using
1
H and
13
C magnetic resonance (MR) spectra of spinal cord, cerebellum, and forebrain to investigate glial-neuronal metabolic interactions and dysfunction in a GLD murine model that recapitulates the human pathology. In order to assess the temporal- and region-dependent disease progression and the potential metabolic correlates, we investigated CNS tissues at mildly symptomatic and fully symptomatic stages of the disease. When compared with age-matched controls, GLD mice showed glucose hypometabolism, alterations in neurotransmitter content, N-acetylaspartate, N-acetylaspartylglutamate, and osmolytes levels. Notably, age- and region-dependent patterns of metabolic disturbances were in close agreement with the progression of astrogliosis, microglia activation, apoptosis, and neurodegeneration. We suggest that MR spectroscopy could be used
Keywords
INTRODUCTION
Globoid cell leukodystrophy (GLD), or Krabbe disease, is a rare (1 in 100,000 live births worldwide) autosomal recessive lysosomal storage disorder (LSD) caused by deficiency of the lysosomal enzyme β-galactocerebrosidase (GALC;EC 3.2.1.46). This enzyme catabolyzes several glycolipids, including galactosylceramide (Galcer), lactosylceramide, and galactosylsphingosine (psychosine). 1 The pathology consists of rapid and nearly complete disappearance of myelin and myelin-forming cells in the central and peripheral nervous system (CNS), reactive astrogliosis, neuroinflammation, and infiltration of characteristic periodic acid-Schiff-positive macrophages (globoid cells). Pathologic hallmarks appear first in the peripheral nervous system and caudal areas of the CNS, progressing along the caudal-rostral axis. 2 These events are associated with various and severe neurologic impairments. The infantile forms are characterized by rapid progression and invariable fatal prognosis. Thus, GLD is considered an untreatable infantile disease with an urgent medical need.
While primary genetic and biochemical defects are described in LSD, secondary events might influence the development and progression of the disease, such as alterations in autophagy, immune system, intracellular trafficking, lipid biosynthesis, calcium homeostasis, and signaling pathways. 3 Galactosylsphingosine is considered the main toxic effector in GLD. 2 This lysolipid alters several intracellular signaling pathways and impairs mitochondrial oxidative phosphorylation. 4 Recent observations in a GLD murine model indicate that accumulation of psychosine and lactosylceramide impairs neural stem cell niches in the postnatal CNS. 5 Before the disruption of myelination, moderate accumulation of psychosine leads to axonopathy, which possibly contributes to GLD pathophysiology. 6
Oligodendrocytes are part of a complex interaction between astrocytes and neurons, supporting axonal integrity and function, independently of myelination. 7 Their dysfunction leads to axonal degeneration in several diseases, possibly as a result of insufficient axonal energy support 8 mediated by altered production, transport, and/or use of metabolites such as glucose and lactate. 9 Early reports described disturbances of several major metabolic pathways in the CNS of GLD patients. 10 Also, glucose hypometabolism and elevated lactate levels characterize CNS tissues of leukodystrophy patients.11-13 However, a careful evaluation of neural metabolism and glial-neuronal metabolic interaction in the GALC-deficient CNS and, importantly, potential correlates to the hallmarks of disease progression are lacking.
In this study, we used 1 H and 13 C magnetic resonance spectroscopy (MRS) to perform a comprehensive metabolic analysis of glucose, N-acetylaspartate (NAA), and amino-acid neurotransmitter metabolism in a GLD murine model that lacks residual GALC activity and recapitulates the severe forms of the human pathology.14,15 In order to relate metabolic disturbances to disease progression, we analyzed three CNS regions along the caudal-rostral axis (spinal cord, cerebellum, and forebrain) at two stages of disease progression (mildly symptomatic and fully symptomatic), also extending current knowledge of CNS pathology by means of immunohistochemistry and molecular analysis. Our data reveal a distinct metabolic signature in GLD mice when compared with nonaffected littermates, with a temporal- and regional-dependent progression of neurochemical alterations following a similar pattern as that of neurohistopathology. In addition, we show the first 13 C MR spectrum of spinal cord extract after intraperitoneal injection of [1- 13 C]glucose and [1,2- 13 C]acetate and describe potential biomarkers that may improve the monitoring of disease progression and provide criteria for the outcome of treatment trials.
MATERIALS AND METHODS
Mice
Twitcher mice bear a spontaneous point mutation resulting in a premature stop codon and no residual GALC activity. 16 In this study, we used Twitcher mice on the mixed background of C57BL/6 and FVB. FVB/Twitcher mice were generated and the colony maintained in the animal research facility of the San Raffaele Scientific Institute by breeding heterozygous (galc +/-) C57BL/6 mice with wild-type (+ / +) FVB mice (Jackson Laboratory, Bar Harbor, ME, USA). FVB/Twitcher (- / -) have been previously described14,15 and are referred to as Twi mice in this study. Histopathological evaluation, molecular and metabolic analyses were performed on Twi mice and WT littermates at postnatal day 30 (PND30) and PND40. Protocols regarding animal treatment were approved by the Institutional Committee for the Good Animal Experimentation of the San Raffaele Scientific Institute (IACUC #420). Further information can be found in Supplementary Information.
Chemicals
[1- 13 C]glucose, [1,2- 13 C]acetate, and deuterium oxide (D2O) (99.9%) were purchased from Cambridge Isotope Laboratories (Woburn, MA, USA), ethylene glycol from Merck (Darmstadt, Germany) and 2,2-Dimethyl-2-silapentane-5-sulfonate (DSS) sodium salt from Sigma-Aldrich (St Louis, MO, USA). All other chemicals were of the purest grade available from local commercial sources.
Primary Cell Cultures From Adult Central Nervous System Tissues
Primary mixed neuronal/glial cultures were established from Twi mice and WT littermates at PND40, as previously described. 17 Further information can be found in Supplementary Information.
Immunohistochemistry and Immunofluorescence
Mice were deeply anaesthetized with tribromoethanol and intracardially perfused via the descending aorta with 0.9% NaCl followed by 4% paraformaldehyde in PBS (Sigma-Aldrich). Tissues were collected and equilibrated for 24 hours in 4% paraformaldehyde in PBS, washed in PBS + NaN3, and then included in 4% agarose. Serial coronal vibratome-cut sections (six series, 40 μm thick) were processed for immunohistochemistry, immunofluorescence analyses and lectin histochemistry, following previously described protocols.5,15 A list of antibodies used as well as details on image acquisition and quantification can be found in Supplementary Information.
Reverse Transcription and qRT-PCR
Total RNA from tissues (cerebellum and spinal cord) was extracted according to the manufacturer protocol of RNeasy_Lipid_Tissue with Qiazol (Qiagen, Hilden, Germany). mRNA reverse transcription was performed according to the manufacturer protocol of QuantiTect reverse transcription kit (Qiagen). qPCR was performed in Optical 96-well fast thermal cycling plates (Life Technologies-Applied Biosystem, Carlsbad, CA, USA) on ABI PRISM 7900 Sequence Detector System (Life Technologies-Applied Biosystem), using the following thermal cycling conditions, one cycle at 95 °C for 5 minutes, 40 cycles at 95 °C for 10seconds, and 60 °C for 30 seconds. Each sample was run in triplicate in a total volume of 25 μL/reaction, containing 12.5 μL 2X QuantiFast SYBR (Qiagen, Hilden, Germany), Green PCR Master Mix, 2 μL of template cDNA and 1 μM QuantiTect Primer Assays (NCX1, ATF3, MCT1, MCT2, MCT4, and βACT, all from Qiagen). Relative expression of mRNA for the target genes was performed by the comparative CT (ΔΔCT) method using the β-Actin gene as control. The relative mRNA levels were expressed as fold change (Twi over WT).
Animal Treatment and Tissue Collection for 13 C and 1 H Magnetic Resonance Spectroscopy and High Performance Liquid Chromatography Analysis
Groups of six mice/genotype/age were injected intraperitoneally with 150 μL of 0.3 mol/L [1- 13 C]glucose (543 mg/kg) plus 0.6mol/L [1,2- 13 C] acetate (504 mg/kg). The mice were subjected to deep anesthesia 15 minutes after injection followed by cervical dislocation. Their heads were cut and the whole brain and spinal cord were rapidly removed. The forebrain was then divided into two hemispheres and separated from the cerebellum. Tissues were weighed, immediately frozen in liquid nitrogen, and stored at - 80 °C. The time interval between decapitation and snap freezing did not exceed 1 minute.
The tissue samples were subjected to a water/methanol–chloroform extraction method as previously described. 18 Samples were homogenized in 300 μL methanol using a Vibra Cell sonicator (Model VCX 750, Sonics & Materials, Newtown, CT, USA) and α-ABA (25 μmol/L) was added as an internal standard for HPLC analysis. After extraction, samples were lyophilized and resuspended in 400 μL deuterium oxide (D2O) and 10 μL were removed for HPLC analysis.
High Performance Liquid Chromatography
The samples were analyzed using a Hewlett Packard 1100 System (Agilent Technologies, Palo Alto, CA, USA) with fluorescence detection, after derivatization with
13 C and 1 H Magnetic Resonance Spectroscopy
Lyophilized samples were dissolved in 160 μL of deuterium oxide (D2O) containing 0.364 g/L DSS sodium salt and 0.1% ethylene glycol as internal standards for quantification. Samples were transferred into SampleJet tubes (3.0 × 103.5 mm) for insertion into the SampleJet autosampler (Bruker BioSpin GmbH, Reinstetten, Germany).
All samples were analyzed using a QCI CryoProbe 600 MHz ultrashielded Plus magnet (Bruker BioSpin GmbH). The spectra were recorded at 20 °C. 1 H NMR spectra were acquired on this instrument with the following parameters: pulse angle of 90°, 12 kHz spectral width with 66 K, acquisition time 2.66 seconds and relaxation delay 10 seconds. The number of scans was 256. Proton decoupled 13 C MR spectra were obtained on the same instrument using a 30° pulse angle and 30 kHz spectral width with 98 K data points, an acquisition time of 1.65 seconds and a relaxation delay of 0.5 seconds. The number of scans needed to obtain an appropriate signal to noise ratio was 8 K for the forebrain and cerebellum samples and 16 K for the spinal cord samples. TopSpin3.0 software (Bruker BioSpin GmbH) was used for acquisition, integration, and quantification.
Data Analysis
Correction for natural abundance plus correction for nuclear Overhauser enhancement and relaxation effects relative to the internal standard were applied to all relevant resonances in 13 C MR spectra. The term ‘total amount’ of a given metabolite refers to the sum of molecules with 12 C- and 13 C-atoms. When the metabolite is mono-labeled, the percent enrichment is calculated as:

When the metabolite is double-labeled, the percent enrichment is calculated as:

Statistics
Student's
RESULTS
Age- and Region-Dependent Lectin Storage, Microglia Activation, and Astrocytosis
Accumulation of multinucleated monocyte/macrophage-derived globoid cells, microglia activation, astrogliosis, and oligodendro-glial cell death are hallmarks of CNS pathology in GLD murine models.14, 15, 20 In order to better characterize the extent and the progression of pathology in Twi mice, we evaluated the presence of histopathologic markers in the forebrain, cerebellum (Cb), and spinal cord (SC) of Twi mice at PND30 and PND40, corresponding to mildly and fully symptomatic stages of disease progression. Lectin histochemistry shows galactolipid storage in globoid cells of GLD animals. Quantification of the lectin-immunopositive area indicates a dramatic increase and a significant age-dependent progression of tissue deposits in Twi mice when compared with the WT littermates, with a tendency to increased storage in caudal CNS region (SC and Cb;Figure 1A).
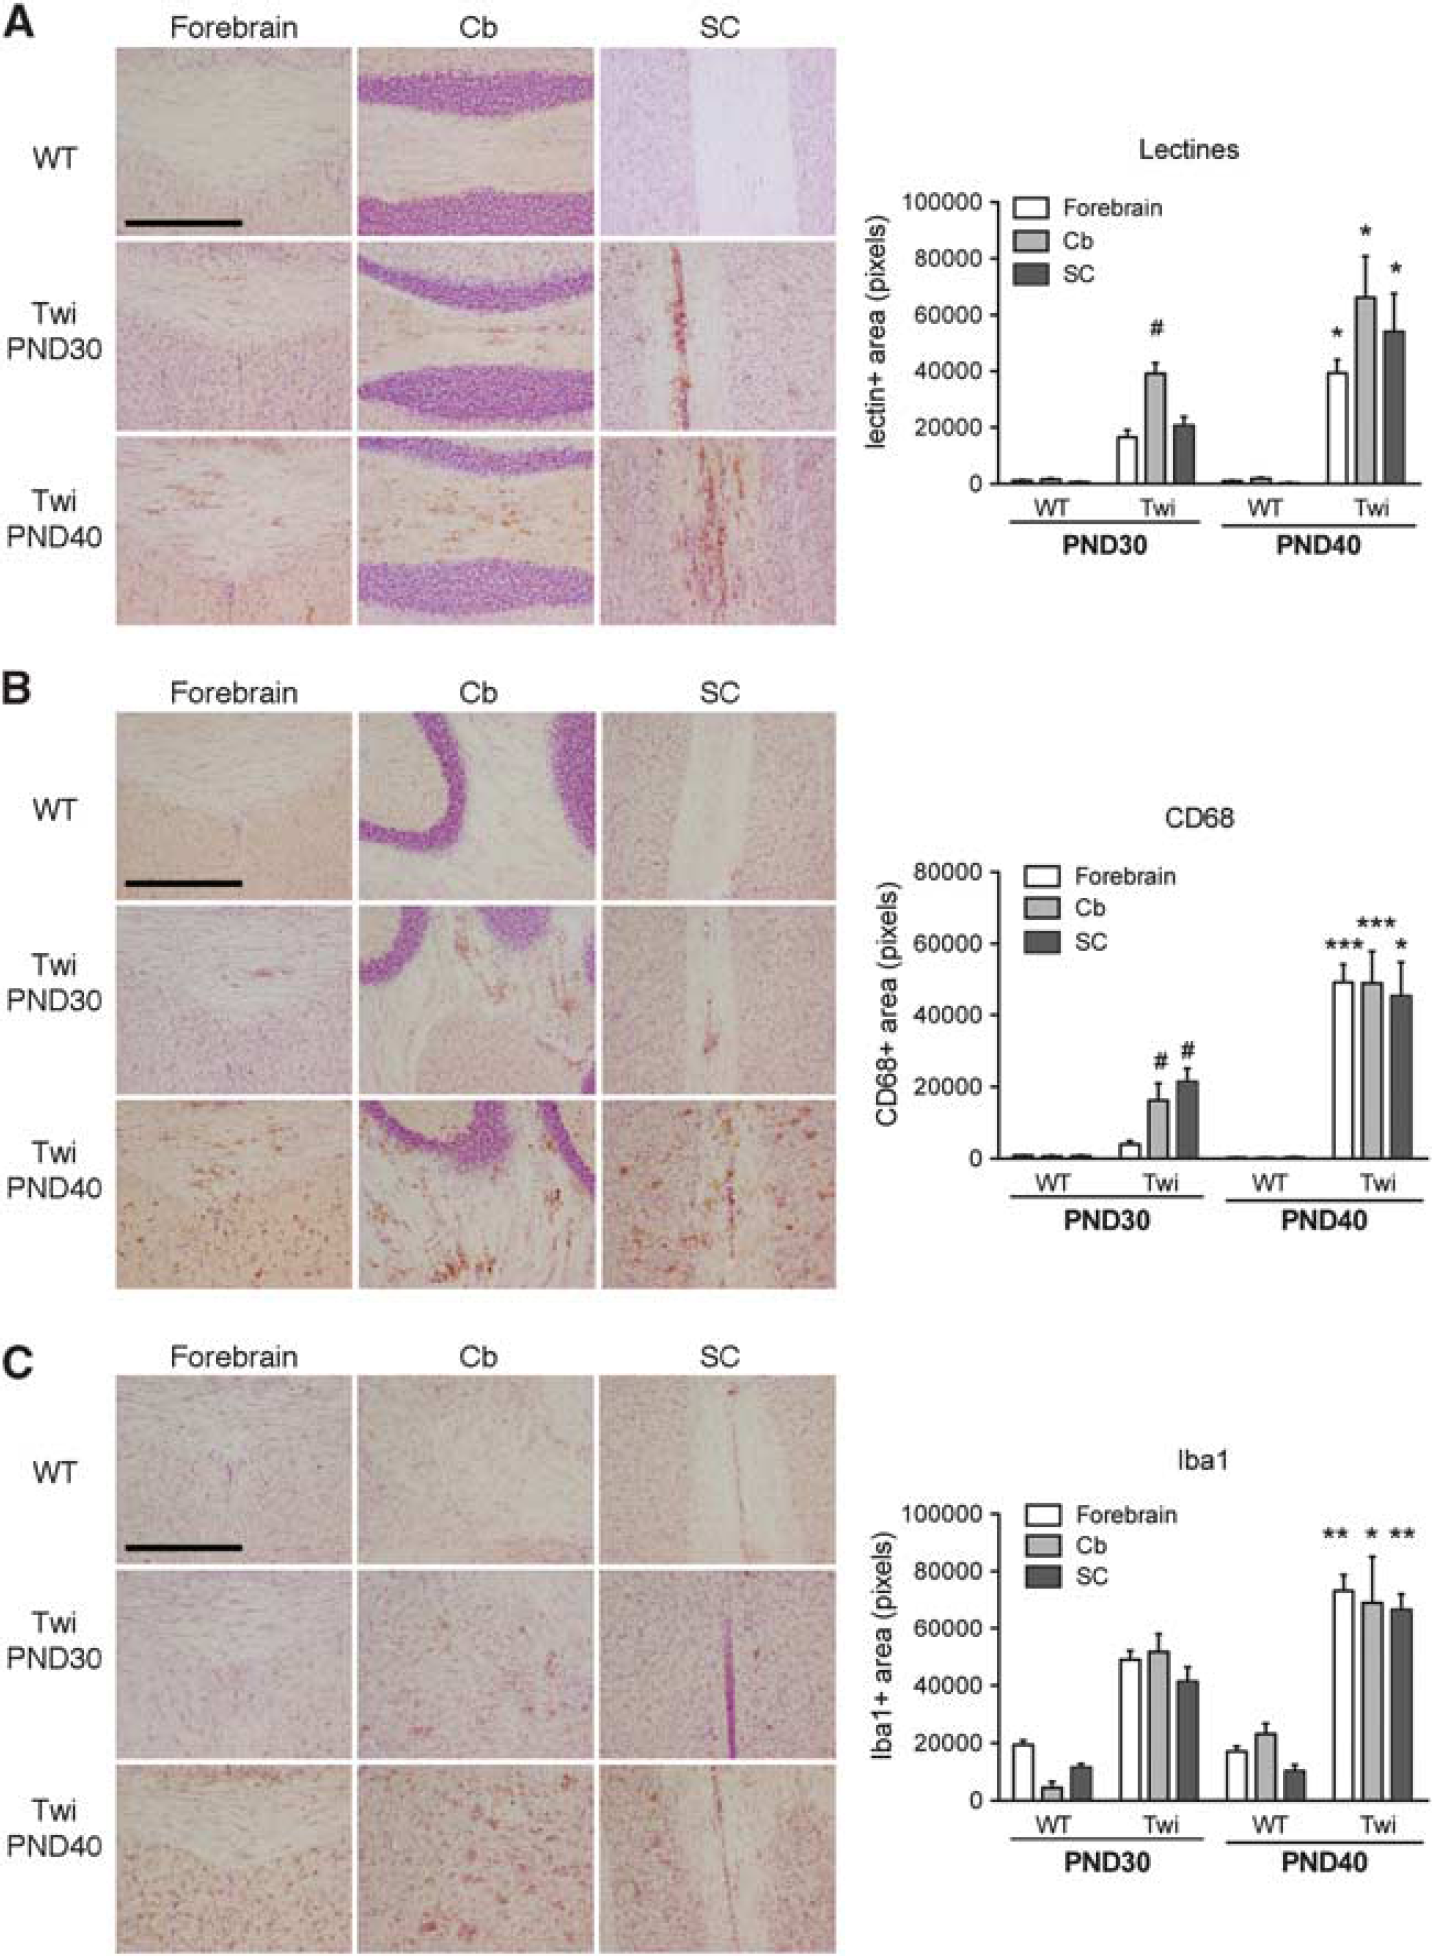
Detection of lectin storage and microglia activation in the central nervous system (CNS) of FVB/Twitcher (Twi) mice. (
CD68, Iba-1, and glial fibrillary acidic protein (GFAP) staining are used to detect the presence and to monitor the activated state of macrophages, microglial, and astroglial cells, respectively. A significant age-dependent increase of CD68 (Figure 1B) and Iba-1 immunoreactivity (Figure 1C) was observed in all the CNS regions analyzed in Twi mice when compared with the WT mice. The increase of immunoreactivity is probably an expression of both increased number and altered morphology of macrophages/microglial cells, which have large and round-shaped somata with thick protrusions. 15 Upregulation of GFAP expression was observed in the forebrain white and gray matter, Cb and SC of Twi mice at PND30 (Figures 2A and B). Astrogliosis worsened at PND40, particularly in the SC, in which we detected numerous GFAP + cells displaying enlarged somata and thick processes typical of activated astrocytes (Figure 2C).
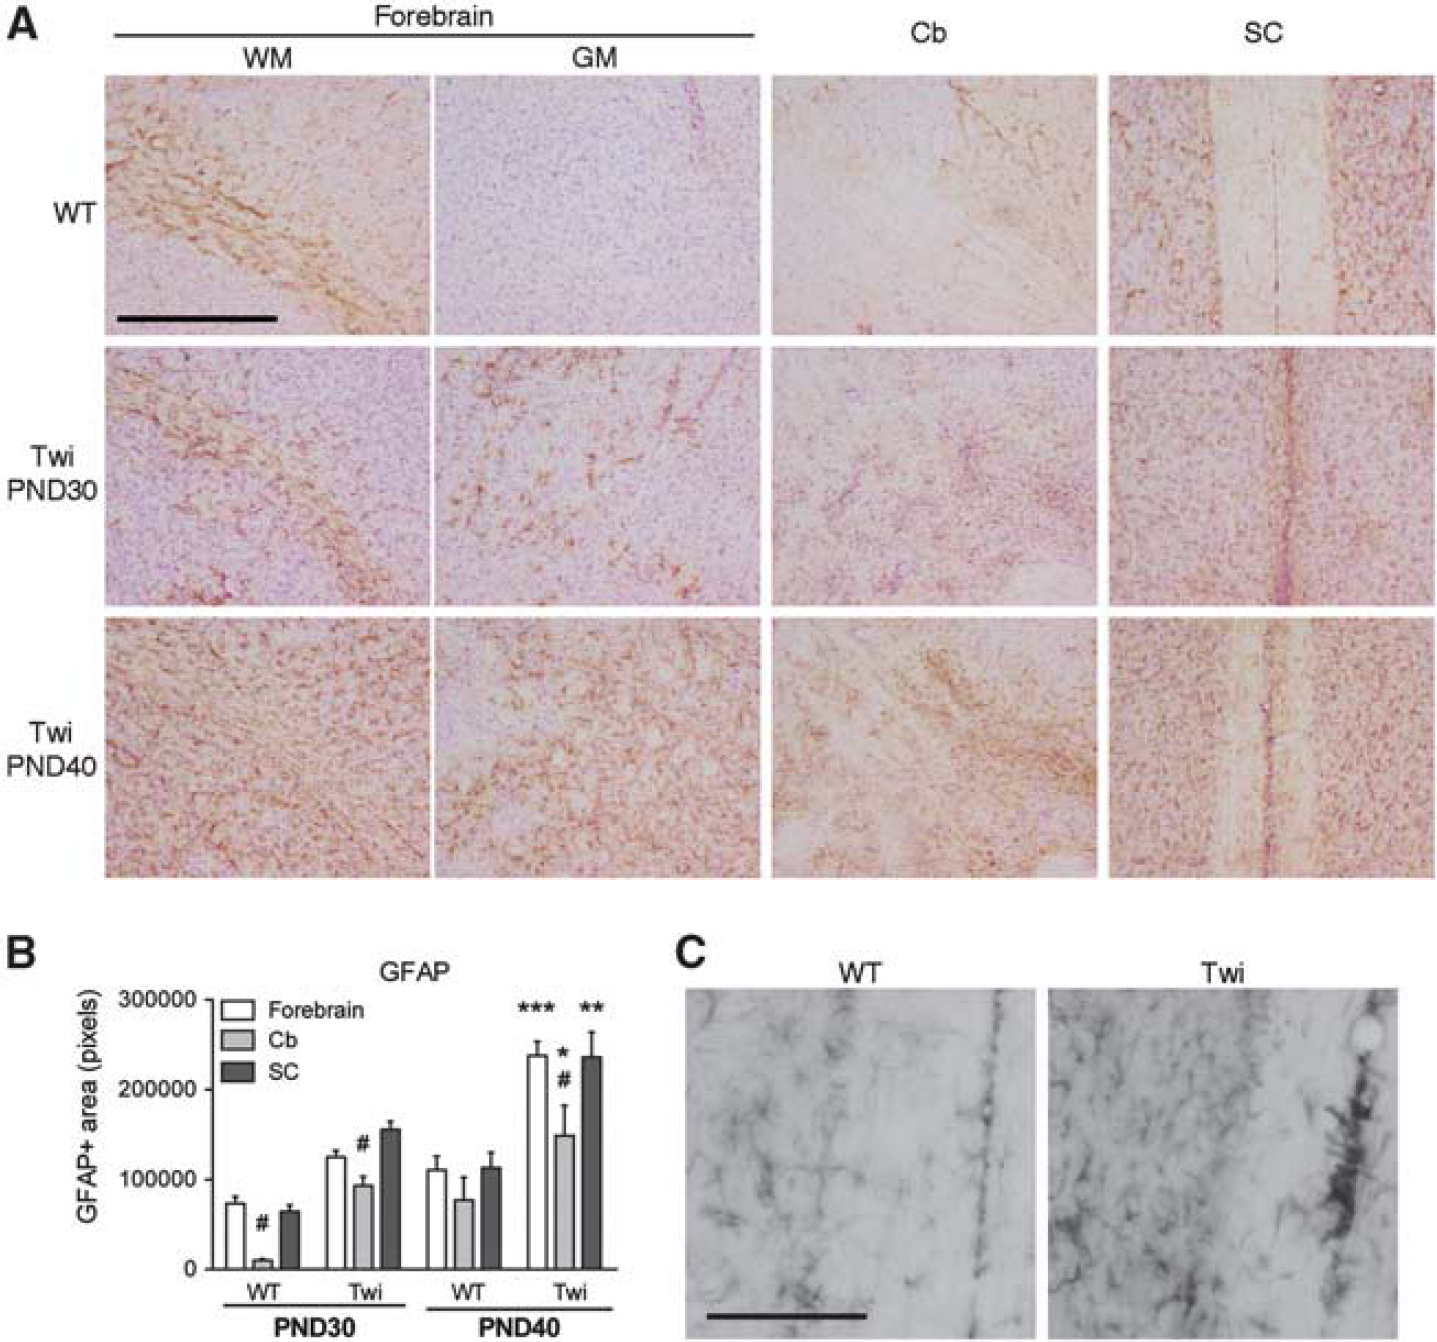
Astrogliosis in the central nervous system (CNS) of FVB/Twitcher (Twi) mice. Immunohistochemistry analysis using anti-glial fibrillary acidic protein (GFAP) antibody was performed on selected Forebrain (WM, white matter; GM, gray matter), cerebellar (Cb), and spinal cord (SC) tissue slices from PND30 and PND40 wild-type (WT) and Twi mice. (
Age- and Region-Dependent Oligodendroglial Death and Neurodegeneration
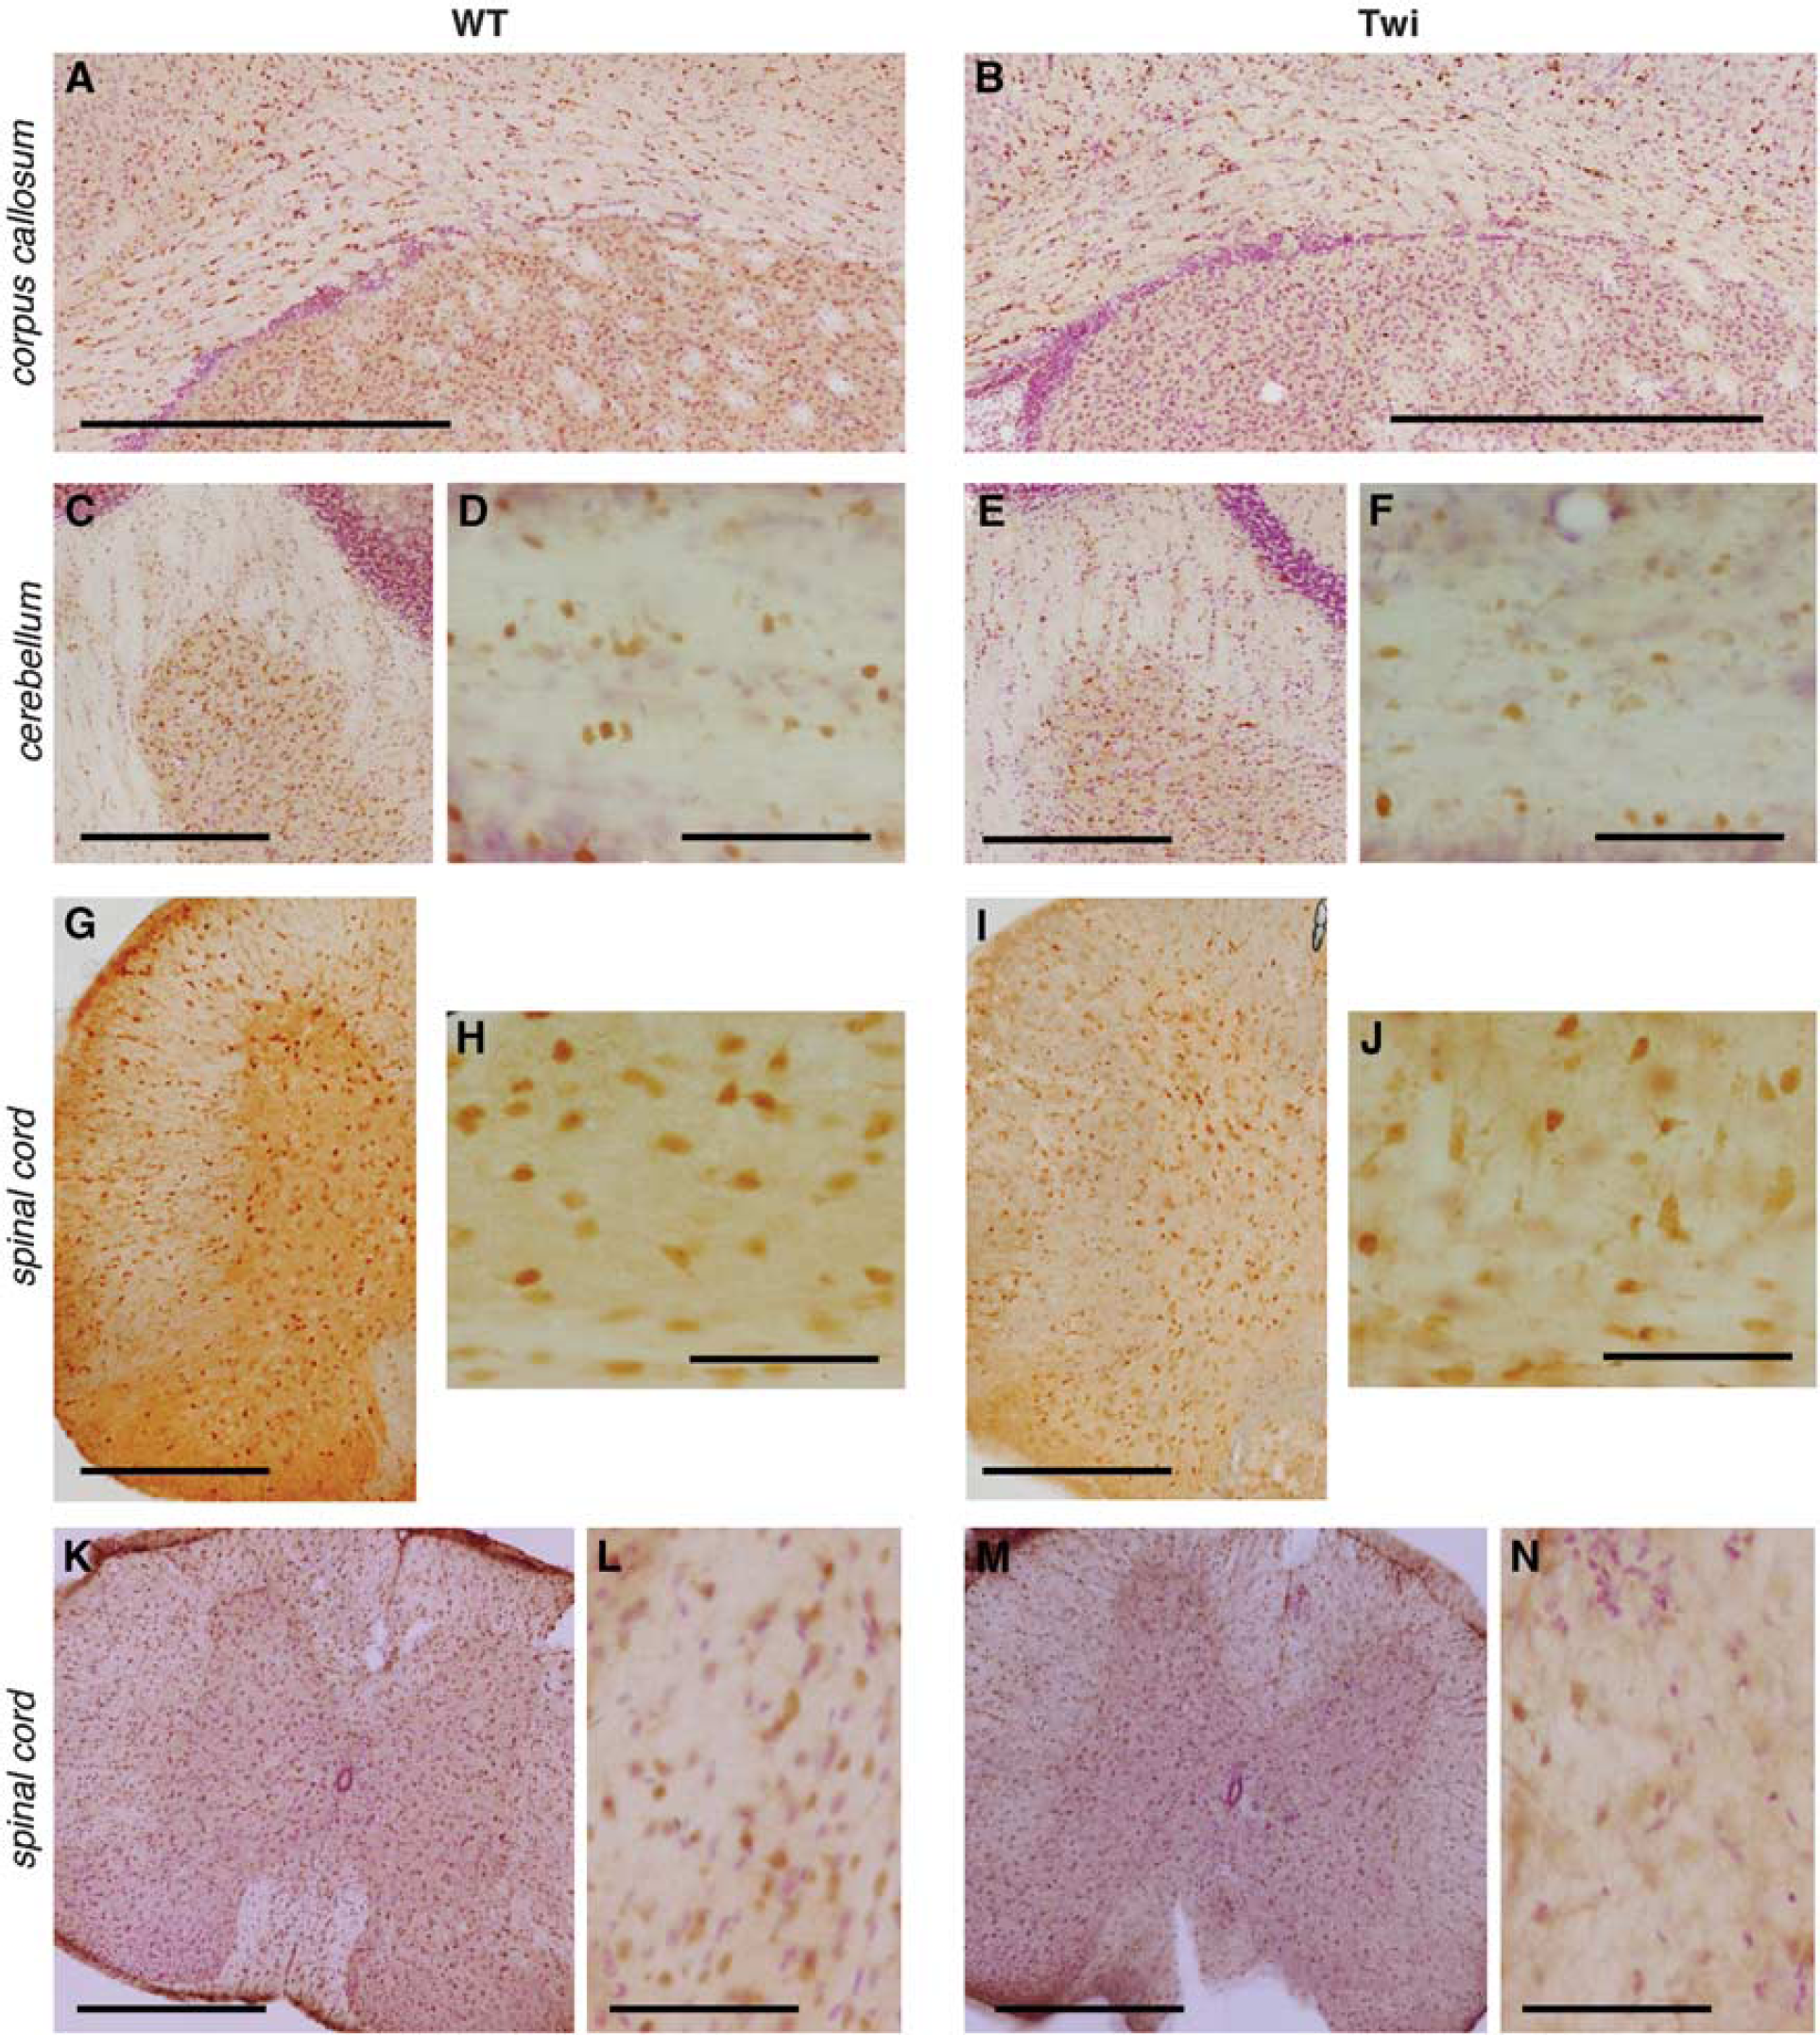
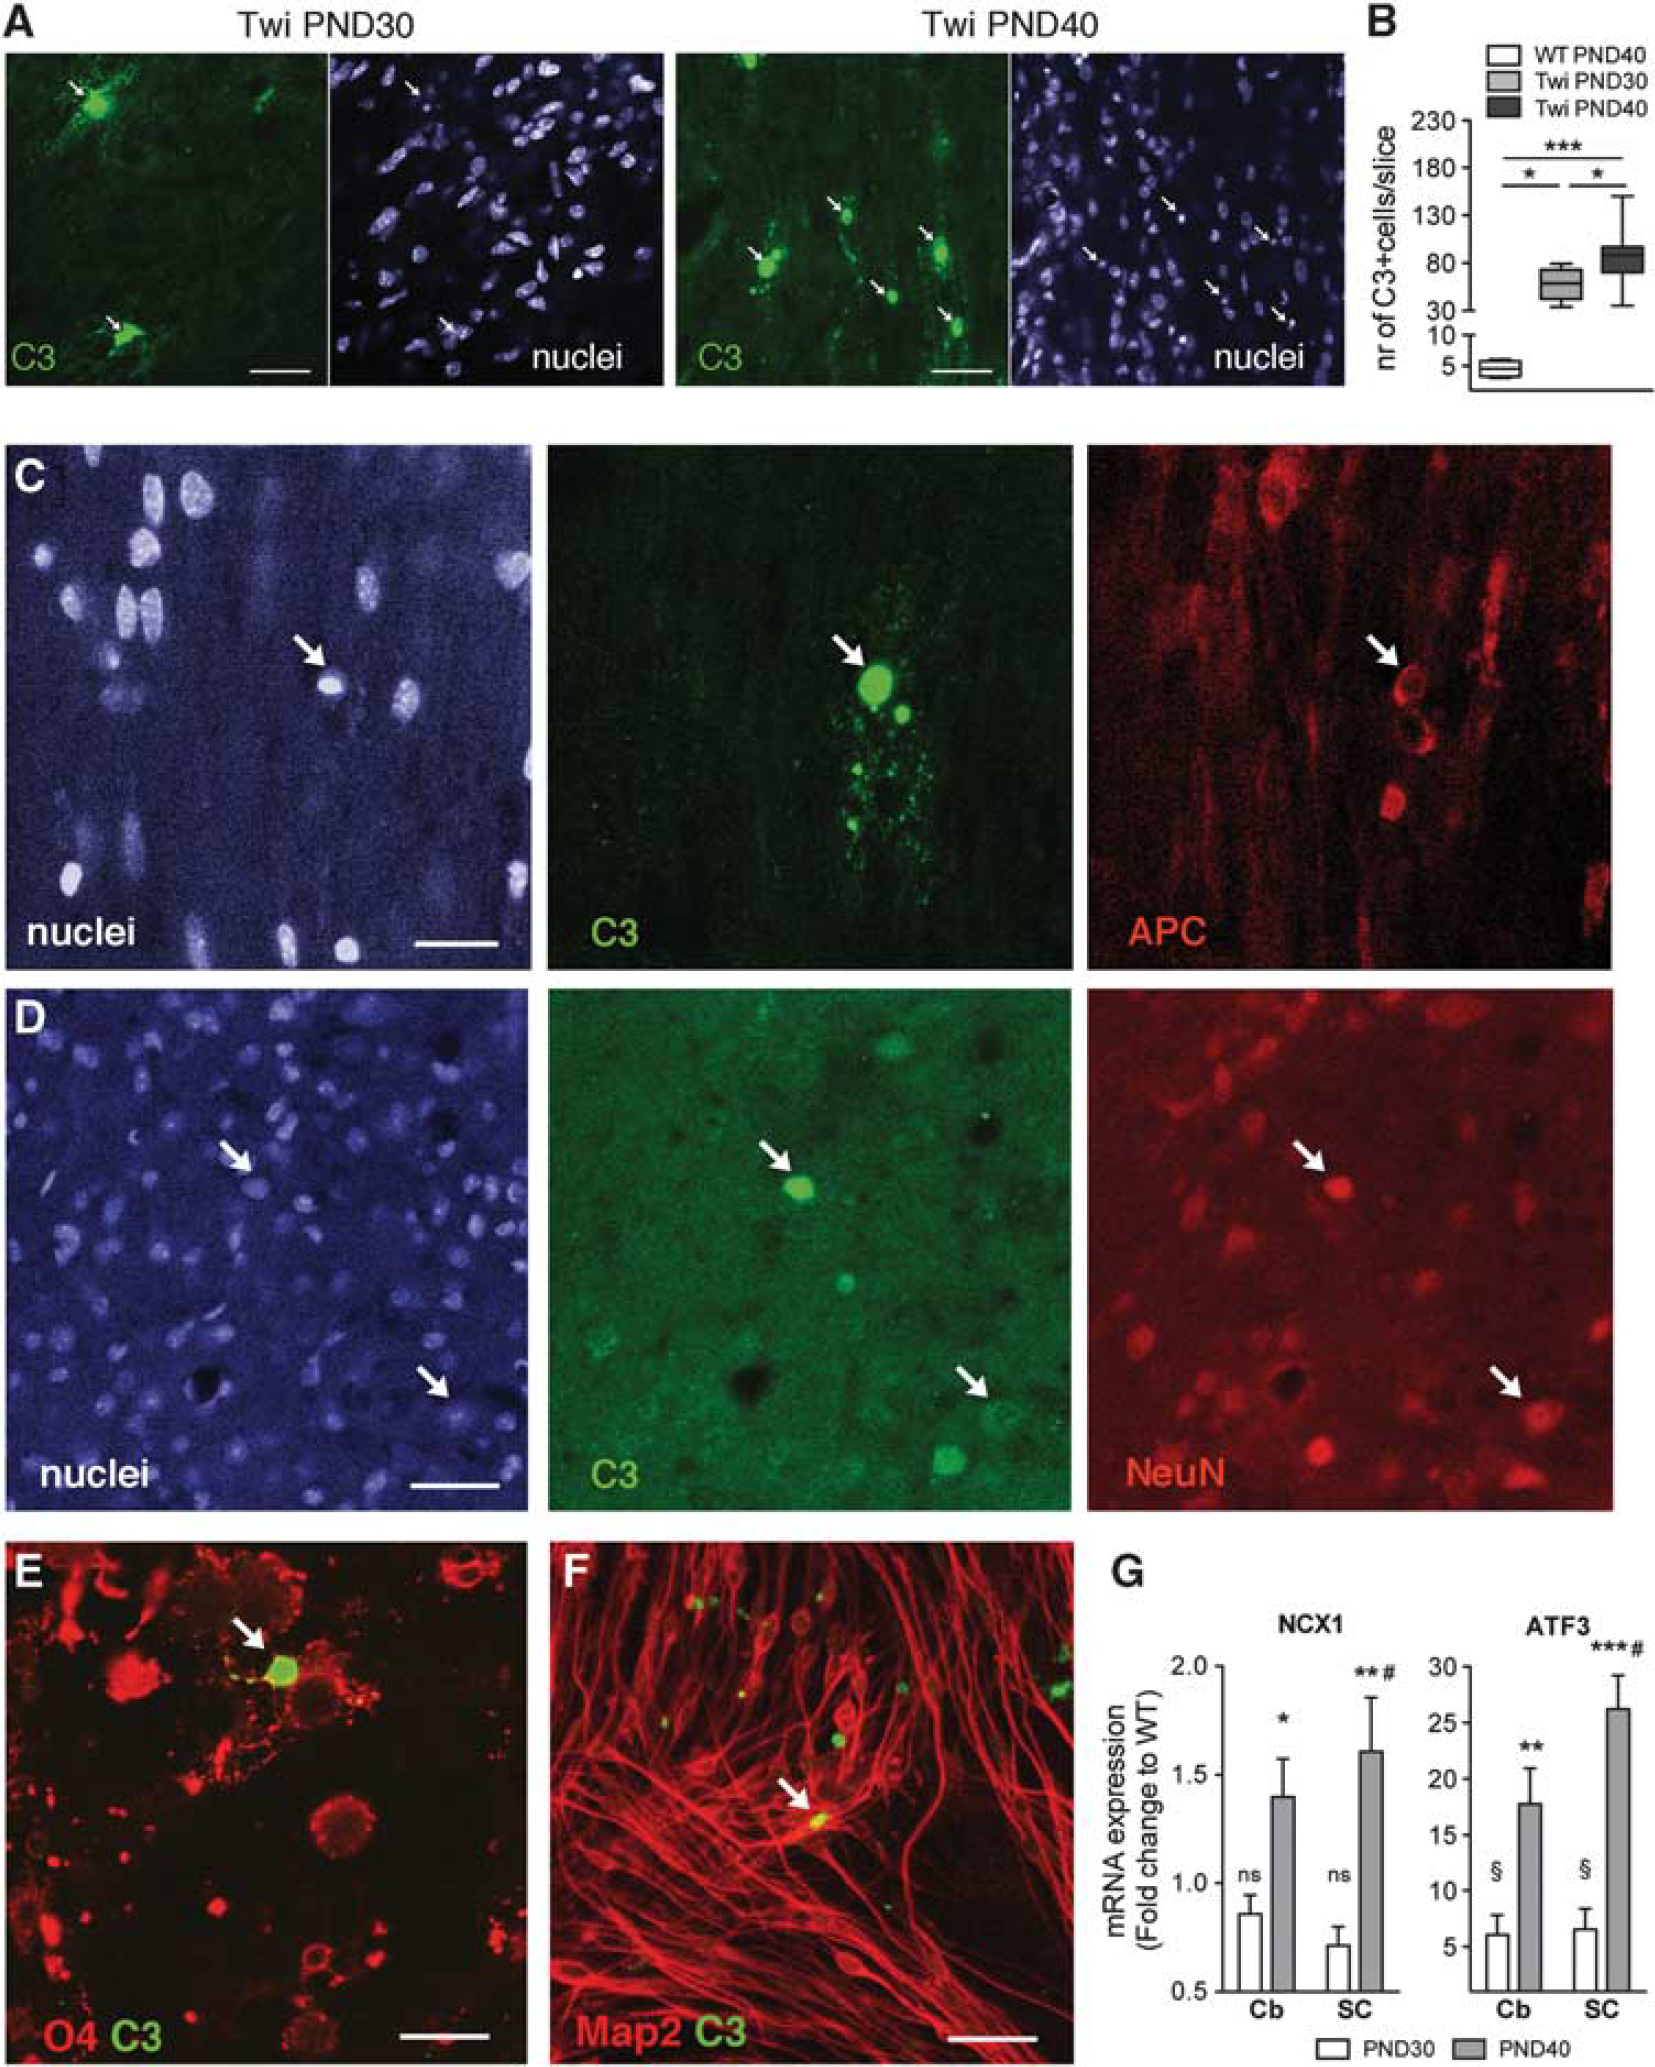
We have previously demonstrated that Twi mice display a mild and patchy demyelination in the forebrain white matter at late stages of the disease, with oligodendrocyte loss and a general derangement of the remaining cells along the white matter tracts. 15 Using an antibody that targets the oligodendrocyte-specific GST-π protein, we show here that altered morphology and arrangement of oligodendrocytes are not merely a feature of the forebrain white matter (Figures 3A, B) but also characterize the Cb at PND40 (Figures 3C-F) and the SC, both at PND40 (Figures 3G-J) and PND30 (Figures 3K-N). Importantly, these abnormalities were associated to increased apoptotic cell death, as assessed by the significant increase of cells expressing cleaved-caspase-3 (C3) in the SC at PND30 and PND40 (Figures 4A and B), the majority of which displayed oligodendroglial morphology (Figure 4A) and expressed the oligodendroglial marker APC (Figure 4C). Scattered apoptotic neurons were also detected in the SC at PND40 (Figure 4D;NeuN). In addition, increased numbers of apoptotic oligodendrocytes (Figure 4E; O4) and, to a lesser extent, neurons (Figure 4F; Map2), were found in primary cell cultures established from the Cb and SC of Twi mice at PND40. Further indication of neuronal dysfunction came from the expression of the sodium-calcium exchanger (NCX1) and activating transcription factor 3 (ATF3), two markers of neurodegeneration, 21 whose mRNA expression levels were upregulated as a function of age (PND30 < PND40) in the Cb and, to a larger extent, in the SC of Twi mice when compared with WT (Figure 4G).
Overall, these data strongly suggest that degeneration of neurons in addition to oligodendrocyte dysfunction are present in Twi mice at a mildly symptomatic stage, before overt neuronal death and demyelination, as previously described in the original Twitcher model.6,22
Age- and Region-Dependent Changes in Metabolite Content and 13 C labeling
We next investigated whether the age- and region-dependent pathologic events described in Twi mice could be related to potential metabolic changes. To this end, we used 1 H MRS to quantify amounts of several key metabolites (for a typical spectrum see Supplementary Figure 1A). The major metabolic changes observed (Supplementary Table 1) conform to a region-and age-dependent pattern. In agreement with neuropathology findings, metabolism in the SC was affected earliest and most severely. Indeed, the levels of 11 and 12 out of the 17 compounds tested were significantly altered in SC at PND30 and PND40, respectively. In comparison, 5 and 3 compounds had altered levels in the Cb and forebrain respectively (Supplementary Table 1). Assessments of astroglial and neuronal metabolism and their interactions were obtained by 13 C MRS analyses of 13 C incorporation from [1,2- 13 C]acetate and [1- 13 C]glucose into glutamine and amino-acid neurotransmitters (for a typical spectrum see Supplementary Figure 1B). In this way, a dynamic metabolic picture of the time interval between injection of the labeled precursors and the termination of the experiment was acquired (for metabolic pathways see Supplementary text and Supplementary Figure 2).
No significant alterations in [1,2-
13
C]acetate- and [1-
13
C]glucose-derived label in forebrain and cerebellum were found (data not shown), with the exception of a reduced [4,5-
13
C]glutamate amount in the forebrain of Twi mice at PND40 (Twi: 205 ± 19 nmol/g,
Glycolysis-Related Metabolites
Glucose content in the forebrain and Cb was similar in Twi and WT mice (Supplementary Table 1). In the SC, glucose content was larger in Twi mice at both ages and a significant age-dependent increase was found in both Twi and WT mice (Supplementary Table 1 and Figure 5A). An increase was also observed in the amount of [1- 13 C]glucose in WT mice (Figure 5B). This increase was larger than that of the total glucose amount since there was a significantly higher percent enrichment with [1- 13 C]glucose observed in WT SC at PND40 (Figure 5C).
Significant higher lactate levels characterized the Cb and SC (but not the forebrain) of Twi mice at PND30. However, differently from the WT, lactate levels as well as lactate label (Figure 5E) and percent enrichment (Figure 5F) tended to decrease with age in the SC of Twi mice, without reaching statistical significance (Supplementary Table 1 and Figure 5D). The total amount of lactate reflects anaerobic metabolism and results from a balance between production, transport, and clearance in glial and neuronal cells. Lactate produced in astrocytes and oligodendrocytes can be used as a neuronal fuel source by myelinated axons when energy levels are low.
9
Lactate crosses cell membranes (with the concentration gradient) via the monocarboxylate transporters (MCTs), which ensure rapid equilibration of this metabolite
Oligodendrocyte morphology and organization in the central nervous system of FVB/Twitcher (Twi) mice. Immunohistochemistry using an antibody to GST-π performed on selected tissue slices from WT and Twi mice shows altered organization of the white matter in the corpus callosum (
Apoptosis and neurodegeneration in the central nervous system of FVB/Twitcher (Twi) mice. (
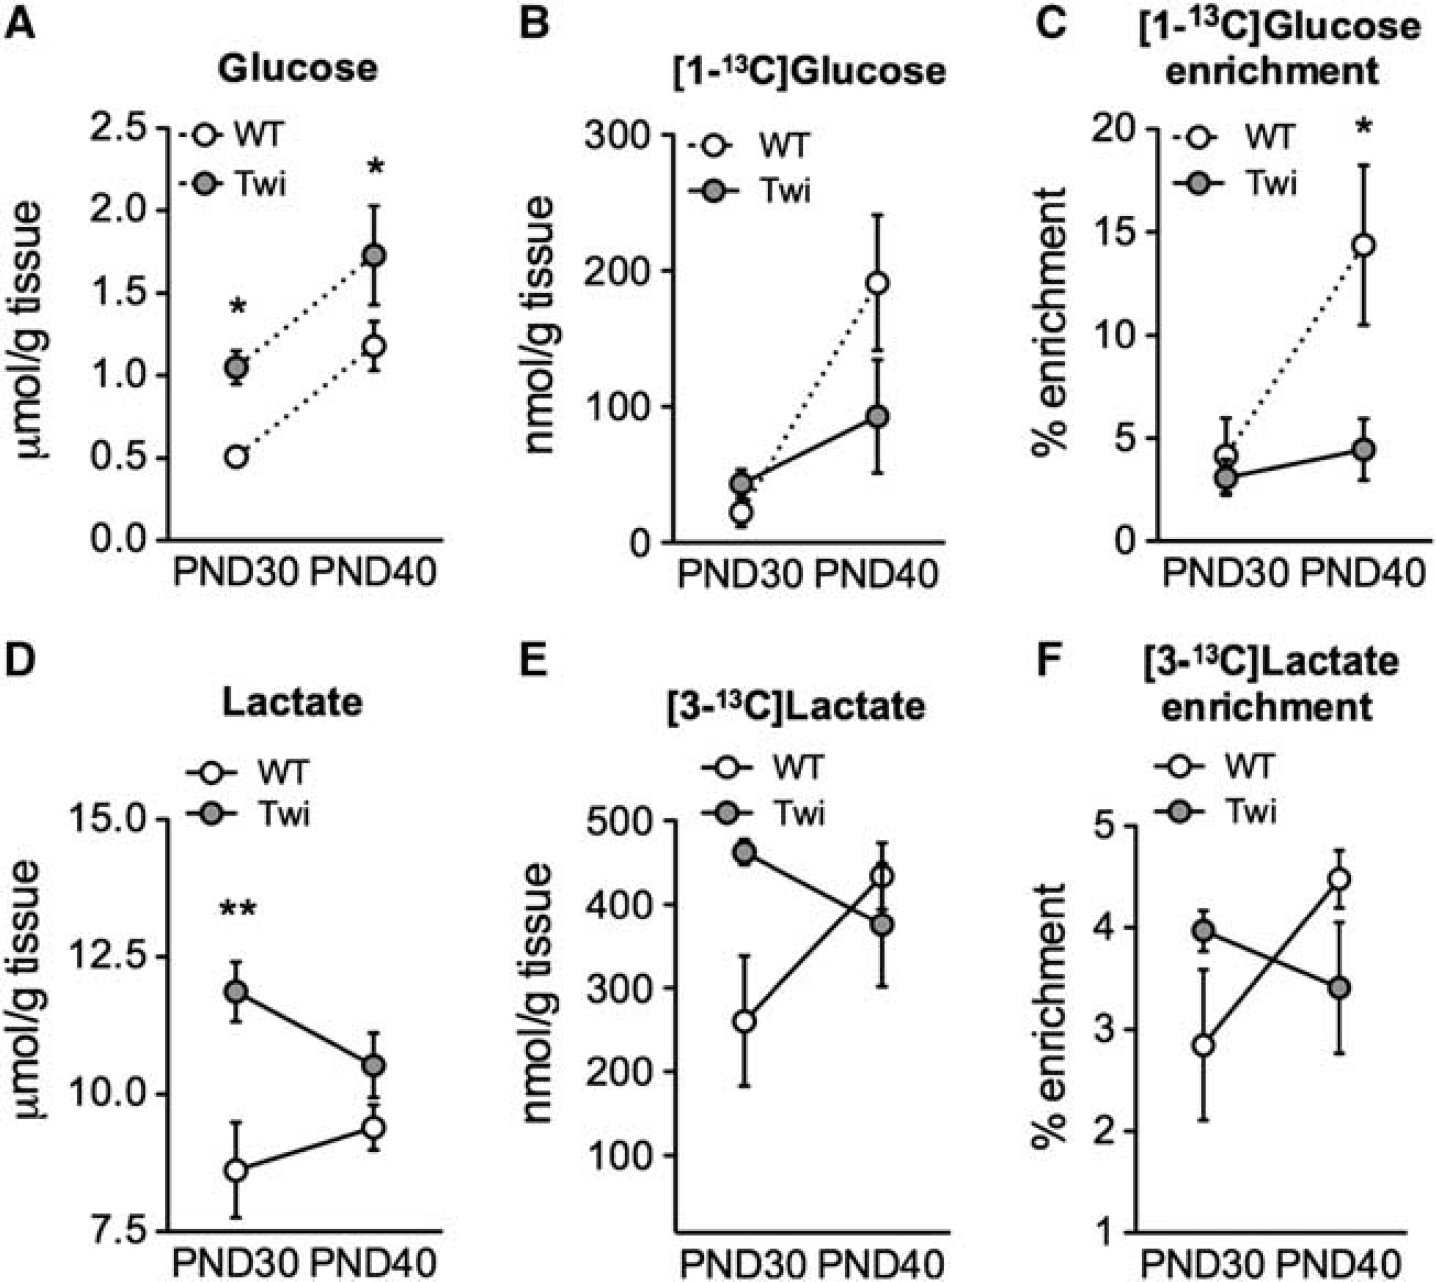
Glycolysis in the central nervous system of FVB/Twitcher (Twi) mice and controls. Twi mice and wild-type (WT) littermates were injected at PND30 and PND40 with [1-
13
C]glucose and [1,2-
13
C]acetate and brain extracts were analyzed by
13
C and
1
H MRS. Diagrams represent levels of the glycolysis-related metabolites: glucose and lactate. (
Amino-Acid Metabolism
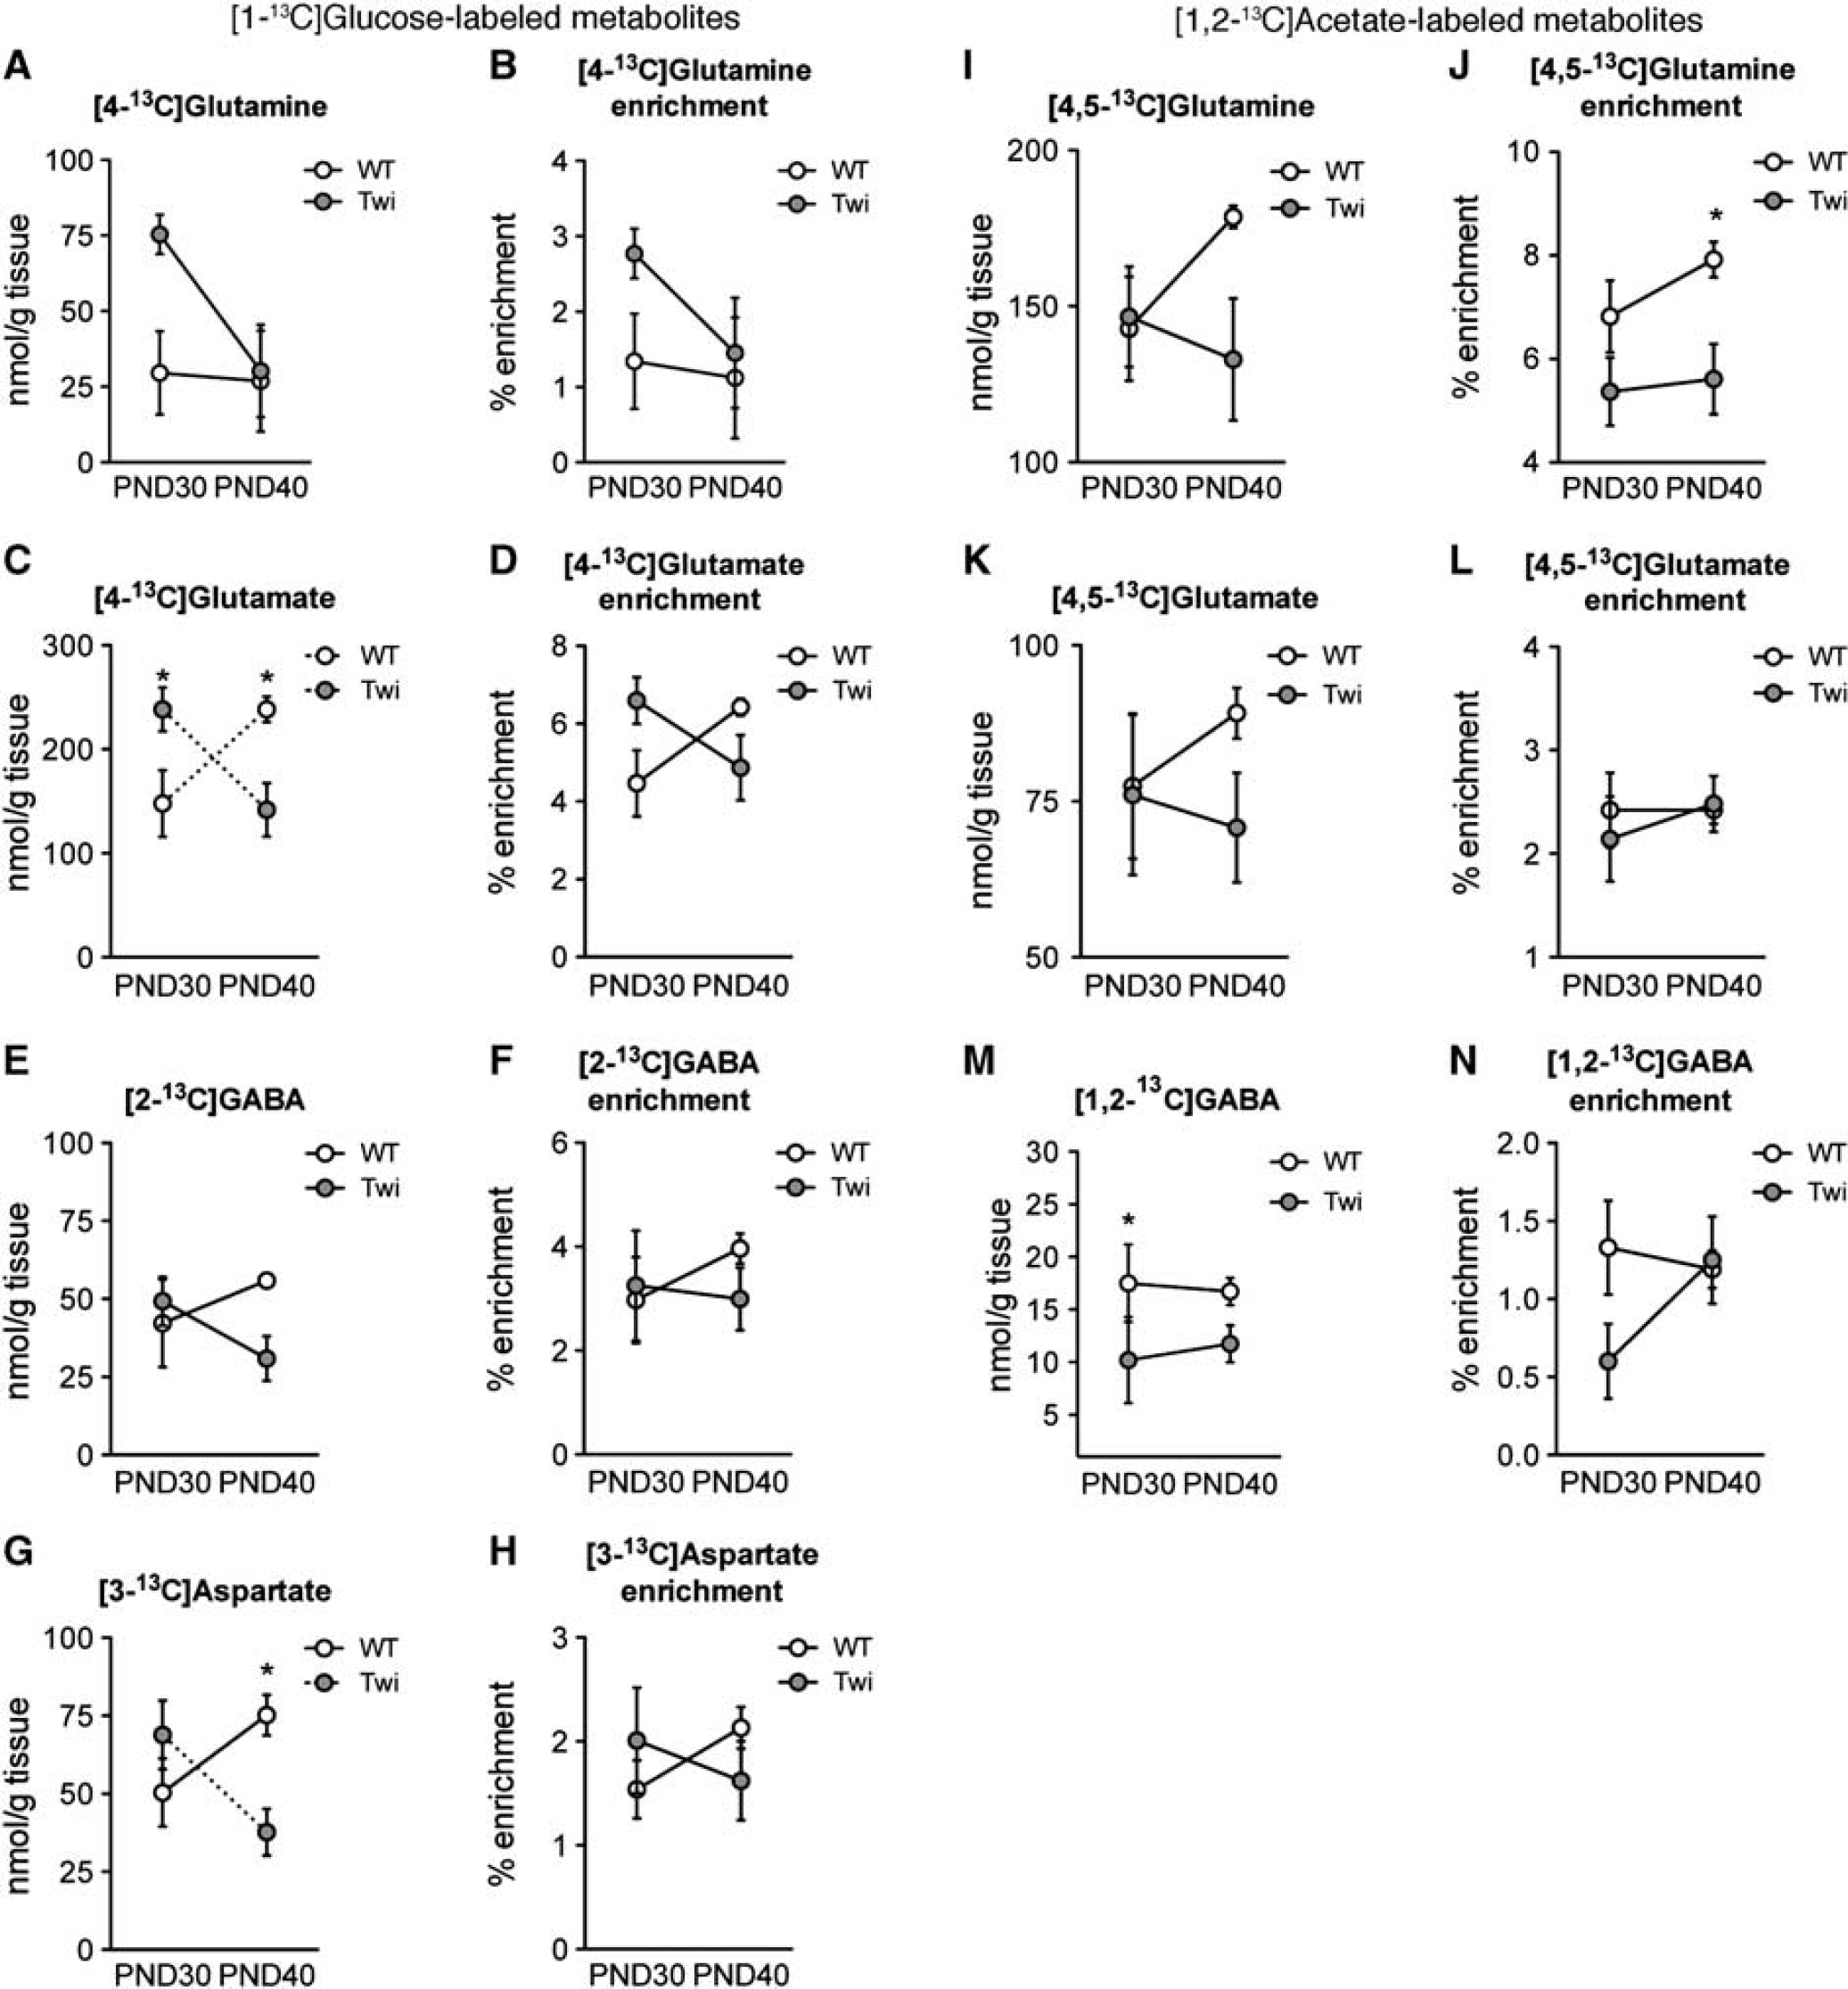
Expression of the astrocytic marker GFAP was increased in all brain regions of Twi mice at both time points (PND40 > PND30). Accordingly, the amount of glutamine, which is synthesized only in astrocytes, was significantly higher at PND30 in the SC and at PND40 in the forebrain (Supplementary Table 1). In the SC, [1 - 13 C]glucose-derived label in glutamine follows a similar pattern as that of the total amount of glutamine, although not reaching statistical significance (Figures 6A and B).
Neuronal and astrocytic metabolism in the spinal cord of FVB/Twitcher (Twi) mice and controls. Twi mice and wild-type (WT) littermates were injected at PND30 and PND40 with [1-
1
C]glucose and [1,2-
13
C]acetate and brain extracts were analyzed by
13
C and
1
H MRS. (
Aspartate, the other excitatory amino-acid neurotransmitter, showed a similar age-dependent decrease of total amount (Supplementary Table 1) and amount of [3- 13 C]aspartate (Figures 6G and H). The reported decrease in glutamine from PND30 to PND40 in Twi mice (Supplementary Table 1) is accompanied by reduced percent enrichment of 13 C labeling from [1,2- 13 C]acetate in glutamine at PND40 (Figures 6I and J), suggesting an emerging metabolic dysfunction in astrocytes. No significant alterations were detected in [4,5- 13 C]glutamate levels and enrichment (Figures 6K and L), indicating that the observed alterations in glutamate levels are more likely related to neuronal disturbances (see also Supplementary Figure 2). Glutathione (γ-glutamylcysteinyl-glycine;GSH) level was higher than control at PND30 in both the Cb and SC but decreased significantly at PND40, possibly indicating an attempt to counteract emerging toxicity (Supplementary Table 1).
GABA and glycine are the two major inhibitory neurotransmitters of the spinal cord. Even though their actions are very much intertwined in the SC, they were differently altered in the Twi mice. Quantification of glycine (Supplementary Table 1) indicated a pattern of increasing concentration in a rostral to caudal direction. Glycine content was unaltered in forebrain and Cb (Supplementary Table 1). In the SC, however, glycine levels were higher in Twi mice at PND30, but dropped significantly at PND40, reaching a level below that of WT mice (Supplementary Table 1). No 13 C enrichment was detected in glycine (data not shown), indicating a slow turnover of this neurotransmitter. GABA levels in the forebrain, Cb and SC (Supplementary Table 1) and [1- 13 C]glucose-derived label in GABA in the SC (Figures 6E and F) were not significantly altered while [1,2- 13 C]GABA content (derived from [1,2- 13 C]acetate) was decreased at PND30 in the SC (Figures 6M and N), suggesting impaired transport of glutamine from astrocytes to GABAergic neurons.
NAA and NAAG Metabolism
NAA and NAAG are both produced and released from neurons. NAAG is hydrolyzed to NAA and glutamate by a transmembrane metalloprotease localized on the astrocyte plasmalemma. 25 NAA is hydrolyzed to acetate and aspartate by aspartoacylase, which is predominantly located in oligodendroglia. 26 In the present study, NAA and NAAG levels were unchanged in the Cb and forebrain of Twi mice compared with WT (Supplementary Table 1). In the rat brain, NAA content reaches mature levels at PND21 in striatum, cortex, and hippocampus, 27 in accordance with the results in the Cb and forebrain of WT littermates in the present study (Supplementary Table 1). However, spinal NAA levels were still increasing in WT mice between PND30 to PND40 (Figure 7A). In Twi mice, NAA amount was higher at PND30 but dropped significantly at PND40 (Figure 7A). NAA accumulation is probably the consequence of disturbed oligodendrocyte catabolism rather than increased oligodendrocyte precursor recruitment since we did not observe any increase in proliferating NG2-expressing cells in Twi mice compared with WT (data not shown). NAAG levels were unchanged in the SC at PND30, suggesting intact astrocytic catabolic apparatus. However, similar to NAA, NAAG decreased significantly at PND40, reaching levels significantly lower than WT (Figure 7B), suggesting decreased production of these metabolites in neurons.
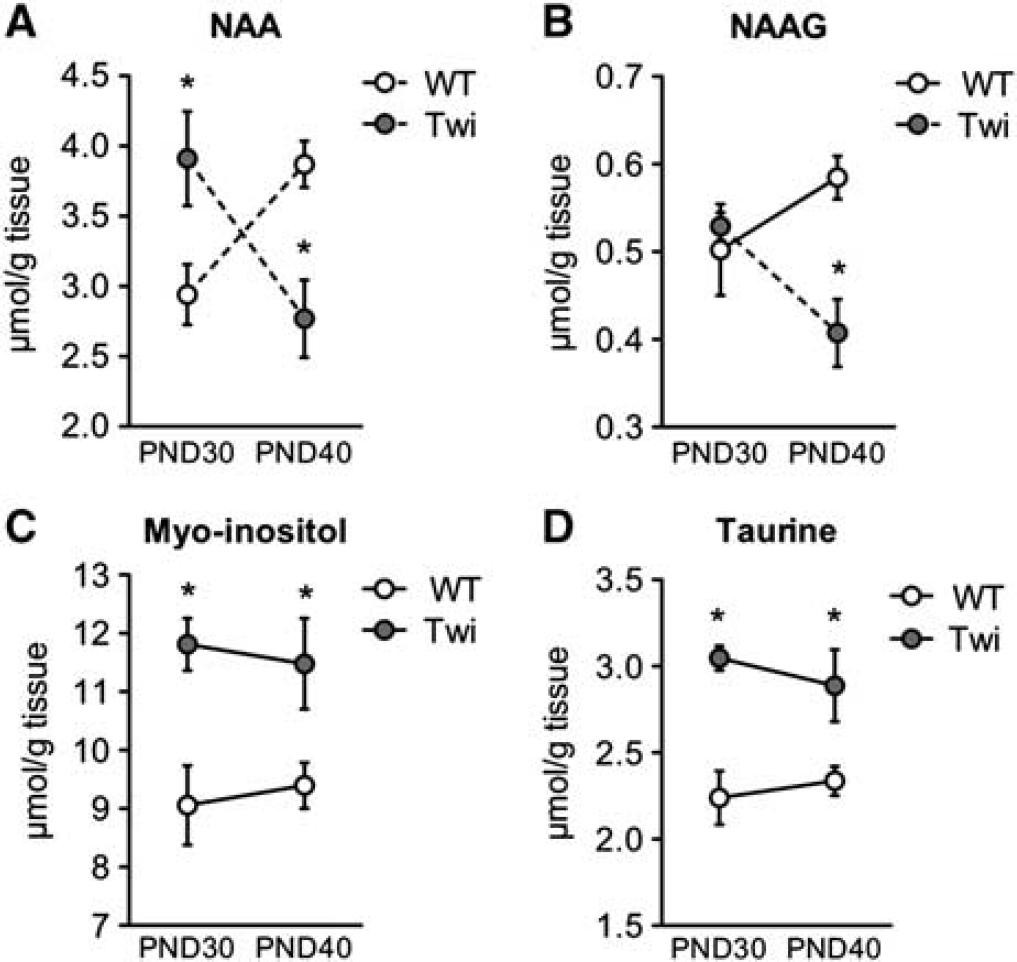
Amounts of N-acetylaspartate (NAA), N-acetylaspartyl glutamate (NAAG), and osmolytes in the spinal cord of FVB/Twitcher (Twi) mice and controls. Extracts from spinal cord at PND30 and PND40 were analyzed by
1
H MRS (with the exception of taurine, which was measured by high performance liquid chromatography) to quantify amounts of (
Osmolytes
Levels of myo-inositol, an osmolite and astrocyte marker, 28 were unchanged in the forebrain but increased levels were observed at PND40 in the Cb (Supplementary Table 1) and at both ages in the SC (Figure 7C), in agreement with the increased astrogliosis documented by immunohistochemistry in these caudal–CNS regions. Similarly, we observed a trend for increased taurine level in Twi mice, which is significant in the SC (Figure 7D) and in the forebrain at PND40 (Supplementary Table 1).
Overall, these results strongly suggest significant age- and region-dependent metabolic disturbance in CNS tissues of GLD mice that involves production and/or transport of specific metabolites in astrocytes, neurons and oligodendrocytes and affects the reciprocal interactions between these cell types.
DISCUSSION
The aim of this study was to correlate the occurrence of disturbances in metabolite amounts and [1- 13 C]glucose- and [1,2- 13 C]acetate-metabolism in GALC-deficient Twi mice with histopathological and molecular analyses. This made it possible to connect the observed metabolic changes to alterations in axonal-oligodendroglial and synapto-astrocytic interactions at two subsequent stages of disease progression.
In line with the disease progression, we observed the more robust neuropathological changes in the SC and in the Cb. Interestingly, while the neuropathological alterations correlated well with metabolic changes in the SC, this association was less clear in the Cb, where a closer link was found between neuropathological and molecular markers. This apparent discrepancy is likely the outcome of several overlapping causes, which include the different type of assessment and the different sensitivity of each method (morphologic versus molecular versus functional).
Dysfunctional Oligodendroglial-Neuronal Metabolism in the Twitcher Central Nervous System
Interactions between neurons and oligodendrocytes take place predominantly in the axonal region and are vital for signal transduction. 7 In GLD, this communication is compromised due to oligodendroglial and neuronal dysfunction.6,22 The increased number of apoptotic oligodendrocytes and, to a lesser extent, neurons that we observed at PND30 and PND40 in the Cb and SC of Twi mice might be a consequence of psychosine accumulation. Indeed, previous reports have shown predominant upregulation of caspase-3 in oligodendrocytes and neurons in tissues and primary cultures derived from Twi CNS that could be prevented or reduced by providing a functional source of the GALC enzyme.5,6 Psychosine induces a number of toxic events in neural cells including mitochondrial dysfunction. 4 The latter alters cerebral energy metabolism, which is tightly coupled to glucose consumption and lactate production.
Despite our efforts in reducing the time interval between euthanasia of treated mice and snap freezing of tissues, unavoidable postmortem metabolism did produce some variability in the levels of glycolysis metabolites (measured in individual samples). We took this issue into account when interpreting data. Our results suggest that metabolism of [1- 13 C]glucose was similar in SC of Twi mice and WT littermates at PND30. Also, the amounts of neuronal and astrocytic metabolites labeled from [1- 13 C]glucose or [1,2- 13 C]acetate were unchanged or, in the case of [4- 13 C]glutamate, increased in neurons. Thus, the larger total amount of glucose in Twi mice compared with controls suggest that glucose accumulation might be due to reduced oligodendroglial utilization. Low glucose utilization is a characteristic of multiple sclerosis (MS) 29 and leukodystrophies, 30 suggesting that glucose hypometabolism could be a common trait of oligodendrocyte-linked disorders.
High lactate levels indicate reduced oxidative metabolism. Lactate accumulates frequently in white matter regions of patients with leukodystrophies, such as infantile GLD, 13 adrenoleukodystrophy (ALD), 31 and metachromatic leukodystrophy (MLD). 12 The increased lactate content detected in the SC and Cb of Twi mice at PND30 is most likely a result of increased production in oligodendrocytes, and not in astrocytes or neurons, since, as stated above, the amount of neuronal and astrocytic metabolism was largely unchanged. The increased lactate content in oligodendrocytes might be compensating for the decreased mitochondrial function due to psychosine accumulation, which particularly affects this cell population. This is also suggested by the significant increase in apoptotic events documented in this study.
The age- and region dependent upregulation of MCT4 (robust) and MTC1 (moderate) mRNA levels in Twi tissues (PND40>PD30; SC>Cb) might be linked to the altered glucose/lactate metabolism and transport. However, given the predominant expression of these transporters in glial cells,23,9 we cannot exclude that the upregulation observed in this study might be secondary to neuroinflammation occurring in the Twi CNS during disease progression.
NAA content is commonly viewed as a marker of neuronal viability, density, and structural integrity. However, accumulation of NAA as seen in the present study in Twi mice at PND30 is likely a consequence of dysfunctional oligodendrocytes, since the use of NAA-derived acetate for fatty acid synthesis exclusively occurs in these cells. 32 Again, this correlates with increased apoptosis detected in this cell population in the SC of Twi mice. The increase in NAA content observed here might be due to reduced usage of acetate for acetyl-CoA synthesis in mitochondria, which has been recently demonstrated in a murine model of Canavan disease, a genetic demyelinating pathology. 33
Altered Metabolism in the Astroglial Compartment of Twitcher Mice The astroglial compartment was assessed by analyses of myoinositol, NAAG, and glutamine content, in addition to [1,2- 13 C]acetate metabolism and GFAP staining. Myo-inositol is regarded as an astrocytic marker and is consistently elevated in the white matter of patients with GLD, 13 MLD, 12 PMD 34 and ALD. 31 In a murine model of Alexander disease, a primary astrogliopathy in which astrocytes overexpress GFAP, increase in both taurine and myo-inositol occurs. 35 Similar changes in osmolyte levels in the presence of increased GFAP expression were also observed in the SC of Twi mice in the present study. No further increase was observed in the amounts of taurine and inositol from day 30 to day 40, possibly suggesting that a maximum had been reached. Moreover, region-and age-dependent alterations in myo-inositol and taurine reflected the caudal-to-rostral disease progression.
The increase in glutamine observed at PND30 in the SC may suggest increased net synthesis in astrocytes or decreased utilization in neurons. However, both hypotheses seem unlikely in the SC at PND30 given unchanged levels of [1,2- 13 C]acetate-derived [4,5- 13 C]glutamate and [4,5- 13 C]glutamine and increased levels of glutamate and [4- 13 C]glutamate, respectively. Thus, the increase in the pool of unlabeled glutamine is possibly due to increased astrocyte volume. This is also suggested by histopathology data showing increased GFAP immunoreactivity and activated astrocytes with large somata and thick protrusions. Increased glutamine content is also detected in the forebrain at the later stage of the disease (PND40), in agreement with neuropathological data and with the caudal-to-rostral progression of the disease. However, at this age [4,5- 13 C]glutamine is unaltered, whereas [4,5- 13 C]glutamate derived from [4,5- 13 C]glutamine is reduced in neurons, suggesting decreased utilization in neurons and disturbed astrocytic-neuronal interaction in the forebrain. Indications of an emerging breakdown of this interaction in the SC is also suggested by a decrease in enrichment of glutamine with [4,5- 13 C]glutamine, with consequent glutamine turn over and reduced [1- 13 C]glucose-derived label in glutamate and aspartate.
Progressive Neurodegeneration in the Cb and SC of Twi mice Correlates with Metabolic Dysfunction
The occurrence of emerging excitotoxicity and neurodegeneration in the Twi CNS was also suggested by the observed increase in glycine and GSH, which possess counteracting inhibitory and antioxidant capabilities, respectively. Indeed, the expression levels of the putative neurodegeneration marker ATF3 were significantly (5-fold) upregulated already at PND30 in the Cb and SC of Twi mice. ATF3 is an adaptive responsive gene whose levels are upregulated after stressful stimuli, and its expression in neurons is closely correlated to neurodegeneration coupled with a regeneration attempt. 21 In the Twi model, a contribution from activated microglia cells to the total increase of ATF3 expression might also occur, since ATF3 is induced by pro-inflammatory molecules in macrophages and microglia, 36 which are activated during disease progression in GLD mice, as reported here as well as in previous studies.5,20 The occurrence of early neuronal dysfunction in SC neurons of Twi mice was further supported by the increased level of glutamate and increased labeling from [1- 13 C]glucose in glutamate, a clear indication of altered mitochondrial metabolism.
The accumulation of glutamate in neurons might cause excitotoxic cascades as part of the pathogenesis in GLD. This may be secondary to the release of toxic factors from activated astroglia and microglia 2 or, as recently suggested, it may represent a primary dysfunction directly linked to intracellular psychosine accumulation and caspase activation in neurons. 6 Interestingly, extracellular glutamate excess causes caspase-3 activation and oligodendroglial loss in rat spinal cord, 37 similarly to what we observe in Twi mice in this study. Thus, excitotoxicity might represent a common and yet poorly characterized hallmark in leukoencephalopathies. A reduced vulnerability of cerebellar neurons towards glutamate toxicity might underlie the reduced metabolic changes observed in the Cb when compared with the SC. This might be explained by a preferential reuptake of glutamate into the presynapse instead of a reliance on glutamine from astrocytes, 38 possibly due to the high neuron:glia ratio that characterize this brain region. 39
Neuronal damage progressed in the Cb and SC of Twi mice as a function of age. At PND40, we observed further increase of ATF3 levels and moderate but significant upregulation of the sodium calcium exchanger NCX1, in agreement with previous data from the original Twitcher model. 22 Also, amounts of glutamate, aspartate, and their label from [1- 13 C]glucose as well as NAA and NAAG content were reduced at this age, indicating escalating metabolic impairment in both the neuronal and, as already described, in the oligodendroglial compartment. Importantly, the combined neuronal and oligodendroglial dysfunction likely accounts for the glucose hypometabolism observed in this study and previously reported as a hallmark in other leukodystrophies.13,11,12
CONCLUSIONS
Developing treatments for patients with severe and rapidly progressing neurodegenerative disorders requires detailed understanding of early pathogenic events as well as the identification of suitable biomarkers to be used to monitor disease progression. In the present study, we combined immunohistochemical, molecular, and metabolic analyses to have a comprehensive assessment of the glial–neuronal metabolic interactions and dysfunction and to correlate them with the progressive CNS pathology in a murine model of GLD. Despite some discrepancies that likely reflect the different sensitivities and specificities of the methodologies used and the complexity of the disease environment, we were able to highlight a disease-characteristic MRS pattern of metabolic disturbances that largely correlates with the age-and region-dependent extent of neurodegeneration and demyelination, also identifying potential biomarkers for the primary oligodendrocyte dysfunction that occurs in GLD (i.e. NAA and lactate) as well as early indicators of disturbed metabolism in this disease (i.e. myo-inositol and taurine). The effect of novel therapy approaches could potentially be assessed by their ability to postpone these alterations evaluated by noninvasive
DISCLOSURE/CONFLICT OF INTEREST
The authors declare no conflict of interest.
Footnotes
ACKNOWLEDGEMENTS
The authors thank Claudio Maderna for help with tissue processing and immunohistochemistry, Annalisa Lattanzi for help in image acquisition, and Chiara Cavazzin for help in the establishment of primary cultures. Part of the image acquisition was performed in Alembic, the Advanced Light and Electron Microscopy Bio-Imaging Center of San Raffaele Scientific Institute. We also wish to thank the Norwegian Health Association and the Department of Neuroscience DMF/NTNU.
References
Supplementary Material
Please find the following supplemental material available below.
For Open Access articles published under a Creative Commons License, all supplemental material carries the same license as the article it is associated with.
For non-Open Access articles published, all supplemental material carries a non-exclusive license, and permission requests for re-use of supplemental material or any part of supplemental material shall be sent directly to the copyright owner as specified in the copyright notice associated with the article.